
95% of researchers rate our articles as excellent or good
Learn more about the work of our research integrity team to safeguard the quality of each article we publish.
Find out more
METHODS article
Front. Environ. Sci. , 04 January 2023
Sec. Conservation and Restoration Ecology
Volume 10 - 2022 | https://doi.org/10.3389/fenvs.2022.1038635
This article is part of the Research Topic Advances in Marine and Freshwater Monitoring to support Aquatic Ecosystem Conservation and Restoration View all 17 articles
 Cristina Di Muri1,2*
 Christos Arvanitidis3
 Alberto Basset1,2,4
 Raffaele De Giorgi2
 Ilaria Rosati1,5
 Lucia Vaira2
 Giorgio Mancinelli4,6,7*
LifeWatch ERIC, the e-Science European infrastructure for biodiversity and ecosystem research, launched an Internal Joint Initiative on Non-indigenous Species and Invasive Alien Species (NIS-IAS) as they are considered one of the major drivers of biodiversity and ecosystem change. Here, the case study focused on the trophic biogeography of invasive crustaceans is presented, describing the procedures, resources, and analytical web services implemented to investigate the trophic habits of these taxa by using carbon and nitrogen stable isotope data. The case study offers a number of analytical tools to determine the variability of the trophic position of invasive crustaceans in a spatially-explicit context and to model it as a function of relevant environmental predictors. Literature-based stable isotope data of the Atlantic blue crab Callinectes sapidus and of the Louisiana crayfish Procambarus clarkii have been used to evaluate the functionalities and outcomes of the workflow. The Tesseract Virtual Research Environment integrates all the analytical services offered by LifeWatch ERIC, including the ones developed for this case study, by means of a user-friendly interface. The analytical functions implemented for the crustacean workflow provide a proof of concept for future open e-science platforms focusing on NIS-IAS. The workflow conceptual structure can be adapted to a wide range of species, and can be further improved to support researchers in monitoring and predicting trophic-related impacts of NIS-IAS. In addition, it can support policymakers and stakeholders in the implementation of effective management and control measures to limit the negative effects of bioinvaders in recipient environments.
The modern era of globalization is characterized by an intensification of human activities, such as the transport of people and goods and the creation of artificial corridors, facilitating the introduction of species outside their native geographic ranges (Banks et al., 2015). The European Union has recognized that Non-Indigenous Species (NIS hereafter) require immediate consideration and adequate management and control actions, and has addressed this issue in Regulation 1143/2014 (European Commission, 2014) and in the Biodiversity Strategy to 2030 (European Commission, 2020). The former requires member states to provide lists of NIS that could determine significant negative impacts on biodiversity and on related ecosystem services. However, the availability of comprehensive and measurable impact estimates is still limited (see e.g., Katsanevakis et al., 2014; Tsirintanis et al., 2022 for the Mediterranean Sea), partly due to the scarce information on NIS ecology in nature and on the type and strength of the interactions they establish with the native biota (Cardeccia et al., 2018; Katsanevakis and Moustakas, 2018). The need for a thorough assessment of NIS impacts is particularly imperative when they cause adverse ecological and economic effects and reach the “invasive” status (after UNEP, 1992; Invasive Alien Species–IAS: Russell and Blackburn, 2017).
To date, the impacts of IAS have been mostly evaluated by using qualitative evidence-based knowledge of experts rather than quantitative evidence (Corrales et al., 2020; Essl et al., 2020). In addition, it is difficult to infer common patterns from the observed impacts, as this evidence is generally context-dependent and limited in space and time (Courchamp et al., 2017; Torchin et al., 2021; Watkins et al., 2021). A number of recent regional and global scale investigations, focusing on the impact of bioinvaders, have demonstrated that meta-analytical approaches can overcome the paucity and diversity of available information, and can identify and test the primary factors affecting the context-dependency of IAS impacts. Moreover, they have indicated relatively straightforward ecological rules to locally predict the threat of biological invasions on native communities (Thomsen et al., 2014; Gallardo et al., 2016; Mollot et al., 2017; Anton et al., 2019; Bradley et al., 2019). These studies have shown that the impact of invaders on the biodiversity and functioning of recipient ecosystems depend critically on their trophic habits. For example, Thomsen et al. (2014), Mollot et al. (2017), and Anton et al. (2019) indicated that the trophic position of aquatic invaders controls their adverse effects on biodiversity, a result confirmed by a global meta-analysis on community responses to invasion performed by Bradley et al. (2019). Additionally, Gallardo et al. (2016) indicated that introduced predators and omnivores are the trophic groups that exert the most negative effects on the lowest levels of benthic food webs in aquatic ecosystems as also acknowledged by other studies (Vazquez, 2006; Romanuk et al., 2009; Havel et al., 2015; Mancinelli et al., 2017b; Médoc et al., 2018).
Building on this evidence, a validation case focused on the trophic habits of crustacean IAS and their impact on invaded benthic food webs was conceived. The case study has been developed by LifeWatch ERIC (https://www.lifewatch.eu/), the e-Science European infrastructure offering e-science tools and facilities to the scientific community committed to biodiversity and ecosystems research. Nowadays, a large variety of projects/initiatives provides datasets, databases, and data analysis tools to tackle different emerging challenges in the field of biodiversity and ecosystem conservation (Escribano et al., 2018; Stephenson and Stengel, 2020). However, the fragmentation of available data often hinders the capacity to reveal key ecological patterns and hampers analytical efforts aiming at integrating such a heterogeneous body of information (Bingham et al., 2017). To overcome the existing limitations in data accessibility, discoverability, and interoperability, LifeWatch ERIC has devoted its efforts to collate and harmonize biodiversity and ecosystems-related data according to the FAIR principles (Findable, Accessible, Interoperable, Reusable: Wilkinson et al., 2016). Most importantly, LifeWatch ERIC provides a diverse range of data and analytical web services, arranged in purpose-built pipelines of work or workflows, and properly structured in Virtual Research Environments (VREs). The latter are web-based, community-oriented, comprehensive, flexible, and secure working environments, allowing users to perform and complete their analyses in biodiversity and ecosystems research (Basset and Los, 2012; see also Enke et al., 2012; Candela et al., 2013). Given the strict association between biological invasions on one hand and the conservation and management of biodiversity in natural ecosystems on the other, in 2019 the executive board of LifeWatch ERIC launched an Internal Joint Initiative (https://www.lifewatch.eu/internal-joint-initiative/). Through the identification of demonstrative case studies on NIS-IAS, the aim of the initiative was to implement validation cases providing data and e-tools to the scientific community to develop evidence-based knowledge on key ecological topics in different research areas of invasion ecology. They included the prediction of dispersion scenarios of keystone NIS in terrestrial ecosystems, the early-detection and monitoring of NIS spread in aquatic habitats through conventional ecological monitoring procedures and DNA metabarcoding, the EUNIS (European Nature Information System, https://eunis.eea.europa.eu/) habitat and ecosystem vulnerability to NIS invasion, and the evaluation of the spatial variability and predictability of trophic-related ecological impacts of invasive crustaceans.
Here the latter validation case is presented, describing the spatially-explicit trophic variations of two study species, i.e., the Louisiana crayfish Procambarus clarkii and the Atlantic blue crab Callinectes sapidus, two omnivorous invasive species in European freshwaters and coastal waters. The possibility that climatic drivers acting at large spatial scales may influence the trophic behavior of omnivorous species, independently from their native or non-indigenous nature, remains to date unexplored. This occurs notwithstanding the increasing interest in the linkage between species’ trophic-related traits and the ongoing global climate change, since global warming has the potential to determine trophic shifts and variations in the trophic niche of aquatic organisms, ultimately altering the structure and functions of both freshwater and marine food webs (Bartley et al., 2019; Wallingford et al., 2020; Henry and Sorte, 2022).
Specifically, here an effort was made to describe: 1) the procedures used to conceive, design, and define the structure and the tools needed to assess the trophic habits of invasive crustaceans using stable isotope data; 2) the methodological approaches adopted to implement the validation case and the workflow design, and 3) the structure of the datasets on which the analytical workflow relies.
Moreover, two preliminary examples focused on the analysis of stable isotope datasets collated for the validation case and resolved at both population- and individual-scale are provided, illustrating the potential outcomes expected from the advanced implementation of the analytical workflow at the core of the validation case.
The validation case focused on two widely distributed species of invasive omnivorous crustaceans, i.e., the Louisiana crayfish P. clarkii and the Atlantic blue crab C. sapidus (Figure 1).
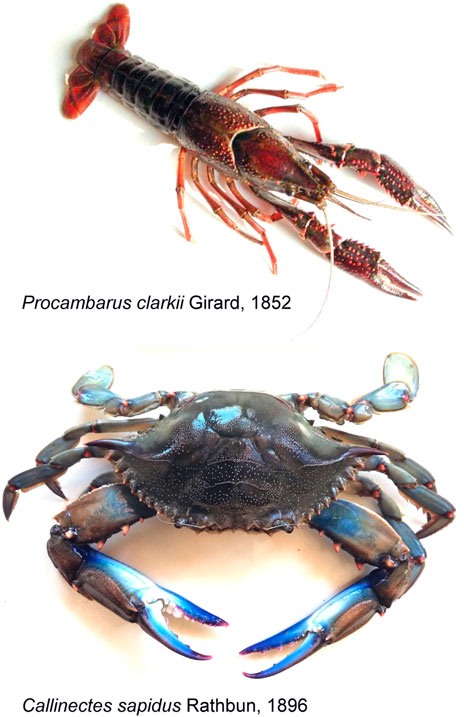
FIGURE 1. Photographs of Procambarus clarkii (upper side) and Callinectes sapidus (lower side), the two model crustaceans used for the validation of the LifeWatch ERIC case study on trophic habits of omnivorous invasive species. Note that the two photos are not in scale.
Procambarus clarkii (Girard, 1852) is native to the southern United States and northern Mexico, but it has been introduced widely in all continents, with the exception of Australia and Antarctica (Loureiro et al., 2015), for economic purposes, i.e., aquaculture and fishing activities (Hobbs et al., 1989; Oficialdegui et al., 2019) and for the biological control of schistosomes and of other snail-transmitted parasites, as occurred in a number of African countries (Hofkin et al., 1991; Sulieman et al., 2013). Procambarus clarkii is included in the European list of IAS of greatest concern (European Commission, 2008). Due to its biological and ecological characteristics (Hänfling et al., 2011), this species causes serious harm to the biodiversity and functions of the invaded environments as well as to ecosystem services and human infrastructures (e.g. irrigation canals and rice crops: Twardochleb et al., 2013; Souty-Grosset et al., 2016).
The origin of the Atlantic blue crab C. sapidus (Rathbun, 1896) is the western Atlantic coast and its native range spans from New England to Uruguay (Millikin and Williams, 1984). This omnivorous crab was introduced in Europe in 1901 and first recorded in the Mediterranean basin in 1947, although it has been suggested that it had arrived a decade earlier (Nehring, 2011). In the last decade, C. sapidus has spread almost ubiquitously in the Black Sea and in the eastern and central Mediterranean Sea, with the western and southern sectors of the basin as fronts of the most recent range expansions (Mancinelli et al., 2021). Since 2006, C. sapidus has been recognized as an invasive species in the Mediterranean Sea (Streftaris and Zenetos, 2006), however, a review published in 2017 (Mancinelli et al., 2017a) and a risk assessment performed in 2021 for the EU (Rabitsch et al., 2022), highlighted the rather scant information on its actual impact on recipient communities. Clavero et al. (2022) provided the first quantitative assessment of the adverse effects exerted by the blue crab on the biodiversity of recipient communities.
Stable isotopic data were collated from the literature to provide extensive, standardized, and spatially-explicit information on the trophic habits of the study species at different spatial scales. Stable isotopes analysis has gained huge popularity for the study of aquatic food webs in the last decades, allowing for robust comparisons of species dietary habits at a local as well as regional and global scale (e.g., Mancinelli, 2012; Annabi et al., 2018; Pethybridge et al., 2018; Mancini et al., 2021; Mancini et al., 2022). This methodology is currently recognized as a key tool to deepen the understanding of ecosystem processes and functioning and to evaluate the response of aquatic ecosystems to anthropogenic impacts, including global climate change (Mancinelli and Vizzini, 2015; Gautam and Lee, 2016).
An extensive literature search was performed to collate geo-referenced stable isotope data resolved at individual- and population-scale. Extensive details on the adopted procedures are provided in Di Muri et al. (2022a); Di Muri et al. (2022b). In brief, the online databases ISI Web of Science and Scopus were searched by using a multiple search criterion and the term “Procambarus clarkii” or “Callinectes sapidus” in conjunction with “stable isotopes”. The results were complemented with those obtained from queries on Google Scholar (https://scholar.google.com/) using identical keywords. The entries obtained from the literature search had their titles and abstracts screened in order to remove manipulative studies and reviews. The full text of the remaining studies was examined in detail to select those where the occurrence of the two species was reported explicitly, together with information on the country, latitude and longitude, the year of the record, and at least the δ15N value of the sampled specimens. Publications where the sampling locations were reported in maps were also included in the selection and Google Earth was used to extract the geographic coordinates. In addition, the literature sources to be eligible had to include isotopic information on potential vegetal or animal prey. The publications meeting the aforementioned criteria were eventually selected and δ15N and δ13C values were extracted from tables and figures. Figures were digitized after a fivefold enlargement and converted to numerical form using the graph capture freeware WebPlotDigitizer (ver. 4.5; https://automeris.io/WebPlotDigitizer/). In the dataset resolved at individual scale, δ 15N and δ 13C values refer to single specimens, whereas in the population-scale dataset, mean values of carbon and nitrogen stable isotopes were extracted from the literature along with their standard deviations and sample sizes if available. Lastly, the authors of the selected publications were contacted directly to obtain additional unpublished information and raw data, hence, the collated datasets include published data from peer-reviewed articles and grey literature as well as data gathered from unpublished sources, ultimately offering visibility to previously unavailable information.
The datasets are conceived and designed to be analyzed by means of a number of sequential analytical web services included in a workflow. The structure of the workflow is presented as a diagram in Figure 2 and was developed using the LifeWatch ERIC guidelines as a general reference and through a collaborative approach between scientists and ICT experts. The overall goal of the workflow is to analyze the trophic geography of the two crustacean species under analysis, assuming their trophic position as an indirect indicator of their ecological impact on recipient aquatic food webs. This is performed by first running a spatially-explicit quantitative assessment of the trophic position of the two species and then by finding potential correlations between the invaders’ trophic position and climatic drivers that are expected to change in the future (e.g., water temperature or salinity for marine ecosystems and air temperature for terrestrial ecosystems).
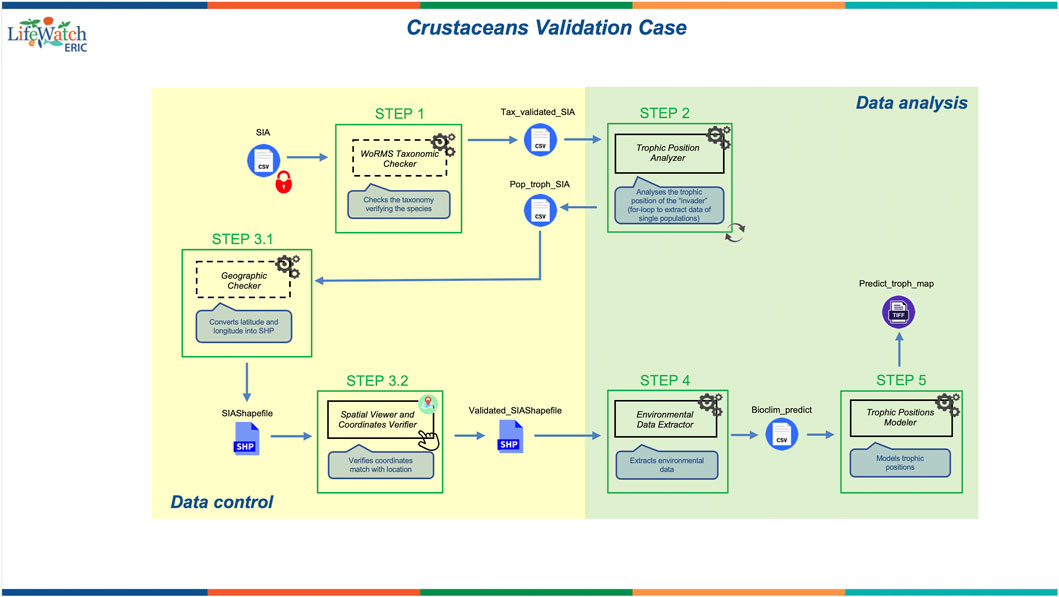
FIGURE 2. Crustacean Validation Case diagram. The diagram shows the analytical workflow and its components including services (steps in green boxes) and input/output datasets produced. A detailed guide to the symbols included in the diagram is provided in the Supplementary Material “Workflow Standard–Guidelines”.
Specifically, the workflow was designed to include three functional analytical services for calculating the impact of the invaders (data analysis, in green in Figure 2) and three additional services to check the quality of the data entered by the users (data control, in yellow in Figure 2) and allowing for automatic corrections and adjustments if required.
The key data analysis steps and services included therein consist of: 1) the calculation of the trophic position of the invasive species through a Bayesian approach (Trophic Position Analyzer); 2) the extraction of environmental predictors from cloud-based repositories (Environmental Data Extractor); this service fetches and downloads from available repositories oceanographic and bioclimatic raster layers for the geographic coordinates included in the input dataset; and 3) the modelling of the invaders’ trophic position as a function of the environmental variables using a Generalized Additive Model (Trophic Positions Modeler). The data control steps allow the user to: 1) check the scientific names of the species included in the input dataset (WoRMS Taxonomic Checker); 2) create a shapefile using the geographic coordinates included in the input dataset (Geographic Checker); and 3) verify the accuracy of the geographic coordinates (Spatial Viewer and Coordinates Verifier) by matching the latitude and the longitude with the corresponding locations and countries included in the input dataset, and by using the shapefile created within the previous service (i.e., Geographic Checker).
The resources created for the workflow (i.e., workflow, services, and datasets) are described using the LifeWatch ERIC application profiles and are published on the LifeWatch ERIC Metadata Catalogue (https://metadatacatalogue.lifewatch.eu). The metadata records of the workflow and services are documented with the ISO19139 standard and include respectively 24 and 34 metadata attributes (Figure 3). Dataset metadata records are documented with EML2.2.0 standard and the metadata schema includes 77 attributes (Figure 3). A complete description of the LifeWatch ERIC Application profiles is available in Vaira et al. (2022).
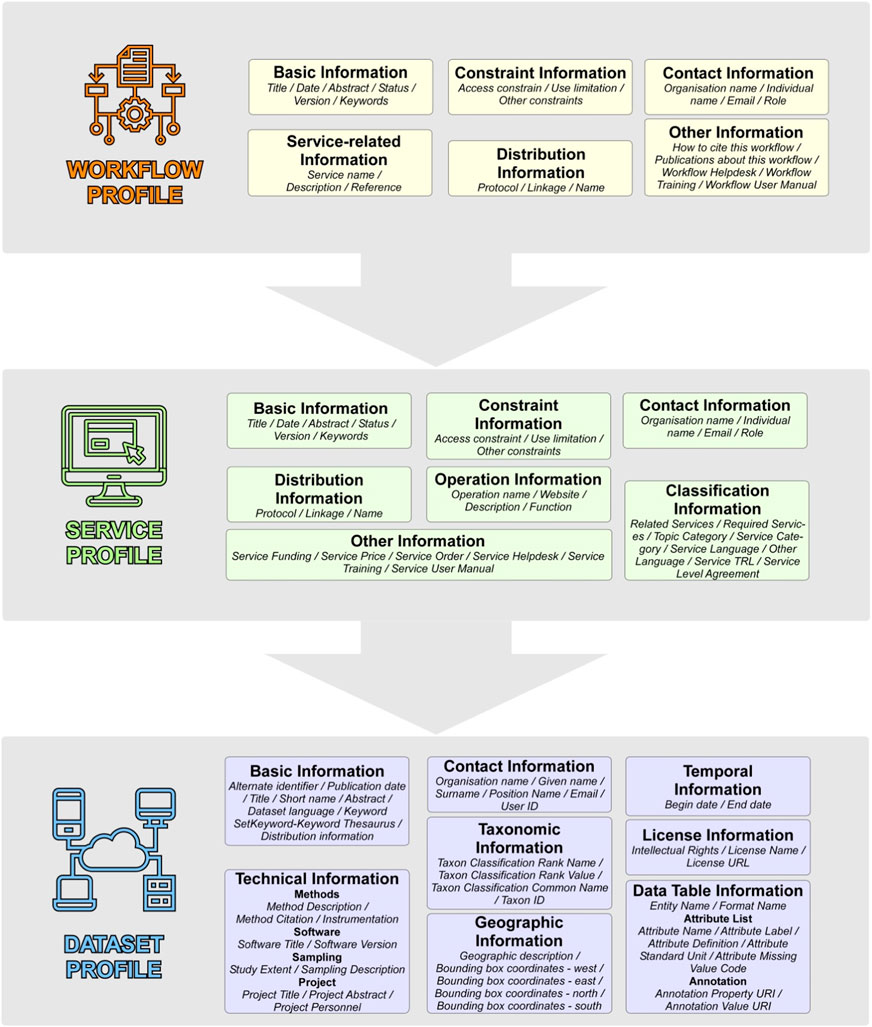
FIGURE 3. LifeWatch ERIC metadata profile for workflows (yellow), services (green), and datasets (blue). The asterisks (*) indicate the mandatory attributes. A complete description of the LifeWatch ERIC Application profiles is available in Vaira et al. (2022).
Links to metadata resources within the LifeWatch ERIC Metadata Catalogue and used for this case study are provided in the Supplementary Material.
The analyses are implemented within the workflow through the R statistical environment (R Development Core Team, 2022). Specifically, the trophic position of the invasive species (Trophic Position Analyzer, Figure 2) is calculated using the tRophicPosition package (version 0.7.7; Quezada-Romegialli et al., 2018; Quezada-Romegialli et al., 2019). Trophic position estimations are conventionally performed using:
This equation is a generalization of that presented in Vander Zanden et al. (1997), where δ15NConsumer is the nitrogen isotopic signature of the invasive species under investigation (i.e., P. clarkii or C. sapidus), Δ15N is the trophic discrimination factor of δ15N (TDF hereafter), and δ15NBaseline and λ are, respectively, the nitrogen isotopic signature and the trophic level of the baseline species.
In the tRophicPosition package, the trophic position is estimated using a Bayesian approach whereby nitrogen values of consumers and baselines as well as the TDF are modelled as random variables, each having a prior normal distribution on their means and a uniform prior distribution on their standard deviations, and the trophic position is treated as a random parameter. The trophic position is also modelled as having a uniform prior distribution whereas λ is fixed. Given the omnivorous trophic habits of the species considered in this case study, the values of the trophic positions are estimated adopting a TDF of 0.27 ± 2.15 for carbon and a TDF of 2.58 ± 1.96 for nitrogen (mean ± 1SD, n = 49 and 91, respectively), calculated as the average of published enrichment factors for aquatic crustaceans (including C. sapidus and the crayfish Orconectes viridis and Cherax destructor) feeding on both vegetal and animal items (De Giorgi et al., 2022), and more consistent with other literature syntheses focused on crustaceans (Vanderklift and Ponsard, 2003; Carrozzo et al., 2014). The complete list of species selected as baselines and their assigned trophic levels can be found in Mancinelli and Di Muri. (2022a); Mancinelli and Di Muri. (2022b).
The Environmental Data Extractor service (Figure 2) performs the selection of a suite of oceanographic and climatic data from Bio-Oracle v2.0 (Tyberghein et al., 2012; Assis et al., 2018 for C. sapidus) and from WorldClim 2 (Fick and Hijmans, 2017 for P. clarkii). Bio-Oracle is a high-resolution GIS database of oceanic climate layers obtained from remotely sensed and in situ oceanographic observations with a common spatial resolution of five arcmin. The database additionally includes future projections produced for 2040–2050 and for 2090–2100 by averaging data from distinct Atmosphere/Ocean Global Climate Models (AOGCMs). WorldClim is a dataset with a global coverage including satellite-based climatic layers that have been built for the period 1970–2000 with a 30 arc-seconds spatial resolution and including downscaled future climate projections. The bioclimatic variables from these repositories are retrieved in R using the package sdmpredictors (v. 0.2.12; Bosch et al., 2022).
In the Trophic Position Modeler service (Figure 2), a generalized additive mixed model (GAMM; Wood, 2017) is used to examine relationships between the values of the trophic position and the suite of selected environmental predictors. GAMMs are built in R using the gamm4 package (Wood and Scheipl, 2020) with a Gaussian error distribution and an identity link function; smoothing splines are used to examine non-linear fits for all marginal terms considered in the model. Exclusive economic zones and countries are incorporated as random effects to account for intra-group correlations and over-dispersion frequently arising in spatial analyses (Wood, 2017), whereas a scale-invariant tensor product is used to model the covariates for the geographical locations. Model selection is then performed manually using a backward elimination approach (starting with all candidate variables), and the best model fit is selected using the Akaike Information Criterion for small sample sizes (AICc).
Here, for illustrative purposes, the analyses presented focus on the population-scale dataset of P. clarkii (Mancinelli and Di Muri, 2022b) and on the individual-scale dataset of C. sapidus (Mancinelli and Di Muri, 2022a) using temperature-related continuous predictors for present conditions. The geo-referenced trophic position values were estimated according to Vander Zanden et al. (1997) and temperature-related oceanographic and climatic high-resolution layers were selected from MERRAclim (Carrete Vega et al., 2017 for P. clarkii) and MARSPEC (Sbrocco and Barber, 2013 for C. sapidus) (Table 1). Sea surface temperatures were used for C. sapidus, whereas air temperatures were used as a proxy of inland water temperatures for P. clarkii due to the unavailability of detailed raster layers for surface water temperatures in freshwater habitats (Piccolroaz et al., 2018; Table. 1). Subsequently, a simplified procedure based on a multiple correlation approach was performed with the aim of identifying the most adequate temperature-related variables to predict the variation in the trophic positions observed within the two datasets. Climatic variables and trophic position values were log-transformed and mean-centered for the analysis. The identification of the Minimum Adequate Model (MAM hereafter; Whittingham et al., 2006) was based on the heuristic generation of alternative regression models. Model selection was performed by adopting an information theoretic criterion (Burnham and Anderson, 2002; Hegyi and Garamszegi, 2011) based on the estimation of the Bayesian Information Criterion (BIC; Schwarz, 1978) calculated for each combination of n explanatory variables. For model comparisons, approximate Bayes factors B1,2 were calculated as:
where B1,2 = BIC(k1)−BIC(k2), and BIC(kn) are the BIC values of models k1 and k2. If B1,2 > 1, then model k1 is the model selected by the procedure (Neath and Cavanaugh, 2012) and identified as the best MAM. Model building and statistical analyses were performed following Fox and Weisberg. (2011).
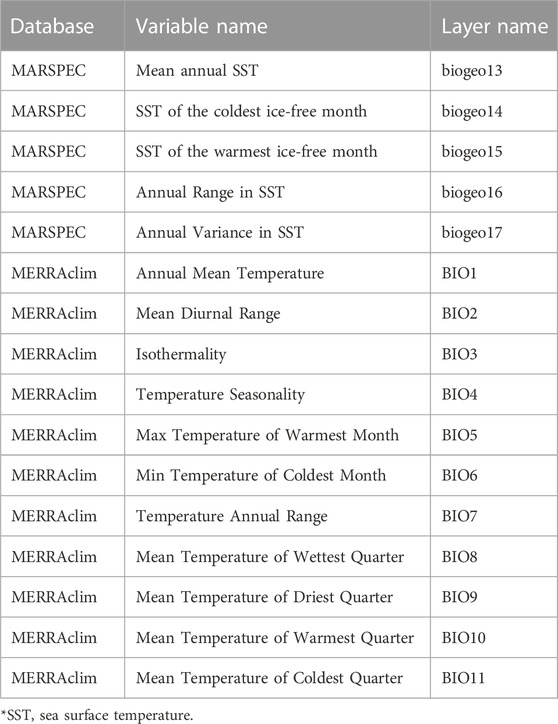
TABLE 1. List of climatic variables and related databases and layer names used for the multiple correlation analysis.
Further analyses, not included in the current version of the workflow, were performed to provide an example of metrics that could be inferred by using stable isotope data, as well as to present the possible future implementations of the workflow. Using the individual-resolved data of C. sapidus six quantitative population metrics, originally described by Layman et al. (2007), were estimated for each location including the mean distance to centroid (CD) as a measure of population trophic diversity, nitrogen range (NR) and carbon range (CR) as indicators of the total nitrogen and carbon range exploited by each population, the standard deviation of nearest neighbor distance (SDNND) as an index of population trophic evenness, the total area (TA) as a measure of each population niche area estimated using a convex hull drawn around the most extreme data points on an isotope bi-plot. As TA is expected to increase with sample size (Jackson et al., 2011), additional estimations of niche areas were performed using the corrected standard ellipse area (SEAc) as a measure of each population niche area estimated using a standard ellipse calculated from the variance and covariance of δ13C and δ15N values and corrected for small sample sizes. All metrics were calculated using the package SIBER (Jackson and Parnell, 2021) in the R statistical computing environment (R Development Core Team, 2022).
Two datasets for P. clarkii and one dataset for C. sapidus were collated and included carbon and nitrogen isotopic values of the species and of their potential prey, and used as baselines for the analyses, within invaded habitats Mancinelli and Di Muri. (2022a); Mancinelli and Di Muri. (2022b). An additional dataset with stable isotope values of C. sapidus collected within the native area is currently under completion.
The literature search on P. clarkii identified 41 studies, performed between 2005 and 2021 within the global invaded range of the species, including geo-referenced stable isotope information. A population-scale dataset with mean and standard deviation values of 160 carbon and nitrogen isotopic records for P. clarkii and its potential prey was collated. In addition, a dataset resolved at the individual scale and consisting of 1,168 isotopic records was produced. The isotopic values included within the two datasets were gathered from 39 locations and 10 countries across Europe, Asia, Africa, and North America and, therefore, including all continents where P. clarkii has been found (Figure 4A).
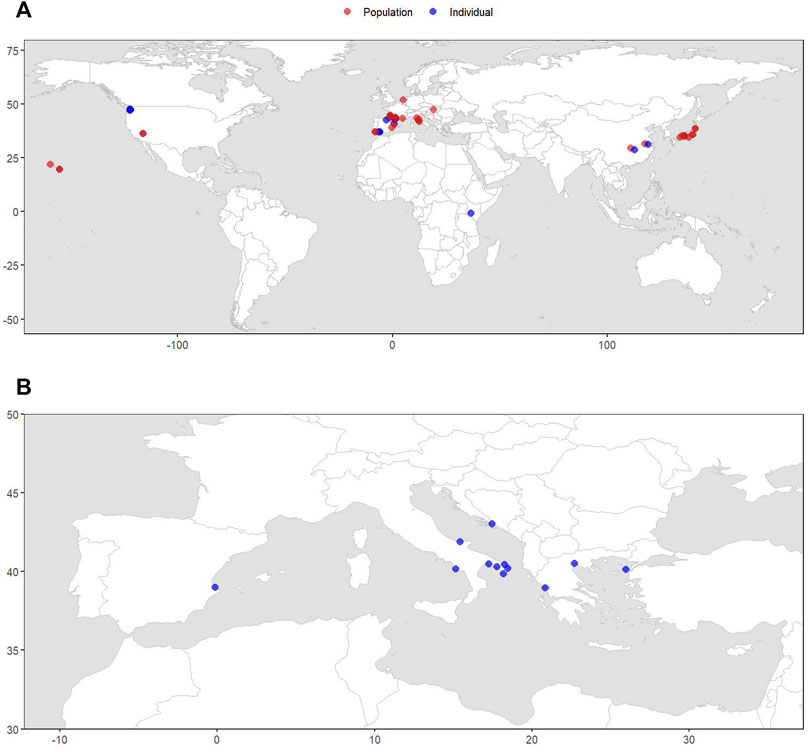
FIGURE 4. Maps of the locations included in the datasets of stable isotope data for Procambarus clarkii (A) and Callinectes sapidus (B). The isotopic records shown in red are resolved at population-scale and the ones in blue are resolved at individual-scale.
The average trophic position of P. clarkii calculated from the population-scale isotopic dataset was 2.7 ± 0.07 (mean ± SE); estimations varied considerably among locations and ranged between values close to 2, indicating fully herbivorous trophic habits, and values >4, suggesting a carnivorous diet including other predatory species (Figure 5).
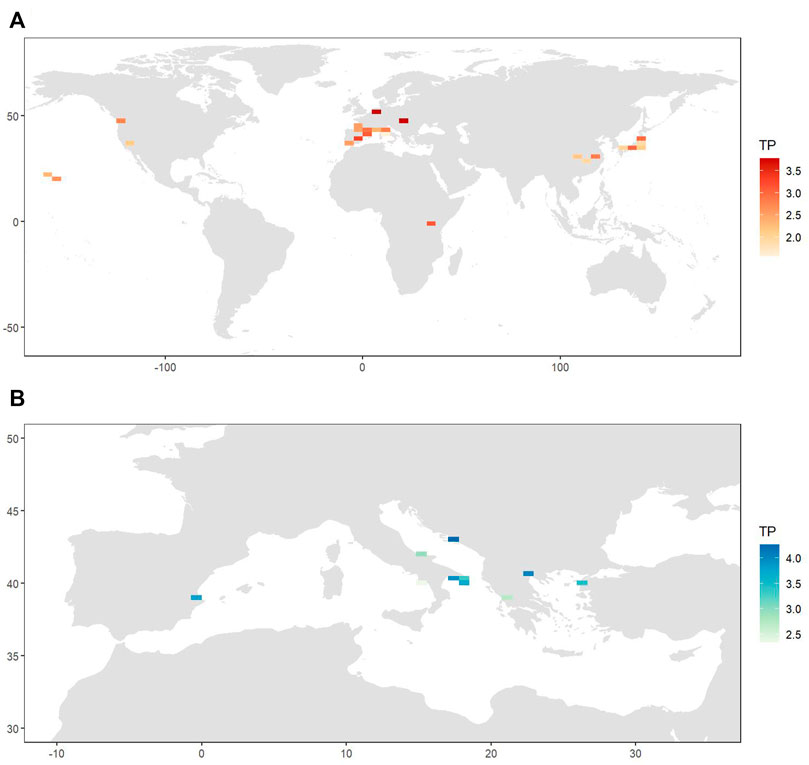
FIGURE 5. Heatmaps showing the values of the trophic position for Procambarus clarkii (A) and Callinectes sapidus (B) calculated respectively using the population-scale and the individual-scale dataset. Trophic position values were mediated for locations occurring within the same tile of the heatmap.
The multiple regression and the subsequent heuristic search for the MAM performed using the trophic positions of P. clarkii as the response variable and the 11 temperature-related MERRAclim variables as predictors, indicated that the best MAM was a single-variable model including the mean temperature of the wettest quarter as the only significant predictor (Table 2: BIC; Figure 6) and a significant negative relationship was observed (Pearson correlation: r = -0.35; p = 0.002; Figure 6). Noticeably, a significant inverse correlation was observed also with the mean annual temperature (Pearson correlation: r = -0.24, p = 0.03).
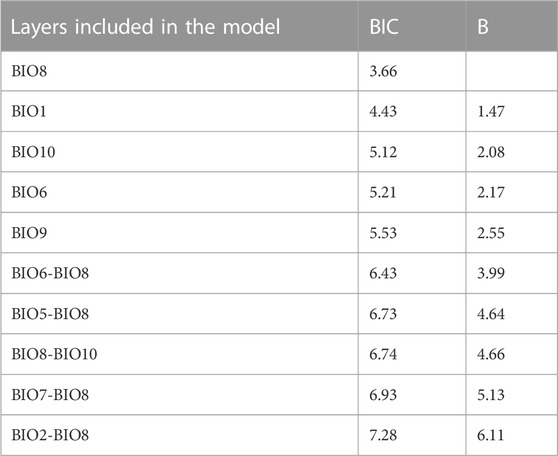
TABLE 2. Bayesian Information Criterion (BIC) values and Bayes factors (B) estimated by the heuristic procedure implemented for Minimum Adequate Model (MAM) selection for Procambarus clarkii. Only the 10 models showing the lowest BIC values are reported. See Table 1 for layer acronyms.
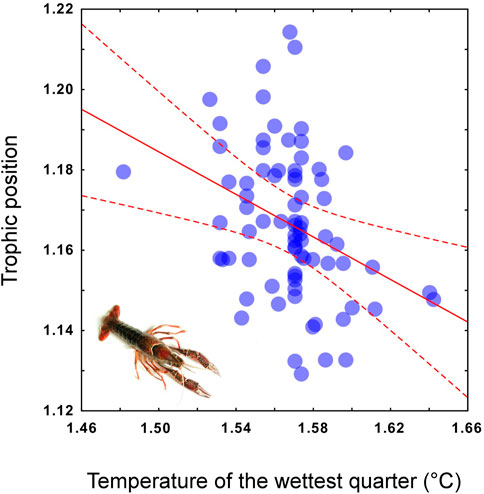
FIGURE 6. Trophic position of Procambarus clarkii calculated from the population-scale dataset as predicted by local mean temperature of the wettest quarter values. For the regression curve (solid line) 95% confidence intervals are included (dashed line). Log-transformed and mean-centered data are used in the scatterplot.
For C. sapidus, an individual-scale dataset was collated including 360 isotopic records gathered from 12 Mediterranean locations where C. sapidus has been introduced and is currently considered invasive.
The mean trophic position of C. sapidus was 3.5 ± 0.2 (mean ± SE), with values showing a two-fold variation between 2.3 and 4.5 (Table 3; Figure 5). The multiple regression and MAM identification procedure performed to find relations between the trophic positions of C. sapidus and five MARSPEC temperature-related variables indicated that the best predictive MAM was provided by the mean annual sea surface temperature (Table 4; Figure 7). Specifically, a significant negative relationship was observed (Figure 7; Pearson correlation: r = -0.59, p = 0.04), indicating that the highest trophic positions were related with the lowest sea surface temperatures. The isotopic niche metrics estimated for the 12 populations of C. sapidus included in the individual-scale dataset are reported in Table 3. None of them was correlated with sample size or trophic position estimations (Table 5); furthermore, total area (TA), and corrected standard ellipse area (SEAc) estimations resulted highly correlated with each other and with mean distance to centroid (CD), nitrogen range (NR), and carbon range (CR) values. No significant bivariate relationships were observed between isotopic niche metrics and temperature-related MARSPEC predictors (Table 6), even though total area (TA) and corrected standard ellipse area (SEAc) values showed a positive relationship with the sea surface temperature of the warmest ice-free month (p < 0.09; Table 5).
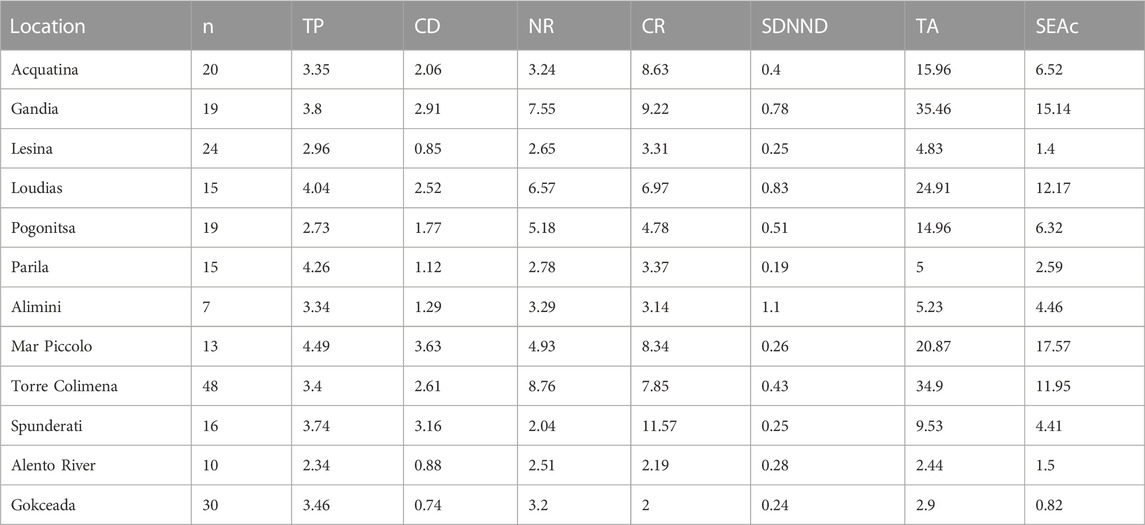
TABLE 3. Sample number (n), trophic position (TP), mean distance to centroid (CD), nitrogen range (NR), carbon range (CR), standard deviation of nearest neighbor distance (SDNND), total area (TA), and corrected standard ellipse area (SEAc) of the 12 Callinectes sapidus populations included in the individual-scale dataset.
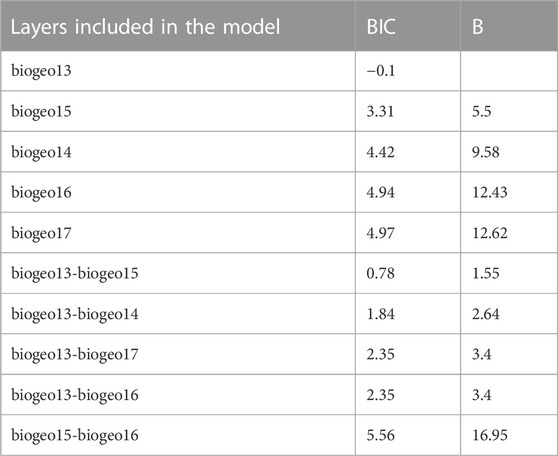
TABLE 4. Bayesian Information Criterion (BIC) values and Bayes factors (B) estimated by the heuristic procedure implemented for Minimum Adequate Model (MAM) selection for Callinectes sapidus. Only the 10 models showing the lowest BIC values are reported. See Table 1 for layer acronyms.
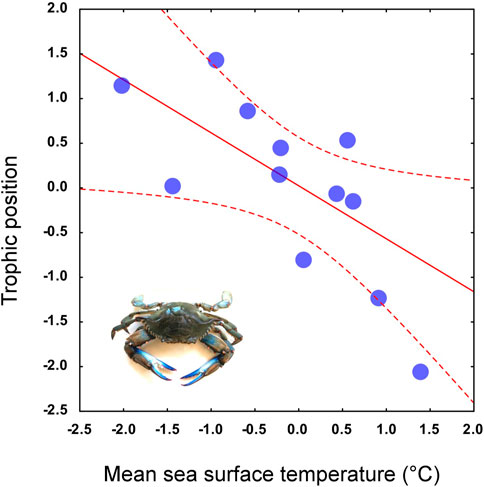
FIGURE 7. Trophic position of Callinectes sapidus calculated from the individual-scale dataset as predicted by local annual mean sea surface temperature. For the regression curve (solid line) 95% confidence intervals are included (dashed line). Log-transformed and mean-centered data are used in the scatterplot.
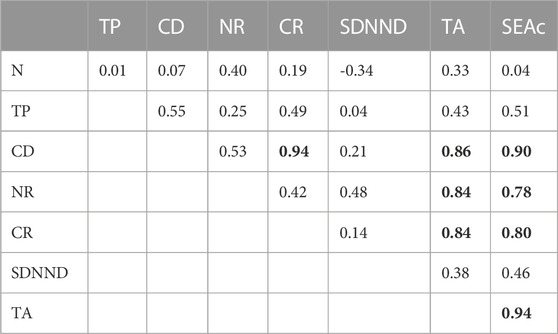
TABLE 5. Correlation matrix (Pearson r coefficient) among sample number (n), trophic position (TP), mean distance to centroid (CD), nitrogen range (NR), carbon range (CR), standard deviation of nearest neighbor distance (SDNND), total area (TA), and corrected standard ellipse area (SEAc) of the 12 Callinectes sapidus populations included in the individual-scale dataset. All metrics log-transformed and mean-centered before analysis. Significant correlations with p < 0.05 are highlighted in bold.

TABLE 6. Correlation matrix (Pearson r coefficient) between MARSPEC temperature-related predictors (see Table 1 for acronyms) and sample number (n), mean distance to centroid (CD), nitrogen range (NR), carbon range (CR), standard deviation of nearest neighbor distance (SDNND), total area (TA), and corrected standard ellipse area (SEAc) of the 12 Callinectes sapidus populations included in the individual-scale dataset. All metrics log-transformed and mean-centered before analysis.
This paper described the procedures employed to collect data and design the workflow at the basis of the validation case focused on the two invasive crustaceans, i.e., C. sapidus and P. clarkii, and developed within the LifeWatch ERIC Internal Joint Initiative on non-indigenous and invasive species. The functionalities of the workflow have been illustrated by carrying out a preliminary analysis of the data performed both at population- and individual-scale. Independently from the resolution of the datasets, the results revealed the existence of significant relationships between temperature-related variables and the trophic positions of the two invasive crustaceans.
Ultimately, the outcomes showed the ability of the workflow to identify environmental-driven trophic patterns at different spatio-temporal scales by using stable isotope analysis.
The availability of stable isotope information is crucial to investigate drivers of changes in the trophic structure within different ecosystems; however, such studies are often hampered by the availability of stable isotope data. For example, within this case study, an extensive and labour-intensive literature search was performed to gather stable isotope information across a variety of sources. Isotopic data collected by researchers worldwide are currently spread over a variety of sources, including peer-reviewed articles, gray literature, datasets stored in different repositories, or other resources which are not accessible to users (Woo and Scheipl, 2020). The lack of a unique and standardized data repository for stable isotopes hinders the possibility of casting these data into wide, continental or global, spatial contexts and of using them beyond the scope for which they were originally generated (Pauli et al., 2017). Therefore, potential drivers of trophic variations acting at large geographical scales may remain undetected and the possibility of estimating the role of global environmental pressures, such as climate warming, in species trophic habits may be overlooked. It follows that this precious body of information deserves to be properly standardized, managed and disseminated, and made available in the long-term in a stable, reliable, and organized repository. Scientists have long acknowledged the need to build centralized databases for stable isotope data obtained from ecological studies in order to facilitate the integration and re-usability of such data across multiple scientific disciplines (Pauli et al., 2017; Eftimov et al., 2019; Woo et al., 2021). Such a centralized repository of stable isotope data would prevent the time-consuming efforts of data collection from different sources. In addition, it would facilitate data integration, standardization, harmonization, and ensure data interoperability by making each dataset accessible in a both human and machine-readable format through the use of controlled metadata and defined ontologies (Eftimov et al., 2019). In this context, the LifeWatch e-Infrastructure with its distributed nodes and facilities offers suitable features to guarantee the long-term storage of data, metadata, and semantic resources, such as those of the LifeWatch Italy Data Portal (https://dataportal.lifewatchitaly.eu), the LifeWatch ERIC Metadata Catalogue (https://metadatacatalogue.lifewatch.eu), and EcoPortal (http://ecoportal.lifewatch.eu/). The e-Infrastructure provides stable and reliable web-based solutions to share data and analytical tools and to make them findable, accessible, interoperable, and reusable according to the FAIR principles (Wilkinson et al., 2016), and it would, therefore, represent an ideal repository of stable isotope data for both ecological and environmental studies.
The validation of our analytical workflow on the population-scale dataset for P. clarkii and on the individual-scale dataset for C. sapidus indicated that the collection of geo-referenced stable isotope information on invasive species and on their potential prey can be used to explore ecologically-meaningful relationships between environmental variables and the trophic positions of the invaders and, ultimately, develop scenarios for future trends. The preliminary analytical outcomes presented here are supported by other studies where such associations were also observed. For example, the use of a global meta-analysis of stable isotope data demonstrated that changes in the trophic positions of three tuna species were associated with latitudinal and oxygen gradients (Pethybridge et al., 2018). Using a similar analytical approach, this study revealed that temperature-related variables may be associated with the variations in the trophic positions of P. clarkii and C. sapidus within invaded aquatic food webs (Figures 6,7). It follows that, independently from ecological constraints related to the structure of the recipient communities in terms of e.g., resource availability, species composition, or local environmental conditions, the trophic role played by an invader within a food web is related with large-scale environmental drivers ultimately influenced by climate change. Specifically, the results of this study indicated that at relatively high temperatures omnivorous invaders occupy higher trophic levels in food webs, whereas at lower temperatures they may shift to lower positions within the trophic network. To provide an in-depth analysis of the factors involved in the observed relationships goes beyond the scope of the present study; however, as it is acknowledged that the whole-body metabolic costs increase with higher external temperatures (Brown et al., 2004; Arim et al., 2007; Bonnaffé et al., 2021), the observed shifts in the trophic positions of P. clarkii and C. sapidus may be explained by changes in the metabolic responses of the species as a result of their trophic plasticity. How and to what extent the observed trophic shifts affect the ecological impact of omnivorous invasive species on recipient communities is an open question which requires additional investigation. Yet it is likely the variation from omnivorous to primarily carnivorous trophic habits may increase their overall impact as previously suggested (Thomsen et al., 2014; Gallardo et al., 2016; Mollot et al., 2017; Anton et al., 2019; Bradley et al., 2019). The observed relationships between external temperature and trophic position additionally indicate that future changes in the climatic conditions experienced by the two species may affect their trophic positions and, in turn, their impact in invaded food webs. To date, while a considerable effort has been made to evaluate the effects of climate warming on the frequency of introduction and invasiveness of NIS-IAS (Bellard et al., 2018; Ricciardi et al., 2021), less consideration has been given to the study of climatic variations and on their influence on the impact of established invaders. This study clearly shows that aquatic predators and their functional role in food webs may be particularly vulnerable to climate change and that global warming may play a major role in determining future functional characteristics of the species, and, in the case of bioinvaders, their trophic impact on recipient communities and ecosystems.
To provide higher flexibility to the end-users and to expand the current scope of the workflow it would be essential to widen its analytical features by, for instance, adding trophic niche metrics calculation and accounting for all possible combinations of climatic variables that could shape the trophic habits of invasive species. The future implementations will allow for the testing of bioclimatic predictors of trophic positions of different species, native and non-indigenous, in potentially all types of environments, including aquatic and terrestrial. The possibility of querying and extracting environmental variables of all kinds from different repositories, online platforms, and databases, beyond the ones used within the case study, will allow for greater customization by end-users and make the potentiality of this workflow unlimited.
In conclusion, the present work clearly demonstrated how collaboration between scientific and ICT communities for the development of cutting-edge e-tools could greatly facilitate scientists in finding evidence on rapid responses of biodiversity and ecosystems to the most critical issues for conservation and inform environmental managers to take prompt action. The LifeWatch ERIC Internal Joint Initiative on invasive species and the specific case study described herein focuses on evaluating and predicting the trophic geography and, indirectly, trophic-related impacts of large invasive omnivorous crustaceans in invaded food webs. Such types of workflows could be implemented and deployed to address a variety of key questions in ecology including biodiversity and ecosystem responses to climate change or to other anthropogenic pressures acting at global scales.
The datasets generated and analyzed for this study can be found in the LifeWatch Italy Data Portal (https://dataportal.lifewatchitaly.eu/view/urn%3Auuid%3Ae869c2cc-2011-461d-99cc-8d6d642b1624; https://dataportal.lifewatchitaly.eu/view/urn%3Auuid%3A18a8256c-0e31-4800-af5b-958ea88faf34).
MG conceived and designed the case study and workflow. DMC and MG performed data collection, dataset creation and standardization, data analysis, and writing including the original draft of the manuscript, the final review, and editing. RI and VL contributed to the datasets formatting and quality check, to the workflow development, and to the manuscript final review and editing. AC and BA reviewed the manuscript. DGR contributed to the final editing and revision.
LifeWatch ERIC Internal Joint Initiative.
The Authors thank González-Aranda Juan Miguel, Huguet-Vives Antoni, Minadakis Nikos, and Sáenz-Albanés Antonio José from the LifeWatch ERIC ICT Core for the technical support in the development of the crustaceans workflow.
The authors declare that the research was conducted in the absence of any commercial or financial relationships that could be construed as a potential conflict of interest.
All claims expressed in this article are solely those of the authors and do not necessarily represent those of their affiliated organizations, or those of the publisher, the editors and the reviewers. Any product that may be evaluated in this article, or claim that may be made by its manufacturer, is not guaranteed or endorsed by the publisher.
The Supplementary Material for this article can be found online at: https://www.frontiersin.org/articles/10.3389/fenvs.2022.1038635/full#supplementary-material
Annabi, A., Bardelli, R., Vizzini, S., and Mancinelli, G. (2018). Baseline assessment of heavy metals content and trophic position of the invasive blue swimming crab Portunus segnis (Forskål, 1775) in the Gulf of Gabès (Tunisia). Mar. Pollut. Bull. 136, 454–463. doi:10.1016/j.marpolbul.2018.09.037
Anton, A., Geraldi, N. R., Lovelock, C. E., Apostolaki, E. T., Bennett, S., Cebrian, J., et al. (2019). Global ecological impacts of marine exotic species. Nat. Ecol. Evol. 3 (5), 787–800. doi:10.1038/s41559-019-0851-0
Arim, M., Bozinovic, F., and Marquet, P. A. (2007). On the relationship between trophic position, body mass and temperature: Reformulating the energy limitation hypothesis. Oikos 116 (9), 1524–1530. doi:10.1111/j.0030-1299.2007.15768.x
Assis, J., Tyberghein, L., Bosch, S., Verbruggen, H., Serrão, E. A., De Clerck, O., et al. (2018). Bio-ORACLE v2.0: Extending marine data layers for bioclimatic modelling. Glob. Ecol. Biogeogr. 27 (3), 277–284. doi:10.1111/geb.12693
Banks, N. C., Paini, D. R., Bayliss, K. L., and Hodda, M. (2015). The role of global trade and transport network topology in the human-mediated dispersal of alien species. Ecol. Lett. 18 (2), 188–199. doi:10.1111/ele.12397
Bartley, T. J., Mccann, K. S., Bieg, C., Cazelles, K., Granados, M., Guzzo, M. M., et al. (2019). Food web rewiring in a changing world. Nat. Ecol. Evol. 3 (3), 345–354. doi:10.1038/s41559-018-0772-3
Basset, A., and Los, W. (2012). Biodiversity e-science: LifeWatch, the European infrastructure on biodiversity and ecosystem research. Plant Biosyst. Int. J. Deal. all Aspects Plant Biol. 146 (4), 780–782. doi:10.1080/11263504.2012.740091
Bellard, C., Jeschke, J. M., Leroy, B., and Mace, G. M. (2018). Insights from modeling studies on how climate change affects invasive alien species geography. Ecol. Evol. 8 (11), 5688–5700. doi:10.1002/ece3.4098
Bingham, H. C., Doudin, M., Weatherdon, L. V., Despot-Belmonte, K., Wetzel, F. T., Groom, Q., et al. (2017). The biodiversity informatics landscape: Elements, connections and opportunities. Res. Ideas Outcomes 3, e14059. doi:10.3897/rio.3.e14059
Bonnaffé, W., Danet, A., Legendre, S., and Edeline, E. (2021). Comparison of size-structured and species-level trophic networks reveals antagonistic effects of temperature on vertical trophic diversity at the population and species level. Oikos 130 (8), 1297–1309. doi:10.1111/oik.08173
Bosch, S., Tyberghein, L., De Clerck, O., Fernandez, S., and Schepers, L. (2022). sdmpredictors: Species distribution modelling predictor datasets. Avaliable at: http://cran.r-project.org/web/packages/sdmpredictors.
Bradley, B. A., Laginhas, B. B., Whitlock, R., Allen, J. M., Bates, A. E., Bernatchez, G., et al. (2019). Disentangling the abundance–impact relationship for invasive species. Proc. Natl. Acad. Sci. U. S. A. 116 (20), 9919–9924. doi:10.1073/pnas.1818081116
Brown, J. H., Gillooly, J. F., Allen, A. P., Savage, V. M., and West, G. B. (2004). Toward a metabolic theory of ecology. Ecology 85 (7), 1771–1789. doi:10.1890/03-9000
Burnham, K. P., and Anderson, D. R. (2002). Model selection and multi-model inference: A practical information-theoretic approach. New York, NY: Springer.
Candela, L., Castelli, D., and Pagano, P. (2013). Virtual research environments: An overview and a research agenda. Data Sci. J. 12, GRDI75–GRDI81. doi:10.2481/dsj.grdi-013
Cardeccia, A., Marchini, A., Occhipinti-Ambrogi, A., Galil, B., Gollasch, S., Minchin, D., et al. (2018). Assessing biological invasions in European seas: Biological traits of the most widespread non-indigenous species. Estuar. Coast. Shelf Sci. 201, 17–28. doi:10.1016/j.ecss.2016.02.014
Carrete Vega, G., Pertierra, L. R., and Olalla-Tárraga, M. Á. (2017). MERRAclim, a high-resolution global dataset of remotely sensed bioclimatic variables for ecological modelling. Sci. Data 4 (1), 170078. doi:10.1038/sdata.2017.78
Carrozzo, L., Potenza, L., Carlino, P., Costantini, M. L., Rossi, L., and Mancinelli, G. (2014). Seasonal abundance and trophic position of the Atlantic blue crab Callinectes sapidus Rathbun 1896 in a Mediterranean coastal habitat. Rend. Fis. Acc. Lincei 25 (2), 201–208. doi:10.1007/s12210-014-0297-x
Clavero, M., Franch, N., Bernardo-Madrid, R., López, V., Abelló, P., Queral, J. M., et al. (2022). Severe, rapid and widespread impacts of an Atlantic blue crab invasion. Mar. Pollut. Bull. 176, 113479. doi:10.1016/j.marpolbul.2022.113479
Corrales, X., Katsanevakis, S., Coll, M., Heymans, J. J., Piroddi, C., Ofir, E., et al. (2020). Advances and challenges in modelling the impacts of invasive alien species on aquatic ecosystems. Biol. Invasions 22 (3), 907–934. doi:10.1007/s10530-019-02160-0
Courchamp, F., Fournier, A., Bellard, C., Bertelsmeier, C., Bonnaud, E., Jeschke, J. M., et al. (2017). Invasion biology: Specific problems and possible solutions. Trends Ecol. Evol. 32 (1), 13–22. doi:10.1016/j.tree.2016.11.001
De Giorgi, R., Cilenti, L., Falco, S., Katselis, G., Kevrekidis, K., Papadia, P., et al. (2022). Trace metals in five Mediterranean populations of the invasive Atlantic blue crab Callinectes sapidus: do variations in trophic position matter? Manuscript in preparation.
Di Muri, C., Alcorlo, P., Bardelli, R., Catalan, J., Gacia, E., Guerra, M. T., et al. (2022a). Individual and population-scale carbon and nitrogen isotopic signatures of Procambarus clarkii in invaded freshwater ecosystems. Biodivers. Data J. 10, e94411. doi:10.3897/bdj.10.e94411
Di Muri, C., Rosati, I., Bardelli, R., Cilenti, L., Veli, D. L., Falco, S., et al. (2022b). An individual-based dataset of carbon and nitrogen isotopic data of Callinectes sapidus in invaded Mediterranean waters. Biodivers. Data J. 10, e77516. doi:10.3897/bdj.10.e77516
Eftimov, T., Ispirova, G., Potočnik, G., Ogrinc, N., and Koroušić Seljak, B. (2019). ISO-FOOD ontology: A formal representation of the knowledge within the domain of isotopes for food science. Food Chemistry 277, 382–390.
Enke, N., Thessen, A., Bach, K., Bendix, J., Seeger, B., and Gemeinholzer, B. (2012). The user's view on biodiversity data sharing - investigating facts of acceptance and requirements to realize a sustainable use of research data -. Ecol. Inf. 11, 25–33. doi:10.1016/j.ecoinf.2012.03.004
Escribano, N., Galicia, D., and Ariño, A. H. (2018). The tragedy of the biodiversity data commons: A data impediment creeping nigher? Database. 2018, bay033. doi:10.1093/database/bay033
Essl, F., Lenzner, B., Bacher, S., Bailey, S., Capinha, C., Daehler, C., et al. (2020). Drivers of future alien species impacts: An expert-based assessment. Glob. Chang. Biol. 26 (9), 4880–4893. doi:10.1111/gcb.15199
European Commission (2014). Regulation (EU) No 1143/2014 of the European Parliament and of the Council of 22 October 2014 on the prevention and management of the introduction and spread of invasive alien species. Official J. Eur. Union 317, 35–55. Available at: https://eur-lex.europa.eu/legal-content/EN/TXT/PDF/?uri=CELEX:32014R1143andrid=5
European Commission (2020). “Communication from the commission to the European parliament, the Council, the economic and social committee and the committee of the regions,” in EU Biodiversity Strategy for 2030 - bringing nature back into our lives (Brussels: Publication Office of the European Union). Avaliable at: http://eur-lex.europa.eu/LexUriServ/LexUriServ.do?uri=CELEX:52012DC0673:EN:NOT.
European Commission (2008). Towards an EU strategy on invasive species. Brussels: European Commission.
Fick, S. E., and Hijmans, R. J. (2017). WorldClim 2: New 1-km spatial resolution climate surfaces for global land areas. Int. J. Climatol. 37 (12), 4302–4315. doi:10.1002/joc.5086
Fox, J., and Weisberg, H. S. (2011). An R companion to applied regression. Second Edition. Thousand Oaks, CA: Sage Publications, Inc.
Gallardo, B., Clavero, M., Sánchez, M. I., and Vilà, M. (2016). Global ecological impacts of invasive species in aquatic ecosystems. Glob. Chang. Biol. 22 (1), 151–163. doi:10.1111/gcb.13004
Gautam, M. K., and Lee, K. S. (2016). Application of stable isotopes in ecosystem research. Curr. Sci. 110 (7), 1288–1306. Available at: https://www.jstor.org/stable/24908018
Hänfling, B., Edwards, F., and Gherardi, F. (2011). Invasive alien Crustacea: Dispersal, establishment, impact and control. BioControl 56 (4), 573–595. doi:10.1007/s10526-011-9380-8
Havel, J. E., Kovalenko, K. E., Thomaz, S. M., Amalfitano, S., and Kats, L. B. (2015). Aquatic invasive species: Challenges for the future. Hydrobiologia 750 (1), 147–170. doi:10.1007/s10750-014-2166-0
Hegyi, G., and Garamszegi, L. (2011). Using information theory as a substitute for stepwise regression in ecology and behavior. Behav. Ecol. Sociobiol. 65 (1), 69–76. doi:10.1007/s00265-010-1036-7
Henry, A. K., and Sorte, C. J. B. (2022). Impact assessment of coastal marine range shifts to support proactive management. Front. Ecol. Environ. 20 (3), 161–169. doi:10.1002/fee.2447
Hobbs, H., Jass, J. P., and Huner, J. V. (1989). A review of global crayfish introductions with particular emphasis on two North American species (Decapoda, Cambaridae). Crustaceana 56 (3), 299–316. doi:10.1163/156854089x00275
Hofkin, B. V., Koech, D. K., Oumaj, J., and Loker, E. S. (1991). The North American crayfish Procambarus clarkii and the biological control of schistosome-transmitting snails in Kenya: Laboratory and field investigations. Biol. Control 1 (3), 183–187. doi:10.1016/1049-9644(91)90065-8
Jackson, A. L., Inger, R., Parnell, A. C., and Bearhop, S. (2011). Comparing isotopic niche widths among and within communities: SIBER – stable isotope bayesian ellipses in R. J. Animal Ecol. 80 (3), 595–602. doi:10.1111/j.1365-2656.2011.01806.x
Jackson, A. L., and Parnell, A. C. (2021). Siber: Stable isotope bayesian ellipses in R. R package version 2.1.6. Avaliable at: http://cran.r-project.org/web/packages/SIBER.
Katsanevakis, S., and Moustakas, A. (2018). Uncertainty in marine invasion science. Front. Mar. Sci. 5, 38. doi:10.3389/fmars.2018.00038
Katsanevakis, S., Wallentinus, I., Zenetos, A., Leppäkoski, E., Çinar, M. E., Oztürk, B., et al. (2014). Impacts of invasive alien marine species on ecosystem services and biodiversity: A pan-European review. Aquat. Invasions 9 (4), 391–423. doi:10.3391/ai.2014.9.4.01
Layman, C. A., Arrington, D. A., Montaña, C. G., and Post, D. M. (2007). Can stable isotope ratios provide for community-wide measures of trophic structure? Ecology 88, 42–48. doi:10.1890/0012-9658(2007)88[42:csirpf]2.0.co;2
Loureiro, T. G., Anastácio, P. M. S. G., Araujo, P. B., Souty-Grosset, C., and Almerão, M. P. (2015). Red swamp crayfish: Biology, ecology and invasion - an overview. Nauplius 23, 1–19. doi:10.1590/s0104-64972014002214
Mancinelli, G., Bardelli, R., and Zenetos, A. (2021). A global occurrence database of the Atlantic blue crab Callinectes sapidus. Sci. Data 8 (111), 111–210. doi:10.1038/s41597-021-00888-w
Mancinelli, G., Chainho, P., Cilenti, L., Falco, S., Kapiris, K., Katselis, G., et al. (2017a). The atlantic blue crab Callinectes sapidus in southern European coastal waters: Distribution, impact and prospective invasion management strategies. Mar. Pollut. Bull. 119 (1), 5–11. doi:10.1016/j.marpolbul.2017.02.050
Mancinelli, G., and Di Muri, C. (2022a). An individual-based dataset of carbon and nitrogen isotopic data of Callinectes sapidus in invaded Mediterranean waters [Data set]. LifeWatch ERIC. doi:10.48372/9CD2907F-8F44-4DF6-9070-6B21E1991B94
Mancinelli, G., and Di Muri, C. (2022b). Individual and population-scale carbon and nitrogen isotopic signatures of Procambarus clarkii in invaded freshwater ecosystems. LifeWatch ERIC. doi:10.48372/D25219D3-FE11-4052-879A-EB2E15CA295C
Mancinelli, G., Guerra, M. T., Alujević, K., Raho, D., Zotti, M., and Vizzini, S. (2017b). Trophic flexibility of the atlantic blue crab Callinectes sapidus in invaded coastal systems of the apulia region (SE Italy): A stable isotope analysis. Estuarine. Coast. Shelf Sci. 198, 421–431. doi:10.1016/j.ecss.2017.03.013
Mancinelli, G. (2012). On the trophic ecology of gammaridea (Crustacea: Amphipoda) in coastal waters: A European-scale analysis of stable isotopes data. Estuar. Coast. Shelf Sci. 114, 130–139. doi:10.1016/j.ecss.2011.12.003
Mancinelli, G., and Vizzini, S. (2015). Assessing anthropogenic pressures on coastal marine ecosystems using stable CNS isotopes: State of the art, knowledge gaps, and community-scale perspectives. Estuar. Coast. Shelf Sci. 156, 195–204. doi:10.1016/j.ecss.2014.11.030
Mancini, F., De Giorgi, R., Ludovisi, A., Vizzini, S., and Mancinelli, G. (2021). Ontogenetic shift in the trophic role of the invasive killer shrimp Dikerogammarus villosus: A stable isotope study. Biol. Invasions 23, 1803–1817. doi:10.1007/s10530-021-02472-0
Mancini, F., Lillo, A. O., Bardelli, R., Vizzini, S., and Mancinelli, G. (2022). Variation in the stable isotope trophic position of the bluefish Pomatomus saltatrix (linnaeus, 1766) from two mediterranean sites: Insights from a global meta-analysis. Mediterr. Mar. Sci. 23, 850–863. doi:10.12681/mms.29325
Médoc, V., Thuillier, L., and Spataro, T. (2018). Opportunistic omnivory impairs our ability to predict invasive species impacts from functional response comparisons. Biol. Invasions 20 (5), 1307–1319. doi:10.1007/s10530-017-1628-5
Millikin, M. R., and Williams, A. B. (1984). Synopsis of biological data on blue crab, Callinectes sapidus Rathbun. FAO Fish. Synop. 38, 138.
Mollot, G., Pantel, J. H., and Romanuk, T. N. (2017). The effects of invasive species on the decline in species richness: A global meta-analysis. Adv. Ecol. Res. 56, 61–83.
Neath, A. A., and Cavanaugh, J. E. (2012). The bayesian information criterion: Background, derivation, and applications. WIREs Comp. Stat. 4 (2), 199–203. doi:10.1002/wics.199
Nehring, S. (2011). In the wrong place - alien marine Crustaceans: Distribution, biology and impacts. Netherlands: Springer, 607–624.
Oficialdegui, F. J., Clavero, M., Sánchez, M. I., Green, A. J., Boyero, L., Michot, T. C., et al. (2019). Unravelling the global invasion routes of a worldwide invader, the red swamp crayfish (Procambarus clarkii). Freshw. Biol. 64 (8), 1382–1400. doi:10.1111/fwb.13312
Pauli, J. N., Newsome, S. D., Cook, J. A., Harrod, C., Steffan, S. A., Baker, C. J. O., et al. (2017). Opinion: Why we need a centralized repository for isotopic data. Proceedings of the National Academy of Sciences 114 (12), 2997–3001.
Pethybridge, H., Choy, C. A., Logan, J. M., Allain, V., Lorrain, A., Bodin, N., et al. (2018). A global meta-analysis of marine predator nitrogen stable isotopes: Relationships between trophic structure and environmental conditions. Glob. Ecol. Biogeogr. 27 (9), 1043–1055. doi:10.1111/geb.12763
Piccolroaz, S., Healey, N. C., Lenters, J. D., Schladow, S. G., Hook, S. J., Sahoo, G. B., et al. (2018). On the predictability of lake surface temperature using air temperature in a changing climate: A case study for lake tahoe (USA). Limnol. Oceanogr. 63 (1), 243–261. doi:10.1002/lno.10626
Quezada-Romegialli, C., Jackson, A. L., and Harrod, C. (2019). tRophicPosition: Bayesian trophic position calculation with stable isotopes. Avaliable at: http://cran.r-project.org/web/packages/tRophicPosition.
Quezada-Romegialli, C., Jackson, A. L., Hayden, B., Kahilainen, K. K., Lopes, C., and Harrod, C. (2018). tRophicPosition, an r package for the Bayesian estimation of trophic position from consumer stable isotope ratios. Methods Ecol. Evol. 9, 1592–1599. doi:10.1111/2041-210x.13009
R Development Core Team (2022). R: A language and environment for statistical computing. Vienna, Austria: R Foundation for Statistical Computing. Avaliable at: http://www.R-project.org/.
Rabitsch, W., Kudrnovsky, H., Roy, H., Beckmann, B., Peyton, J., Purse, B., et al. (2022). Study on invasive alien species development of risk assessments to tackle priority species and enhance prevention : Final report (and annexes). [Technical Report] European Commission: European Commission.
Ricciardi, A., Iacarella, J. C., Aldridge, D. C., Blackburn, T. M., Carlton, J. T., Catford, J. A., et al. (2021). Four priority areas to advance invasion science in the face of rapid environmental change. Environ. Rev. 29 (2), 119–141. doi:10.1139/er-2020-0088
Romanuk, T. N., Zhou, Y., Brose, U., Berlow, E. L., Williams, R. J., and Martinez, N. D. (2009). Predicting invasion success in complex ecological networks. Phil. Trans. R. Soc. B 364 (1524), 1743–1754. doi:10.1098/rstb.2008.0286
Russell, J. C., and Blackburn, T. M. (2017). Invasive alien species: Denialism, disagreement, definitions, and dialogue. Trends Ecol. Evol. 32 (5), 312–314. doi:10.1016/j.tree.2017.02.005
Sbrocco, E. J., and Barber, P. H. (2013). Marspec: Ocean climate layers for marine spatial ecology. Ecology 94 (4), 979. doi:10.1890/12-1358.1
Schwarz, G. (1978). Estimating the dimension of a model. Ann. Stat. 6 (2), 461–464. doi:10.1214/aos/1176344136
Souty-Grosset, C., Anastácio, P. M., Aquiloni, L., Banha, F., Choquer, J., Chucholl, C., et al. (2016). The red swamp crayfish Procambarus clarkii in Europe: Impacts on aquatic ecosystems and human well-being. Limnologica 58, 78–93. doi:10.1016/j.limno.2016.03.003
Stephenson, P. J., and Stengel, C. (2020). An inventory of biodiversity data sources for conservation monitoring. PLOS ONE 15 (12), e0242923. doi:10.1371/journal.pone.0242923
Streftaris, N., and Zenetos, A. (2006). Alien marine species in the Mediterranean - the 100 'Worst Invasives' and their impact. Mediterr. Mar. Sci. 7 (1), 87–117. doi:10.12681/mms.180
Sulieman, Y., Pengsakul, T. T., Guo, Y., Huang, S. Q., and Peng, W. X. (2013). Laboratory and semi-field evaluation on the biological control of Oncomelania hupensis snail (Gastropoda: Pomatiopsidae), the intermediate host of Schistosoma japonicum, using Procambarus clarkii crayfish (Crustacea: Cambaridae). Egypt. J. Biol. Pest Control 23 (2), 215–220.
Thomsen, M. S., Byers, J. E., Schiel, D. R., Bruno, J. F., Olden, J. D., Wernberg, T., et al. (2014). Impacts of marine invaders on biodiversity depend on trophic position and functional similarity. Mar. Ecol. Prog. Ser. 495, 39–47. doi:10.3354/meps10566
Torchin, M. E., Freestone, A. L., Mccann, L., Larson, K., Schlöder, C., Steves, B. P., et al. (2021). Asymmetry of marine invasions across tropical oceans. Ecology 102 (8), e03434. doi:10.1002/ecy.3434
Tsirintanis, K., Azzurro, E., Crocetta, F., Dimiza, M., Froglia, C., Gerovasileiou, V., et al. (2022). Bioinvasion impacts on biodiversity, ecosystem services, and human health in the Mediterranean Sea. Aquat. Invasions 17, 308–352. doi:10.3391/ai.2022.17.3.01
Twardochleb, L. A., Olden, J. D., and Larson, E. R. (2013). A global meta-analysis of the ecological impacts of nonnative crayfish. Freshw. Sci. 32 (4), 1367–1382. doi:10.1899/12-203.1
Tyberghein, L., Verbruggen, H., Pauly, K., Troupin, C., Mineur, F., and De Clerck, O. (2012). Bio-ORACLE: A global environmental dataset for marine species distribution modelling. Glob. Ecol. Biogeogr. 21 (2), 272–281. doi:10.1111/j.1466-8238.2011.00656.x
UNEP (1992). Convention on biological diversity. Nairobi: Avaliable at: https://digitallibrary.un.org/record/223428?ln=en.
Vaira, L., Fiore, N., and Rosati, I. (2022). LifeWatch ERIC Application Profiles (Version 1). LifeWatch ERIC. doi:10.48372/8528-9Z45
Vander Zanden, M. J., Cabana, G., and Rasmussen, J. B. (1997). Comparing trophic position of freshwater fish calculated using stable nitrogen isotope ratios (15N) and literature dietary data. Can. J. Fish. Aquat. Sci. 54 (5), 1142–1158. doi:10.1139/f97-016
Vanderklift, M., and Ponsard, S. (2003). Sources of variation in consumer-diet δ15N enrichment: A meta-analysis. Oecologia 136 (2), 169–182. doi:10.1007/s00442-003-1270-z
Vazquez, D. P. (2006). Conceptual ecology and invasion biology: Reciprocal approaches to nature. Dordrecht: Springer Netherlands, 307–322.
Wallingford, P. D., Morelli, T. L., Allen, J. M., Beaury, E. M., Blumenthal, D. M., Bradley, B. A., et al. (2020). Adjusting the lens of invasion biology to focus on the impacts of climate-driven range shifts. Nat. Clim. Chang. 10 (5), 398–405. doi:10.1038/s41558-020-0768-2
Watkins, H. V., Yan, H. F., Dunic, J. C., and Côté, I. M. (2021). Research biases create overrepresented “poster children” of marine invasion ecology. Conserv. Lett. 14 (3), e12802. doi:10.1111/conl.12802
Whittingham, M. J., Stephens, P. A., Bradbury, R. B., and Freckleton, R. P. (2006). Why do we still use stepwise modelling in ecology and behaviour? J. Animal Ecol. 75 (5), 1182–1189. doi:10.1111/j.1365-2656.2006.01141.x
Wilkinson, M. D., Dumontier, M., Aalbersberg, I. J., Appleton, G., Axton, M., Baak, A., et al. (2016). The FAIR Guiding Principles for scientific data management and stewardship. Sci. Data 3 (1), 160018. doi:10.1038/sdata.2016.18
Woo, J., Zhao, L., and Bowen, G. J. (2021). Streamlining geospatial data processing for isotopic landscape modeling. Concurrency and Computation: Practice and Experience 33 (19), e6324.
Wood, S. N. (2017). Generalized additive models: An introduction with R. Boca Raton, FL: Chapman and Hall/CRC Press.
Wood, S., and Scheipl, F. (2020). gamm4: Generalized Additive Mixed Models using 'mgcv' and 'lme4'. R package. Avaliable at: http://cran.r-project.org/web/packages/gamm4.
Keywords: virtual research environment, invasive species, carbon 13, nitrogen 15, Callinectes sapidus, Procambarus clarkii, trophic position, ecological impact
Citation: Di Muri C, Arvanitidis C, Basset A, De Giorgi R, Rosati I, Vaira L and Mancinelli G (2023) The validation case on invasive crustaceans of the LifeWatch ERIC Internal Joint Initiative: State of the art and next steps forward. Front. Environ. Sci. 10:1038635. doi: 10.3389/fenvs.2022.1038635
Received: 07 September 2022; Accepted: 07 December 2022;
Published: 04 January 2023.
Edited by:
Caterina Bergami, National Research Council (CNR), ItalyReviewed by:
Taina Goncalves Loureiro, Cape Peninsula University of Technology, South AfricaCopyright © 2023 Di Muri, Arvanitidis, Basset, De Giorgi, Rosati, Vaira and Mancinelli. This is an open-access article distributed under the terms of the Creative Commons Attribution License (CC BY). The use, distribution or reproduction in other forums is permitted, provided the original author(s) and the copyright owner(s) are credited and that the original publication in this journal is cited, in accordance with accepted academic practice. No use, distribution or reproduction is permitted which does not comply with these terms.
*Correspondence: Cristina Di Muri, Y3Jpc3RpbmEuZGltdXJpQGlyZXQuY25yLml0; Giorgio Mancinelli, Z2lvcmdpby5tYW5jaW5lbGxpQHVuaXNhbGVudG8uaXQ=
Disclaimer: All claims expressed in this article are solely those of the authors and do not necessarily represent those of their affiliated organizations, or those of the publisher, the editors and the reviewers. Any product that may be evaluated in this article or claim that may be made by its manufacturer is not guaranteed or endorsed by the publisher.
Research integrity at Frontiers

Learn more about the work of our research integrity team to safeguard the quality of each article we publish.