 Xueyan Zhang1
 Xin Ma
 Yingchun Li
- 1Key Laboratory of Land Surface Pattern and Simulation, Institute of Geographic Sciences and Natural Resources Research, Chinese Academy of Sciences, Beijing, China
- 2Institute of Environment and Sustainable Development in Agriculture, Chinese Academy of Agricultural Sciences, Beijing, China
Elucidating the determining factors for wheat quality is an essential but complex task, influenced by wheat cultivars, environmental conditions, and management decisions. This study analyzed 285 winter wheat varieties, 13 wheat quality traits, and 9 influencing factors under a genotype, environment, and crop management framework by a geographical detector model in China’s main winter wheat-producing area. Our results revealed the attribution of wheat quality in the genotype × environment × crop management (G × E × M) interaction framework. The factors influencing wheat quality in China were ranked as follows: wheat cultivar > precipitation > Tmax > irrigation > soil type > Tmin > fertiliser > sunshine duration > landform. The wheat cultivar was the dominant factor affecting wheat quality, which explained 38.57%, 38.78%, and 28.13% of the variation in gluten index, stabilization time, and sedimentation index, respectively. In addition, the sensitivity of the wheat quality traits to the G × E × M interaction framework was detected. The wheat quality trait sensitivity ranked from the highest to the lowest followed the order gluten index > sedimentation index > hardness index > stabilisation time > seed moisture > crude protein > formation time > wet gluten > water absorption > landing value > flour output ratio > ash > capacity. Gluten and sedimentation were highly sensitive traits for wheat quality under the G × E × M interaction framework, with sensitivity index values of 66.94% and 58.11% in the G × E × M framework, respectively. Furthermore, we proposed an integrated improvement strategy for an end-use wheat quality trait based on the sensitivity of wheat quality traits in the G × E × M framework. The gluten index, crude protein, wet gluten, and hardness index should be prioritized according to wheat’s commercial value and sensitivity index. However, other quality traits with higher commercial importance, such as flour output ratio, capacity, and landing value, should be put behind the improvement list. Our result identified the critical factors for most wheat quality traits in the G × E × M framework. It extended the comprehensive strategy for wheat quality improvement.
1 Introduction
Elucidating the determining factors for wheat quality is an essential but complex task (Studnicki et al., 2016), which is necessary to ensure human nutrition safety and is also critical to many stakeholders in the agri-food chain, including farmers, agronomists, commodity traders, and policymakers (Paudel et al., 2021). Wheat quality improvement practices have historically focused on end-use traits with high commercial value, including crude protein, grain hardness (Surma et al., 2012), and milling and baking quality (Battenfield et al., 2018). However, from an agricultural system perspective, wheat quality is influenced by wheat cultivars, environmental conditions, and management decisions (Nuttall et al., 2017). Therefore, from an optimal efficiency perspective, an integrated strategy based on genotype × environment × crop management (G × E × M) interaction should be developed to improve wheat quality.
The influence of genotype and environment (G × E) has received significant attention as an essential strategy for improving wheat quality. Several interacting field experiments have qualitatively judged the driving forces of wheat quality. 39 spring wheat cultivars, 7 locations, and 12 major bread-making quality traits have been investigated in China. This revealed that genetic variance components mainly influenced kernel hardness, flour yield, and Zeleny sedimentation value. In contrast, test weight and the number of dropped grains were primarily influenced by environmental variations (Zhang et al., 2004). Another study tested the effect of G × E on yellow alkaline noodles quality using six Canadian wheat cultivars at three sites. Cooked durum noodle texture parameters were significantly affected by G × E, with the environment accounting for 66–71% of their variance (Hatcher et al., 2009). Protein content, sedimentation value, and loaf volume were measured through 20 wheat cultivars and 15 environmental factors in southeast Europe, and all three traits were more influenced by location than by year, with protein content and sedimentation value responding more strongly to changes in environmental conditions than loaf volume (Hristov et al., 2010). Wheat quality was examined for five winter wheat cultivars in Serbia from 2004 to 2006. Significant differences among genotype investigated years, location for sedimentation value, and wet gluten content was observed (Zecevic et al., 2009). Twenty-one wheat genotypes were evaluated under drought stress, and significant genotypic effects were found for gliadin, total protein content, and gliadin and gluten ratio, indicating genotypic variations for these traits; moreover, strong environmental influences of 89.65% and 89.06% were observed for gluten and glutenin, respectively (Thungo et al., 2020). In Latin America, 23 genotypes were cultivated in 20 environments distributed across nine sites in six countries. Large variability was observed for most of the evaluated wheat quality features, with a more extensive range of quality parameters in different environments than among genotypes, even for parameters primarily determined by genotypes (Vázquez et al., 2012). Furthermore, several field experiments have qualified the effect of a single factor on wheat quality, such as rainfall (Garrrido-Lestache et al., 2004), water deficit (Zhao et al., 2009), high temperature (Singh et al., 2010), fertilization (Lin et al., 2012; Luo et al., 2019), and low temperature (Liu et al., 2019). The importance of the environmental factors for grain quality has been previously demonstrated, suggesting that breeders’ quality objectives should be adapted to the target environment (Vázquez et al., 2012).
There is limited research on the dependency of wheat quality on genotype × environment × crop management (G × E × M) interactions (Wang and Frei, 2011) through complex experimental designs. Seven cultivars were cultivated at three locations under two crop management levels in Poland, and the results showed that the area significantly affected the protein content. Fertilizer application levels may substantially increase protein content (Rozbicki et al., 2015). Fifteen spring wheat genotypes and two crop management levels at seven locations were evaluated, and grain protein was substantially influenced by crop management and genotype. Still, unfavorable soil conditions had a significant effect (Studnicki et al., 2016). An experiment was conducted for winter wheat in the North China Plain to examine the interaction mechanisms between two temperature increases (1.4 and 2.3°C) and tillage (conventional and no-tillage) treatments. However, only a temperature increase was found to significantly increase nitrogen, protein, and carbon contents and reduce the C/N ratio (Li et al., 2020). Twenty-four winter wheat genotypes, four locations, and two fertilizer application levels were evaluated in Poland, and it was found that genotype had a significant effect on only grain hardness. Moreover, the environment was dominant for protein content, wet gluten, and Zeleny sedimentation value. In contrast, for starch content, the alveograph W parameter and hectolitre weight sources of variation had the same importance (Surma et al., 2012). Fifteen wheat genotypes, three locations, and two levels of nitrogen fertilizer application were used to assess the impacts on wheat quality. Wet gluten, sedimentation value, and stabilization time were controlled by location, followed by genotype and nitrogen fertilizer (Jin et al., 2019). The development of field experiments of single-factor, G × E, and G × E × M revealed some driving forces of wheat quality trait responses. However, limited by the number of factors arranged in a field experiment, environmental factors are usually simplified by location and year. Therefore, it is difficult to determine the quantitative contribution rate of whole factors in the G × E × M framework to wheat quality in single or multi-factor field experiments.
In order to improve the quality of wheat more efficiently, on the one hand, the contribution of various factors in the G × E × M Framework to wheat quality indicators needs to be deeply understood. In contrast, it is necessary to identify which of the many wheat quality indicators are sensitive to changes in factors under the G × E × M Framework, especially those with high commercial value. In this regard, this study attempted to fill the research gaps by 1) introducing a new method to quantitatively describe the contribution of the G × E × M framework to wheat quality traits; and 2) assessing the sensitivity of wheat quality traits to each factor under the G × E × M framework. The study results can assist in developing a comprehensive strategy for efficiently improving wheat quality.
2 Material and methods
2.1 Study area
The main winter wheat-producing area of China (29°24´–42°36´ N, 110°21´–122°42´ E) accounts for 38% of the total sown area and more than 50% of the winter wheat yield. This area mainly included Hebei, Henan, Shandong, Shanxi, Shaanxi, Anhui, Hubei, and Jiangsu, with a total area of 5 million ha, arable land accounts for approximately 0.26 million ha (Figure 1). The region is a core agricultural production area in China, and its predominantly warm temperate monsoon climate shows a distinct season with coinciding rain and heat. As a result, it is dry and cold in spring and winter, while high temperatures and rainfall characterize summers. The accumulated temperature above 10°C is 3,400–4,700°C, annual precipitation is 500–900 mm, and interannual precipitation variation is relatively large (Sun et al., 2017).
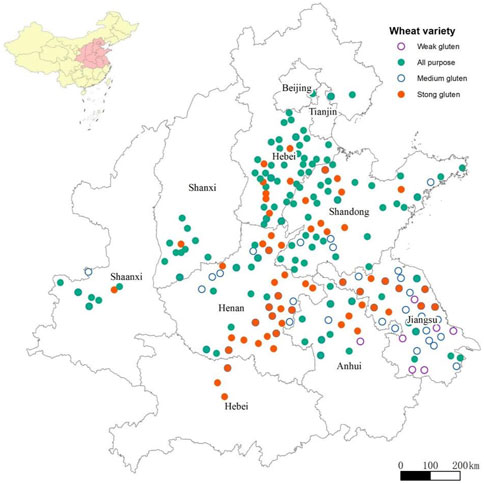
FIGURE 1. Main winter wheat-producing areas and the spatial distribution of winter wheat varieties in China.
2.2 Wheat sampling and quality measurement
The wheat quality traits used in this study include grain quality (hardness index, capacity, crude protein, seed moisture, and landing value), flour quality (flow output ratio, sedimentation index, ash, wet gluten, and gluten index), and dough quality (water absorption, formation time, and stabilization time) (Table 1). All 787 wheat samples were collected by large-scale grain producers in 204 counties from main winter wheat-producing areas, who need to provide quality data to the processing enterprises that purchase wheat. The weight of each wheat sample shall not be less than 2 kg, and the geographic location of the sample and the wheat variety information shall be provided. The Grain and Product Quality Supervision, Inspection, and Testing Centre of the Ministry of Agriculture and Rural Affairs (Taian and Zhengzhou) tested all those wheat samples. The results have been published in the 2017 and 2018 China wheat quality reports (MOMA, 2017; Zhang and Zhao, 2018).
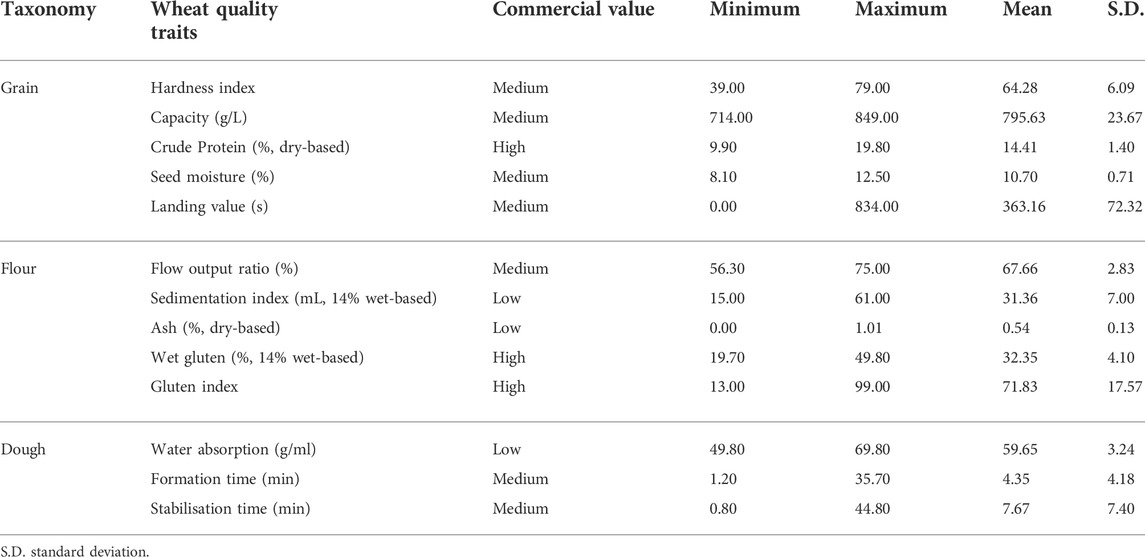
TABLE 1. Descriptive statistics of wheat quality traits.
2.3 Potential driving factor selection and data sources
Nine influences from the three driving forces were selected based on the existing literature, including genotype (wheat cultivar), management (irrigation and fertilizer), and environment (precipitation, maximum temperature, minimum temperature, soil type, terrain, and sunshine duration) (Table 2).
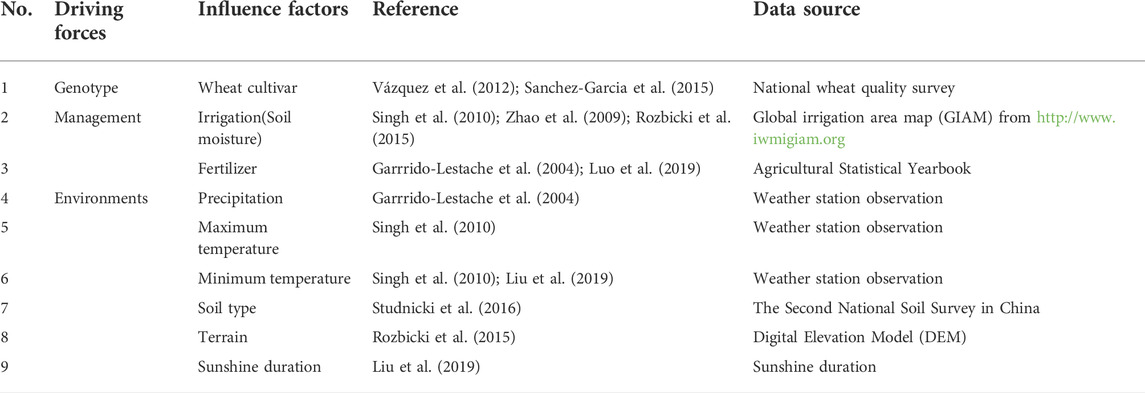
TABLE 2. Factors used to analyze the driving forces of wheat quality.
2.3.1 Wheat variety
The 285 winter wheat varieties included weakened gluten (5), all-purpose types (181), medium gluten (61), and strong gluten (39), which were cultivated in the study area during 2017–2018 (MOMA, 2017; Zhang and Zhao, 2018). As shown in Figure 1, the spatial distribution of wheat varieties followed a uniform pattern. The weak gluten varieties were distributed in the southeast region of the principal winter wheat-producing area. In contrast, the strong gluten varieties were located south of the main winter wheat-producing area. The spatial distribution of all-purpose types was relatively uniform.
2.3.2 Management measures
The distribution of the two management factors, including fertilizer application and irrigation, is shown in Figures 2A,B. The county-level fertilizer maps show that the central part of the main winter wheat-producing area is a high-value area for fertilizer application, and the surrounding mountainous region is relatively low-value. The primary winter wheat-producing area has three irrigation water sources: surface water, groundwater, and combined usage. However, most agricultural areas are irrigated using groundwater (Yang et al., 2021), and rain-fed agricultural areas are distributed over the surrounding mountainous regions.
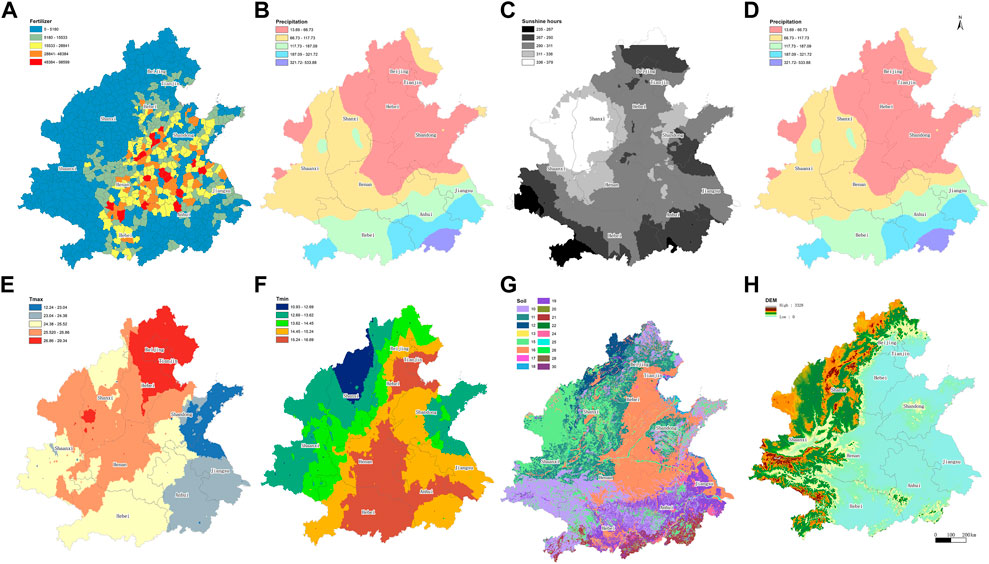
FIGURE 2. Distribution of the influencing factors. (A) Fertilizer, (B) irrigation, (C) sunshine, (D) precipitation, (E) maximum temperature, (F) minimum temperature, (G) soil type, and (H) terrain. Soil type legends are explained as follows: 10, leaching soil; 11, semi-leaching soil; 12, calcium layer soil; 13, dry soil; 15, primary soil; 16, semi-hydrated soil; 17, hydrated soil; 18, saline-alkali soil; 19, artificial soil; 20, alpine soil; 21, ferrallite; 22, urban district; 24, lakes and reservoirs; 25, rivers; 26, sandbars and islands in rivers; 28, coral reefs and sea island; and 30, coastal salt farm.
Irrigation data were obtained from the Global Irrigation Area Map (GIAM; Thenkabail et al., 2009). County-level fertilizers were calculated by multiplying the number of total nitrogen fertilizers by the quotient of the wheat sown area and the total planted area acquired from the Agricultural Statistics Yearbook of 2017 and 2018 (MOMA, 2017; Zhang and Zhao, 2018).
2.3.3 Environmental factors
The weather, soil, and terrain factors are shown in Figures 2C–H. The terrain of the main winter wheat-producing areas is high in the west and low in the east, and the eastern part of the terrain is mainly plain. The northern plains have less precipitation and higher temperatures. The wheat planting area consists primarily of semi-hydrated and artificial soils.
The meteorological data were acquired from the China Meteorological Administration, and used to calculate cumulative precipitation, average maximum temperature, average minimum temperature, and cumulative sunshine hours of winter wheat during the filling period in the main winter wheat-producing areas. The data on the filling period of winter wheat in different locations was obtained from the Atlas of Agroclimatic Resources in China (Mei, 2015). Soil data were obtained from the Second National Soil Census of China. Topographic data were obtained from a 1 × 1 km digital elevation model.
2.4 Geographical detector model
The geographical detector model (GDM) is a statistical method that can detect spatial heterogeneity and reveal the driving forces behind it and was developed by Wang Jingfeng (Wang and Hu, 2012). Model principle literature, application guide, and free software for GDM are available at http://www.geodetector.org.
The GDM is a powerful tool for driving forces, factors, and spatial analyses, which has some distinct advantages over classical statistical methods. For example, the GDM model does not require linearity assumptions; instead, spatial effects are considered (Wang et al., 2016), and the relationship between Y and X established by the GDM is more reliable than classical regression (Wang and Xu, 2017). Furthermore, none of the potential factors in the model analysis need to consider the problem of multicollinearities (Zhou et al., 2018). Finally, GDM can rank the deterministic power of each factor and describe its change over time (Ding et al., 2019). Therefore, it has been widely used in many research topics of natural and social sciences, including public health (Wang et al., 2010), land use (Ju et al., 2016), PM2.5 (Wang et al., 2021), air quality index (Zhan et al., 2018), heavy metals (Wu et al., 2021), carbon emissions (Zhang and Zhao, 2018), and soil erosion (Wang et al., 2019), and has also gradually been adopted in agroecological efficiency studies (Liao et al., 2021). However, although GDM has been applied in various research fields, it has rarely been utilized to analyze wheat quality factors.
A factor detector method in the GDM was used to measure the spatially stratified heterogeneity of the geographic variable Y to comprehensively analyze the correlation between wheat quality and the selected influencing factors (Figure 3). The GeoDetector q value is defined as follows (Wang et al., 2016):
where
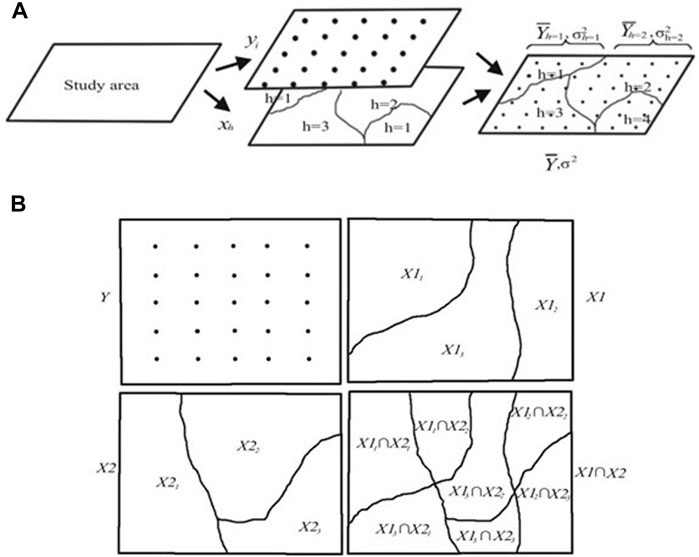
FIGURE 3. Rationale of the geographical detector (Wang et al., 2010; Wang and Xu, 2017). (A) Detection of driving forces and (B) detection of interaction.
For
2.5 Sensitivity index of wheat quality traits based on the geographical detector model
In GDM, one q-value represents the determined power of one factor in the G × E × M framework to one winter wheat quality trait. Therefore, for specific winter wheat quality traits, the sum of the q-value of all factors in the G × E × M framework could indicate the response degree of wheat quality trait, namely the sensitivity of wheat quality trait to the G × E × M framework. The sensitivity index of wheat quality trait is developed as follows:
Where
3 Results
3.1 Factor detection for wheat quality
The q statistical results showed that wheat cultivar is the dominant factor affecting wheat quality. Wheat cultivar explained 38.57%, 38.78%, and 28.13% of the spatial variation in gluten index, stabilization time, and sedimentation index, respectively, contributing to three other wheat quality traits: crude protein, formation time, and hardness index (Figure 4).
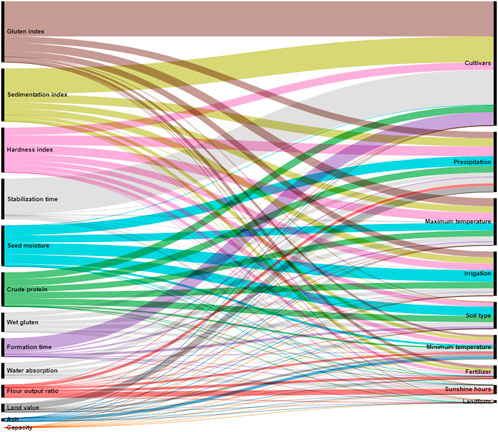
FIGURE 4. Factors influencing the quality of winter wheat with q-values. The black vertical bar on the left represents the susceptibility index of wheat quality in the G × E × M framework. The black vertical bar on the right represents the determination of each driver of wheat quality.
Precipitation was the second most influential factor for wheat quality. The q value of precipitation was significant for 10 of the 13 wheat quality traits, thus, indicating that precipitation plays a vital role in most wheat quality traits. For example, for the hardness index and wheat quality seed moisture, the precipitation q-values reached 10.65% and 10.66%, respectively.
Tmax was the third influencing factor of wheat quality, which affected nine of the 13 wheat quality traits. The q value of Tmax exceeded 8% for the hardness index, gluten index, and seed moisture.
Irrigation, soil type, and Tmin affected 7–9 of the 13 wheat quality traits. Less influential driving forces were fertilizer, sunshine duration, and landform, with landform influencing only one wheat quality trait and having a low q-value.
According to the results of the GDM detection factors, the factors influencing wheat quality in China were ranked as follows: wheat cultivar > precipitation > Tmax > irrigation > soil type > Tmin > fertiliser > sunshine duration > landform (Figure 4).
3.2 Sensitivity index of the wheat quality trait in the G × E × M framework
Based on Figure 5, the sensitivity of wheat quality traits in the G × E × M framework was divided into three groups:
1) High sensitivity group: Gluten and sedimentation indices, which are highly sensitive traits for wheat quality, exceeded 50% in the G × E × M framework, reaching 66.94% and 58.11%, thus, indicating that wheat’s gluten index and sedimentation index were more susceptible to the G × E × M framework than other factors. As shown in Figure 5, wheat cultivar, precipitation, Tmax, and irrigation played an essential role in forming wheat gluten and sedimentation indices.
2) Moderately sensitive group: Hardness index, stabilization time, seed moisture, crude protein, formation time, and wet gluten were moderately sensitive traits for wheat quality, with sensitivity indices ranging from 20% to 50% in the G × E × M framework. Among these traits, crude protein, wet gluten, and hardness index were essential quality features for the planned use of wheat, and they showed relatively sensitive reflections to G × E × M factors (Figure 5). The wheat cultivar mainly controlled the dough stabilization time.
3) Low-sensitivity group: Water absorption, landing value, flour output ratio, ash content, and capacity were the low-sensitive traits of wheat quality, and the sensitivity indices in the G × E × M framework were less than 20%. In particular, the sensitivity indices of capacity and ash were close to zero, indicating that the formation of power and ash in wheat quality was almost random and not influenced by the G × E × M framework.
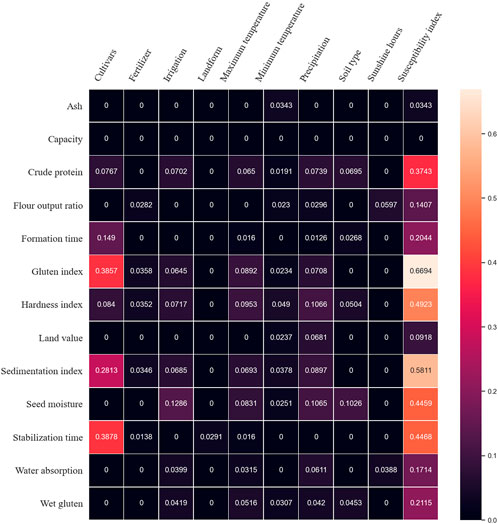
FIGURE 5. Sensitivity indices of wheat quality traits in the G × E × M interaction framework. The values in the grid represent the q values of wheat quality indicators in the G × E × M framework. The last value represents the sensitivity index of each wheat quality trait.
According to the sensitivity index based on the GDM, the consequences of wheat quality trait sensitivity ranked from the highest to the lowest were gluten index (0.6694) > sedimentation index (0.5811) > hardness index (0.4923) > stabilisation time (0.4468) > seed moisture (0.4459) > crude protein (0.3743) > wet gluten (0.2115) > formation time (0.2044) > water absorption (0.1714) > flour output ratio (0.1407) > landing value (0.0918) > ash (0.0343) > capacity (0).
3.3 Strategy for wheat quality improvement under the G × E × M framework
According to Figures 4, 5, three fundamental development principles must be proposed to improve wheat quality in the G × E × M framework. First, high-sensitivity traits of wheat quality should be prioritized, implying that adjusting influencing factors could effectively affect these sensitive traits. Second, wheat quality traits having high sensitivity and as few factors in the G × E × M framework as possible should be selected. Third, commercially recognized or practically necessary characteristics should be chosen. This can be summarized as high sensitivity, few influencing factors, and high value. Therefore, a 3D coordination relationship consisting of a sensitivity index, number of influencing factors, and a commercial value was established in the G × E × M interaction framework to decide the priority strategy for wheat quality improvement.
As shown in Figure 6, in the G × E × M interaction framework, the gluten index was located in the relatively high priority zone with high importance and received the highest priority in wheat quality improvement. In addition, crude protein and wet gluten were situated in the middle area, having high volume and ranked second in wheat quality improvement. Subsequently, the hardness index, seed moisture, stabilization time, and sedimentation index were located in the medium zone with medium importance and could be considered for wheat quality improvement and ranked third. In conclusion, the priority strategies for wheat quality improvement were gluten index > crude protein and wet gluten > hardness index, seed moisture, stabilization time, sedimentation index > water absorption, flour output ratio, landing value, ash, and capacity.
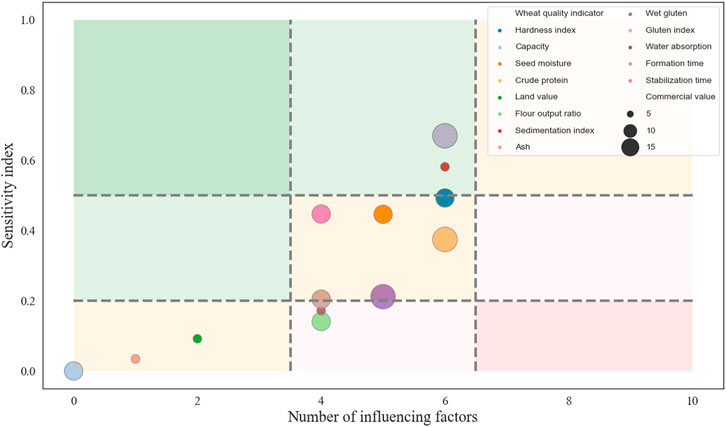
FIGURE 6. Priority strategies for wheat quality improvement in the G × E × M framework. The dots in the figure represent wheat quality traits. The size of the dots implies the importance of wheat quality traits in agricultural practices. The priority of wheat quality improvement is demonstrated by the position of wheat quality traits, with traits near the upper right corner implying a higher priority. Green denotes high priority, light green denotes relatively high priority, orange denotes medium priority, light pink denotes relatively low priority, and dark pink denotes a low priority.
4 Discussion
The GDM was employed to explore the driving forces behind the wheat quality of main winter wheat-producing areas in China by measuring and comparing the spatially stratified heterogeneity of wheat quality. (Figure 4). The factors influencing wheat quality in China were ranked as follows: wheat cultivar > precipitation > Tmax > irrigation > soil type > Tmin > fertiliser > sunshine duration > landform. To the best of our knowledge, it is the first time that the magnitude of the quantitative dependency of wheat quality on all of the factors in the G × E × M framework has been reported. The wheat cultivar was the dominant factor for wheat quality in the main winter wheat-producing areas, explaining 38.57%, 38.78%, and 28.13% of gluten index, stabilization time, and sedimentation index, respectively. These results suggested that genotype is a critical driving force behind the spatial distribution of wheat quality, while precipitation and Tmax also contribute significantly to wheat quality. These results were consistent with those of Vázquez et al. (2012). They found that genotype was the main factor determining wheat quality in 23 genotypes cultivated in 20 environments at nine locations in six countries. Furthermore, Studnicki et al. (2016) reported that genotype and crop management have substantially influenced the grain protein content of wheat. Our results expanded the knowledge on influencfactors to wheat quality under the G × E × M framework.
As shown in Figure 6, a new strategic approach was proposed to evaluate candidate wheat quality traits by high sensitivity, few influencing factors, and high commercial value to decide the priority for quality trait improvement. The gluten index, which represents the amount of high-quality gluten, was the most preferred trait for improving wheat quality. Crude protein and wet gluten were ranked as the second priority. Further, some traits of great commercial value, such as flour output ratio and capacity, ranked low as these two traits are not sensitive to the G × E × M interaction framework, which is hugely challenging to improve the flour output ratio and capacity in wheat quality. To some content, our results explain some of the current wheat quality improvement strategies. For example, much research on improving wheat crude protein was reported (Surma et al., 2012), while there are few reports on improving flour output ratio.
Usually, more than three influencing factors in a field trial to identify impacts wheat quality was a considerable challenge. In our study, the technical pathway using GDM provides a quantitative evaluation scheme by comparing the spatial distribution characteristics of wheat quality and factors in the G × E × M framework and analysing the matching of the spatial distribution pattern to determine the influences of 9 factors in G × E × M framework. 13 sensitivity indices of wheat quality traits based on the q-value from GDM were also obtained. Therefore, the GDM method is an extension of the limitation of the field test method to evaluate the effect of influencing factors in the G × E × M framework on wheat quality (Figure 5).
The results of GDM showed that fertilizer, sunshine duration, and landform were minor factors affecting wheat quality (Figure 5). In general, fertilizer is a critical factor in agricultural production. For example, a 28-year fertilizer application experiment showed that long-term fertilizer application significantly influenced grain protein content, dry gluten content, and wet gluten content (Lin et al., 2012). However, in our study, the primary winter wheat-producing area is one of China’s most developed agricultural production areas. Further, management parameters, such as fertilizer application and land leveling, reached a relatively saturated state. As shown in Figures 2A,B, all wheat varieties were primarily located in similar fertilization and landform areas in the principal winter wheat-producing area, which explains why fertilizer and landform were not the influencing factors for spatial variations in wheat quality. The contribution of influencing factors with saturated supply may be underestimated, and this may be a limitation of GDM.
5 Conclusion
Our study revealed the factors influencing wheat quality in China as well as the sensitivity of wheat quality traits to the G × E × M framework. Moreover, based on the sensitivity of wheat quality traits in the G × E × M framework, an integrated strategy for wheat quality traits was proposed wherein the gluten index, crude protein, wet gluten, and hardness index should be prioritized over other quality traits with higher commercial importance, such as flour output ratio, capacity, and landing value, according to wheat’s commercial value and sensitivity index. This study identified the critical factors influencing most wheat quality traits in the G × E × M framework and further expanded the comprehensive strategy for wheat quality improvement.
Data availability statement
The raw data supporting the conclusions of this article will be made available by the authors, without undue reservation.
Author contributions
All authors read and approved the final version of the manuscript. XM conceived of the study. XZ designed the methodology, conducted the analysis, and wrote the first draft of the manuscript. YL reviewed and edited the manuscript. HJ supervised the correct implementation of the methodology and interpretation of the results.
Funding
This study was supported by the National Key Research and Development Program of China (No. 2019YFA0607403 and No. 2021xjkk0903), National Natural Science Foundation of China (No. 32171561 and No. 32271638).
Conflict of interest
The authors declare that the research was conducted in the absence of any commercial or financial relationships that could be construed as a potential conflict of interest.
Publisher’s note
All claims expressed in this article are solely those of the authors and do not necessarily represent those of their affiliated organizations, or those of the publisher, the editors and the reviewers. Any product that may be evaluated in this article, or claim that may be made by its manufacturer, is not guaranteed or endorsed by the publisher.
References
Battenfield, S. D., Sheridan, J. L., Silva, L. D. C. E., Miclaus, K. J., Dreisigacker, S., Wolfinger, R. D., et al. (2018). Breeding-assisted genomics: Applying meta-GWAS for milling and baking quality in CIMMYT wheat breeding program. Plos one 11, 02047577–e204813. doi:10.1371/journal.pone.0204757
Ding, Y., Zhang, M., Qian, X., Li, C., Chen, S., and Wang, W. (2019). Using the geographical detector technique to explore the impact of socioeconomic factors on PM2.5 concentrations in China. J. Clean. Prod. 211, 1480–1490. doi:10.1016/j.jclepro.2018.11.159
Garrido-Lestache, E., López-Bellido, R. J., and López-Bellido, L. (2004). Effect of N rate, timing and splitting and N type on bread-making quality in hard red spring wheat under rainfed Mediterranean conditions. Field crops Res. 85, 213–236. doi:10.1016/s0378-4290(03)00167-9
Hatcher, D. W., Dexter, J. E., Bellido, G. G., Clarke, J. M., and Anderson, M. J. (2009). Impact of genotype and environment on the quality of amber durum wheat alkaline noodles. Cereal Chem. J. 86 (4), 452–462. doi:10.1094/cchem-86-4-0452
Hristov, N., Mladenov, N., Djuric, V., Kondic-Spika, A., Marjanovic-Jeromela, A., and Simic, D. (2010). Genotype by environment interactions in wheat quality breeding programs in southeast Europe. Euphytica. 174, 315–324.
Jin, X., Yao, Y., Jia, X., Yao, H., Shen, H., Cui, Y., et al. (2019). Effects of genotype and environment on wheat yield, quality, and nitrogen use efficiency. Acta Agron. Sin. 45 (4), 635–644. doi:10.3724/sp.j.1006.2019.81072
Ju, H., Zhang, Z., Zuo, L., Wang, J., Zhang, S., Wang, X., et al. (2016). Driving forces and their interactions of built-up land expansion based on the geographical detector–a case study of Beijing, China. Int. J. Geogr. Inf. Sci. 30 (11), 2188–2207. doi:10.1080/13658816.2016.1165228
Li, Y., Hou, R., and Tao, F. (2020). Interactive effects of different warming levels and tillage managements on winter wheat growth, physiological processes, grain yield and quality in the North China Plain. Agric. Ecosyst. Environ. 295, 106923. doi:10.1016/j.agee.2020.106923
Liao, J., Yu, C., Feng, Z., Zhao, H., Wu, K., and Ma, X. (2021). Spatial differentiation characteristics and driving factors of agricultural eco-efficiency in Chinese provinces from the perspective of ecosystem services. J. Clean. Prod. 288, 125466. doi:10.1016/j.jclepro.2020.125466
Lin, Z., Chang, X., Wang, D., Zhao, G., and Zhao, B. (2012). Long-term fertilization effects on processing quality of wheat grain in the North China Plain. Field Crops Res. 174, 55–60. doi:10.1016/j.fcr.2015.01.008
Liu, L., Song, H., Shi, K., Liu, B., Zhang, Y., Tang, L., et al. (2019). Response of wheat grain quality to low temperature during jointing and booting stages—on the importance of considering canopy temperature. Agric. For. Meteorology 278, 107658. doi:10.1016/j.agrformet.2019.107658
Luo, L., Hui, X., Wang, Z., Zhang, X., Xie, Y., Gao, Z., et al. (2019). Multi-site evaluation of plastic film mulch and nitrogen fertilization for wheat grain yield, protein content and its components in semiarid areas of China. Field Crops Res. 240, 86–94. doi:10.1016/j.fcr.2019.06.002
Mei, X. (2015). Atlas of agroclimatic Resources in China. HangZhou: Zhejiang Science and Technology Press, 57–58.
MOMA (2017). The department of planting and management of the Ministry of agriculture. China wheat quality report.
Nuttall, J. G., O`Leary, G. J., Panozzo, J. F., Walker, C. K., Barlow, K. M., and Fitzgerald, G. J. (2017). Models of grain quality in wheat-A review. Field crops Res. 202, 136–145. doi:10.1016/j.fcr.2015.12.011
Paudel, D., Boogaard, H., Wit, A., Janssen, S., Osinga, S., Pylianidis, C., et al. (2021). Machine learning for large-scale crop yield forecasting. Agric. Syst. 187, 103016. doi:10.1016/j.agsy.2020.103016
Rozbicki, J., Ceglińska, A., Gozdowski, D., Jakubczak, M., Cacak-Pietrzak, G., Madry, W., et al. (2015). Influence of the cultivar, environment and management on the grain yield and bread-making quality in winter wheat. J. Cereal Sci. 61, 126–132. doi:10.1016/j.jcs.2014.11.001
Sanchez-Garcia, M., Álvaro, F., Peremarti, A., Martín-Sánchez, J. A., and Royo, C. (2015). Changes in bread-making quality attributes of bread wheat varieties cultivated in Spain during the 20th century. Eur. J. Agron. 63, 79–88.
Singh, S., Gupta, A. K., Gupta, S. K., and Kaur, N. (2010). Effect of sowing time on protein quality and starch pasting characteristics in wheat (Triticum aestivum L.) genotypes grown under irrigated and rain-fed conditions. Food Chem. 122, 559–565. doi:10.1016/j.foodchem.2010.03.010
Studnicki, M., Wijata, M., Sobczynski, G., Samborski, S., Gozdowski, D., and Rozbicki, J. (2016). Effect of genotype, environment and crop management on yield and quality traits in spring wheat. J. cereal Sci. 72, 30–37. doi:10.1016/j.jcs.2016.09.012
Sun, X., Long, Z., Song, G., and Chen, C. (2017). Effects of climate change on cropping pattern and yield of summer maize-winter wheat in Huang-Huai-Hai Plain. Sci. Agric. Sin. 50 (13), 2476–2487. doi:10.3864/j.issn.0578-1752.2017.13.007
Surma, M., Adamski, T., Banaszak, Z., Kaczmarek, Z., Kuczynska, A., Majcher, M., et al. (2012). Effect of genotype, environment and their interaction on quality parameters of wheat breeding lines of diverse grain hardness. Plant Prod. Sci. 15 (3), 192–203. doi:10.1626/pps.15.192
Thenkabail, P. S., Biradar, C. M., Noojipady, P., Dheeravath, V., Li, Y., Velpuri, M., et al. (2009). Global irrigated area map (GIAM), derived from remote sensing, for the end of the last millennium. Int. J. remote Sens. 30, 3679–3733. doi:10.1080/01431160802698919
Thungo, Z., Shimelis, H., Odindo, A., and Mashilo, J. (2020). Genotype-by-environment effects on grain quality among heat and drought tolerant bread wheat (Triticum Aestivum L.) genotypes. J. plant Interact. 15 (1), 83–92. doi:10.1080/17429145.2020.1748732
Vázquez, D., Andrés Berger, G., Cuniberti, M., Bainotti, C., de Miranda, M. Z., Scheerenc, P. L., et al. (2012). Influence of cultivar and environment on quality of Latin American wheats. J. Cereal Sci. 56, 196–203. doi:10.1016/j.jcs.2012.03.004
Wang, H., Gao, J., and Hou, W. (2019). Quantitative attribution analysis of soil erosion in different geomorphological types in karst areas: Based on the geodetector method. J. Geogr. Sci. 29 (2), 271–286. doi:10.1007/s11442-019-1596-z
Wang, J. F., Li, X. H., Christakos, G., Liao, Y. L., Zhang, T., Gu, X., et al. (2010). Geographical detectors-based health risk assessment and its application in the neural tube defects study of the Heshun region, China. Int. J. Geogr. Inf. Sci. 24, 107–127. doi:10.1080/13658810802443457
Wang, J. F., and Xu, C. D. (2017). Geodetector: Principle and prospective. Acta Geogr. Sin. 72, 116–134. doi:10.11821/dlxb201701010
Wang, J. F., Zhang, T. L., and Fu, B. J. (2016). A measure of spatial stratified heterogeneity. Ecol. Indic. 67, 250–256. doi:10.1016/j.ecolind.2016.02.052
Wang, J., and Hu, Y. (2012). Environmental health risk detection with GeogDetector. Environ. Model. Softw. 33, 114–115. doi:10.1016/j.envsoft.2012.01.015
Wang, Y., and Frei, M. (2011). Stressed food – the impact of abiotic environmental stresses on crop quality. Agric. Ecosyst. Environ. 141 (3-4), 271–286. doi:10.1016/j.agee.2011.03.017
Wang, Y., Liu, C., Wang, Q., Qin, Q., Ren, H., and Cao, J. (2021). Impacts of natural and socioeconomic factors on PM2.5 from 2014 to 2017. J. Environ. Manag. 284, 112071. doi:10.1016/j.jenvman.2021.112071
Wu, Q., Hu, W., Wang, H., Liu, P., Wang, X., and Huang, B. (2021). Spatial distribution, ecological risk, and sources of heavy metals in soils from a typical economic development area, southeastern China. Sci. Total Environ. 780, 146557. doi:10.1016/j.scitotenv.2021.146557
Yang, H., Cao, W., Zhi, C., Li, Z., Bao, X., Ren, Y., et al. (2021). Evolution of groundwater level in the North China Plain in the past 40 years and suggestions on its overexploitation treatment. Geol. China 48 (4), 1142–1155. doi:10.12029/gc20210411
Zecevic, V., Knezevic, D., Boskovic, J., and Madic, M. (2009). Effect of genotype and environment on wheat quality. Genetika 41 (3), 247–253. doi:10.2298/gensr0903247z
Zhan, D., Kwan, M., Zhang, W., Yu, X., Meng, Bin., and Liu, Q. (2018). The driving factors of air quality index in China. J. Clean. Prod. 197, 1342–1351. doi:10.1016/j.jclepro.2018.06.108
Zhang, X., and Zhao, Y. (2018). Identification of the driving factors’ influences on regional energy-related carbon emissions in China based on geographical detector method. Environ. Sci. Pollut. Res. 25, 9626–9635. doi:10.1007/s11356-018-1237-6
Zhang, Y., He, Z., Ye, G., Zhang, A., and Maarten, V. G. (2004). Effect of environment and genotype on bread-making quality of spring-sown spring wheat cultivars in China. Euphytica 139, 75–83. doi:10.1007/s10681-004-2131-5
Zhao, C., He, M., Wang, Z., Wang, Y., and Lin, Q. (2009). Effects of different water availability at post-anthesis stage on grain nutrition and quality in strong-gluten winter wheat. C. R. Biol. 332, 759–764. doi:10.1016/j.crvi.2009.03.003
Keywords: wheat quality improvement, comprehensive strategy, winter wheat, geographical detector model, China
Citation: Zhang X, Ma X, Li Y and Ju H (2022) Geographical detector-based wheat quality attribution under genotype, environment, and crop management frameworks. Front. Environ. Sci. 10:1037979. doi: 10.3389/fenvs.2022.1037979
Received: 07 September 2022; Accepted: 10 October 2022;
Published: 24 October 2022.
Edited by:
Ghaffar Ali, Shenzhen University, ChinaReviewed by:
Endang Retno Wedowati, Universitas Wijaya Kusuma Surabaya, IndonesiaSawaid Abbas, University of the Punjab, Pakistan
Copyright © 2022 Zhang, Ma, Li and Ju. This is an open-access article distributed under the terms of the Creative Commons Attribution License (CC BY). The use, distribution or reproduction in other forums is permitted, provided the original author(s) and the copyright owner(s) are credited and that the original publication in this journal is cited, in accordance with accepted academic practice. No use, distribution or reproduction is permitted which does not comply with these terms.
*Correspondence: Xin Ma, maxin02@caas.cn