- Accounting School, Chongqing University of Technology, Chongqing, China
This study investigates the effect of the carbon emission trading scheme on a firm’s total factor productivity in China. With a sample from 2008 to 2019, applying the time-varying DID method, our empirical results reveal that the carbon emission trading scheme significantly improves a firm’s total factor productivity, which provides evidence for Porter’s hypothesis. Moreover, there are two channels through which the total factor productivity is impacted: the corporate green innovation channel and the resource allocation efficiency channel. Furthermore, the impact of the carbon emission trading scheme is more pronounced for private firms, and firms in the provinces with higher institutional development, lower environmental quality, and greater law enforcement of environmental protection tend to have larger total factor productivity. Our models survive numerous robustness checks.
1 Introduction
Nowadays, global warming is one of the biggest challenges all around the world, and it is highly correlated with the development of the global economy. After the implementation of the Tokyo Protocol, with the market mechanism, the concept of carbon emission reduction has developed sustainably, and the carbon emission trading scheme (ETS) has become extremely crucial for countries to control the carbon emission (Anderson and Di Maria, 2011; Lin and Jia, 2019; Hu et al., 2020). The European Union Emissions Trading Scheme (EUETS) is the most mature market for carbon emission, which not only encourages emission reduction of firms but also helps Europe transform into a low-carbon economy (Betz et al., 2006; Twomey et al., 2012).
As the biggest country of carbon emission in the world, China’s carbon emission achieved 10 billion tons in 2018, which accounted for 28% of the global carbon emission. At an early stage, China’s environmental regulation mainly consists of command-and-control; however, the effect on emission reduction is weak, and the cost is high and unsustainable (Tang et al., 2020a; Cai and Ye, 2020). Under the pressure of emission reduction, China tends to explore the market-based mechanism to reduce carbon emission. Compared with developed countries, the start of ETS in China is relatively late, but the development of ETS is relatively rapid. On 16th July 2021, the nation-wide ETS formally started, with 2,162 firms in the electric power industry being included in this system, which covers approximately 4.5 billion tons of carbon emission. The Chinese ETS has become the biggest carbon market in the world. China’s ETS pilot started in 2013 in seven provinces, namely, Shenzhen, Beijing, Shanghai, Guangdong, Tianjin, Hubei, and Chongqing; eight industries are involved: petrochemicals, paper, construction, electric power, chemical industry, nonferrous metal mining, metals, and air transport.
Numerous studies investigated the impact of the ETS in China, including air pollution reduction (Yan et al., 2020), electricity regulation (Zeng et al., 2018), fixed asset changes (Dong et al., 2022), carbon allowance allocation (Jin et al., 2020), carbon leakage (Yu et al., 2021), economic growth with low carbon transformation (Fan et al., 2016; Wang et al., 2019; Zhu et al., 2020), and regional carbon equality (Zhang S. et al., 2021). However, the impact of the ETS in China on a firm’s total factor productivity (TFP) has been ignored in the current literature, which is vital for the economic growth in the long run (Krugman, 1995). In recent years, the sustainable growth of China’s economy relies more and more on the improvement of productivity instead of the accumulation of inputs, which forces firms to accelerate the productivity (Islam et al., 2005; Jin et al., 2018). Thus, it is substantially important to explore the impact factor of a firm’s productivity, and China is experiencing a low-carbon transformation; thus, understanding the impact of emission reduction is crucial for China’s economic growth. As a result, taking the ETS as a quasi-natural experiment, this study attempts to investigate the impact of emission reduction in China on a firm’s TFP.
With a sample from 2008 to 2019, applying the time-varying DID method, our empirical results reveal that the carbon emission trading scheme significantly improves a firm’s total factor productivity, which provides evidence for Porter’s hypothesis. Moreover, there are two channels through which the total factor productivity is impacted: the corporate green innovation channel and the resource allocation efficiency channel. Furthermore, the impact of the carbon emission trading scheme is more pronounced for private firms, and firms in provinces with higher institutional development, lower environmental quality, and greater law enforcement of environmental protection tend to have larger total factor productivity.
This study contributes to current studies in the following aspects: first, we investigate the impact of ETS on TFP. Xiao et al. (2021) also studied their relationship, but our research focuses on corporate green innovation and resource allocation efficiency channels which were not examined in previous studies. Second, from the perspective of the econometric method, most studies concerning the ETS apply the DID approach (Xiao et al., 2021; Zhang and Wang, 2021; Sun et al., 2022), and these studies consider 2013 as the year of policy implementation. However, in reality, the year of policy implementation differs across different provinces; thus, this study uses time-varying DID to identify the impact of the ETS. Finally, the heterogeneity is considered. Xiao et al. (2021) investigated industrial heterogeneity, and we extend their research by examining the heterogeneity of corporate ownership and provincial difference.
The remainder of this study is organized as follows. Section 2 provides a brief review of the literature. Section 3 describes the research design. Section 4 analyzes the empirical results. Section 5 provides the robustness checks of our model. Finally, Section 6 concludes the study.
2 Literature review and hypothesis development
2.1 Literature review
The studies on the ETS have attracted a lot of academic attention; however, no consensus has been achieved. Some researchers show that the emission reduction conducted by environmental regulation not only increases corporate costs but also crowds out other production and profitable investment. Then, the emission reduction will eventually harm corporate profit (Jorgenson and Wilcoxen, 1990; Jaffe et al., 1995). Based on the data on the energy department in Germany, Rogge et al. (2011) found that the EUETS does not provide enough incentives for firms to innovate. Feng et al. (2017) also showed that the ETS significantly impedes corporate innovation, especially for firms in the non-environmental industry.
Opposite opinions are also found in the current literature. Porter and Vander Linde (1995) claimed that environmental regulation can stimulate corporate innovation, and this is also referred to as Porter’s hypothesis. Calel and Antoine Dechezleprêtre (2012) found that a firm’s green innovation improves by 10% due to the EUETS, and other patents are not crowded out. The same results are found in Ireland and China (Anderson et al., 2010; Lv and Bai, 2021). From the perspective of financial performance, Jarait and Maria (2016) proved that the profit is not affected by the EUETS, and the economic performance of German manufacturers has been improved (Lschel et al., 2018). Moreover, numerous studies have shown that the EUETS does not have a negative impact on a firm’s competitiveness (Demailly and Quirion, 2008; Joltreau and Sommerfeld, 2016). Lutz (2016) claimed that the EUETS is positively associated with TFP in Germany.
Numerous studies have investigated the impact of the ETS in China. Some findings show that a firm’s competitiveness, corporate excess return, and corporate performance are positively correlated with the ETS (Wen et al., 2020; Luo et al., 2021; Sun et al., 2022). Peng et al. (2021) found that the SO2 emissions trading pilot has a positive impact on a firm’s TFP. Xiao et al. (2021) found that the ETS can significantly improve TFP, and firm’s operating channel and the profitability capacity channel are investigated. Zhang Y. et al. (2022) showed that the ETS significantly improves the green development efficiency and regional carbon equality. Yu et al. (2021) found that the ETS has accelerated both the depth and breadth of outward direct investment from China.
2.2 Hypothesis development
Environmental problems exhibit negative externality, and regulation is needed for environmental governance to internalize the cost of externality. Dales (1968) proposed a public policy relating to pollution by using a market-based mechanism, which can adjust the negative externality of pollution. The market-based price system has more advantages in terms of lower pollution reduction cost and higher efficiency (Montgomery, 1972; Albrizio et al., 2017).
The ETS can improve a firm’s TFP in three aspects. First, from the perspective of cost, the ETS will stimulate firms to lower long-term emission costs in terms of low carbon technology transformation and higher resource utilization efficiency (Anderson et al., 2010; Feng et al., 2020). Traditional environmental regulation increases a firm’s production cost, and those policies rarely provide incentives for firms to innovate; thus, the regulation cost of firms cannot be cancelled out by corporate innovation, which, in turn, reduces the firm’s productivity (Tang et al., 2020b; Cai and Ye, 2020). On the contrary, the market-based ETS provides more flexibility, and firms can choose the amount of carbon emission by comparing the marginal cost of emission reduction and the carbon price, which significantly reduces the cost of regulation (Albrizio et al., 2017; Feng et al., 2020). Schmalensee and Stavins (2013) found that the regulation cost of the SO2 emissions trading pilot decreases by 15%–90% compared to traditional regulation policies.
Second, from the perspective of benefit, the establishment of the ETS has a positive impact on a firm’s income. First, firms with low carbon emission can benefit from selling their carbon emission quota. Second, firms are willing to invest more in green innovation due to the ETS, and this makes firms produce more green products and have higher environmental responsibilities, which causes two consequences. The first one is that the firm’s green products will have a higher value-added benefit and more consumers, which increases sales and profit (Xiao et al., 2021). The second one is that higher environmental responsibilities will attract more investors, which increases the firm’s market value (Wen et al., 2019; Zhang S. et al., 2021). Finally, governments provide more subsidies for firms participating in the ETS to encourage them in emission reduction, which significantly reduces the firm’s cost.
Finally, from the perspective of operational efficiency, the ETS will lead firms to make adjustments to their production and management (Luo et al., 2021). On one hand, the ETS stimulates firms to transform their way of production, and they tend to produce innovative products with low energy consumption, which, in turn, increases the TFP and the final production (Lutz, 2016). On the other hand, the ETS will lead firms to invest more in the capital with higher energy efficiency and reduce the investment in energy and labor force, which increases the total productivity.
Based on the aforementioned arguments, we propose the following hypothesis:
Hypothesis 1. ETS will improve a firm’s TFP.
3 Research design
3.1 Sample selection
This study selects listed firms from the Chinese stock market in the following industries: petrochemicals, paper, construction, electric power, nonferrous metal mining, metals, and air transport. The data on the firm’s green patents are obtained from the State Intellectual Property Office, and the other data are extracted from the China Stock Market and Accounting Research (CSMAR) database. Moreover, we excluded those firms marked ST and PT. Our final sample contains 652 firms and 4,394 observations, our dataset is unbalanced due to missing values, and the data are winsorized at the 1% and 99% levels.
3.2 Dependent variable
Our dependent variable is the TFP, and to measure it, we start with the Cobb–Douglas production function, which is presented as follows:
where Y denotes the output; L and K present the labor and the capital, respectively; and A is the productivity. We take the natural logarithm on both sides, and the following equation is obtained:
where
3.3 Independent variables
To identify the impact of the ETS, we construct a dummy variable
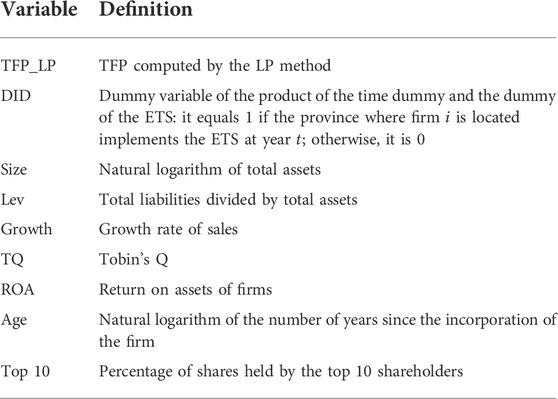
Based on the current studies, the following control variables are included in our model: firm size (Size), leverage ratio (Lev), corporate growth ability (Growth), Tobin’s Q (TQ), return on assets (ROA), firm’s age (Age), and equity concentration (Top 10). The detailed definition is given in Table 2. Moreover, industry- and year-fixed effects are controlled, and the interaction effect between the industry and year and the interaction effect between the province and year are also included.
3.4 Model specification
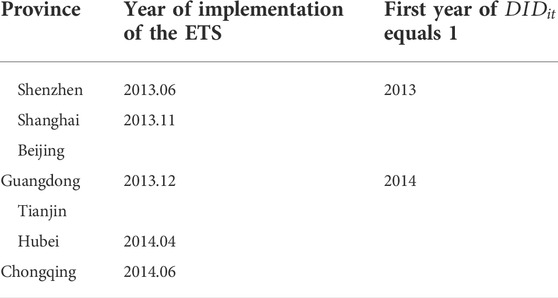
As we can see in Table 1, the implementation of the ETS differs across different provinces; thus, to better identify the impact of the ETS, the time-varying DID method is used in this study. Our model is specified as follows:
where
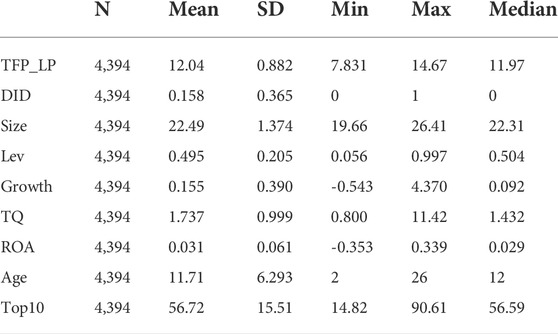
Table 3 shows the descriptive statistics, and it can be seen that the mean of
4 Empirical results
4.1 The impact of the ETS on a firm’s TFP
Table 4 shows the impact of the ETS on the TFP of firms; column 1 shows the impact of DID on TFP_LP without control variables, and all control variables are added in column 2. As we specified in Eq. 3, four other fixed effects are added as well.
Our empirical results show that the coefficients of DID in both columns are significantly positive, which means that the ETS and TFP_LP are positively correlated. The ETS can significantly improve the firm’s TFP, which is in line with our expectations and coincides with the conclusion of Lutz (2016) and Xiao et al. (2021), and we provide evidence for Porter’s hypothesis.
In terms of control variables, the coefficient of SIZE is significantly positive; thus, larger firms tend to have higher TFP. The coefficients of Growth and ROA are also positive, which shows that firms with higher profitability are likely to have funds to finance corporate innovation; thus, they are more productive. Firms with a higher age tend to have greater productivity since they may be featured with better corporate governance, which further helps improve the TFP. The coefficient of Top 10 is negative; thus, a larger equity concentration reduces the firm’s TFP.
4.2 Robustness of the baseline results
We conducted some sensitivity tests to check the robustness of our main findings.
4.2.1 Verifying the parallel trend assumption
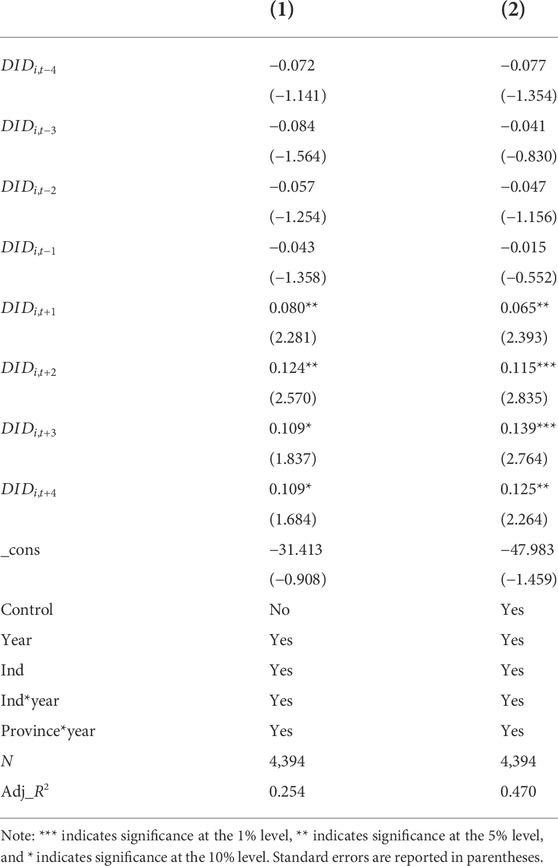
To verify the parallel trend assumption, we conducted a dynamic DID analysis, and the results are presented in Table 5. Our findings show that the impact of the ETS is not significant for the 4 years before the implementation of the ETS, which claims that the TFP of both treatment and control firms does not differ before the ETS. In addition, the impact of the ETS is significantly positive for the 4 years after the implementation of the ETS, which means that the ETS improves the firm’s TFP, and this improvement is maintained. Our results show that the parallel trend assumption is satisfied.
4.2.2 Alternative measures of variables
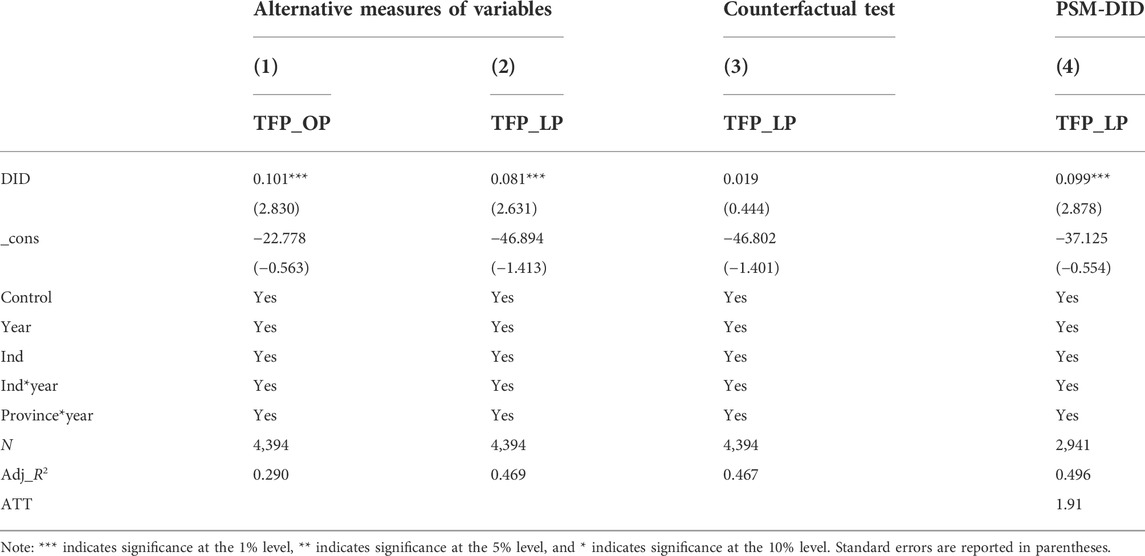
First, we use the OP method to recompute the TFP. More specifically, capital expenditure is used to measure corporate investment. Empirical results are reported in column 1 of Table 6, the coefficient of DID is significantly positive, which is in line with the results of TFP_LP, and the ETS can significantly improve the firm’s TFP.
Second, after the first seven provinces implemented the ETS, two other provinces also implemented the ETS in December 2016; thus, we added these two provinces to our baseline model. The results are reported in column 2 of Table 6, and the coefficient of DID is still significantly positive, which coincides with the results of Table 4.
4.2.3 Counterfactual test
We also conducted a counterfactual test. More specifically, we took the year of implementation of the ETS 3 years ahead, and the empirical results are presented in column 3 of Table 6. Industry- and year-fixed effects are controlled, and the interaction effect between the industry and year and the interaction effect between the region and year are also included.
From column 3 of Table 6, the coefficient of DID is positive but insignificant, which indicates that the impact of the ETS on the firm’s TFP is statistically insignificant if the year of implementation of the ETS is 3 years ahead. This coincides with our expectation that the improvement of the firm’s TFP is due to the implementation of the ETS.
4.2.4 Propensity score matching method
The characteristics of firms in the province with the ETS may differ from those in the province without the ETS. To overcome the sample selection problem, we used the propensity score matching (PSM) method to form a treatment group and a control group. The results are shown in column 4 of Table 6, where the ATT value is significant at a 10% level, and the coefficient of DID is significantly positive; thus, the PSM-DID method also provides the same result that the ETS significantly improves the TFP.
5 Mechanism analysis
Our findings show that the ETS can significantly improve a firm’s TFP, and these findings survive numerous robustness checks. This section will further investigate the channels through which the TFP is impacted.
5.1 Corporate green innovation
As Porter’s hypothesis states, environmental regulation can stimulate corporate innovation, and it will reduce the cost of firms by energy saving and quality improvement, which will further improve corporate competitiveness (Porter and VanderLinde, 1995). The ETS internalize the environmental externality into the firm’s cost. Thus, to save the quota of carbon emission, firms tend to innovate for emission and production cost reduction. Thus, corporate green innovation will increase (Feng et al., 2020). Meanwhile, the government will provide sustainably dynamic economic incentives (Perman et al., 2011), and firms with green innovation may sell quotas for extra benefits, which, in turn, stimulates the R&D in green technology (Feng et al., 2020). Moreover, the ETS is a market-based environmental regulation, and involved firms can easily obtain information on green technology. This largely decreases the risk of corporate innovation, and it also helps firms apply green innovation into production practice; thus, the ability of corporate green innovation will be enhanced (Feng et al., 2020). As a result, corporate green innovation has a mediation effect between the ETS and the firm’s TFP.
To measure corporate green innovation, we used the green patents (patent) applied by listed firms. Following Sobel (1982) and Baron and Kenny (1986), the three-step regression procedure was used, and the following regressions were estimated:
Empirical results are reported in columns 1 and 2 of Table 7. Column 1 shows that the coefficient of DID is 0.145 with a significance level of 10%, which reveals that the green patents increase by 14.5% after the ETS. Our findings are consistent with those of Anderson et al. (2010) and Lv and Bai (2021). Column 2 shows that the coefficients of the patent and DID are both significantly positive; thus, green innovation has a partial mediation effect. In addition, the Sobel test also proves that the mediation effect of the patent is significant.
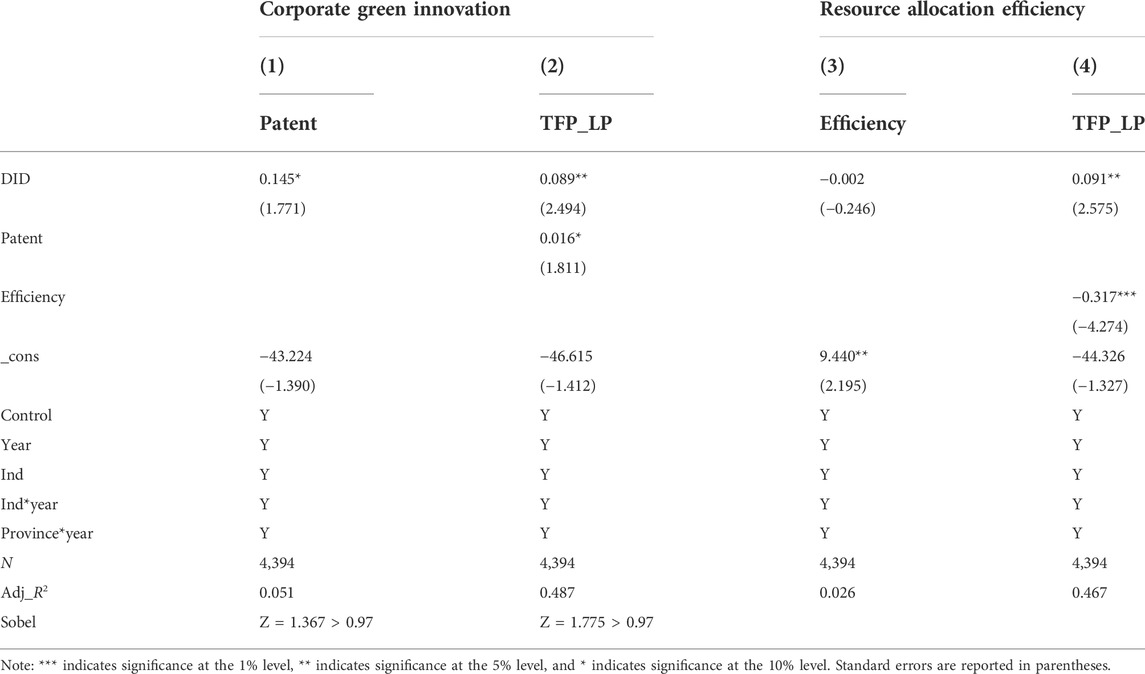
TABLE 7. Regression results for the corporate green innovation channel and the resource allocation efficiency channel.
5.2 Resource allocation efficiency
The ETS will lead technology and fund low-carbon firms. Then, the quota of carbon emission will flow from firms with high pollution to firms with low pollution, and production factors will flow from less-productive firms to more-productive firms; thus, firms with high productivity will obtain more production resources. Moreover, firms with high emission will face high environmental costs under the ETS, and considering emission reduction cost and economic profit, firms will tend to reallocate the production factors, and they will invest more in sectors with clean technology and high efficiency (Brandt and Biesebroeck, 2009; Klenow and Hsieh, 2009), which will further improve the TFP of firms (Feng et al., 2020).
We applied the investment efficiency proposed by Richardson (2006) to measure the resource allocation efficiency. The investment efficiency is defined as the difference between the actual investment level and the expected investment level of firms, which is estimated as follows:
where
Following Sobel (1982) and Baron and Kenny (1986), the three-step regression procedure was used, and the following regressions were estimated:
Empirical results are reported in columns 3 and 4 of Table 7. Column 3 shows that the coefficient of DID is negative but insignificant. Column 4 shows that the coefficients of efficiency and DID are both significant. Moreover, the Z-statistics of the Sobel test is greater than 0.97, which proves that the mediation effect of efficiency is significant.
6 Heterogeneity analysis
This section will further investigate the heterogeneity in terms of corporate ownership and provincial difference.
6.1 Corporate ownership
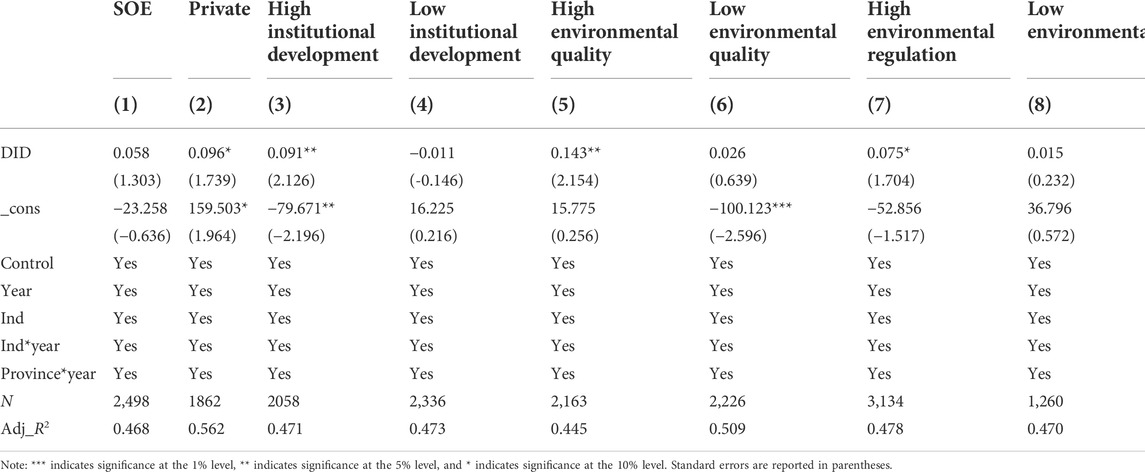
In the Chinese stock market, there are numerous state-owned companies (SOEs), and compared with private firms, their reaction to the ETS differs. First, SOEs undertake social and political burdens; thus, they are less sensitive and less active in facing environmental regulations and innovation incentives (Peng et al., 2021). Second, SOEs are less motivated to improve the efficiency; thus, it is more difficult for them to reform. Thus, the impact of the ETS will be more pronounced for private firms. Empirical results are presented in columns 1 and 2 of Table 9. Our findings show that the impact of the ETS is significantly positive for private firms, whereas it is insignificant for SOEs.
6.2 Provincial difference
6.2.1 Institutional development
The impact of the ETS is highly correlated with the provincial development of institutions. When institutions are more developed, the ETS will also be more market-oriented, and transaction cost due to information asymmetry will decrease; thus, the efficiency of transactions will be greater. To measure institutional development, following Zhang et al. (2022), we used the National Economic Research Institute (NERI) marketization index proposed by Wang et al. (2018). Furthermore, we split the sample into two subsamples, one containing provinces whose NERI index is greater than the mean of the NERI index for all provinces and the other one containing provinces whose NERI index is lower than their mean value. Empirical results are presented in columns 3 and 4 of Table 9. The impact of the ETS is significantly positive in the subsample with a higher NERI index; however, this impact is insignificant in the subsample with a lower NERI index. Thus, the impact of the ETS is greater in provinces with higher institutional development.
6.2.2 Provincial environmental quality
Provincial environmental quality has a great impact on the policy effect of the ETS. In the provinces with low environmental quality and high pollution, the enforcement of environmental regulation is much higher, and the environmental cost of firms is larger. Thus, firms in these provinces are more motivated by green technology and green production. As a result, the impact of the ETS will be more pronounced for provinces with lower environmental quality. To measure the environmental quality, we used the CO2 emission per person of each province from 2008 to 2012. More specifically, provinces whose CO2 emission is above the median are classified as provinces with low environmental quality; otherwise, they are provinces with high environmental quality. Precise provinces are detailed in Table 8. Empirical results are reported in columns 5 and 6 of Table 9. The impact of the ETS is significantly positive in provinces with low environmental quality and insignificant in provinces with high environmental quality.
6.2.3 Enforcement of environmental regulation
The enforcement of environmental regulation maintains the function of the ETS. Enhanced enforcement of environmental regulation increases the cost of breaking laws, and then, it decreases the likelihood of exerting illegal emission for firms; thus, the system of the ETS can be well implemented. We used the number of environmental punishments to measure the enforcement of environmental regulation. The data were collected from the China Environment Yearbook. Furthermore, we split the sample into two subsamples, one containing provinces whose number of environmental punishments is greater than the mean of environmental punishments for all provinces and the other one containing provinces whose number of environmental punishments is lower than their mean value. Empirical results are presented in columns 7 and 8 of Table 9. The impact of the ETS is significantly positive in the subsample with more environmental punishments; however, this impact is insignificant in the subsample with fewer environmental punishments. Thus, the impact of the ETS is greater in provinces with higher enforcement of environmental regulation.
7 Conclusion
This study investigates the impact of the ETS on a firm’s TFP using the time-varying DID method. Our empirical results found that the ETS can significantly improve the TFP of firms, and these findings are consistent after numerous robustness checks.
Moreover, we further tested two channels through which the TFP is impacted: the corporate green innovation channel and the resource allocation efficiency channel. Our findings showed that both channels exist. On one hand, the ETS stimulates the firm’s green innovation, and the green innovation reduces the firm’s cost, which further improves the productivity of firms; on the other hand, the ETS improves resource allocation efficiency, production factors flow to sectors with high efficiency and clean technology, and then, the TFP of firms improved.
In addition, we analyzed the heterogeneity. First, in terms of corporate ownership, the impact of the ETS is significantly positive for private firms, whereas this impact is insignificant for SOEs. Moreover, from the perspective of regional differences, the impact of the ETS is more pronounced in provinces with more development of institutions, lower environmental quality, and higher enforcement of environmental regulation.
Data availability statement
Publicly available datasets were analyzed in this study. These data can be found at: CSMAR.
Author contributions
BW contributed to the conception and design of the study, MY organized the database and performed the statistical analysis, and XZ wrote the first draft of the manuscript.
Funding
This research is financially supported by the National Social Science Foundation of China (Grant No. 21BJY123) and The Humanities and Social Sciences Research Project of Chongqing Municipal Education Commission (Grant No. 21SKGH188).
Conflict of interest
The authors declare that the research was conducted in the absence of any commercial or financial relationships that could be construed as a potential conflict of interest.
Publisher’s note
All claims expressed in this article are solely those of the authors and do not necessarily represent those of their affiliated organizations, or those of the publisher, the editors, and the reviewers. Any product that may be evaluated in this article, or claim that may be made by its manufacturer, is not guaranteed or endorsed by the publisher.
References
Albrizio, S., Kozluk, T., and Zipperer, V. (2017). Environmental policies and productivity growth: Evidence across industries and firms. J. Environ. Econ. Manag. 813, 209–226. doi:10.1016/j.jeem.2016.06.002
Anderson, B., Convery, F., and Maria, C. D. (2010). Technological change and the EU ETS: The case of Ireland. Ssrn Electron. J., 216.
Anderson, B., and Di Maria, C. (2011). Abatement and allocation in the pilot phase of the EU ETS. Environ. Resour. Econ. (Dordr). 48, 83–103. doi:10.1007/s10640-010-9399-9
Baron, R. M., and Kenny, D. A. (1986). The moderator–mediator variable distinction in social psychological research: Conceptual, strategic, and statistical considerations. J. personality Soc. Psychol. 51 (6), 1173–1182. doi:10.1037/0022-3514.51.6.1173
Betz, R., Rogge, K., and Schleich, J. (2006). EU emissions trading: An early analysis of national allocation plans for 2008–2012. Clim. Policy 6 (4), 361–394. doi:10.1080/14693062.2006.9685608
Brandt, L., Biesebroeck, J., and Zhang, Y. (2009). Creative accounting or creative destruction? Firm-level productivity growth in Chinese manufacturing. J. Dev. Econ. 97, 339–351. doi:10.1016/j.jdeveco.2011.02.002
Cai, W., and Ye, P. (2020). How does environmental regulation influence enterprises' total factor productivity? A quasi-natural experiment based on China's new environmental protection law. J. Clean. Prod. 276, 124105. doi:10.1016/j.jclepro.2020.124105
Calel, R., and Antoine, Dechezleprêtre (2012). Environmental policy and directed technological change: Evidence from the European carbon market. Rev. Econ. Stat. 98 (1), 173–191. doi:10.1162/rest_a_00470
Dales, J. H. J. E. E. P. (1968). Pollution, property and prices: An essay in policy-making and economics.
Demailly, D., and Quirion, P. (2008). European emission trading scheme and competitiveness: A case study on the iron and steel industry. Energy Econ. 30 (4), 2009–2027.
Dong, H., Liu, W., Liu, Y., and Xiong, Z. (2022). Fixed asset changes with carbon regulation: The cases of China. J. Environ. Manag. 306, 114494. doi:10.1016/j.jenvman.2022.114494
Eugénie, Joltreau, and Sommerfeld, K. (2016). Why does emissions trading under the EU ETS not affect firms' competitiveness? Empirical findings from the literature. Rochester, United States: Social Science Electronic Publishing.
Fan, Y., Wu, J., and Xia, Y. (2016). How will a nationwide carbon market affect regional economies and efficiency of CO2 emissions reduction in China? China Econ. Rev. 38, 151–166.
Feng, C., Shi, B., and Kang, R. (2017). Does environmental policy reduce enterprise innovation?—evidence from China. Sustainability 9 (6), 872. doi:10.3390/su9060872
Feng, Y., Chen, S., and Failler, P. (2020). Productivity effect evaluation on market-type environmental regulation: A case study of SO2 emission trading pilot in China. Int. J. Environ. Res. Public Health 17 (21), 8027. doi:10.3390/ijerph17218027
Hu, Y., Ren, S., Wang, Y., and Chen, X. (2020). Can carbon emission trading scheme achieve energy conservation and emission reduction? Evidence from the industrial sector in China. Energy Econ. 85, 104590. doi:10.1016/j.eneco.2019.104590
Islam, N., Dai, E., and Sakamoto, H. (2005). Role of TFP in China's growth. Asian Econ. J. 20, 127–159. doi:10.1111/j.1467-8381.2005.00208.x-i1
Jaffe, A. B. (1995). Environmental regulation and the competitiveness of U.S. Manufacturing: What does the evidence tell us? J. Econ. Literature 33 (1), 132–163.
Jarait, J., and Maria, C. D. (2016). Did the EU ETS make a difference? An empirical assessment using Lithuanian firm-level data. Cere Work. Pap. 37 (1). doi:10.5547/01956574.37.2.jjar
Jin, L., Mo, C., Zhang, B., and Yu, B. (2018). What is the focus of structural reform in China?—comparison of the factor misallocation degree within the manufacturing industry with a unified model. Sustainability 10, 4051. doi:10.3390/su10114051
Jin, Y., Liu, X., Chen, X., and Dai, H. (2020). Allowance allocation matters in China’s carbon emissions trading system. Energy Econ. 92, 105012. doi:10.1016/j.eneco.2020.105012
Jorgenson, D. W., and Wilcoxen, P. J. (1990). Environmental regulation and US economic growth. Rand J. Econ. 21, 314–340. doi:10.2307/2555426
Kemp, R., Arundel, A., and Smith, K. (2002). “Survey indicators for environment innovation,” in Paper Presented to Conference Towards Environment Innovation Systems in Garmisch-Partenkirchen.
Klenow, P., and Hsieh, C. T. (2009). Misallocation and manufacturing TFP in China and India. Q. J. Econ. 124, 1403–1448. doi:10.1162/qjec.2009.124.4.1403
Levinsohn, J., and Petrin, A. (2003). Estimating production functions using inputs to control for unobservables. Rev. Econ. Stud. 70 (1), 317–341. doi:10.1111/1467-937x.00246
Lin, B., and Jia, Z. (2019). What will China's carbon emission trading market affect with only electricity sector involvement? A cge based study. Energy Econ. 78, 301–311. doi:10.1016/j.eneco.2018.11.030
Lschel, A., Lutz, B. J., and Managi, S. (2018). The impacts of the EU ETS on efficiency: An empirical analyses for German manufacturing firms. Resour. Energy Econ. 56, 71–95. doi:10.1016/j.reseneeco.2018.03.001
Luo, Y., Li, X., Qi, X., and Zhao, D. (2021). The impact of emission trading schemes on firm competitiveness: Evidence of the mediating effects of firm behaviors from the guangdong ETS. J. Environ. Manag. 290 (5), 112633. doi:10.1016/j.jenvman.2021.112633
Lutz, B. J. (2016). Emissions trading and productivity: Firm-level evidence from German manufacturing. ZEW-Centre for European Economic Research Discussion Paper.
Lv, M., and Bai, M. (2021). Evaluation of China's carbon emission trading policy from corporate innovation. Finance Res. Lett. 39, 101565. doi:10.1016/j.frl.2020.101565
Montgomery, W. D. (1972). Markets in licenses and efficient pollution control programs. J. Econ. Theory 5, 53395–53418. doi:10.1016/0022-0531(72)90049-x
Olley, G. S., and Pakes, A. (1996). The dynamics of productivity in the telecommunications equipment industry. Econometrica 64 (6), 1263–1297. doi:10.2307/2171831
Peng, J., Xie, R., Ma, C., and Fu, Y. (2021). Market-based environmental regulation and total factor productivity: Evidence from Chinese enterprises. Econ. Model. 95, 394–407. doi:10.1016/j.econmod.2020.03.006
Perman, R., Ma, Y., McGilvray, J., and Common, M. (2011). Natural resource and environmental economics. Am. J. Agric. Econ. 322, 195–210.
Porter, M. E., and Van der Linde, C. (1995). Toward a new conception of the environment-competitiveness relationship. J. Econ. Perspect. 9 (4), 97–118. doi:10.1257/jep.9.4.97
Richardson, S. (2006). Over-investment of free cash flow. Rev. Acc. Stud. 11 (2-3), 159–189. doi:10.1007/s11142-006-9012-1
Rogge, K. S., Schneider, M., and Hoffmann, V. H. (2011). The innovation impact of the EU emission trading system—findings of company case studies in the German power sector. Ecol. Econ. 70 (3), 513–523. doi:10.1016/j.ecolecon.2010.09.032
Schmalensee, R., and Stavins, R. N. (2017). The design of environmental markets: What have we learned from experience with cap and trade? Oxf. Rev. Econ. Policy 33 (4), 572–588. doi:10.1093/oxrep/grx040
Sobel, M. E. (1982). “Asymptotic confidence intervals for indirect effects in structural equation models,” in Sociological methodology. Editor Samuel Leinhardt (San Francisco: Jossey-Bass), 290–312.
Sun, R., Wang, K., Wang, X., and Zhang, J. (2022). China's carbon emission trading scheme and firm performance. Emerg. Mark. Finance Trade 58 (3), 837–851. doi:10.1080/1540496x.2021.1925535
Tang, H., Liu, J. M., and Wu, J. G. (2020a). The impact of command-and-control environmental regulation on enterprise total factor productivity: A quasi-natural experiment based on China's "two control zone" policy. J. Clean. Prod. 254, 120011. doi:10.1016/j.jclepro.2020.120011
Tang, H., Liu, J., Mao, J., and Wu, J. g. (2020b). The effects of emission trading system on corporate innovation and productivity-empirical evidence from China’s SO2 emission trading system. Environ. Sci. Pollut. Res. 27 (17), 21604–21620. doi:10.1007/s11356-020-08566-x
Twomey, P., Betz, R., and Macgill, I. (2012). Achieving additional emission reductions under a cap-and-trade scheme. Clim. Policy 12 (4), 424–439. doi:10.1080/14693062.2011.649591
Wang, H., Chen, Z., Wu, X., and Nie, X. (2019). Can a carbon trading system promote the transformation of a low-carbon economy under the framework of the porter hypothesis?—empirical analysis based on the PSM-DID method. Energy Policy 129, 930–938. doi:10.1016/j.enpol.2019.03.007
Wang, X. L., Fan, G., and Hu, L. P. (2018). NERI index of marketization of China's provinces: 2018 report. Beijing: Social Sciences Academic Press.
Wen, F., Wu, N., and Gong, X. (2020). China's carbon emissions trading and stock returns. Energy Econ. 86, 104627. doi:10.1016/j.eneco.2019.104627
Xiao, J., Li, G., Zhu, B., Xie, L., Hu, Y., and Huang, J. (2021). Evaluating the impact of carbon emissions trading scheme on Chinese firms’ total factor productivity. J. Clean. Prod. 306, 127104. doi:10.1016/j.jclepro.2021.127104
Yan, Y., Zhang, X., Zhang, J., and Li, K. (2020). Emissions trading system (ETS) implementation and its collaborative governance effects on air pollution: The China story. Energy Policy 138, 111282. doi:10.1016/j.enpol.2020.111282
Yu, P., Cai, Z., and Sun, Y. (2021). Does the emissions trading system in developing countries accelerate carbon leakage through OFDI? Evidence from China. Energy Econ. 101, 105397. doi:10.1016/j.eneco.2021.105397
Zeng, Y., Weishaar, S. E., and Vedder, H. H. (2018). Electricity regulation in the Chinese national emissions trading scheme (ETS): Lessons for carbon leakage and linkage with the EU ETS. Clim. Policy 18 (10), 1246–1259. doi:10.1080/14693062.2018.1426553
Zhang, S., Wang, Y., Hao, Y., and Liu, Z. (2021). Shooting two hawks with one arrow: Could China’s emission trading scheme promote green development efficiency and regional carbon equality? Energy Econ. 101, 105412. doi:10.1016/j.eneco.2021.105412
Zhang, X., Zhang, Z., and Zhou, H. (2022). Grabbing hand or financial constraint mitigation effect? A reexamination of the relationship between institutional development and cash holdings. Account. Finance 00, 1–25. doi:10.1111/acfi.12928
Zhang, Y., Chen, Y., Wu, Y., and Zhu, P. (2022). Investor attention and carbon return: Evidence from the EU-ETS. Economic Research-Ekonomska Istraživanja 35 (1), 709–727. doi:10.1080/1331677X.2021.1931914
Zhang, Y. J., and Wang, W. (2021). How does China's carbon emissions trading (CET) policy affect the investment of CET-covered enterprises? Energy Econ. 98, 105224. doi:10.1016/j.eneco.2021.105224
Keywords: carbon emission trading scheme, total factor productivity, green innovation, resource allocation efficiency, time-varying DID method
Citation: Wang B, Yang M and Zhang X (2022) The effect of the carbon emission trading scheme on a firm’s total factor productivity: An analysis of corporate green innovation and resource allocation efficiency. Front. Environ. Sci. 10:1036482. doi: 10.3389/fenvs.2022.1036482
Received: 04 September 2022; Accepted: 18 October 2022;
Published: 11 November 2022.
Edited by:
Xiaowei Chuai, Nanjing University, ChinaReviewed by:
Xiaojun Deng, Zhejiang University of Finance and Economics, ChinaLiang Zhenmin, Shanghai University of International Business and Economics, China
Copyright © 2022 Wang, Yang and Zhang. This is an open-access article distributed under the terms of the Creative Commons Attribution License (CC BY). The use, distribution or reproduction in other forums is permitted, provided the original author(s) and the copyright owner(s) are credited and that the original publication in this journal is cited, in accordance with accepted academic practice. No use, distribution or reproduction is permitted which does not comply with these terms.
*Correspondence: Maojia Yang, Y3F5bWpAc3R1LmNxdXQuZWR1LmNu; Xiang Zhang, emhhbmd4aWFuZ0BjcXV0LmVkdS5jbg==
 Bo Wang
 Xiang Zhang