
94% of researchers rate our articles as excellent or good
Learn more about the work of our research integrity team to safeguard the quality of each article we publish.
Find out more
ORIGINAL RESEARCH article
Front. Environ. Sci. , 09 December 2022
Sec. Environmental Economics and Management
Volume 10 - 2022 | https://doi.org/10.3389/fenvs.2022.1036300
 Rabnawaz Khan1*
 Weiqing Zhuang1*Omaid Najumddin1Rehan Sohail Butt2Ilyas Ahmad3Mamdouh Abdulaziz Saleh Al-Faryan4
Energy consumption has become a necessity in today’s world, and economies in developing nations cannot thrive without it. Countries with less developed economies face the same challenges of achieving sustained economic growth as those with more advanced economies. Herein, we examine the environmental Kuznets curve (EKC) hypothesis by looking at the interplay between GDP growth, energy use, agricultural output, and the effects of carbon dioxide (CO2) emissions. From 1991 to 2016, we used panel and quantile regression analyses to compare emissions in nine developing countries with those in 13 developed countries. There is the beginning of a reverse U-shaped relationship between agricultural energy use and greenhouse gas emissions. As a result, the verified EKC hypothesis paves the way for a watershed moment in the progress of industrialized nations’ economies. The estimated results of agriculture have a favorable impact on CO2 emissions by 15.16 percent but a negative influence of 2.92 percent on CO2 emissions from using liquid fuels, leading to more severe environmental deterioration. Additionally, in developing countries, feed cropping, deforestation, biomass burning, and deep soil and cropping all have detrimental consequences on the ecosystem. There is a negative correlation between CO2 emissions and economic growth in developing countries and their energy consumption. Although the EKC hypothesis for CO2 emissions was rejected at lower quantiles, it was validated for Qatar, Canada, China, and other high-emitting economies according to the empirical estimation of quantile regression. The findings of this study have important policy implications for reducing carbon dioxide emissions, suggesting that policymakers account for the stage of economic growth currently being experienced when formulating measures to cut energy use and protect the environment. Possible solutions to mitigate environmental degradation include enactment of policies to reduce energy consumption.
Both in developing and developed nations, the link between economic growth and CO2 emissions remains debatable and doubtful. Economies can use this correlation to develop policies for managing energy consumption and advancing their secure energy resources (Gnangoin et al., 2022; Shahbaz et al., 2022; Tutak and Brodny, 2022; Xia et al., 2022). This study measures countries’ economic growth based on their agricultural sector, cereal yield, renewable energy, manufacturing, and commerce. Quantile regression techniques with panel data have not been studied in this field, despite the fact that a number of recent studies have performed in-depth analyses of the relationship between economic growth and CO2 emissions (Liu H. et al., 2022; Raghutla et al., 2022). The current environmental Kuznets curve (EKC) theory suggests that economic growth is associated with a decline in environmental effectiveness (Bradley, 2021; Liu Z. et al., 2022). Consequently, there is less concern for the profound exhaustion of oil or magnesium and more concern for air quality, global warming, and the divine emanations of mechanical and industrial production.
Greenhouse gas emissions are a problem in many countries, and modern agriculture is a major contributor. In many developing countries, agriculture is now the leading source of CO2 emissions. In particular, unsustainable agricultural practices—such as bush burning, deforestation, and the burning of biomass fuel—account for 21% of the world’s greenhouse gas emissions and are responsible for the oxidation of organic compounds in soil. Soil organic compounds from cultivated land can mitigate environmental CO2 emissions from agricultural production and modification. In this light, both developing and developed nations need to investigate the connection between rising agricultural output and increasing carbon dioxide emissions (Han et al., 2022). Quantile regression and the EKC hypothesis examined how economic growth impacts agricultural output and energy consumption. However, agriculture is essential for several other reasons, including non-oil exports, food security, and foreign exchange. It plays an important part in a growing economy, as evidenced by its share of total energy consumption as measured by gross national product per capita and its presence in the manufacturing and commercial sectors (Koondhar et al., 2021; Pakrooh et al., 2021). By expanding and improving its spending on sustainable development, the country can lessen its carbon footprint and make its infrastructure more resilient to climate change (Kocak and Alnour, 2022). Several concepts related to CO2 emissions have been investigated using the environmental Kuznets curve (EKC). The EKC, which promotes rapid economic expansion at the price of environmental sustainability, is not the best growth path for developing countries (Balsalobre-Lorente et al., 2021; Beyene, 2022). The U-shaped environmental Kuznets curve (EKC) shows that environmental degradation is proportional to income, rising as income rises due to agricultural output and falling once income is no longer a constraint (Liu and Lai, 2021), but if trade policies and economic growth are coordinated, the energy sector will benefit. Keeping the economy growing at its current rate is not conducive to protecting the environment (Leal and Marques, 2020). A large amount of production in emerging economies travels to fulfill consumption in wealthy countries, contributing to the renowned carbon leakage problem and the embedded carbon emissions in exports not mentioned in the production-based emission accounting.
Agriculture accounted for 16.5 billion tons of the world’s total agri-food production in 2019, making it a substantial contributor to greenhouse gas emissions and carbon dioxide emissions in developed economies due to its reliance on fossil fuels for its energy demands (UN, 2021). Although agricultural output fell by 2% a decade ago, GHG emissions from farms increased to 582 million metric tons in 2017. Nonetheless, farmers help with CO2 emission confiscation efforts through reforestation, wetland restoration, grassland preservation, and eliminating greenhouse gases (Aguilera et al., 2021). The most important takeaway from this research was identifying issues and CO2 emissions associated with using liquid fuels in developing and developed nations’ agricultural, industrial, and commercial sectors. In addition, the existing hypothesis and economic factors in the 22 countries influence the income-induced EKC emissions from agriculture. This study hypothesized that agriculture production in developing countries would be more integrated than in developed countries. In addition, the liquid consumption of developing (Brazil, Argentina, Mexico, and Malaysia) countries is growing due to agricultural and industrial production, while the intensity level of CO2 emissions in developed (the Netherlands, Germany, and Canada) and developing (Russia, Qatar, and Malaysia) countries is higher. Agricultural goods’ production and consumption trends in developing and developed countries are compared, as are the inputs required to produce these goods. Agricultural output was evaluated across a wide range of cereals, including wheat, rice, maize, and more. From a global perspective, nine developing countries and 13 developed countries are analyzed for their CO2 emissions and liquid fuel consumption in the agriculture sector, with maize being the most intensively studied crop and grain being the least.
Produced and consumed agricultural goods in developing and developed countries are compared in terms of output and input patterns. It was a gauge of grain production in the agricultural sector overall. Carbon dioxide emissions are measured in terms of agricultural output in both developing and developed countries (see Figure 1). There was a noticeable decrease in the expected results across all commodities, with the cereal output growth rate being the most noticeable. CO2 emissions associated with farming and grain harvesting are shown in Figure 2. Using the estimated values for agriculture (AGR) and cereal (CY), we first calculated the sum of ARG and CY for whole years, and then we divided that number by the total number of developing and developed countries’ sum of ARG and CY values. This allowed us to determine the actual percentage of individual countries in Figure 2 and Figure 3, and it allowed us to examine the highest influence of explanatory variables with percentages. The highest combined AGR and CY growth rate is %. China has the highest cereal yield (in kilograms per hectare) among developing countries due to its high value-added agriculture, forestry, and fishing. In addition, 45 percent of agricultural output is the root of 23 percent of C-LF. Furthermore, Turkey has the highest AGR production at 6%, including 2% each of C-LF and C-EM (Yu et al., 2020; Yang et al., 2021b; Le, 2022).
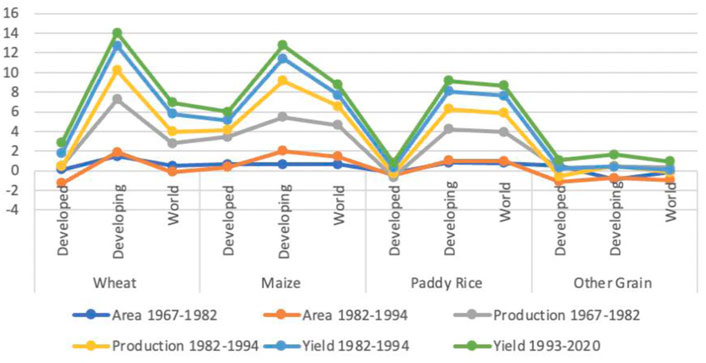
FIGURE 1. Agriculture productions. Source: http://www.fao.org/3/x9447e07.htm#Notep.
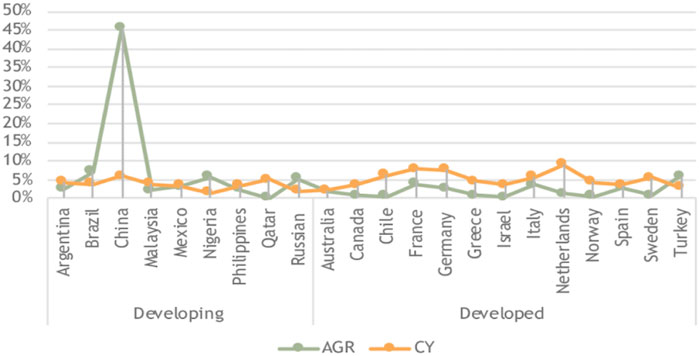
FIGURE 2. Carbon emissions with agriculture and cereal production.
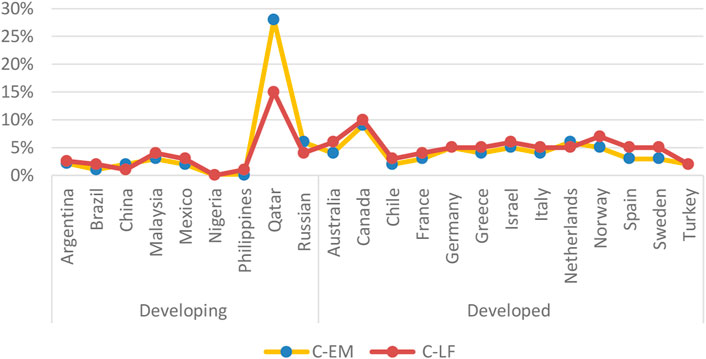
FIGURE 3. CEM of developing and developed countries.
There has been conflicting evidence from previous research on the EKC’s effect on agricultural output. No clear distinction can be made between the CO2 emissions emitted by agriculture production and the emissions stimulated by the various methods of cultivation practice and new mechanical strategies because not enough research has been carried out to identify and examine the impact of environmental degradation on agriculture, industries, and trade (Xu D. et al., 2022; Gaies et al., 2022; Jiang et al., 2022). The EKC development method was refined on the back of a wealth of clean data, an abundance of serious resources, and a massive natural windfall; as a result, it is a model that other developing countries should emulate (Wang et al., 2021a; Chen et al., 2022). The peak energy of intensity theory states that energy rises during industrialization, reaches a peak, and then declines, as borne out by CO2 emissions and the EKC. According to the Sun, a carbon emission EKC peak occurred due to abnormal economic and development growth only in developing countries (Mardani et al., 2019; Yang et al., 2021a; Yirong, 2022).
A portion of the literature investigates the relationship between the EKC and national income and greater environmental quality and their effects on developed and developing nations (Balado-Naves et al., 2018; Balsalobre-Lorente et al., 2021). The EKC starting point revealed an inverted U-shaped relationship between per capita income and energy intensity in developing countries, and the error correction model identified CO2 emissions (Rashid Gill et al., 2018; Ben Cheikh et al., 2021). By looking at the data and using the existing EKC hypothesis, it was found that developed countries have less inequality than developing countries (Farooq et al., 2022). The evidence of the inverted U hypothesis, concerning the relationship between economic growth and inequality, contradicts the hypothesis. It indicates that income inequality was greater in developing nations than in developed nations, but after a certain point, economic growth will reduce environmental pressure (Akram et al., 2020; Liu and Lai, 2021; Tenaw and Beyene, 2021). We examine how agricultural output affects the EKC, GDP growth, CO2 emissions, and energy consumption. CEM (C-EM and C-LF) is depicted in Figure 3; as a developing country, the highest carbon emission is recorded in Qatar, which accounts for 28% of C-EM and 15% of C-LF, while a developed country such as Canada accounts for 9% of C-EM and 10% of C-LF (Xu G. et al., 2019). The lowest C-EM and C-LF are recorded in Nigeria and Turkey in developing and developed countries (Billig et al., 2019; Hao et al., 2020; Shabani et al., 2021). Due to CO2 spillage issues and the need to enclose CO2 emissions, a sizable portion of the developing world’s economic output is met by the generation sector (Amin et al., 2020; Jiang et al., 2021). In this study, we looked at 22 different nations and disentangled the growth in CO2 emissions from the expansion of agricultural production and the use of machinery in the field. This implication will aid in shifting the focus of governments and private organizations in developing and developed nations toward effective measures to curb carbon dioxide (CO2) emissions (Lee et al., 2023).
Earlier research has shown a growing interest in the intersection of agricultural products, industrial output, trade, and energy efficiency for both the developed and developing worlds. Three distinct categories may be drawn from the literature on economic growth as affected by agricultural output, commercial activity, industrial output, and ecological factors. The first set of studies examined how economic expansion affects environmental quality using the well-established EKC hypothesis of an inverse U-shaped link between economic expansion and environmental degradation. At first (Rashid Gill et al., 2018), we considered the “grow now and clean later” idea while discussing the significance of the EKC hypothesis to the global environmental crisis. Governments should create a unique policy for renewable energy by taxing fossil fuels and subsidizing green alternatives to reduce pollution levels. Growing first and cleaning up later was an idea explored by Rashid Gill et al. (2018) as a solution to the world’s environmental problems. Since energy is the single most influential factor in determining environmental impact, policymakers should provide incentives for renewable energy by heavily taxing fossil fuels (Leal and Marques, 2020; Munir et al., 2020; Wang and Yan, 2022). Expenditures on manufacturing and overall economic growth were the subjects of the second body of work (Odedokun, 1999). The monitoring sector’s impact on economic growth was discussed in this literature (Hamilton and Kelly, 2017; Du et al., 2022; Duan et al., 2022). Lastly, the third group of researchers examined how agricultural practices and carbon dioxide emissions interact (Li and Zheng, 2021; Deng et al., 2022; Wang, 2022). Most of the research looked at how CO2 emissions affected things such as agricultural output, GDP growth, and industrialization; however, very few looked at how developing and developed countries affected CO2 emissions.
To the best of our information, we found no previous research that used panel data to examine the effects of the EKC hypothesis on agricultural output across 22 countries (nine developing and 13 developed). In light of those, as mentioned earlier, this study contributes to our understanding of the prior study by critiquing a subset of the EKC hypothesis that proposes an inverted U-shaped relationship between national income (while controlling for agriculture production effects) and environmental quality in developing and developed countries (Ridzuan et al., 2020; Jiang et al., 2021). In light of the EKC hypothesis, this research seeks to identify important implications for economic and environmental mitigation policies by analyzing the connections between economic growth, agriculture, cereal yield, renewable energy consumption, industries and trade, and CO2 emissions in both developing and developed nations. Additionally, this study uses two distinct technical models to determine the EKC effects, one of which (total CO2 emissions, C-EM) is an endogenous variable and the other (CO2 emission, C-LF) is by liquid sources.
The contribution of this study to the field of literature is significant. Adopting the panel and quantile regression models is the main advantage of these investigations as a robust answer to the problems of agricultural goods, industrial production, industries and trade, and energy efficiency. Second, most of these studies emphasize the smart grid system and renewable energy, while fossil energy is the main fuel in economic sectors. There has been a lack of focus on agriculture products, industries, and trade with energy consumption and CO2 emissions as well as adjusting prices by using panel quantile regression models by percentile. Third, the present study is similar to the previous research in that it uses a panel quantile regression approach to identify a correlation between energy consumption and economic expansion. Fourth, there are fewer gaps in the literature than in other studies. While it has already been mentioned that transportation accounts for a significant portion of total CO2 emissions, we also considered agricultural activities an important source. In addition, the current study is distinct because of its emphasis on energy consumption, its use of a more expansive time frame for precise analysis, and its evaluation of the disparity between CO2 emissions from developing and developed countries’ energy consumption. A panel quantile regression method is recommended for CO2 emissions from different countries with non-additive fixed effects (FE) and random effects (RE). The study confirms agriculture productivity through the use of policy frameworks that are based on panel estimation (cross-sectional dependence) techniques and focus on keeping and altering the CLAD environment in countries. This study’s panel quantile regression is novel and essential for foreseeing the development of the agricultural energy market in both developing and developed nations. Fossil energy consumption and economic growth, particularly in the agricultural sector, may be explored further in this study. Furthermore, it aids policymakers in understanding the energy and climate challenges they face. It organizes the structure of this study as follows: Introduction provides a summary of the relevant literature; Introduction demonstrates the procedure for collecting data; Introduction provides an overview of the study’s findings; and Introduction draws conclusions and makes recommendations.
In estimations, panel data for 22 developing and developed countries for the period 1991–2010 are used. Data availability also affected the length of the extracted database’s data. Due to a shortage of data, we only examined nine developing and 13 developed countries over the 25-year period. The data definition and source are depicted in Table 1; twenty-five countries’ varying degrees of social and economic development are mapped out by the human development index (HDI). The higher the HDI, the more advanced a country is, and developed nations have an HDI of 0.8 or higher in terms of education, life expectancy, and standard of living. As a result of data availability, this investigation contacted 22 national economic datasets (Boyle, 2022). Analyzing environmental pollution (C-EM and C-LF), energy consumption (REN), and economic growth (GNI, GNI2, IDC, and TRD) across nine developing (Argentina, Brazil, China, Mexico, Malaysia, Nigeria, the Philippines, Qatar, and the Russian Federation) and thirteen developed (Australia, Canada, Chile, Germany, France, Greece, Israel, Italy, the Netherlands, Norway, Spain, Sweden, and Switzerland) countries at varying income levels and within the context of the existing hypothesis of the EKC. To provide a visual inspection of the variables, the relevant line graphs of the panel variables are presented (Appendix A).
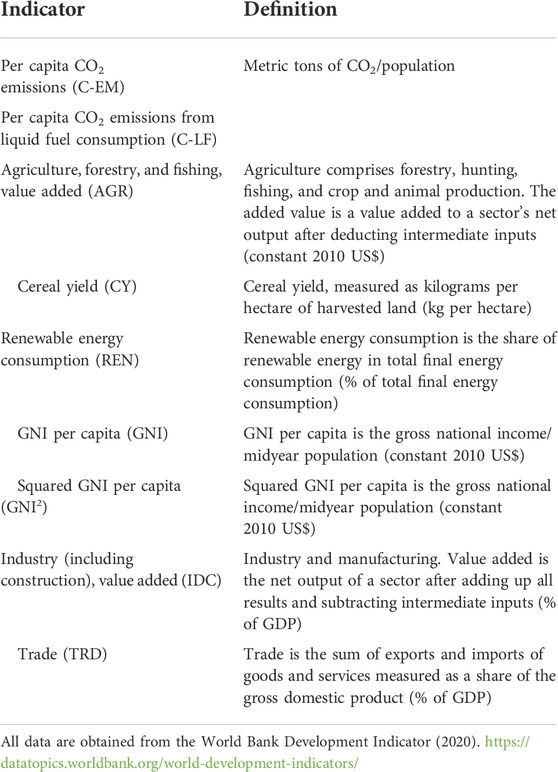
TABLE 1. Panel variables.
The response variables are measured in metric tons per capita (C-EM) is equivalent to metric tons per capita (C-LF), but C-LF also considers liquid consumption in various economies. C-EM regressors have been selected and analyzed based on previous research with similar aims (Kong and Khan, 2019; Chen X. et al., 2020; Khan, 2021; Usman and Makhdum, 2021; Adekoya et al., 2022; Shah et al., 2022). Consistent with previous findings, the factors of C-EM-retained explanatory indicators are reliable. Furthermore, concluding that there is a link between CO2 emissions and economic growth that has been the subject of numerous research studies, but the results have been contradictory because both developing and developed countries’ economic growth is examined when aspects such as agriculture, trade, industry, and renewable energy are considered. (Nwaka et al., 2020; Beyene, 2022; Farooq et al., 2022; Rehman et al., 2022). On the other hand, the explanatory indicators such as AGR, CY, REN, GNI, GNI2, IDC, and TRD can be studied in detail in panels A and B. Table 1. Each residual in the set has its descriptive statistics calculated. According to Table 2, the experimental indicators of AGR, CY, REN, GNI, GNI2, IDC, and TRD are inconsistent with the normal distribution hypothesis, as determined by the Jarque–Bera statistics. Moreover, given that the experimental indicators have been log-transformed, the exponents’ regression coefficient can be understood intuitively. The log-transformed version of the data is altered to make it more roughly normal. Explanatory variables of the CEM allow for greater specificity, and the change in descriptive value over time can be tracked. Across both developing and developed countries, all CEM predictors are used, with C-LF having the most impact on the average ARG value. Covariance is used to examine the relationship between countries. The explanatory factors are split into two panels (A and B) that each focus on one of the two primary regressors (C-EM and C-LF). Based on the data in Table 3, both C-EM and AGR have negative covariance, with -0.124, and C-LF and ARG have negative covariance, with -3.377. These data suggest that both of these associations are negative. Similarly, we find positive coefficients in the covariance between C-EM and C-LF and CY, GNI, GNI2, IDC, and TRD.
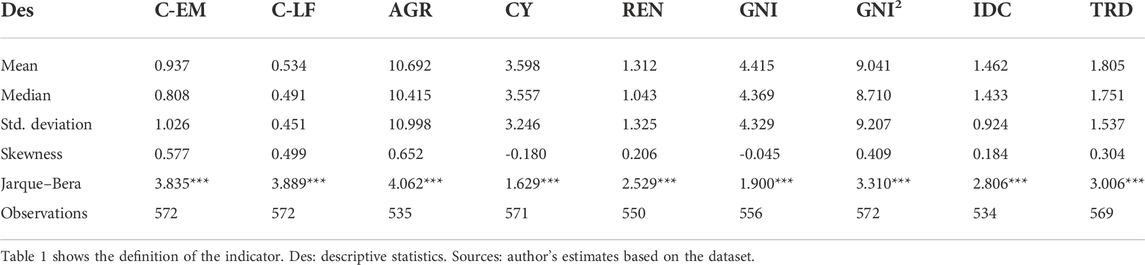
TABLE 2. Summary of descriptive statistics.
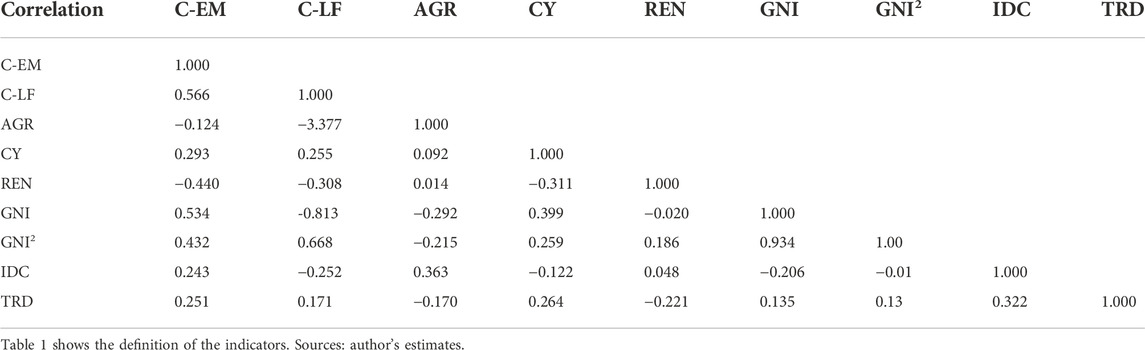
TABLE 3. Covariance analysis.
In the first step, we calculated the descriptive statistics, covariance, and unit root test of overall developing and developed countries, and then in the second step, we separately computed C-EM and C-LF in two panels. Next, FMOLS, RE, FE, and quantile regression (QR) (QR (25), QR (50), and QR (75)) for both developing and developed countries overall were calculated (Table 4). We worked on the computation for both groups so that the C-EM and C-LF results would be more illustrative of developing and developed countries, respectively (Table 5). The description of the model is shown as follows:
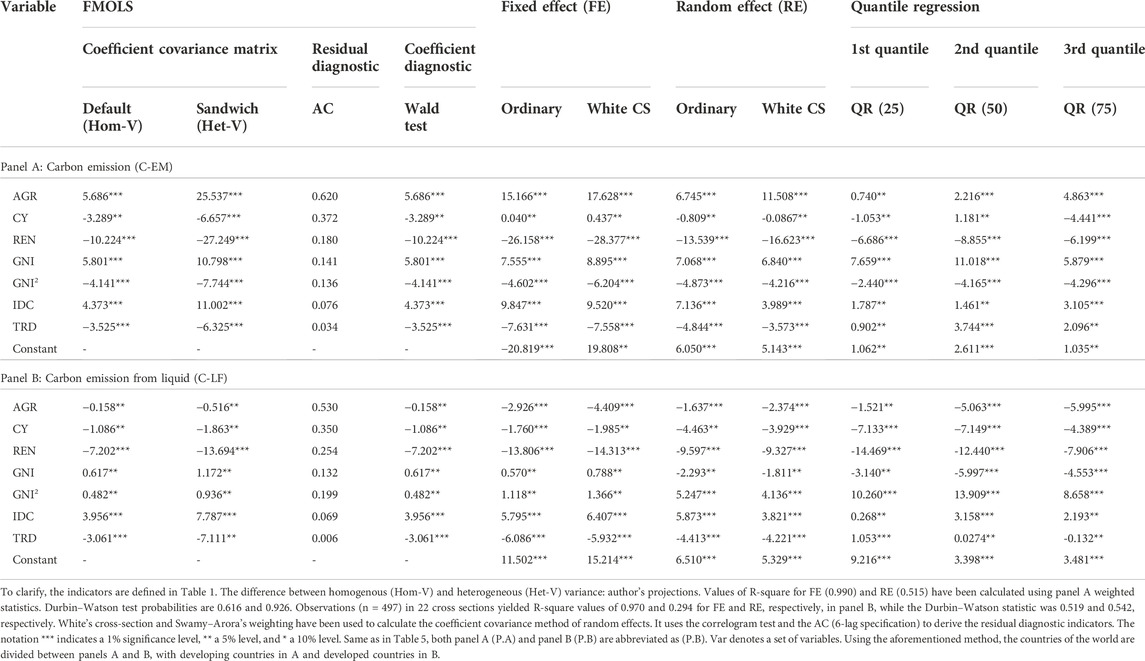
TABLE 4. FMOLS, random effect (RE), fixed effect (FE), and quantile regression across countries.
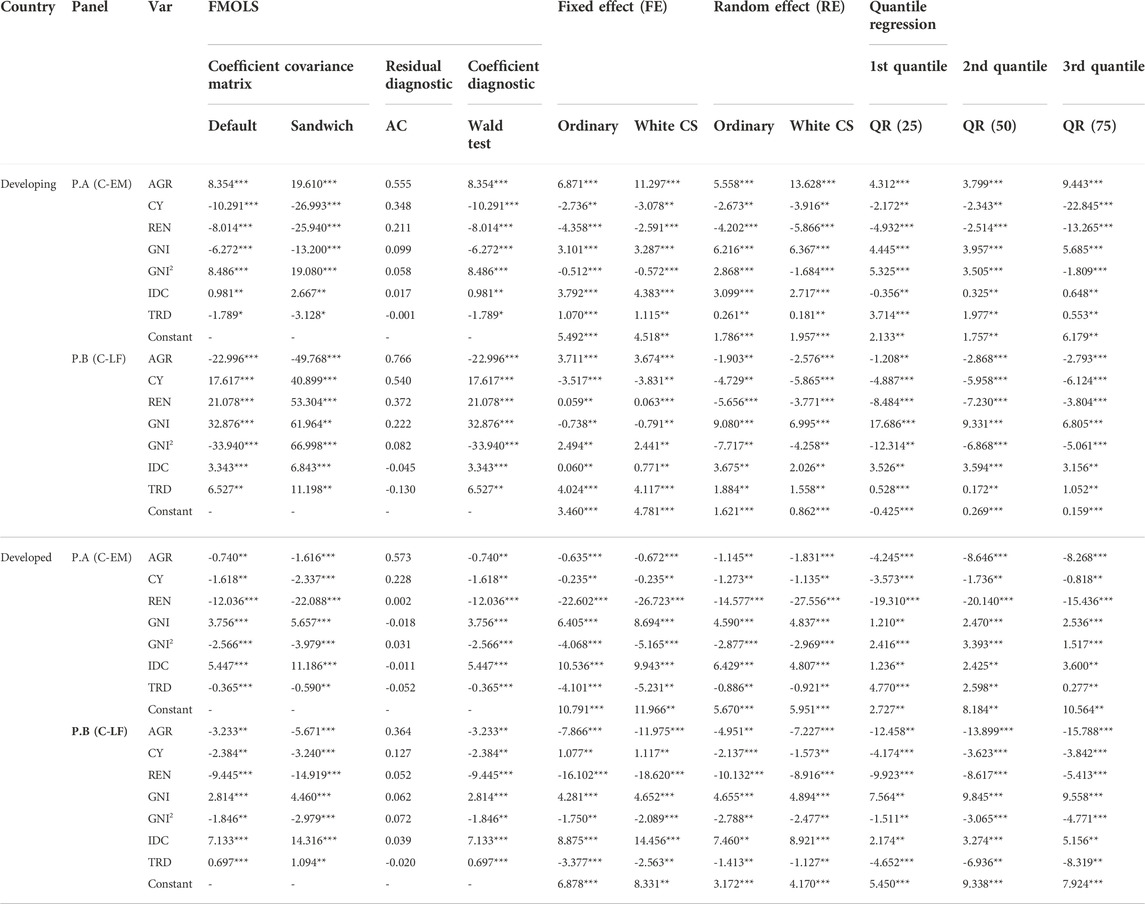
TABLE 5. FMOLS, random effect (RE), fixed effect (FE), and quantile regression of developing and developed countries.
According to the Environmental Kuznets Curve (EKC) model,
For the two dependent indicators (C-EM and C-LF), we use the notation
The estimators suggest that
This model is predicated on examining the conditional means of analysis (C-EM and C-LF) indicators across countries, particularly emphasizing the condition determinants of CO2 emissions. A linear link exists between the repressors in panels A and B, thanks to the increasing approach of this model to quantiles. Quantile regression (QR) was utilized to generate objective estimates in the presence of probable outliers. Since environmental deterioration is more severe in developing nations, the QR technique (first, second, and third quantiles) captures CEM elements that are extremely important to both of these economic sectors. More income and secure economics from expansion are more conscientious, and this effect grows with the size of the economy. As a result, there might be variations in how industrialized and emerging economies react to environmental degradation. Agriculture is vital to the environment’s health in many regions and plays a big role in developing economies. This research departs from the standard QR in favor of a panel data framework characterized by non-additive fixed effects and the notion of an inseparable disturbance. Accordingly, the repressors can interact with the fixed effects of both developing and developed countries in this research specification. As a result, the following equation is the quantile specification for the panel:
Eq 3 revealed
Given that previous research (Koenker and Bassett, 1978; Koenker, 2004; Siriopoulos and Pomonis, 2009; Nwaka et al., 2020) on regression analysis suggests that the ordinary least square (OLS) regression method’s predictions do not qualify as effective predictions when their assumption is not met, this study uses the quantile regression technique to further investigate the conditional determinants of CEM in developing and developed countries (JW, 2000). It is important to note that if the variance has a heterogeneous structure, the OLS analysis may not provide an accurate estimate of the B vector. Quantile regression models, which consider the heterogeneity structure and quantile structure of the data, are one alternative regression model we need in this situation (Katchova, 2013; John and Nduka, 2009). Due to the fact that no assumptions are made about the distribution of the error term it predicts (John OO, 2009; A K., 2013), quantitative regression model estimates are more robust and versatile than those from the OLS model (Belaïd et al., 2020; Raghutla et al., 2022; Sun et al., 2022). The conditional mean (anticipated mean value) of the response of the dependent variable to the independent variable is used to make predictions in the OLS technique. Quantile regression (Ike et al., 2020; Sun et al., 2022), on the other hand, seeks to estimate not only the median but also the 25th, 75th, and 90th quantiles of the response variable, among others (Xu and Lin, 2018; Iddrisu and Alagidede, 2021).
The sequence of economic variables is not assumed to be normally distributed in the quantile regression first proposed by Koenker and Bassett (1978) and refined by Koenker and Hallock (2001). Models for the selected quantities in the conditional distribution of the dependent variable are established via quantile regression (Xu X. et al., 2019; Akram et al., 2021; Cheng et al., 2021). Herein, quantile regression approaches are used in both panels A and B to compare and contrast the perceptions of various income groups in developing and developed countries with respect to environmental degradation (as measured by AGR, CY, REN, GNI, GNI2, IDC, and TRD). At last, Eq 4 depicts the panel quantile regression model.
In Eq 4, t represents the year, and i stands for either a developing nation or a developed nation. The regressors,
Unit root tests and cointegration tests, which take cross-sectional dependence into account, must be run before estimations can be performed to determine whether or not the variables are cointegrated and to determine whether the variables follow an I (0), I (1), or higher order integration process. In light of this, we then conduct panel stationary and cointegration tests while considering cross-sectional dependency. Over time, statistical evidence leads to the conclusion that the variables are I (1) and cointegrated, indicating that the variables have a long-run relationship. Estimations can be made using Fully Modified Ordinary Least Squares (FMOLS), fixed effects (FE), random effects (RE), and quantile regressions based on the outcomes of unit root and cointegration tests (QR). More instruments can be included with the first-difference assumption in the explanatory variables, making the method more effective and efficient. CEM’s effect on various explanatory variables is to be examined under the directive (Wu et al., 2018; Hung et al., 2022; Mirziyoyeva and Salahodjaev, 2022). When conducting a test for a unit root on an estimate of a residual, it is important to account for differences in methodology by location and over time. Developed and developing nations have contributed to contemporary analyses examining long-run cointegration relationships. Individual intercept, trend, and the absence of cointegration are all statistically rejected by the Padroni panel test in panel ADF. Unit root tests for single countries in both the developed and developing nations yield the same statistically mean value for the individual autoregressive coefficient (Iranmanesh and Jalaee, 2021; Xu L. et al., 2022).
Whether the panel data processes are stationary or not specifies in the selection of the regression model; if the panel data process is non-stationary, the conformist OLS estimation method would lead and solve a spurious problem in regression. Therefore, it is essential to examine each variable and indicate the stationary level via the unit root test (Liddle, 2012). There are four sorts of determined panel unit root tests that guarantee the accuracy, of results. Thus, according to first-generation tests such as common root-Levin, Lin, and Chu (LLC), Breitung, individual Im, Pesaran, and Shin (IPS), augmented Dickey–Fuller (ADF), and individual root-Fisher-PP and Hadri have been computed individually from all explanatory variables (Kao C, 1995; Pedroni, 2001; Apergis and Payne, 2009). The Padroni panel test by a statistical technique (Kao) was investigated, where the panel’s cointegration was used with ADF, PP, and rho statistics, and the test results showed the dynamic residual value. A study of the Padroni panel test for cointegration is presented for CEM in developing and developed countries. Calculating an autoregressive coefficient for the estimated residual and running a unit root test are possible when we account for variability across nations and over time, as in the dimensional approach to statistics.
After that, we calculated the cointegration test using the individual unit root tests of Pedroni and Kao based on the Engle–Granger method and Fisher (combined Johansen) with a lag of one period and a residual to adjust for errors. Testing for cointegration using the Padroni panel is investigated (Appendix B). Fisher’s panel cointegration test is another dynamical approach that has been used for Johansen’s causal method (Appendix C). Together, the p values of the Johansen trace statistics and the eigenvalues are used to reject the null hypothesis of no cointegration in this panel cointegration test (Ai et al., 2021; Koç and Gülmez, 2021). Furthermore, developed and developing nations have contributed to the modern series analysis of long-run cointegration relationships. Non-stationary indicators increased the likelihood that panel A and B models contained false data estimation of cointegration regression using fully modified ordinary least squares (FMOLS), with an emphasis on the maximum likelihood approach (Choi, 2001; Wang et al., 2021b). Due to the linear trend specification by trend variable assumption, a non-stationary estimate necessitates a triangular system of equations. The trend coefficient in each cross section was analyzed separately for developing and developed countries.
Panels A and B of Tables 4 and 5 display the FMOLS regression and the results for each dependent indicator (C-EM and C-LF, respectively) under both fixed and random influences. The effect of FE and RE regressions is analyzed and compared using standard error, and the results are stable against the occurrence of cross-sectional influences (Bui et al., 2021; Dong et al., 2022). For the FE estimator, we utilize fully modified OLS to control for random intercepts. The non-parametric method of analyzing panel data for properties of heterogeneous serial correlation is enhanced by this method. Both the FE and the RE demonstrate the FE’s usefulness in relation to the other model. As a result, the FMOLS will be the basis for the analysis as estimated and reported by the FE. The middle of the output is where you can access the estimated panel coefficients (A and B). The expected cointegrating vector (CV) for C-EM and AGR, CY, REN, GNI, GNI2, IDC, and TRD is defined by the coefficients on these variables. C-EM and C-LF had their standard errors and t-statistics (p values) tested. First, instead of using the FMOLS transformation, we analyze all of the fit statistics with the raw data. After removing the deterministic components from the experimental indicator and the regressor, the non-stationary model performs standard FMOLS on the pooled sample. According to default (homogenous variance) and a sandwich (heterogeneous variance) in the coefficient covariance matrix with d. f., the long-run covariance is calculated for pooled FMOLS estimation. The indicators in both panels A and B are statistically significant, and their results are not affected by the estimators used.
The results estimated using C-EM and C-LF for both equations in panels A and B reveal some latent pragmatic dynamics. The results of the EKC hypothesis are valid in 22 countries (nine developing and 13 developed countries). However, C-LF is more prevalent in developing nations and is utilized in all robust results. The GNI has a positive correlation with the coefficient of the covariance matrix in panel A, which is 5.801. In panel B, however, the GNI results revealed a positive correlation of 0.617. A 1% change in AGR is associated with a -4.409% increase in environmental degradation, indicating that AGR has a positive and significant influence on C-LF. In developing nations, environmental issues are influenced by agricultural activity; likewise, deforestation for feed crops, burning of biomass, and deep soil agriculture (Abdurrahman et al., 2020; Hao et al., 2020; Dong et al., 2022). The AGR indicator shows a negative association, as shown by the countervailing impact of the C-EM measure of environmental degradation. That means a change of just one percent in AGR can result in a 15.16 percent drop in total emissions of carbon dioxide. The results indicate that it does not imply a reduction in overall carbon emissions in developing and developed nations but rather a reduction in mechanization-induced emissions from agriculture (Rabnawaz, 2021).
Agriculture exports may also imply that the industrial sector (IDC) in developing and developed economies is fuel-intensive (Shahzad et al., 2020). Across developing and developed economies, an inverted U-shape is observed. Nonetheless, this may imply that developing economies focus on economic growth rather than ecological quality in the short-term and long-term effects of sustainable environmental techniques. Adopting renewable energy (REN) mitigates environmental degradation using both CEM and industrial revolution indicators. However, the high consumption in developing countries degrades environmental safeguards by increasing the C-LF. In both panels, the TRD openness decreased. Also, emerging nations (Brazil, Mexico, and Russia) have high trade values, whereas developed nations (Spain and Canada) have low IDC. C-EM fell by -7.631 percent and C-LF by -6.089 percent for every percentage point change in trade openness. These outcomes revealed the economic structure and nature of international trade in developing and developed economies (Jiao et al., 2020; Kicińska and Wikar, 2021; Zhou et al., 2022).
Despite the fit that Durbin–Watson FE (0.616) and RE coefficient restriction (CR)/the Wald test estimated output results with a CV of (1,-1) and coefficient restrictions (CR) with “C (1) = 0,” t-statistics (p value) estimates suggest that we do not accept the null hypothesis of the panels A and B that the coefficient value of the cointegrating regressor is equal to 1 under linear restriction. The estimated result of the t-statistics (p value) is around 0.000, indicating that we rejected the null hypothesis of the panels (A and B) that the coefficient value of the cointegrating regressor is equal to 1 with linear restriction. At lag 6, d. f. = 6, and the residual diagnostic value of Akaike AC’s (-2 (l/T)+2k/T) is estimated (reporting the correlogram Q-statistics). Panels A and B both have p values below 0.05 (at 0.034 for the TRD and 0.006), indicating that the residuals are random noise and permitting us to reject the null hypothesis; this holds true for lags 1 through 6. Fixed effects (FE) and random effects (RE) models were used to estimate the pool equation. Regressors (AGR, CY, REN, GNI, IDC, and TRD) and only cross-sectional identifiers (for the FE) are used to analyze a regressing model (panels A and B) in both the FE and RE. We investigate the coefficient of covariance for the default and white cross sections in accordance with Tables 4 and 5. Additionally, the default and white cross sections are used to evaluate the coefficient standard errors (CSEs) and robust coefficient covariance (RCC). The cross section, period, and idiosyncratic error components of S.D. and rho in FE and RE are used to measure the effect specification (ES). The fraction of regressor variation is shown by the intra-class correlation or rho.
When it comes to estimating the median response, the least absolute deviation (LAD) estimator that best fits the bill is the quantile regression (QR) estimator. Compared to conditional mean analysis, conditional distribution analysis is a more in-depth method. The first, second, and third quantiles are displayed in panels A and B. The regressors affect the model’s 25th, 50th, and 75th percentile response indicators. By using quantile regressions, this study not only looks at the effects of emissions across different groups but also highlights the most significant period. Hence, the model describes the 25th percentile (0.25 quantile), 50th percentile (0.50 quantile), and 75th percentile (0.75 quantile) in terms of carbon emissions. A strong distributional assumption is not necessitated by the QR method. The focus here is on a robust method (RM) for creating such connections. Panels A and B contain the results of the explanatory indicators, and their findings are discussed here. In Tables 4 and 5, we also show the 25th, 50th, and 75th percentile values for the diverse factors contributing to environmental degradation. This variation in quantiles between developing and developed countries’ determinants of environmental degradation is reflected in the conditional determinant estimates of panels A and B’s equations. The effect of AGR on C-EM and C-LF is highly variable and statistically significant at the QR (25), QR (50), and QR (75) quantiles in the total equations presented in panels A and B.
The estimation results from the panel FMOLS, FE, RE, and quantile regression (QR) analyses are presented in Table 4. The estimated AGR in terms of C-EM from FMOLS, FE, RE, QR (25), QR (50), and QR (75), respectively, is 5.686, 15.166, 6.745, 0.740, 2.216, and 4.863. All of them are significant at the 1% level. However, the effects of AGR on C-LF as determined by FMOLS, FE, RE, QR (25), QR (50), and QR (75) are, respectively, -0.158, -2.926, -1.637, -1.521, 5.063, and -5.993. According to a hypothetical expectation, the AGR has a negative impact on C-LF, and all coefficients are determined to be significant at the 1% level (Bilgili et al., 2021). As a result, utilizing the QR (25), QR (50), and QR (75) of real income in terms of C-EM and C-LF, AGR is linked to environmental degradation. We calculated expected outcomes for CY, REN, GNI, GNI2, IDC, and TRD in terms of C-EM and C-LF in the same manner. According to a hypothetical scenario, CY, REN, GNI, and TRD have a detrimental impact on C-EM and C-LF. Herein, Table 5 also showed that CY, REN, GNI, and TRD negatively impacted C-EM, whereas AGR and GNI2 negatively impacted C-LF in developing nations. In the case of developed nations, the anticipated outcomes of AGR, CY, and REN reveal a detrimental impact on both C-EM and C-LF (Awan et al., 2022). As per the EKC, it worked particularly well at QR (50) and QR (75) but only moderately well at QR (50), proving its validity. Figure 3 indicates that both Canada and Qatar are among the top carbon emitters among both developed and developing nations. Nigeria, the Philippines, Brazil, Chile, and Argentina all had results that supported the EKC theory.
Furthermore, Canada, Qatar, Russia, and the Netherlands are among the top QR (50) countries in terms of per capita carbon emissions, and the effect of real income in these developing and developed economies is consistent with the inverted U-shaped pattern Kuznets curve (EKC) hypothesis (Mehmood Mirza et al., 2022). The quantile results for C-LF consumption show that despite the greatest influence and having a significant pollution abatement effect, all indicators, with the exception of CY and IDC in QR (50), where the cereal yield and industry association have a little low effect, are presented in Figure 3. This includes countries such as France, Italy, Norway, and Germany. As quantile-based mean estimators, AGR, REN, and TRD all show nearly identical influences. The CEM intensity level is shown in Tables 4 and 5, in panels A and B, per the prevailing EKC hypothesis. From 1991 through 2016, the developing and developed countries changed over time. The largest AGR was anticipated to occur in China in 2016, with C-EM and C-LF levels forecast to be -0.3 and -0.6, respectively. Because China is a developing nation, it has modified its agricultural technology and decreased its intensity. With the exception of China, all other developing countries (including Qatar, Malaysia, Nigeria, and the Russian Federation) exhibit a high intensity level in AGR, CY, TRD, and especially IDC. Similar to Qatar, 2003 saw the highest intensity, estimated at 7.7, while 2016 saw the lowest, at 0.3, for C-LF. The highest C-EM value was also recorded in 2002. However, the developed countries have a significantly lower level of intensity in AGR, TRD, CY, and REN than developing nations such as Turkey, Sweden, and Norway.
The quantile decomposition analysis for CEM emissions reveals that unidentified factors outside the research model contribute to the carbon emission gap between LIG and HIG due to different developing and developed economic structures and environmental policy frameworks. Nonetheless, C-LF and C-EM are disproportionately high compared to observed economic factors and agriculture. Table 4 shows the results of an FMOLS, FE, RE, and cross-country quantile regression (QR (25), QR (50), and QR (75)) analysis for all 22 countries, including nine developing and 13 developed nations, with panels A and B providing separate elaborations on the existence of the EKC hypothesis in terms of CEM. Panel A shows a positive effect for AGR, GNI, and IDC, while panel B shows a favorable effect for GNI, GNI2, and IDC. Based on the projected results, a one percent shift in an explanatory indicator seems to have a far larger impact on C-EM than on C-LF. Results for nine developing nations and 13 developed countries are shown in Table 5. Estimates imply that developing countries have a greater degree of similarity in their growth plans and C-EM shifts (Farooq et al., 2022). Assumptions used in the EKC model of CEM are valid for low-income nations, but their predicted outcomes fall short of the achievements of high-income countries. Further explanation of the empirical investigation of environmental degradation caused by agricultural output, economic growth, trade openness, renewable energy, industry, and trade implications is as follows.
Research by the United Nations Food and Agriculture Organization (FAO) shows that emissions from forestry, agriculture, and fisheries have increased in the last 50 years and are projected to increase by 30% by 2050. As developing and developed countries increase their energy demands, CO2 emissions continue to rise and have reached a record high for the fourth consecutive year (Rapier, 2020). Consider that Asia is home to only 4.3 billion people or 60% of the world’s population. Table 5 reveals that the current EKC hypothesis predicts that AGR and GNI2 have the greatest impact on attitudes in panel A, whereas the least optimistic estimates are seen in panel B, which represents emerging countries. In addition, the CEM emissions per capita in developing countries are currently greater than double those in developed nations due to the 1 percent population growth in these regions. Concerning AGR, Brazil and Malaysia for panel A and China and Qatar for panel B had the highest CO2 emissions intensity. To be more ecologically sound, CEM must strike a balance between mechanization and inappropriate cultivation practices that call for greater additives and accuracy (Chen J. et al., 2020; Munir et al., 2020). The EKC-high effect of AGR output is positive for all QR (25), QR (50), and QR (75) in China, Qatar, and Malaysia in panels A and B. High intensity is shown in Turkey, Germany, and Greece (all developed countries) in panel A and France, Italy, and Turkey (all developed countries) in panel B. Low- and high-income rural and urban farmers are still needed, especially in developing and developed nations. This inference may explain why agriculture has a range of impacts on CO2 emissions.
It is predicted, however, that developing nations like those that rely heavily on agricultural exports and primary sector exports would have the same growth and development in agriculture and trade as developed countries (Li et al., 2020; Zubair et al., 2020). In addition, the coefficients for various economic activities reveal that the effects of agriculture and international trade are supported by more robust statistical evidence than those involving any particular economic sector (Nasir et al., 2021). Table 5 shows that the REN, GNI, and GNI2 of developing nations such as Argentina, Mexico, China, and Nigeria and developed countries such as Germany, France, Italy, and the Netherlands, have a significant impact on the EKC hypothesis for C-EM. Comparing the developed nations such as Germany, Italy, and Sweden to the developing nations such as Brazil, Qatar, and Nigeria, C-LF reveals the existence of the EKC hypothesis in all six countries. By comparing the emission rates of developing and developed countries, we find that the EKC hypothesis for C-EM and C-LF holds true for higher emissions, with the EKC hypothesis verified for Qatar, Italy, and China (Xu and Lin, 2020). Moreover, it shows that environmental policy formulation has occurred in both high and low economies, and the heterogeneity of gaseous and solid fuel use between countries can substantially impact emissions (Wada et al., 2021).
The EKC hypothesis for C-EM is profoundly affected by the IDC and TRD practices of both developing nations such as Argentina, Mexico, Brazil, and Malaysia and industrialized nations such as Greece, Turkey, and Spain. C-LF shows that the EKC hypothesis holds true in all five countries when comparing developed nations such as Germany, Greece, and Turkey to developing nations such as Qatar and Malaysia. Estimated results of quantile regression have a distinct non-standard and favorable pattern in both panels, even though renewable energy is consistently negative in developing and developed nations. Long-term economic growth in developing countries positively correlates with renewable energy, while renewable energy costs negatively correlate with C-EM and C-LF. As a result, renewable energy interacts with carbon emissions from the use of liquid fuel to boost economic growth and social progress in both developing and developed nations. In developing countries, it is more consistent because it detects a negative dynamic in CO2 emissions and holds up well across different means of estimation (Omri and Belaïd, 2021). In last, it is possible that developing economies’ industrial sectors are weaker than those of developed economies according to these estimates. When looking at QR (25), the effect of C-LF becomes more significant (p < 1), and this indicates that developing countries’ energy consumption rises along with technological advancement (Hu et al., 2021). The industrial revolution has been crucial to the expansion of the global economy. It has a positive and statistically significant impact on both panels. C-LF impacts economies, as shown by the negative effect of trade in QR (25)–QR (75) in developing countries.
Impacts on agriculture (AGR), cereal yield (CY), renewable energy consumption (REN), gross national product (GNP), industrial output (IDC), and international trade (TRD) are analyzed for both developing and developed nations. Using sinusoidal data from 22 to nine developing and 13 developed countries, it examines environmental degradation from two CEM (C-EM and C-LF) sources from 1991 to 2016. This research used panel quantile decomposition methods with FMOLS to examine the gap in CO2 emissions between low (LIG) and high (HIG) economies and the relationship between AGR and economic factors at varying income and CO2 emitter levels. As shown in the estimated results, a wide range of factors contribute to environmental quality across both developing and developed countries, from those with high to those with low levels of CO2 emissions. These recommendations are presented as an expected result of the aforementioned. To begin, the developed (France, Italy, and Spain) and selected (China, Brazil, and Nigeria) countries must eliminate crude agricultural practices caused by land fragmentation. In addition, the increased production of agricultural goods and the widespread practice of burning brush have debilitating ecological consequences. More farming needs to be carried out in developing nations, both in terms of cultivating techniques and applying new sustainable methods.
Second, the government in developing countries should be given the authority and the means to implement strategies to prevent and reduce the risk of CO2 emissions in urban areas. In addition, the ongoing evolutions of eco-friendly practices that safeguard soil, cut greenhouse gas emissions, and lessen the energy use. Third, the Agricare conservative agriculture approach, based on strip cropping and no-till farming, needs to be introduced to developing countries along with improved precision agriculture techniques. In addition, expanding populations and booming economies are major contributors to rising atmospheric carbon dioxide levels. In this scenario, the effects of widespread technological adoption on carbon emission reduction are outweighed by population and economic growth. In this study, we find that the developed world is cutting back on carbon emissions, thanks to the countervailing effects of technology and nuclear power plants on their use of oil and other energy sources, while the impact of alternative energy sources on the consumption patterns of developing nations is significant but in flux. Human activity cannot be discounted as a significant contributor to global warming’s onset at an earlier stage in the industrial revolution and economic development. Nonrenewable fossil fuels are the primary source of carbon emissions; depending on their abundance characteristics, oil, gas, coal, and nuclear sources all contribute differently to the temperature rise in industrialized nations.
More importantly, both the private and public sectors are committed to fostering positive change in agriculture via natural methods and advancing more sustainable economic models. In fourth place, it is important to promote the adaptation of renewable energy innovations in underdeveloped nations and the use of energy-saving practices and all-natural strategies for preventing and reversing environmental degradation. It would make the switch to a cleaner industrial economy in developing countries possible. To solve the fundamental issues of low industrial capacity, food shortages, and unsustainable manufacturing practices, agricultural and industrial products in both developing and developed countries should be stable. Furthermore, 22 countries, both developed and developing, may gain social stability and employment opportunities as a result of modernized technologies. As a final goal of our research, we hope to encourage developed countries to take environmental protection measures by using environmental performance as a test case for the EKC hypothesis in future studies.
The original contributions presented in the study are included in the article/Supplementary Material; further inquiries can be directed to the corresponding author.
RK: Conceptualization, Writing—review & editing, Methodology, Writing—original draft, Formal analysis, Data curation, Software, and Supervision, ON: Funding acquisition, review, WZ: Investigation, RB: Funding acquisition, Validation, IA: Funding acquisition, review, MA: Funding acquisition, Validation.
The author responds to insightful advice and is extremely appreciative of the instructors for all the encouragement and guidance they have given. The educational opportunities provided by the Fujian University of Technology are gratefully acknowledged. National Social Science Foundation of China (22BGL007), Fujian Zhi-lian-yun Supply Chain Technology and Economy Integration Service Platform from the Fujian Association for Science and Technology, the Fujian-Kenya Silk Road Cloud Joint R&D Center (2021D021) from Fujian Provincial Department of Science and Technology, the Fujian Social Sciences Federation Planning Project (FJ2021Z006), and General program of Fujian Natural Science Foundation (2022J01941). He is grateful to his loved ones for their support as he pursues his goal of earning a doctorate. He cannot ignore the value of the disabled student who, in the name of success, is willing to sacrifice anything, including their feelings, in order to succeed. He knows that love is the one that holds him up and gives him the energy to keep going.
The author declares that the research was conducted in the absence of any commercial or financial relationships that could be construed as a potential conflict of interest.
All claims expressed in this article are solely those of the authors and do not necessarily represent those of their affiliated organizations, or those of the publisher, the editors, and the reviewers. Any product that may be evaluated in this article, or claim that may be made by its manufacturer, is not guaranteed or endorsed by the publisher.
Abdurrahman, M. I., Chaki, S., and Saini, G. (2020). Stubble burning: Effects on health & environment, regulations and management practices. Environ. Adv. 2, 100011. doi:10.1016/j.envadv.2020.100011
Adekoya, O. B., Ajayi, G. E., Suhrab, M., and Oliyide, J. A. (2022). How critical are resource rents, agriculture, growth, and renewable energy to environmental degradation in the resource-rich african countries? The role of institutional quality. Energy Policy 164, 112888. doi:10.1016/j.enpol.2022.112888
Aguilera, E., Reyes-Palomo, C., Díaz-Gaona, C., Sanz-Cobena, A., Smith, P., García-Laureano, R., et al. (2021). Greenhouse gas emissions from Mediterranean agriculture: Evidence of unbalanced research efforts and knowledge gaps. Glob. Environ. Change 69, 102319. doi:10.1016/j.gloenvcha.2021.102319
Ai, H., Guan, M., Feng, W., and Li, K. (2021). Influence of classified coal consumption on PM2.5 pollution: Analysis based on the panel cointegration and error-correction model. Energy 215, 119108. doi:10.1016/j.energy.2020.119108
Akram, R., Chen, F., Khalid, F., Huang, G., and Irfan, M. (2021). Heterogeneous effects of energy efficiency and renewable energy on economic growth of brics countries: A fixed effect panel quantile regression analysis. Energy 215, 119019. doi:10.1016/j.energy.2020.119019
Akram, R., Chen, F., Khalid, F., Ye, Z., and Majeed, M. T. (2020). Heterogeneous effects of energy efficiency and renewable energy on carbon emissions: Evidence from developing countries. J. Clean. Prod. 247, 119122. doi:10.1016/j.jclepro.2019.119122
Amin, A., Dogan, E., and Khan, Z. (2020). The impacts of different proxies for financialization on carbon emissions in top-ten emitter countries. Sci. Total Environ. 740, 140127. doi:10.1016/j.scitotenv.2020.140127
Apergis, N., and Payne, J. E. (2009). Energy consumption and economic growth in Central America: Evidence from a panel cointegration and error correction model. Energy Econ. 31, 211–216. doi:10.1016/j.eneco.2008.09.002
Awan, A., Abbasi, K. R., Rej, S., Bandyopadhyay, A., and Lv, K. (2022). The impact of renewable energy, internet use and foreign direct investment on carbon dioxide emissions: A method of moments quantile analysis. Renew. Energy 189, 454–466. doi:10.1016/j.renene.2022.03.017
Balado-Naves, R., Baños-Pino, J. F., and Mayor, M. (2018). Do countries influence neighbouring pollution? A spatial analysis of the EKC for CO2 emissions. Energy Policy 123, 266–279. doi:10.1016/j.enpol.2018.08.059
Balsalobre-Lorente, D., Driha, O. M., Leitão, N. C., and Murshed, M. (2021). The carbon dioxide neutralizing effect of energy innovation on international tourism in EU-5 countries under the prism of the EKC hypothesis. J. Environ. Manage. 298, 113513. doi:10.1016/j.jenvman.2021.113513
Belaïd, F., Youssef, A. B., and Lazaric, N. (2020). Scrutinizing the direct rebound effect for French households using quantile regression and data from an original survey. Ecol. Econ. 176, 106755. doi:10.1016/j.ecolecon.2020.106755
Ben Cheikh, N., Ben Zaied, Y., and Chevallier, J. (2021). On the nonlinear relationship between energy use and CO2 emissions within an EKC framework: Evidence from panel smooth transition regression in the MENA region. Res. Int. Bus. Finance 55, 101331. doi:10.1016/j.ribaf.2020.101331
Beyene, S. D. (2022). Human activities and environmental quality: Evidence beyond the conventional EKC hypothesis. Heliyon 8, e10756. doi:10.1016/j.heliyon.2022.e10756
Bilgili, F., Kuşkaya, S., Khan, M., Awan, A., and Türker, O. (2021). The roles of economic growth and health expenditure on CO2 emissions in selected asian countries: A quantile regression model approach. Environ. Sci. Pollut. Res. 28, 44949–44972. doi:10.1007/s11356-021-13639-6
Billig, E., Decker, M., Benzinger, W., Ketelsen, F., Pfeifer, P., Peters, R., et al. (2019). Non-fossil CO2 recycling—the technical potential for the present and future utilization for fuels in Germany. J. CO2 Util. 30, 130–141. doi:10.1016/j.jcou.2019.01.012
Boyle, M. (2022). Top 25 developed and developing countries. Tallahassee, Florida: INVESTOPEDIA TEAM.
Bradley, P. (2021). An institutional economics framework to explore sustainable production and consumption. Sustain. Prod. Consum. 27, 1317–1339. doi:10.1016/j.spc.2021.02.035
Bui, Q., Wang, Z., Zhang, B., Le, H. P., and Vu, K. D. (2021). Revisiting the biomass energy-economic growth linkage of brics countries: A panel quantile regression with fixed effects approach. J. Clean. Prod. 316, 128382. doi:10.1016/j.jclepro.2021.128382
Chen, J., Huang, S., and Ajaz, T. (2022). Natural resources management and technological innovation under EKC framework: A glimmer of hope for sustainable environment in newly industrialized countries. Resour. Policy 79, 103016. doi:10.1016/j.resourpol.2022.103016
Chen, J., Xian, Q., Zhou, J., and Li, D. (2020). Impact of income inequality on CO2 emissions in G20 countries. J. Environ. Manage. 271, 110987. doi:10.1016/j.jenvman.2020.110987
Chen, X., Shuai, C., Zhang, Y., and Wu, Y. (2020). Decomposition of energy consumption and its decoupling with economic growth in the global agricultural industry. Environ. Impact Assess. Rev. 81, 106364. doi:10.1016/j.eiar.2019.106364
Cheng, C., Ren, X., Dong, K., Dong, X., and Wang, Z. (2021). How does technological innovation mitigate CO2 emissions in OECD countries? Heterogeneous analysis using panel quantile regression. J. Environ. Manage. 280, 111818. doi:10.1016/j.jenvman.2020.111818
Choi, I. (2001). Unit root tests for panel data. J. Int. Money Finance 20, 249–272. doi:10.1016/S0261-5606(00)00048-6
Deng, H., Xu, B., Zhao, Y., and Xu, Y. (2022). Heavy industry priority development strategy and economic growth: The economic logic of the inverted-U theory and economic history explanation. Struct. Chang. Econ. Dyn. 62, 1–8. doi:10.1016/j.strueco.2022.04.005
Dong, F., Li, Y., Gao, Y., Zhu, J., Qin, C., and Zhang, X. (2022). Energy transition and carbon neutrality: Exploring the non-linear impact of renewable energy development on carbon emission efficiency in developed countries. Resour. Conserv. Recycl. 177, 106002. doi:10.1016/j.resconrec.2021.106002
Du, Y., Liu, Y., Hossain, M. A., and Chen, S. (2022). The decoupling relationship between China’s economic growth and carbon emissions from the perspective of industrial structure. Chin. J. Popul. Resour. Environ. 20, 49–58. doi:10.1016/j.cjpre.2022.03.006
Duan, W., Madasi, J. D., Khurshid, A., and Ma, D. (2022). Industrial structure conditions economic resilience. Technol. Forecast. Soc. Change 183, 121944. doi:10.1016/j.techfore.2022.121944
Farooq, S., Ozturk, I., Majeed, M. T., and Akram, R. (2022). Globalization and CO2 emissions in the presence of EKC: A global panel data analysis. Gondwana Res. 106, 367–378. doi:10.1016/j.gr.2022.02.002
Gaies, B., Nakhli, M. S., and Sahut, J.-M. (2022). What are the effects of economic globalization on CO2 emissions in MENA countries? Econ. Model. 116, 106022. doi:10.1016/j.econmod.2022.106022
Gnangoin, T. Y., Kassi, D. F., Edjoukou, A. J.-R., Kongrong, O., and Yuqing, D. (2022). Renewable energy, non-renewable energy, economic growth and CO2 emissions in the newly emerging market economies: The moderating role of human capital. Front. Environ. Sci. 10. doi:10.3389/fenvs.2022.1017721
Hamilton, T. G. A., and Kelly, S. (2017). Low carbon energy scenarios for sub-Saharan Africa: An input-output analysis on the effects of universal energy access and economic growth. Energy Policy 105, 303–319. doi:10.1016/j.enpol.2017.02.012
Han, J., Yang, Q., and Zhang, L. (2022). What are the priorities for improving the cleanliness of energy consumption in rural China? Urbanisation advancement or agriculture development? Energy sustain. Dev. 70, 106–114. doi:10.1016/j.esd.2022.07.011
Hao, P.-F., Qiu, C.-W., Ding, G., Vincze, E., Zhang, G., Zhang, Y., et al. (2020). Agriculture organic wastes fermentation CO2 enrichment in greenhouse and the fermentation residues improve growth, yield and fruit quality in tomato. J. Clean. Prod. 275, 123885. doi:10.1016/j.jclepro.2020.123885
Hu, J., Yan, S., and Wang, L. (2021). Efficiency and convergence of China’s export trade embodied carbon emissions. Chin. J. Popul. Resour. Environ. 19, 133–142. doi:10.1016/j.cjpre.2021.12.015
Hung, Y.-S., Lee, C., and Chen, P.-F. (2022). China’s monetary policy and global stock markets: A new cointegration approach with smoothing structural changes. Econ. Anal. Policy 76, 643–666. doi:10.1016/j.eap.2022.09.008
Iddrisu, A.-A., and Alagidede, I. P. (2021). Heterogeneous provincial prices and monetary policy in South Africa: A wavelet-based quantile regression analysis. Cent. Bank. Rev. 21, 87–103. doi:10.1016/j.cbrev.2021.06.001
Ike, G. N., Usman, O., and Sarkodie, S. A. (2020). Testing the role of oil production in the environmental Kuznets curve of oil producing countries: New insights from Method of Moments Quantile Regression. Sci. Total Environ. 711, 135208. doi:10.1016/j.scitotenv.2019.135208
Iranmanesh, N., and Jalaee, S. A. (2021). Testing the long-run neutrality and superneutrality of money in a developing country: Evidence from Iran. MethodsX 8, 101251. doi:10.1016/j.mex.2021.101251
Jiang, Q., Khattak, S. I., and Rahman, Z. U. (2021). Measuring the simultaneous effects of electricity consumption and production on carbon dioxide emissions (CO2e) in China: New evidence from an EKC-based assessment. Energy 229, 120616. doi:10.1016/j.energy.2021.120616
Jiang, Q., Rahman, Z. U., Zhang, X., Guo, Z., and Xie, Q. (2022). An assessment of the impact of natural resources, energy, institutional quality, and financial development on CO2 emissions: Evidence from the B&R nations. Resour. Policy 76, 102716. doi:10.1016/j.resourpol.2022.102716
Jiao, C., Chen, L., Sun, C., Jiang, Y., Zhai, L., Liu, H., et al. (2020). Evaluating national ecological risk of agricultural pesticides from 2004 to 2017 in China. Environ. Pollut. 259, 113778. doi:10.1016/j.envpol.2019.113778
John Oo, N. E. (2009). Quantile regression analysis as a robust alternative to ordinary least squares. Sci. Afr. 8, 61–65. doi:10.14419/ijasp.v3i2.4686
Kao C, C. B. (1995). On the estimation and inference of a cointegrated regression in panel data when the cross-section and time-series dimensions are compa- rable. Syracuse, NY: Syracuse Univ. Econ.
Khan, R. (2021). Beta decoupling relationship between CO2 emissions by GDP, energy consumption, electricity production, value-added industries, and population in China. PLoS One 16, 02494444–e249522. doi:10.1371/journal.pone.0249444
Kicińska, A., and Wikar, J. (2021). Ecological risk associated with agricultural production in soils contaminated by the activities of the metal ore mining and processing industry - example from southern Poland. Soil Tillage Res. 205, 104817. doi:10.1016/j.still.2020.104817
Koç, P., and Gülmez, A. (2021). Analysis of relationships between nanotechnology applications, mineral saving and ecological footprint: Evidence from panel Fourier cointegration and causality tests. Resour. Policy 74, 102373. doi:10.1016/j.resourpol.2021.102373
Kocak, E., and Alnour, M. (2022). Energy R&D expenditure, bioethanol consumption, and greenhouse gas emissions in the United States: Non-linear analysis and political implications. J. Clean. Prod. 374, 133887. doi:10.1016/j.jclepro.2022.133887
Koenker, R., and Bassett, G. (1978). Regression quantiles. Econometrica 46, 33–50. doi:10.2307/1913643
Koenker, R., and Hallock, K. F. (2001). Quantile regression. J. Econ. Perspect. 15, 143–156. doi:10.1257/jep.15.4.143
Koenker, R. (2004). Quantile regression for longitudinal data. J. Multivar. Anal. 91, 74–89. doi:10.1016/j.jmva.2004.05.006
Kong, Y. S., and Khan, R. (2019). To examine environmental pollution by economic growth and their impact in an environmental Kuznets curve (EKC) among developed and developing countries. PLoS One 14, e0209532. doi:10.1371/journal.pone.0209532
Koondhar, M. A., Udemba, E. N., Cheng, Y., Khan, Z. A., Koondhar, M. A., Batool, M., et al. (2021). Asymmetric causality among carbon emission from agriculture, energy consumption, fertilizer, and cereal food production – a nonlinear analysis for Pakistan. Sustain. Energy Technol. Assessments 45, 101099. doi:10.1016/j.seta.2021.101099
Le, T. H. (2022). Connectedness between nonrenewable and renewable energy consumption, economic growth and CO2 emission in Vietnam: New evidence from a wavelet analysis. Renew. Energy 195, 442–454. doi:10.1016/j.renene.2022.05.083
Leal, P. H., and Marques, A. C. (2020). Rediscovering the EKC hypothesis for the 20 highest CO2 emitters among OECD countries by level of globalization. Int. Econ. 164, 36–47. doi:10.1016/j.inteco.2020.07.001
Lee, J., Yucel, A. G., and Islam, M. T. (2023). Convergence of CO2 emissions in OECD countries. Sustain. Technol. Entrepreneursh. 2, 100029. doi:10.1016/j.stae.2022.100029
Li, G., Zakari, A., and Tawiah, V. (2020). Energy resource melioration and CO2 emissions in China and Nigeria: Efficiency and trade perspectives. Resour. Policy 68, 101769. doi:10.1016/j.resourpol.2020.101769
Li, Y., and Zheng, Y. (2021). Regional agricultural industry economic development based on embedded system and Internet of Things. Microprocess. Microsyst. 82, 103852. doi:10.1016/j.micpro.2021.103852
Liddle, B. (2012). The importance of energy quality in energy intensive manufacturing: Evidence from panel cointegration and panel FMOLS. Energy Econ. 34, 1819–1825. doi:10.1016/j.eneco.2012.07.013
Liu, H., Anwar, A., Razzaq, A., and Yang, L. (2022a). The key role of renewable energy consumption, technological innovation and institutional quality in formulating the SDG policies for emerging economies: Evidence from quantile regression. Energy Rep. 8, 11810–11824. doi:10.1016/j.egyr.2022.08.231
Liu, Y., and Lai, X. (2021). EKC and carbon footprint of cross-border waste transfer: Evidence from 134 countries. Ecol. Indic. 129, 107961. doi:10.1016/j.ecolind.2021.107961
Liu, Z., Qiu, C., and Zhu, L. (2022b). Dynamic role of green energy efficiency and climate technologies in realizing environmental sustainability: Fresh insights from China. Front. Environ. Sci. 10. doi:10.3389/fenvs.2022.908470
Mardani, A., Streimikiene, D., Cavallaro, F., Loganathan, N., and Khoshnoudi, M. (2019). Carbon dioxide (CO2) emissions and economic growth: A systematic review of two decades of research from 1995 to 2017. Sci. Total Environ. 649, 31–49. doi:10.1016/j.scitotenv.2018.08.229
Mehmood Mirza, F., Sinha, A., Rehman Khan, J., Kalugina, O. A., and Wasif Zafar, M. (2022). Impact of energy efficiency on CO2 Emissions: Empirical evidence from developing countries. Gondwana Res. 106, 64–77. doi:10.1016/j.gr.2021.11.017
Mirziyoyeva, Z., and Salahodjaev, R. (2022). Renewable energy and CO2 emissions intensity in the top carbon intense countries. Renew. Energy 192, 507–512. doi:10.1016/j.renene.2022.04.137
Munir, Q., Lean, H. H., and Smyth, R. (2020). CO2 emissions, energy consumption and economic growth in the ASEAN-5 countries: A cross-sectional dependence approach. Energy Econ. 85, 104571. doi:10.1016/j.eneco.2019.104571
Nasir, M. A., Canh, N. P., and Lan Le, T. N. (2021). Environmental degradation & role of financialisation, economic development, industrialisation and trade liberalisation. J. Environ. Manage. 277, 111471. doi:10.1016/j.jenvman.2020.111471
Nwaka, I. D., Nwogu, M. U., Uma, K. E., and Ike, G. N. (2020). Agricultural production and CO2 emissions from two sources in the ECOWAS region: New insights from quantile regression and decomposition analysis. Sci. Total Environ. 748, 141329. doi:10.1016/j.scitotenv.2020.141329
Odedokun, M. O. (1999). How the size of the monetary sector affects economic growth: Econometric evidence from industrial and developing countries. J. Policy Model. 21, 213–241. doi:10.1016/S0161-8938(97)00037-9
Omri, A., and Belaïd, F. (2021). Does renewable energy modulate the negative effect of environmental issues on the socio-economic welfare? J. Environ. Manage. 278, 111483. doi:10.1016/j.jenvman.2020.111483
Pakrooh, P., Nematian, J., Pishbahar, E., and Hayati, B. (2021). Reforming energy prices to achieve sustainable energy consumption in the agriculture sector of Iran’s provinces: Using game approach. J. Clean. Prod. 293, 126146. doi:10.1016/j.jclepro.2021.126146
Pedroni, P. (2001). Nonstationary panels, panel cointegration, and dynamic panels. Emerald Gr. Publ. Limited.Fullymodified OLS for heterogeneous cointegrated panels
Rabnawaz, K. (2021). Beta decoupling relationship between CO2 emissions by GDP, energy consumption, electricity production, value-added industries, and population in China. PLoS One 16, e0249444. doi:10.1371/journal.pone.0249444
Raghutla, C., Padmagirisan, P., Sakthivel, P., Chittedi, K. R., and Mishra, S. (2022). The effect of renewable energy consumption on ecological footprint in N-11 countries: Evidence from Panel Quantile Regression Approach. Renew. Energy 197, 125–137. doi:10.1016/j.renene.2022.07.100
Rapier, R. (2020). Why curbing carbon dioxide emissisons poses such A challenge. A challenge. from https.
Rashid Gill, A., Viswanathan, K. K., and Hassan, S. (2018). The Environmental Kuznets Curve (EKC) and the environmental problem of the day. Renew. Sustain. Energy Rev. 81, 1636–1642. doi:10.1016/j.rser.2017.05.247
Rehman, A., Alam, M. M., Alvarado, R., Işık, C., Ahmad, F., Cismas, L. M., et al. (2022). Carbonization and agricultural productivity in Bhutan: Investigating the impact of crops production, fertilizer usage, and employment on CO2 emissions. J. Clean. Prod. 375, 134178. doi:10.1016/j.jclepro.2022.134178
Ridzuan, N. H. A. M., Marwan, N. F., Khalid, N., Ali, M. H., and Tseng, M.-L. (2020). Effects of agriculture, renewable energy, and economic growth on carbon dioxide emissions: Evidence of the environmental Kuznets curve. Resour. Conserv. Recycl. 160, 104879. doi:10.1016/j.resconrec.2020.104879
Shabani, E., Hayati, B., Pishbahar, E., Ghorbani, M. A., and Ghahremanzadeh, M. (2021). A novel approach to predict CO2 emission in the agriculture sector of Iran based on Inclusive Multiple Model. J. Clean. Prod. 279, 123708. doi:10.1016/j.jclepro.2020.123708
Shah, M. I., AbdulKareem, H. K. K., khan, Z., and Abbas, S. (2022). Examining the agriculture induced Environmental Kuznets Curve hypothesis in BRICS economies: The role of renewable energy as a moderator. Renew. Energy 198, 343–351. doi:10.1016/j.renene.2022.08.052
Shahbaz, M., Nwani, C., Bekun, F. V., Gyamfi, B. A., and Agozie, D. Q. (2022). Discerning the role of renewable energy and energy efficiency in finding the path to cleaner consumption and production patterns: New insights from developing economies. Energy 260, 124951. doi:10.1016/j.energy.2022.124951
Shahzad, U., Ferraz, D., Doğan, B., and Aparecida do Nascimento Rebelatto, D. (2020). Export product diversification and CO2 emissions: Contextual evidences from developing and developed economies. J. Clean. Prod. 276, 124146. doi:10.1016/j.jclepro.2020.124146
Siriopoulos, C., and Pomonis, G. (2009). Selecting strategies to foster economists’ critical thinking skills: A quantile regression approach. Int. Rev. Econ. Educ. 8, 106–131. doi:10.1016/S1477-3880(15)30076-1
Sun, Y., Bao, Q., Siao-Yun, W., Islam, M., and Razzaq, A. (2022). Renewable energy transition and environmental sustainability through economic complexity in BRICS countries: Fresh insights from novel Method of Moments Quantile regression. Renew. Energy 184, 1165–1176. doi:10.1016/j.renene.2021.12.003
Tenaw, D., and Beyene, A. D. (2021). Environmental sustainability and economic development in sub-saharan africa: A modified EKC hypothesis. Renew. Sustain. Energy Rev. 143, 110897. doi:10.1016/j.rser.2021.110897
Tutak, M., and Brodny, J. (2022). Renewable energy consumption in economic sectors in the EU-27. The impact on economics, environment and conventional energy sources. A 20-year perspective. J. Clean. Prod. 345, 131076. doi:10.1016/j.jclepro.2022.131076
Usman, M., and Makhdum, M. S. A. (2021). What abates ecological footprint in BRICS-T region? Exploring the influence of renewable energy, non-renewable energy, agriculture, forest area and financial development. Renew. Energy 179, 12–28. doi:10.1016/j.renene.2021.07.014
Wada, I., Faizulayev, A., and Victor Bekun, F. (2021). Exploring the role of conventional energy consumption on environmental quality in Brazil: Evidence from cointegration and conditional causality. Gondwana Res. 98, 244–256. doi:10.1016/j.gr.2021.06.009
Wang, H. (2022). Role of environmental degradation and energy use for agricultural economic growth: Sustainable implications based on ARDL estimation. Environ. Technol. Innov. 25, 102028. doi:10.1016/j.eti.2021.102028
Wang, S., Fu, K., Sun, X., Zhang, Z., Li, S., and Jin, L. (2021a). Hierarchical-aware relation rotational knowledge graph embedding for link prediction. Neurocomputing 458, 259–270. doi:10.1016/j.neucom.2021.05.093
Wang, S., Li, Y., and Wen, K. (2021b). Recursive adjusted unit root tests under non-stationary volatility. Econ. Lett. 205, 109941. doi:10.1016/j.econlet.2021.109941
Wang, X., and Yan, L. (2022). Driving factors and decoupling analysis of fossil fuel related-carbon dioxide emissions in China. Fuel 314, 122869. doi:10.1016/j.fuel.2021.122869
Wu, Y., Zhu, Q., and Zhu, B. (2018). Decoupling analysis of world economic growth and CO2 emissions: A study comparing developed and developing countries. J. Clean. Prod. 190, 94–103. doi:10.1016/j.jclepro.2018.04.139
Xia, W., Apergis, N., Bashir, M. F., Ghosh, S., Doğan, B., and Shahzad, U. (2022). Investigating the role of globalization, and energy consumption for environmental externalities: Empirical evidence from developed and developing economies. Renew. Energy 183, 219–228. doi:10.1016/j.renene.2021.10.084
Xu, B., and Lin, B. (2020). Investigating drivers of CO2 emission in China’s heavy industry: A quantile regression analysis. Energy 206, 118159. doi:10.1016/j.energy.2020.118159
Xu, B., and Lin, B. (2018). Investigating the differences in CO2 emissions in the transport sector across Chinese provinces: Evidence from a quantile regression model. J. Clean. Prod. 175, 109–122. doi:10.1016/j.jclepro.2017.12.022
Xu, D., Sheraz, M., Hassan, A., Sinha, A., and Ullah, S. (2022). Financial development, renewable energy and CO2 emission in G7 countries: New evidence from non-linear and asymmetric analysis. Energy Econ. 109, 105994. doi:10.1016/j.eneco.2022.105994
Xu, L., Wang, X., and Guo, W. (2022). Does renewable energy adaptation, globalization, and financial development matter for environmental quality and economic progress? Evidence from panel of big five (B5) economies. Renew. Energy 192, 631–640. doi:10.1016/j.renene.2022.05.004
Xu, G., Schwarz, P., and Yang, H. (2019). Determining China’s CO2 emissions peak with a dynamic nonlinear artificial neural network approach and scenario analysis. Energy Policy 128, 752–762. doi:10.1016/j.enpol.2019.01.058
Xu, X., Xu, Z., Chen, L., and Li, C. (2019). How does industrial waste gas emission affect health care expenditure in different regions of China: An application of bayesian quantile regression. Int. J. Environ. Res. Public Health 16, 2748. doi:10.3390/ijerph16152748
Yang, M., Wang, E.-Z., and Hou, Y. (2021a). The relationship between manufacturing growth and CO2 emissions: Does renewable energy consumption matter? Energy 232, 121032. doi:10.1016/j.energy.2021.121032
Yang, M., Wang, G., Lazin, R., Shen, X., and Anagnostou, E. (2021b). Impact of planting time soil moisture on cereal crop yield in the upper blue nile basin: A novel insight towards agricultural water management. Agric. Water Manag. 243, 106430. doi:10.1016/j.agwat.2020.106430
Yirong, Q. (2022). Does environmental policy stringency reduce CO2 emissions? Evidence from high-polluted economies. J. Clean. Prod. 341, 130648. doi:10.1016/j.jclepro.2022.130648
Yu, Y., Jiang, T., Li, S., Li, X., and Gao, D. (2020). Energy-related CO2 emissions and structural emissions’ reduction in China’s agriculture: An input–output perspective. J. Clean. Prod. 276, 124169. doi:10.1016/j.jclepro.2020.124169
Zhou, Y., Jiang, D., Ding, D., Wu, Y., Wei, J., Kong, L., et al. (2022). Ecological-health risks assessment and source apportionment of heavy metals in agricultural soils around a super-sized lead-zinc smelter with a long production history, in China. Environ. Pollut. 307, 119487. doi:10.1016/j.envpol.2022.119487
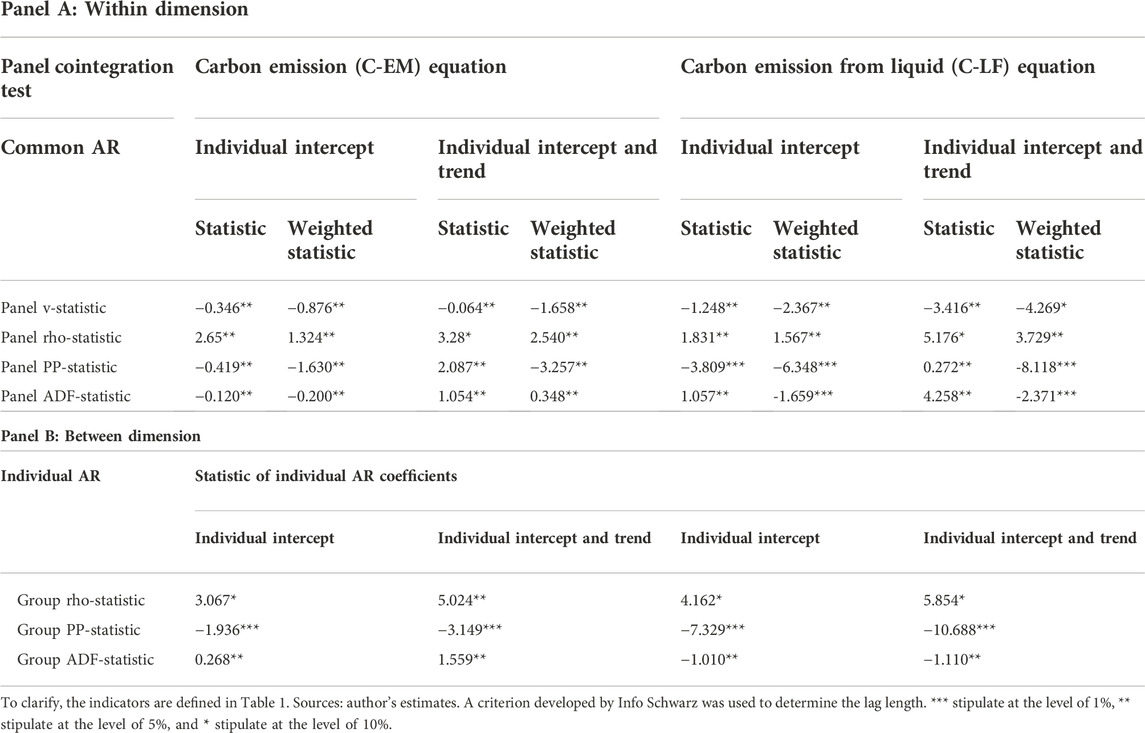
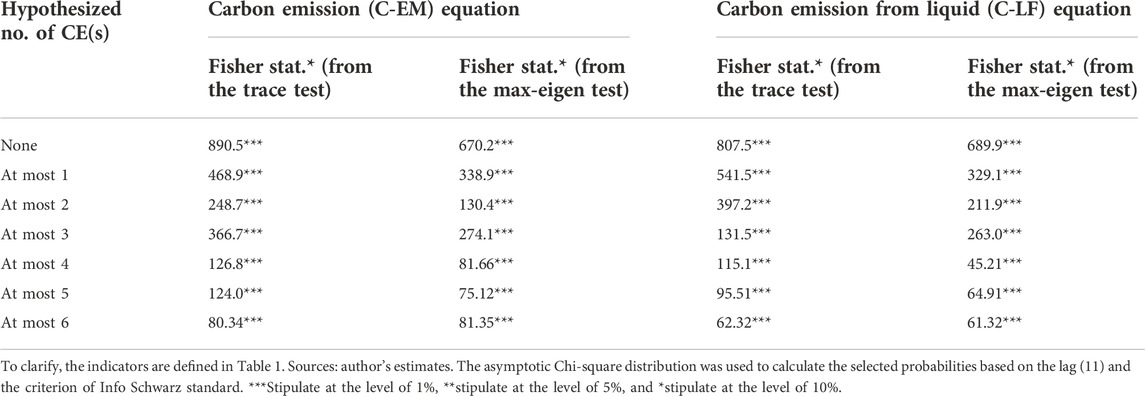
Keywords: agriculture production, environmental Kuznets curve (EKC), economic growth, CO2 emissions, energy consumption
Citation: Khan R, Zhuang W, Najumddin O, Butt RS, Ahmad I and Al-Faryan MAS (2022) The impact of agricultural intensification on carbon dioxide emissions and energy consumption: A comparative study of developing and developed nations. Front. Environ. Sci. 10:1036300. doi: 10.3389/fenvs.2022.1036300
Received: 05 September 2022; Accepted: 07 November 2022;
Published: 09 December 2022.
Edited by:
Faik Bilgili, Erciyes University, TurkeyReviewed by:
Muntasir Murshed, North South University, BangladeshCopyright © 2022 Khan, Zhuang, Najumddin, Butt, Ahmad and Al-Faryan. This is an open-access article distributed under the terms of the Creative Commons Attribution License (CC BY). The use, distribution or reproduction in other forums is permitted, provided the original author(s) and the copyright owner(s) are credited and that the original publication in this journal is cited, in accordance with accepted academic practice. No use, distribution or reproduction is permitted which does not comply with these terms.
*Correspondence: Rabnawaz Khan, a2hhbi1yYWJAb3V0bG9vay5jb20=; Weiqing Zhuang, em1ha2lvQGFsaXl1bi5jb20=
Disclaimer: All claims expressed in this article are solely those of the authors and do not necessarily represent those of their affiliated organizations, or those of the publisher, the editors and the reviewers. Any product that may be evaluated in this article or claim that may be made by its manufacturer is not guaranteed or endorsed by the publisher.
Research integrity at Frontiers
Learn more about the work of our research integrity team to safeguard the quality of each article we publish.