- 1 State Environmental Protection Key Laboratory of Wetland Ecology and Vegetation Restoration, School of Environment, Northeast Normal University, Changchun, China
- 2 Key Laboratory of Vegetation Ecology, Ministry of Education, Northeast Normal University, Changchun, China
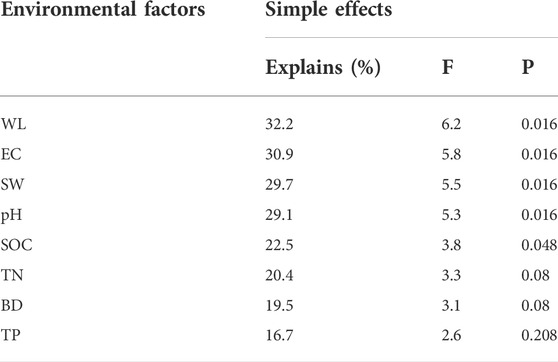
Understanding the relationship between vegetation and the environment is critical to manage bog ecosystems. However, information on how environmental factors influence the species composition and diversity in the ombrotrophic bog of Northeast China is lacking. Here, we investigated species compositions and environmental characteristics (water level, water conductivity, soil moisture content, bulk density, pH, organic carbon, total nitrogen, total phosphorous) from five sample sites along the water level gradients (the water level is below the surface, near the surface, and above the surface). Plant communities presented a patchy distribution pattern along the environmental gradients and could be divided into five types of communities. Moreover, the distribution of plant communities was mainly determined by water level, water conductivity, soil moisture content, pH, and organic carbon, which significantly explained 32.2%, 30.9%, 29.7%, 29.1%, and 22.5% of the variation in floristic composition. Among these factors, water level was the dominant factor influencing the distribution of plant communities. The partial least squares path model analysis showed that water level could influence plant diversity through different pathways, which could directly affect plant diversity and indirectly affect by changing water chemistry and soil properties. Additionally, soil pH contributed most to the indirect effects of water level on plant diversity. Thus, this study highlighted the high dependence of plant communities on water level and environmental factors driven by water level in ombrotrophic bogs, which provided some valuable implications for regional vegetation restoration and plant community stability.
Introduction
Peatlands are one of the largest terrestrial biosphere C pools, where ombrotrophic bogs account for more than 50% of the total peatlands and store approximately 15% of the global soil carbon. Thus, they played an irreplaceable role in alleviating the greenhouse effect and coping with climate change (Larmola et al., 2013). Recently, ombrotrophic bogs have been suffering from climate change and human activities, resulting in an increasingly obvious drought trend (Taufik et al., 2020). In fact, hydrological conditions were the main factors that regulated ecological processes and determined the species composition (Goud et al., 2018). However, ombrotrophic bogs rely only on precipitation for their moisture, vegetation is more sensitive to water level changes (Kokkonen et al., 2019), and more importantly, plant community structure and diversity strongly influence the ecological functions of bogs (Potvin et al., 2015; Ritson et al., 2016). Therefore, it is essential to understand the effects and mechanisms of water level and water level-regulated environmental conditions on plant community distribution and diversity.
One of the most striking features of ombrotrophic bogs is microtopographic heterogeneity, and hydroecological effects driven by microtopography are closely related to the distribution of plant communities (Yao et al., 2022). Indeed, the water level controls the soil moisture content and aeration, determining the species distribution (Chen et al., 2015). Moreover, water chemistry and soil physicochemical properties affected by water level also had significant effects on species distribution, such as water conductivity, soil pH and nutrient gradients (Vitt et al., 1995; Økland et al., 2001). Multiple studies showed that high pH in the soil resulted in an increase in Ca2+ concentrations and may inhibit plant growth (Tahvanainen 2004; Mullan-Boudreau et al., 2017). In addition, nutrient gradients were mainly related to nitrogen and phosphorus. In ombrotrophic bogs, nitrogen and phosphorus are present in very low amounts so that only plant species adapted to cope with low nutrient availability can survive (Pinsonneault et al., 2016). Thus, multiple environmental factors jointly regulated the species distribution. However, it was not clear which were the key environmental factors affecting species distribution in the ombrotrophic bog of Northeast China, and further study is needed to clarify the impact mechanism. We hypothesized that water level, water conductivity, soil moisture content, pH and organic carbon were the major environmental factors affecting plant distribution and that water level played a dominant role in plant community distribution.
In addition to regulating the distribution of plant communities, water level was also one of the key factors affecting the plant diversity in bogs (Pinceloup et al., 2020), which affected plant diversity in both direct and indirect ways. The direct effects of water level on plant diversity included that drainage reduced the species richness of bogs (Vasander et al., 2018). Moreover, water level may indirectly affect plant diversity by directly changing water chemistry and soil physicochemical properties (Ma et al., 2017). Much research has found that pH exhibited a downward trend when soil was flooded (Zhang et al., 2020), which decreased the amount of nutrients taken by plants, hampered the growth and development of some individual species and decreased the species richness (Boeraeve et al., 2022). Changes in water level affected nutrient cycling and transformations in bogs. For example, drainage resulted in elevated phosphorus release and increased plant diversity (Koskinen et al., 2017). However, in ombrotrophic bogs, it was unclear which factor played the most important role in the process of water level indirectly affecting plant diversity through regulating water chemistry and soil properties. Notably, soil nutrient availability generally coincides with acidity-alkalinity gradients in ombrotrophic bog ecosystems (Wells 1981), furthermore, pH influences soil accumulation rates, nutrient transformation and plant growth, which are key factors in regulating multiple processes (Väliranta et al., 2017; Van den Elzen et al., 2018; Liu et al., 2020). Therefore, this leads us to our second hypothesis: in addition to the direct effect of water level on plant diversity in ombrotrophic bogs, water level also had an indirect effect on plant diversity by directly changing water chemistry and soil properties, with soil pH making the largest contribution.
The study of the relationship and mechanism between environmental factors and species distribution as well as diversity will be helpful for vegetation restoration and protecting ecological functions, which is also the key to a deeper understanding of mechanisms for vegetation-climate feedbacks. The Jinchuan wetland is a typical ombrotrophic bog in Northeast China (Guo et al., 2019). Thus, this study took the Jinchuan wetland as a research object and addressed the following questions: 1) In ombrotrophic bogs, what were the main environmental factors affecting species distribution? 2) How did the water level influence plant diversity, and what were its impact pathways?
Materials and methods
Study sites
The study area is located in the Longwan National Nature Reserve (42°20′56″N, 126°22′51″E) (Figure 1) in the Longgang Mountain Range of the Western Changbai Mountains, China, with an altitude of 625 m. The study area is a small basin-type peatland formed by a volcanic crater, covering an area of approximately 80 hm2, with a regular temperature range of −40°C–30°C, an average annual temperature of 3.3°C, rainfall of approximately 900 mm, and a frost-free period of approximately 135 days (Wang et al., 2020). Natural precipitation is the main source for water supply, and the largest thickness of peat is 8.9 m. The terrain descends from northeast to southwest, with an elevation difference of 2.4 m (Figure 1). The surface soil of the peatland is silty loam, and the underlying surface of the peat layer is blue–gray clay or gray–yellow subclay characterized by low water permeability and dense stickiness. The main herbaceous plants include Carex schmidtii Meinsh., Carex tenuiflora, Phragmites australis (Cav.) Trin. ex Steud. Thelypteris palustris (L.) Schott, etc. The shrubs are dominated by Betula ovalifolia Rupr., Spiraea salicifolia L., and Lonicera caerulea L. var. edulis Turcz. ex Herd. (Shi et al., 2021).
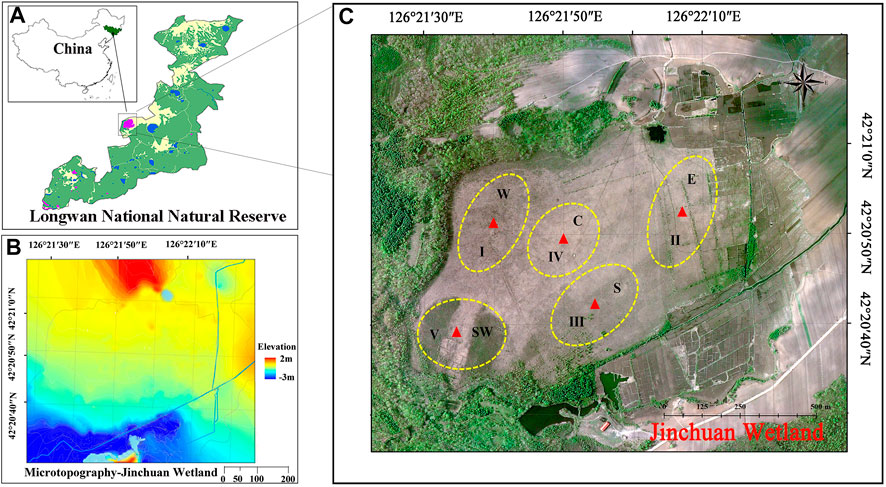
FIGURE 1. (A) Jinchuan Wetland in the study area is located in Longwan National Nature Reserve, China; (B) microtopographic map of Jinchuan Wetland; (C) layout map of the sample plots in the study area, English letters denote the names of the various sample plots, Roman numbers represent the plant communities corresponding to the various sample plots, and triangular marks denote the positions of the groundwater three-parameter automatic measuring instrument.
Monitoring of water levels and arrangement of sample plots
The Leica TS60 total station (Leica Ltd., Germany) was used to measure the elevation of the peatland on site, and more than 600 elevation point clouds were collected using a 30-m grid. Elevation data used the center C sample plot in the bog as the zero datum. Five monitoring sample points were set up as per the microtopographic elevations and water level gradients measured, and a groundwater three-parameter automatic measuring instrument CTD-diver (Eijkelkamp Ltd., Netherlands) was placed in the soil in all survey sample plots for real-time monitoring of the water level and conductivity at recording intervals of 30 min from May to September in 2012, 2013, 2015, and 2020. All sample plots were named E (east), S (south), C (central), W (west), and SW (southwest) according to their orientation (Figure 1).
Survey of plant communities
On 15 July 2020, the species composition of the plant communities in the study area was investigated during the period of vigorous plant growth and the most abundant biodiversity. Three 1 m × 1 m herbaceous plant lots were randomly selected from the five sample plots for investigation, and the species names, plant numbers, height, coverage and other indicators of all species in the lots were recorded on site. In each sample plot, three shrub plant survey lots, each covering an area of 10 m × 10 m, were selected. Data such as species name, height, coverage, base diameter, DBH, and crown width were recorded within each sample lot. The Chinese Virtual Herbarium (http://www.cvh.org.cn/) was used to identify and review the species recorded in the survey.
Analysis of soil properties
Concurrently with the plant community survey, soil samples were collected diagonally in each sample plot, with three replicates, at a sampling depth of 0–60 cm. Soil moisture content was determined by drying, the bulk density using the cutting-ring knife method, pH using the potentiometric method, and organic carbon by the potassium dichromate oxidation external heating method (Pansu and Gautheyrou 2007), total Nitrogen using Kjeldahl method (Bremner 1960), and total phosphorus was determined by digestion with HClO4–H2SO4 followed by molybdenum-blue colorimetry.
Plant community classification and diversity
To describe the functional status of species in the community, the importance value (IV) was used as the index of dominance of each species in the community. The calculation is as follows:
Two-way indicator species analysis was used to select 25 types of plants (IV value > 0.1) at five sample plots as clustering objects and establish a 5 × 25 matrix of relative importance values. WinTWINS 2.3 software was used to divide the community types (Hill 2005) and name the communities using the “Chinese Vegetation” classification scheme. The constructive or dominant species in each layer were arranged in sequence. The dominant species across layers were connected by a “-,” and the common dominant species in the same layer were connected by a “+”.
Species richness and diversity indices were selected to characterize species diversity using the following calculation (Magurran 2021):
Species richness index:
H (species diversity index) was calculated using the Shannon–Wiener index, which was described as follows:
where S represents the number of species in the plant community, and Pi is the proportion of the ith species in the total number of species.
Data analysis
The nonparametric test (Kruskal–Wallis test) was conducted to analyze the differences in water level and water conductivity in the different sample plots, and one-way ANOVA and the Duncan test were employed to analyze the differences in physicochemical properties of soil and species diversity. The Pearson correlation was utilized to analyze the relationship between water level and other environmental factors (IBM SPSS 22.0). A 5 × 25 matrix of relative importance values was established for canonical correspondence analysis of species and environmental factors (Canoco 5.0) (Ter Braak, 1986), and the Monte-Carlo method was employed to test and determine the contribution rate and significance of each environmental factor. The partial least squares path model was utilized to analyze the interaction relationship between species diversity and environmental factors (SmartPLS 3.3.5).
Results
Water level and conductivity
According to the real-time monitoring results over 4 years (from May to September in 2012, 2013, 2015, and 2020), the annual average water levels in the five sample plots showed significant differences (p < 0.05). As the terrain elevation decreased, the water level exhibited a rising trend, and the water level stability increased (Figure 2). The annual average water conductivity of the five sample plots had significant differences (p < 0.05), gradually decreasing as the water level rose (Figure 3).
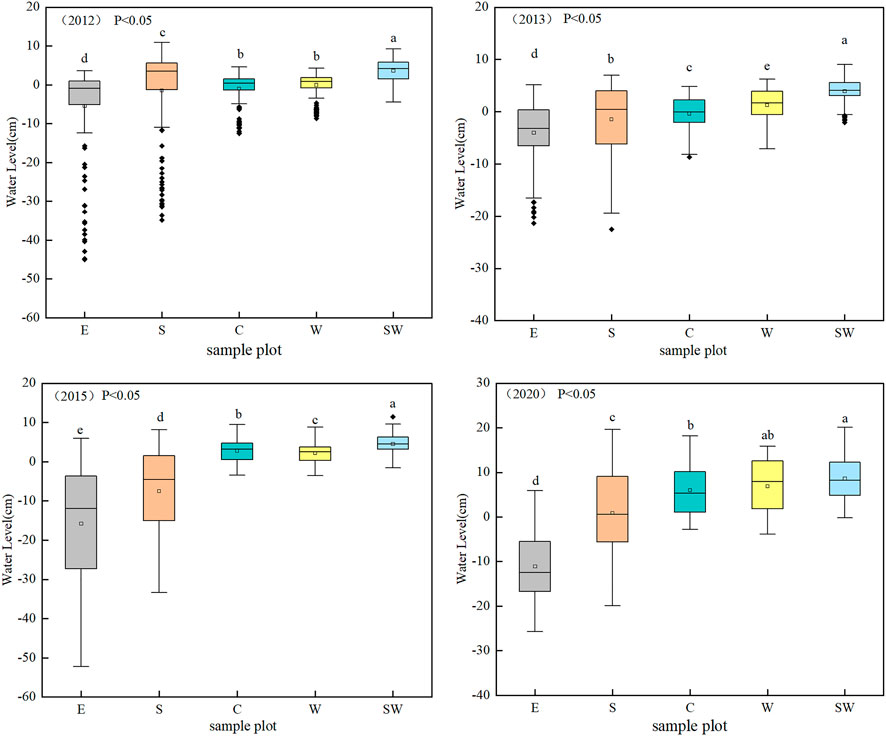
FIGURE 2. Boxplots of water level in various sample plots. Different lowercase letters indicate significant differences (p < 0.05).
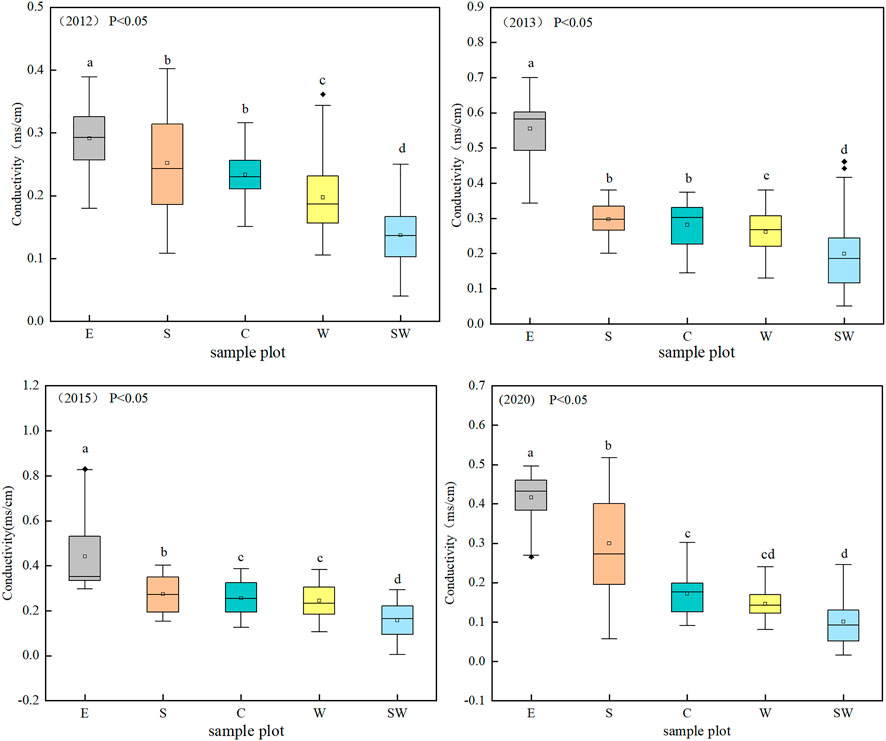
FIGURE 3. Boxplots of water conductivity in various sample plots. Different lowercase letters indicate significant differences (p < 0.05).
Relationships between water level, water conductivity, and soil properties
The physicochemical properties of the soil in various sample plots showed different degrees of differentiation (Table 1). The analysis of the Pearson correlation between water level, water conductivity, and soil properties showed that the water level was significantly positively correlated with the soil moisture content and organic carbon content (p < 0.01) and was significantly negatively correlated with water conductivity, soil bulk density and pH (p < 0.01). In addition, the water level was not significantly correlated with the total nitrogen content or total phosphorus content (Table 2).

TABLE 2. Pearson correlations between water level, water conductivity, and soil physicochemical parameters.
Community species composition
A total of 71 species of plants belonging to 38 families and 71 genera were collected from 15 sample plots in the study area. Two-way indicator species analysis was applied to quantitatively classify the plant communities into five major types of communities (Figure 4). The names of various types of communities were determined according to their dominant species, and in Supplementary Table S1, plant community types and main species of each sample plot were listed.
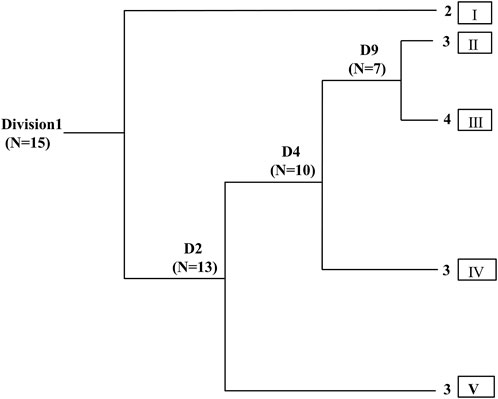
FIGURE 4. Two-way indicator species analysis classification results of vegetation. N is the number of sample plots for classification, and Di (i = 1, 2, 3...9) represents the sequence of division. Roman numerals correspond to the plant communities in the five plots in sequence (Figure 1).
Species diversity
The Shannon–Wiener index and the richness index of the plant communities increased with increasing water levels. Among them, the Shannon–Wiener and richness indices in the W and SW sample plots were greater than those in the other sample plots and were significantly different from those in sample plot E (p < 0.05). The Shannon–Wiener and richness indices of sample plot C were at the median level (Figure 5).
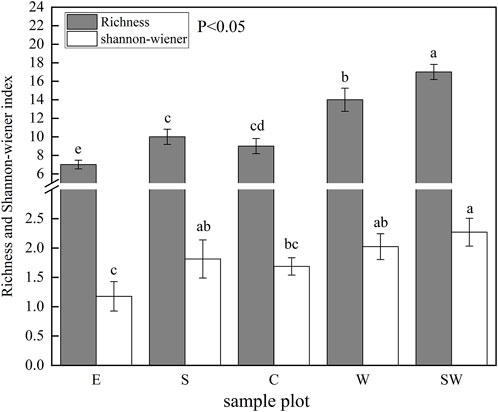
FIGURE 5. Distribution characteristics of plant diversity in the five sample plots. Different lowercase letters indicate significant differences (p < 0.05).
Relationships between environmental factors and species distribution
Canonical correspondence analysis was employed to analyze the relationship between species distribution and environmental factors (Figure 6). The results showed that the cumulative interpretation rate of the first and second axes of canonical correspondence analysis was 57.59% (36.39% for the first axis and 21.20% for the second axis), suggesting that environmental factors properly indicated the structure and distribution of plant communities. Upon testing the simple effects of eight environmental factors using the Monte Carlo method, it was found that water level, water conductivity, soil moisture content, soil pH, and soil organic carbon significantly explained 32.2%, 30.9%, 29.7%, 29.1%, and 22.5% of the variation in floristic composition, respectively (Table 3), and were the major environmental factors that determined the species distribution in the bogs. In addition, canonical correspondence analysis ordination analysis showed a patchy distribution of plant communities along water level gradients. The water level at sample site E was below the surface for a long time, and the dominant plants were Carex schmidtii Meinsh. And Phragmites australis (Cav.) Trin. ex Steud., with Thelypteris palustris (L.) Schott as an associated species. The dominant plants of flooded sample site SW were Carex schmidtii Meinsh., Thelypteris palustris (L.) Schott, Calla palustris L., and Betula ovalifolia Rupr. And the associated species were Phragmites australis (Cav.) Trin. ex Steud., Scirpus validus Vahl. And Betula fruticosa Pall.
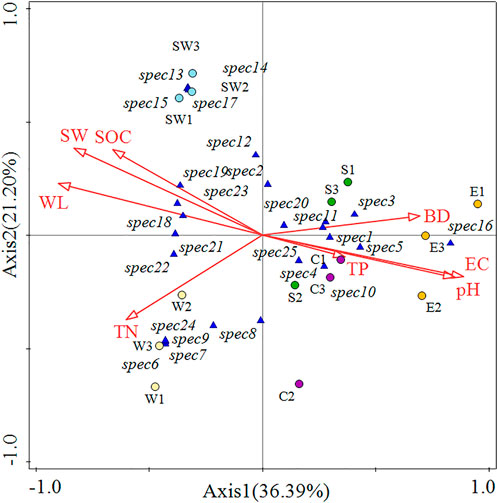
FIGURE 6. Canonical correspondence analysis ordination analysis of species distribution and environmental factors (WL, Water level; EC, Water conductivity; BD, Bulk density; SW, Soil moisture content; SOC, Soil organic carbon; TN, Total nitrogen; TP, Total phosphorous). spec1. Carex schmidtii Meinsh. spec2. Thelypteris palustris (L.) Schott. spec3. Lythrum salicaria L. spec4. Lysimachia davurica Ledeb. spec5. Phragmites australis (Cav.) Trin. ex Steud. spec6. Carex tenuiflora. spec7. Menyanthes trifoliata L. spec8. Saussurea japonica (Thunb.) DC. spec9. Viola verecunda A. Gray. spec10. Sanguisorba teriuifolia var. Alba Trautv. spec 11. Ligularia sibirica (L.) Cass. spec 12. Geranium wilfordii Maxim. Spec 13. Calla palustris L. spec 14. Scirpus validus Vahl. Spec 15. Scirpus radicans Schk. spec 16. Chosenia arbutifolia (Pall.) A. Skv. spec 17. Betula platyphylla Suk. spec 18. Betula ovalifolia Rupr. spec 19. Acer tataricum subsp. Ginnala. spec 20. Spiraea salicifolia L. spec 21. Salix rosmarinifolia var. Brachypoda (Trautv. et C. A. Mey.) Y. L. Chou. spec 22. Betula fruticosa Pall. spec 23. Lonicera caerulea L. var. edulis Turcz. ex Herd. spec 24. Ledum palustre L. spec 25. Sorbaria sorbifolia (L.) A. Braun.
Relationships between environmental factors and species diversity
The partial least squares path model was used to analyze the relationship between species diversity and environmental factors (Figure 7). The goodness-of-fit index was 0.6956, suggesting a good degree of fitting. Water level had a significant negative effect on soil pH and water conductivity (p < 0.01) and was significantly positively correlated with soil bulk density, soil moisture content, soil organic carbon, soil total nitrogen, and soil total phosphorus (p < 0.01). Water level and plant diversity had a significant positive correlation, and soil pH and species diversity had a significant negative correlation (p < 0.05). This result revealed that water level can directly affect plant diversity. Meanwhile, water level can also indirectly influence plant diversity by regulating soil physicochemical properties, and soil pH had the greatest effect.
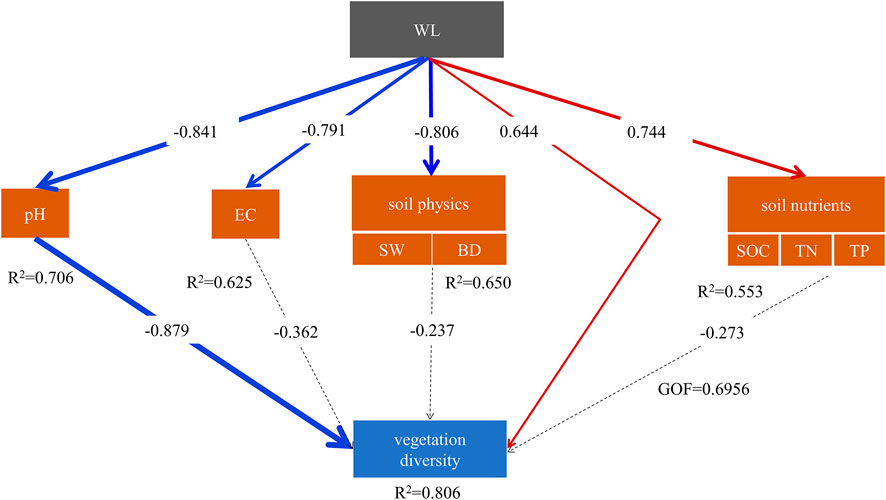
FIGURE 7. Analysis of the relationship between environmental factors and plant diversity (WL, Water level; EC, Water conductivity; BD, Bulk density; SW, Soil moisture content; SOC, Soil organic carbon; TN, Total nitrogen; TP, Total phosphorous). The arrows in the figure denote path relationships, and the numbers above the arrows denote path coefficients. The red line denotes a significant positive effect, and the blue line denotes a significant negative effect. A thicker line denoted a higher level of significance. The dotted line denotes no significant effect. R 2 denoted the variance of model interpretation. The model was assessed using the goodness of fit (GoF) statistic, a measure of overall prediction performance.
Discussion
Responses of plant community structure to water level gradients
Water level was the key factor affecting the distribution of plant communities in bogs (Nishimura and Tsuyuzaki 2014). In our study, water level had the greatest impact on species distribution (Table 3). The study area was more sensitive to changes in water levels because the supply of nutrients and moisture content to the ombrotrophic bog ecosystem was only dependent on local precipitation (Kokkonen et al., 2019). Indeed, the water level controlled the moisture content of the peat substrate, influencing the distribution of species that were sensitive to dryness and oxygen content (Bragazza et al., 2005).
Our survey results indicated that sample plot E was placed into drought and that xerophytic plants gradually replaced the hygrophyte species. For example, Phragmites australis (Cav.) Trin. ex Steud. Had a low demand for soil moisture and was constantly expanding at a high rate, which reached 9.22% coverage. The sample site SW was flooded for a long time, which provided favorable conditions for the growth of aquatic plants, such as Calla palustris L. and Scirpus validus Vahl., among these plants, the coverage of Calla palustris L. was 10.11%, which was the dominant species there. Additionally, Thelypteris palustris (L.) Schott depended heavily on soil moisture (Guo et al., 2017). Thelypteris palustris (L.) Schott had the greatest coverage (29.33%) in the flooded area (sample plot SW) as compared to the sample plots with low water levels.
In ombrotrophic bogs, shrubs were often found near their margins, mainly because the water level was usually lower and more fluctuating at the margins than at the center. Consequently, the aeration and nutrients of the peat substrate were greater at the margins (Pellerin et al., 2009), and those environmental conditions are known to favor the survival and growth of shrub species. However, contrary to expectations, the water level of sample site SW at the margins was higher than other sample plots, but with a relatively higher cover of shrubs (e.g., Betula ovalifolia Rupr., Betula fruticosa Pall.). The reason may be that the margin of the study area was close to the forest ecosystem with higher terrain and received nutrients from mineral soil, providing favorable conditions for the growth of shrubs.
Our study confirmed that sample plots with water levels below the surface may be invaded by xerophytic species, which seriously destroys the structure and function of the bog ecosystem. Therefore, more studies are necessary to deepen the understanding of vegetation distribution responses to changes in hydrological conditions, which will help us predict plant community succession patterns through changes in hydrological conditions and provide a theoretical basis for bog ecosystem restoration and management.
Relationships between environmental factors driven by water level and plant community composition
Bog vegetation is very sensitive to changes in water chemistry (Glaser et al., 1990), and the poor-rich gradient of vegetation is usually measured by water conductivity (Bragazza and Gerdol 2002). Our results showed that the difference in plant community structure was significant with the conductivity gradients. In terms of Phragmites australis (Cav.) Trin. ex Steud., the coverage in the flooded area (sample plot SW) was lower than that in the semiarid area (sample plot E), which may be closely related to water conductivity in addition to water level (Tulbure and Johnston 2010). Because the content of nutrient ions (e.g., NH4 +) in pore water was influenced by water conductivity (Zhang et al., 2019), available nitrogen regulated the dominance of Phragmites australis (Cav.) Trin. ex Steud. In bogs (Rohal et al., 2019). It can be concluded that water conductivity affected the proportion of Phragmites australis (Cav.) Trin. ex Steud in each sample plot.
Soil pH may ultimately affect vegetation distribution through differences in resource allocation. The experimental results indicated that the soil pH could partly explain the variability in the plant community distribution. For instance, the pH of sample plot E was relatively higher, which accelerated the decomposition and transformation of plant residues (Heller et al., 2015), and the available nutrients required by Carex tato were relatively sufficient, resulting in high aboveground and underground biomass. Thus, the size of the Carex tato in the semiarid area (sample plot E) was larger than that in the flooded area (sample plot SW). Additionally, the pH in these sample plots was relatively stable, ranging from 4 to 5, and the Ca2+ concentration was below 0.1 mg/L, while a certain amount of soluble iron was present for plant uptake and utilization (Glaser et al., 1990). Although there were only small differences in pH among the sample plots (Table 1), the valence state and concentration of iron also changed significantly with small fluctuations in pH (Yang et al., 2021), which in turn affected the species distribution with different tolerances to iron toxicity in plant communities.
Soil organic carbon is also a key environmental factor affecting vegetation distribution (Martí et al., 2015). In our study, organic carbon explained 22.5% of the species distribution variation because organic carbon can control soil enzyme activity by controlling the supply of nutrients required for soil microbes and regulating DOC content (Song et al., 2019), thus ultimately affecting the composition and distribution of species. To summarize, in addition to water level, water conductivity, soil pH, moisture content and organic carbon were also the main environmental factors determining the distribution of plant communities, which could answer our first question. In addition, Pearson correlation analysis indicated that water level was significantly correlated with water conductivity, soil pH and organic carbon. Consequently, the influence of the above environmental factors on plant distribution may be driven by the water level.
In conclusion, water conductivity, soil pH, and organic carbon were also crucial to the stability of bog ecosystems. Therefore, it is necessary to strengthen the management of surrounding farmland and take measures such as returning farmlands to wetlands to prevent farmland nutrients from entering bogs and maintain the stability of pore water and peat properties. Last, safeguarding the structure and function of bog ecosystems. Our research increased the capacity of the carbon sink and provided a scientific foundation for the protection of vegetation.
Water level influenced plant diversity not only directly but also indirectly by changing soil pH
Water level is an important environmental variable affecting species diversity (Pinceloup et al., 2020). In our study, the plant diversity in the sample plot with a water level below the surface (sample plot E) was lower than that in the sample plots with wetter hydrological conditions (Figure 7). There were two possible explanations for this result. First, a decline in water level improved the availability of soil nutrients, which encouraged plant roots to absorb nutrients, consequently increasing plant biomass and resulting in a significant reduction in the competitiveness of some species. Finally, plant diversity showed a decreasing trend (Cao et al., 2017). Second, the effect of water level on seed bank and seedling establishment determined the species diversity (Hong et al., 2012), and one study suggested that the germination rate of Carex significantly decreased by 50% after soil drought (Nygaard and Ejrnaes 2009). Compared to the area with a water level below the surface, permanent anoxic conditions in the flooded area slowed decomposition and reduced seed decay because waterlogged conditions can inhibit the growth of fungi (Mackenzie and Naeth 2019), thus, the increase in plant diversity could be due to a higher seed germination percentage.
The environmental heterogeneity driven by water level played an important role in species diversity, which controlled diversity through different spatial ecological niches (Bubier et al., 2006). Our results indicated that water level could indirectly affect plant diversity by regulating soil physicochemical properties; among multiple factors, only soil pH had a significant impact on plant diversity (Figure 7), which could answer our second question. Some research reported that bog surface dryness did not necessarily lead to an increase in the rate of nutrient mineralization because low pH did not stimulate mineralization processes (Bragazza and Gerdol 2002). Therefore, soil pH seemed to be an ultimate environmental driver that gave rise to and amplified the interactions between aboveground and underground systems (Song et al., 2019). In our study, the soil pH in the semiarid area (sample plot E) was 5.64 ± 0.10, while the pH in the flooded area (sample plot SW) dropped below 5.0 (Table 1). The decrease in pH resulted in a slower decomposition rate of organic carbon and reduced the dominance of fast-growing species, which usually promoted the increase in species diversity (Gaberščik et al., 2018). Moreover, soil pH can alter species composition through differential fitness impacts on different plants (Dingaan et al., 2017) and can be an indicator of plant diversity. In fact, most Sphagnum species adapted to extremely acidic environments and were sensitive to Ca2+ concentrations. In habitats with relatively high soil pH, high Ca2+ concentrations could produce certain toxicity, endangering the growth of Sphagnum species (Hájek et al., 2007), resulting in the reduction of species diversity.
The eastern part of the study area had suffered a change in land cover, and a large amount of water was irrigated to surrounding farmland from the study area and already arid areas (sample plot E) tending to become more arid. Therefore, some hygrophyte species are unable to cope with the arid environment, resulting in reduced species diversity. In addition, the sample plot was SW in the marginal area of the bog and was susceptible to the influence of adjacent habitats (forest swamps) (Szatylowicz et al., 2014). Therefore, the impact of human interference and adjacent habitats on species distribution and diversity in bogs deserves further study, which will help further understand the mechanism of species distribution patterns and provide a theoretical basis for the response and adaptation mechanism of plant communities under the background of climate change.
Conclusion
We demonstrated that species distribution and diversity were highly dependent on environmental factors in the ombrotrophic bog of Northeast China, indicating that water level, water conductivity, soil moisture content, pH, and organic carbon were the main environmental factors affecting species distribution. In particular, water level regulated the intensity of other factors affecting species distribution, which was the dominant factor influencing the distribution of plant communities. Our results highlighted that water level affected plant diversity in direct and indirect ways. Soil pH contributed most to the indirect effects of water level on plant diversity. Considering that bogs suffer from climate change and human activities that threaten their important ecological functions, this work provides some valuable implications for regional vegetation restoration and plant community stability.
Data availability statement
The original contributions presented in the study are included in the article/Supplementary Material, further inquiries can be directed to the corresponding author.
Author contributions
YL: Data curation and analysis, writing–original draft. XW: Aided in interpreting the results and worked on the manuscript. LS: Worked on the technical details, supervised the findings of the work and helped in the development of manuscript. CH: Writing–review and editing. HJ: Data curation.
Funding
This study was supported by the National Natural Science Foundation of China (Grant Numbers 41901116, U19A2042) and the Major Scientific and Technological Program of Jilin Province (Grant Number 20200503001SF).
Acknowledgments
We thank Liang Ma, Xiaohan Yao, Dehao Li, and Jie Gao for assistance with field sampling and laboratory work.
Conflict of interest
The authors declare that the research was conducted in the absence of any commercial or financial relationships that could be construed as a potential conflict of interest.
Publisher’s note
All claims expressed in this article are solely those of the authors and do not necessarily represent those of their affiliated organizations, or those of the publisher, the editors and the reviewers. Any product that may be evaluated in this article, or claim that may be made by its manufacturer, is not guaranteed or endorsed by the publisher.
Supplementary material
The Supplementary Material for this article can be found online at: https://www.frontiersin.org/articles/10.3389/fenvs.2022.1032068/full#supplementary-material
References
Boeraeve, M., Kohout, P., Ceulemans, T., Cajthaml, T., Tedersoo, L., and Jacquemyn, H. (2022). Changes in the root microbiome of four plant species with different mycorrhizal types across a nitrogen deposition gradient in ombrotrophic bogs. Soil Biol. Biochem. 169, 108673. doi:10.1016/j.soilbio.2022.108673
Bragazza, L., and Gerdol, R. (2002). Are nutrient availability and acidity‐alkalinity gradients related in sphagnum‐dominated peatlands? J. Veg. Sci. 13, 473–482. doi:10.1111/j.1654-1103.2002.tb02074.x
Bragazza, L., Rydin, H., and Gerdol, R. (2005). Multiple gradients in mire vegetation: A comparison of a Swedish and an Italian bog. Plant Ecol. 177, 223–236. doi:10.1007/s11258-005-2182-2
Bremner, J. (1960). Determination of nitrogen in soil by the kjeldahl method. J. Agric. Sci. 55 (1), 11–33. doi:10.1017/S0021859600021572
Bubier, J. L., Moore, T. R., and Crosby, G. (2006). Fine-scale vegetation distribution in a cool temperate peatland. Can. J. Bot. 84, 910–923. doi:10.1139/B06-044
Cao, R., Wei, X., Yang, Y., Xi, X., and Wu, X. (2017). The effect of water table decline on plant biomass and species composition in the zoige peatland: A four-year in situ field experiment. Agric. Ecosyst. Environ. 247, 389–395. doi:10.1016/j.agee.2017.07.008
Chen, X., Li, X., Xie, Y., Li, F., Hou, Z., and Zeng, J. (2015). Combined influence of hydrological gradient and edaphic factors on the distribution of macrophyte communities in dongting lake wetlands, China. Wetl. Ecol. Manag. 23, 481–490. doi:10.1007/s11273-014-9396-9
Dingaan, M. N. V., Tsubo, M., Walker, S., and Newby, T. (2017). Soil chemical properties and plant species diversity along a rainfall gradient in semi-arid grassland of South Africa. Plant Ecol. Evol. 150 (1), 35–44. doi:10.5091/plecevo.2017.1260
Gaberščik, A., Krek, J. L., and Zelnik, I. (2018). Habitat diversity along a hydrological gradient in a complex wetland results in high plant species diversity. Ecol. Eng. 118, 84–92. doi:10.1016/j.ecoleng.2018.04.017
Glaser, P. H., Janssens, J. A., and Siegel, D. I. (1990). The response of vegetation to chemical and hydrological gradients in the lost river peatland, northern Minnesota. J. Ecol. 78, 1021–1048. doi:10.2307/2260950
Goud, E. M., Watt, C., and Moore, T. R. (2018). Plant community composition along a peatland margin follows alternate successional pathways after hydrologic disturbance. Acta oecol. (Montrouge). 91, 65–72. doi:10.1016/j.actao.2018.06.006
Guo, B., Wang, J., Lin, C., He, M., and Ouyang, W. (2019). Anthropogenic and lithogenic fluxes of atmospheric lead deposition over the past 3600 years from a peat bog, changbai mountains, China. Chemosphere 227, 225–236. doi:10.1016/j.chemosphere.2019.04.047
Guo, J., Jiang, H., Bian, H., Sheng, L., He, C., and Gao, Y. (2017). Natural succession is a feasible approach for cultivated peatland restoration in northeast China. Ecol. Eng. 104, 39–44. doi:10.1016/j.ecoleng.2017.04.001
Hájek, M., Horsák, M., Hájková, P., and Dítě, D. (2007). Habitat diversity of central European fens in relation to environmental gradients and an effort to standardise fen terminology in ecological studies. Perspect. Plant Ecol. Evol. Syst. 8, 97–114. doi:10.1016/j.ppees.2006.08.002
Heller, C., Ellerbrock, R., Roßkopf, N., Klingenfuß, C., and Zeitz, J. (2015). Soil organic matter characterization of temperate peatland soil with ftir‐spectroscopy: Effects of mire type and drainage intensity. Eur. J. Soil Sci. 66, 847–858. doi:10.1111/ejss.12279
Hill, M. O. (2005). Twinspan for windows, version 2.3 Available at: http://www.canodraw.com/wintwins.htm.
Hong, J., Shu, L., Shi, G., and Zhang, Y. (2012). Soil seed bank techniques for restoring wetland vegetation diversity in yeyahu wetland, beijing. Ecol. Eng. 42, 192–202. doi:10.1016/j.ecoleng.2012.01.004
Kokkonen, N. A., Laine, A. M., Laine, J., Vasander, H., Kurki, K., Gong, J., et al. (2019). Responses of peatland vegetation to 15‐year water level drawdown as mediated by fertility level. J. Veg. Sci. 30, 1206–1216. doi:10.1111/jvs.12794
Koskinen, M., Tahvanainen, T., Sarkkola, S., Menberu, M. W., Laurén, A., Sallantaus, T., et al. (2017). Restoration of nutrient-rich forestry-drained peatlands poses a risk for high exports of dissolved organic carbon, nitrogen, and phosphorus. Sci. Total Environ. 586, 858–869. doi:10.1016/j.scitotenv.2017.02.065
Larmola, T., Bubier, J. L., Kobyljanec, C., Basiliko, N., Juutinen, S., Humphreys, E., et al. (2013). Vegetation feedbacks of nutrient addition lead to a weaker carbon sink in an ombrotrophic bog. Glob. Chang. Biol. 19, 3729–3739. doi:10.1111/gcb.12328
Liu, Y., Du, J., Xu, X., Kardol, P., and Hu, D. (2020). Microtopography-induced ecohydrological effects alter plant community structure. Geoderma 362, 114119. doi:10.1016/j.geoderma.2019.114119
Ma, M., Baskin, C. C., Yu, K., Ma, Z., and Du, G. (2017). Wetland drying indirectly influences plant community and seed bank diversity through soil pH. Ecol. Indic. 80, 186–195. doi:10.1016/j.ecolind.2017.05.027
Mackenzie, D. D., and Naeth, M. A. (2019). Native seed, soil and atmosphere respond to boreal forest topsoil (lfh) storage. PLoS One 14, e0220367. doi:10.1371/journal.pone.0220367
Magurran, A. E. (2021). Measuring biological diversity. Curr. Biol. 31, R1174–R1177. doi:10.1016/j.cub.2021.07.049
Martí, M., Juottonen, H., Robroek, B. J., Yrjälä, K., Danielsson, Å., Lindgren, P.-E., et al. (2015). Nitrogen and methanogen community composition within and among three sphagnum dominated peatlands in scandinavia. Soil Biol. Biochem. 81, 204–211. doi:10.1016/j.soilbio.2014.11.016
Mullan-Boudreau, G., Belland, R., Devito, K., Noernberg, T., Pelletier, R., and Shotyk, W. (2017). Sphagnum moss as an indicator of contemporary rates of atmospheric dust deposition in the athabasca bituminous sands region. Environ. Sci. Technol. 51, 7422–7431. doi:10.1021/acs.est.6b06195
Nishimura, A., and Tsuyuzaki, S. (2014). Effects of water level via controlling water chemistry on revegetation patterns after peat mining. Wetlands 34, 117–127. doi:10.1007/s13157-013-0490-1
Nygaard, B., and Ejrnaes, R. (2009). The impact of hydrology and nutrients on species composition and richness: Evidence from a microcosm experiment. Wetlands 29, 187–195. doi:10.1672/08-13.1
Økland, R. H., Økland, T., and Rydgren, K. (2001). A scandinavian perspective on ecological gradients in north-west European mires: Reply to wheeler and proctor. J. Ecol. 89, 481–486. doi:10.1046/j.1365-2745.2001.00573.x
Pansu, M., and Gautheyrou, J. (2007). Handbook of soil analysis: Mineralogical, organic and inorganic methods. Heidelberg, Germany: Springer Science & Business Media Press.
Pellerin, S., Lagneau, L.-A., Lavoie, M., and Larocque, M. (2009). Environmental factors explaining the vegetation patterns in a temperate peatland. C. R. Biol. 332, 720–731. doi:10.1016/j.crvi.2009.04.003
Pinceloup, N., Poulin, M., Brice, M.-H., and Pellerin, S. (2020). Vegetation changes in temperate ombrotrophic peatlands over a 35 year period. PLoS One 15, e0229146. doi:10.1371/journal.pone.0229146
Pinsonneault, A. J., Moore, T. R., and Roulet, N. T. (2016). Effects of long-term fertilization on peat stoichiometry and associated microbial enzyme activity in an ombrotrophic bog. Biogeochemistry 129, 149–164. doi:10.1007/s10533-016-0224-6
Potvin, L. R., Kane, E. S., Chimner, R. A., Kolka, R. K., and Lilleskov, E. A. (2015). Effects of water table position and plant functional group on plant community, aboveground production, and peat properties in a peatland mesocosm experiment (peatcosm). Plant Soil 387, 277–294. doi:10.1007/s11104-014-2301-8
Ritson, J. P., Bell, M., Brazier, R. E., Grand-Clement, E., Graham, N. J., Freeman, C., et al. (2016). Managing peatland vegetation for drinking water treatment. Sci. Rep. 6, 36751. doi:10.1038/srep36751
Rohal, C. B., Cranney, C., Hazelton, E. L., and Kettenring, K. M. (2019). Invasive phragmites australis management outcomes and native plant recovery are context dependent. Ecol. Evol. 9, 13835–13849. doi:10.1002/ece3.5820
Shi, Y., Zhang, X., Wang, Z., Xu, Z., He, C., Sheng, L., et al. (2021). Shift in nitrogen transformation in peatland soil by nitrogen inputs. Sci. Total Environ. 764, 142924. doi:10.1016/j.scitotenv.2020.142924
Song, Y., Song, C., Shi, F., Wang, M., Ren, J., Wang, X., et al. (2019). Linking plant community composition with the soil C pool, N availability and enzyme activity in boreal peatlands of Northeast China. Appl. Soil Ecol. 140, 144–154. doi:10.1016/j.apsoil.2019.04.019
Szatylowicz, J, Okruszko, T, Miroslaw-Swiatek, D, Mateusz, G, and Okke, B, (2014). Evapotranspiration of bush encroachments on a temperate mire meadow - a nonlinear function of landscape composition and groundwater flow. Ecol. Eng. 73, 598–609. doi:10.1016/j.ecoleng.2014.09.041
Tahvanainen, T. (2004). Water chemistry of mires in relation to the poor-rich vegetation gradient and contrasting geochemical zones of the north-eastern fennoscandian shield. Folia Geobot. 39, 353–369. doi:10.1007/BF02803208
Taufik, M., Minasny, B., McBratney, A., Van Dam, J., Jones, P., and Van Lanen, H. (2020). Human-induced changes in Indonesian peatlands increase drought severity. Environ. Res. Lett. 15, 084013. doi:10.1088/1748-9326/ab96d4
Ter Braak, C. J. (1986). Canonical correspondence analysis: A new eigenvector technique for multivariate direct gradient analysis. Ecology 67, 1167–1179. doi:10.2307/1938672
Tulbure, M. G., and Johnston, C. A. (2010). Environmental conditions promoting non-native phragmites australis expansion in great lakes coastal wetlands. Wetlands 30, 577–587. doi:10.1007/s13157-010-0054-6
Väliranta, M., Salojärvi, N., Vuorsalo, A., Juutinen, S., Korhola, A., Luoto, M., et al. (2017). Holocene fen–bog transitions, current status in Finland and future perspectives. Holocene 27, 752–764. doi:10.1177/0959683616670471
van den Elzen, E., van den Berg, L. J., van der Weijden, B., Fritz, C., Sheppard, L. J., and Lamers, L. P. (2018). Effects of airborne ammonium and nitrate pollution strongly differ in peat bogs, but symbiotic nitrogen fixation remains unaffected. Sci. Total Environ. 610, 732–740. doi:10.1016/j.scitotenv.2017.08.102
Vasander, H., Laiho, R., and Laine, J. (2018). Northern forested wetlands. England, UK: Routledge Press, p109–p119.
Vitt, D. H., Bayley, S. E., and Jin, T.-L. (1995). Seasonal variation in water chemistry over a bog-rich fen gradient in continental Western Canada. Can. J. Fish. Aquat. Sci. 52, 587–606. doi:10.1139/f95-059
Wang, X., Bai, X., Ma, L., He, C., Jiang, H., Sheng, L., et al. (2020). Snow depths’ impact on soil microbial activities and carbon dioxide fluxes from a temperate wetland in northeast China. Sci. Rep. 10, 8709. doi:10.1038/s41598-020-65569-x
Wells, E. D. (1981). Peatlands of eastern newfoundland: Distribution, morphology, vegetation, and nutrient status. Can. J. Bot. 59, 1978–1997. doi:10.1139/b81-260
Yang, L., Jiang, M., Zou, Y., Qin, L., and Chen, Y. (2021). Geographical distribution of iron redox cycling bacterial community in peatlands: Distinct assemble mechanism across environmental gradient. Front. Microbiol. 12, 674411. doi:10.3389/fmicb.2021.674411
Yao, S., Chen, C., Chen, Q., Cui, Z., Zhang, J., and Zeng, Y. (2022). Impact of short‐term hydrological components on landscape pattern of waterbird habitat in floodplain wetlands. Water Resour. Res. 58, e2021WR031822. doi:10.1029/2021WR031822
Zhang, D., Qi, Q., Tong, S., Wang, X., An, Y., Zhang, M., et al. (2019). Soil degradation effects on plant diversity and nutrient in tussock meadow wetlands. J. Soil Sci. Plant Nutr. 19, 535–544. doi:10.1007/s42729-019-00052-9
Keywords: bog, water level, environmental gradients, species distribution, species diversity
Citation: Li Y, Wang X, He C, Jiang H and Sheng L (2022) Multi-environment factors dominate plant community structure and diversity in an ombrotrophic bog: The water level is the main regulating mechanism. Front. Environ. Sci. 10:1032068. doi: 10.3389/fenvs.2022.1032068
Received: 30 August 2022; Accepted: 20 September 2022;
Published: 04 October 2022.
Edited by:
Yuanchun Zou, Northeast Institute of Geography and Agroecology (CAS), ChinaCopyright © 2022 Li, Wang, He, Jiang and Sheng. This is an open-access article distributed under the terms of the Creative Commons Attribution License (CC BY). The use, distribution or reproduction in other forums is permitted, provided the original author(s) and the copyright owner(s) are credited and that the original publication in this journal is cited, in accordance with accepted academic practice. No use, distribution or reproduction is permitted which does not comply with these terms.
*Correspondence: Lianxi Sheng, c2hlbmdseEBuZW51LmVkdS5jbg==
 Yue Li
 Xue Wang1,2
 Chunguang He
