
94% of researchers rate our articles as excellent or good
Learn more about the work of our research integrity team to safeguard the quality of each article we publish.
Find out more
ORIGINAL RESEARCH article
Front. Environ. Sci., 10 January 2023
Sec. Land Use Dynamics
Volume 10 - 2022 | https://doi.org/10.3389/fenvs.2022.1030796
This article is part of the Research TopicTowards Sustainable Urban Development: Use of Geographic Big Data for Spatial PlanningView all 25 articles
 Shuna Xu*
 Yinzhen Wang
Park green space is an important ecological factor of the urban built-up environment, and it plays an increasingly important role in improving human welfare and the quality of urban life. Accessibility analysis of urban park green space is an issue of social equity and environmental justice that has received widespread attention. The accessibility of a city’s park green space must be evaluated under the correct scale and resolution before it can be applied to urban green space planning. To measure the impact of different research scales on accessibility, Weidu District of Xuchang City, Henan Province, China, was taken as the experimental area. The Gaussian-based two-step floating catchment area method was used to compare and analyze the accessibility differences under three scales: subdistrict, community, and residential quarter. The influence of the source and destination point modes on accessibility was analyzed at the residential quarter scale. Results show that the accessibility of park green space at the subdistrict scale is different from that at the community and residential quarter scales in terms of spatial distribution characteristics and quantitative relationship. The accessibility of the geometric center mode and the entrance and exit mode at the residential quarter scale is similar in overall distribution and different in local quantity. Overall, the accessibility of the park green space at the residential quarter scale under the entrance and exit mode and the spatial fairness of visiting the park green space are better than that under the geometric mode. Therefore, accessibility analysis of park green space should be performed cautiously when taking the aggregation unit as the basic research unit. The accessibility of the aggregation unit is not the statistical summary of its subunits, especially when the area of the aggregation unit is far larger than the walking range of residents, and is thus likely to lead to wrong conclusions. Accessibility analysis should be conducted on the finest scale possible rather than the aggregation scale and use true distance rather than the centroid-to-centroid surrogate to obtain reliable results for further guiding urban green space planning.
The World Urban Report 2020 (Knudsen et al., 2020) shows through detailed demonstration that urbanization will continue to be the driving force of global growth. In the next 10 years, the proportion of the urban population in the global population will increase from 56.2% at present to 60.4% in 2030. While providing convenience for people’s lives, high urbanization also brings a series of environmental pressures, such as the urban heat island effect and air pollution. Research shows that a causal relationship exists between the increase in lung cancer, cardiopulmonary disease, pediatric asthma, and urban air pollution (Larondelle and Lauf, 2016). As an important ecological factor of the urban built environment, park green space plays an important role in improving human wellbeing and urban life quality by improving the ecological environment, increasing sports activities and social interaction within the neighborhood, and improving people’s ability to participate in society (Hunter et al., 2019). Wang and Lan (2019) showed that the quantity, quality, and accessibility indicators of urban park green space have a significant negative correlation with the incidence rate of cardiopathy, chronic pneumonia, and hypertension. People often engage in outdoor entertainment activities in the natural environment near their residence, which can not only increase their health and happiness but also help them cope better with work pressure, mental fatigue, and depression (Buchecker and Degenhardt, 2015; Kondo et al., 2018; Hunter et al., 2019; Wang and Lan, 2019). Therefore, by providing accessible, attractive, well-maintained green spaces with room for socialization and encouraging people to use it, urban green spaces can effectively promote the physical and mental health of urban residents (Hunter et al., 2015; Kruize et al., 2019).
However, providing adequate park green spaces is challenging because housing, retail, and commercial developments, and transport infrastructure are all competing for limited space (Hunter et al., 2019). In most cases, park green spaces are not evenly distributed in the space within the cities (You, 2016). Unfair access to park green space may lead to environmental injustice, which can be accompanied by social stratification and housing segregation (Xiao et al., 2019). Thus, analyzing the spatial distribution characteristics of urban park green space accessibility is of great significance in promoting the fair and reasonable layout of urban park green space and improving the overall happiness of urban residents. Access to park green space is referred to as “accessibility,” which is a key factor that affects the selection and use frequency of park green space (Žlender and Ward Thompson, 2016; Agimass et al., 2018; Mears et al., 2019; Tardieu and Tuffery, 2019; Zhang and Tan, 2019; Tu et al., 2020). Two kinds of accessibility measure methods exist. Place-based accessibility measures examine the proximity to desired activity locations from key locations in an individual’s daily life, such as the home or workplace. People-based accessibility measures rely on detailed observations of an individual’s activity schedule and space-time constraints (Neutens et al., 2010). Place-based accessibility is affected by the size and location of residential and recreational areas, the road network between them, and the mode of travel. Two main methods can be used for early place-based accessibility analysis: the travel cost and gravity model methods. The travel cost method determines the nearest park green space from the residential area according to the principle of minimum cost (distance, time, and money) (e.g., Ala-Hulkko et al., 2016; Wüstemann et al., 2017). Information such as the number of people living in the area and the scale of the park green space is not considered. The gravity model method assumes that spatial interaction decreases with the increase in the spatial distance between the residence and the destination. The gravity model is used to measure the attraction of each park green space to a certain residence and adds these attractions to obtain the accessibility of the park green space of the residence (e.g., Lee and Hong, 2013; Xiao et al., 2017). This method considers the distance between residence and park green space, number, and scale of the park green space. However, the influence of the size of the resident population is ignored. In view of the shortcomings of the above two methods, the two-step floating catchment area method (Radke and Mu, 2000), its improved version (the enhanced two-step floating catchment area method; Luo and Qi, 2009), and the Gaussian-based two-step floating catchment area method (Dai, 2011) have been increasingly used in the accessibility analysis of park green space (e.g., Shen et al., 2017; Wei, 2017; Li et al., 2019). The two-step floating catchment area method calculates the ease with which each resident can reach the park green space according to the population of the residence and the area of the park green space and their spatial distribution characteristics and path distances.
At present, place-based accessibility analysis of park green space is mostly based on administrative division units (e.g., You, 2016; Shen et al., 2017; Wei, 2017; Li et al., 2019; Wang and Lan, 2019; Hu et al., 2020; Shi et al., 2020; Zhang et al., 2022) or grid units (e.g., Ala-Hulkko et al., 2016; Xing et al., 2018; Guo et al., 2019; Shi et al., 2020) to analyze the spatial distribution characteristics, time-varying characteristics, and the correlation between accessibility and population, and socioeconomic indicators, and then analyze the spatial and social fairness of the urban green space distribution. These methods take the geometric center of the aggregation area as the source point and the geometric center of the park green space as the destination point to calculate the accessibility of the park green space of each research unit at a specific spatial scale. Spatial aggregation can affect the results of accessibility analysis (Miller, 2016). A major difference exists between the source and destination points here, and the actual origins and destinations of travelers in reality, bringing great uncertainty to the final accessibility results. Ahuja et al. (2021) pointed out the problem of mismatch between zone and movement scales in place-based accessibility analysis. This type of research is lacking in operability to guide the practice of urban green space planning (Liu et al., 2020). Tan and Samsudin (2017) studied the scale effect of the spatial fairness of urban park green space and found that the unfairness at the small scale was more intense than that at the large scale. They also emphasized the need to guide urban park planning at the neighborhood scale.
What impact will different research scales have on the accessibility analysis of urban park green space, and would different location selection methods of source and destination points have a significant impact on the accessibility results? In view of this problem, this paper takes Weidu District of Xuchang City as the experimental area and analyzes the spatial distribution characteristics of urban park green space accessibility and their relationship at three scales, namely, subdistrict (the fourth-level administrative division in China), community (the fifth-level administrative division in China), and residential quarter (the most basic population gathering area in the city). In China, the first two administrative division scales are frequently used as basic units for the accessibility analysis of urban park green space. A subdistrict consists of several communities, while a community consists of several residential quarters. At the residential quarter scale, the differences and relations between the two modes of accessibility are compared and analyzed, with one taking the geometric centers of the residential quarter and the park green space as the source and destination points (geometric center mode), and the other taking the entrance and exit of the two as the source and destination points (entrance and exit mode). The possible problems in the analysis of different research scales and accessibility modes are summarized to determine the research scale and method suitable for guiding the practice of urban green space planning.
The accessibility model is used to analyze the access of residents to the park green space (accessibility). On the basis of the spatial location, scale, and road network of the park green space and the residence area, the Gaussian-based two-step floating catchment area method (Dai, 2011) is used to calculate the accessibility of each residence. The process is divided into two steps.
In the first step, for each park green space j, path distance threshold d0 is given to form its spatial service range. For the population of each residence place k falling within its service range, the Gaussian equation is used to assign the corresponding weight according to the distance from the park green space. Then, the weighted sum is derived to obtain the potential users of park green space j. Next, the size of the green space is divided by the number of potential users to obtain supply and demand ratio Rj (m2/person).
where Pk is the population of residence place k within the service scope of green park j (dkj ≤ d0); dkj is the distance from the geometric center (or entrance) of residence place k to the geometric center (or entrance) of park green space j; Sj is the scale of park green space j, which is expressed by the area; and G(dkj, d0) is a Gaussian equation that considers the space friction problem. The calculation method is shown in Eq. 2.
In the second step, for each residence place i, given path distance threshold d0, the reachable range is formed. Similarly, the supply ratio (Rl) of each park green space l within the reachable range is weighted by the Gaussian equation. Then, the weighted sum of these supply ratios is used to obtain the park green space accessibility (Ai) for each residence place i. The size of Ai indicates the per capita occupancy of the urban park green space in each residence place within its reach, given in m2/person.
where l refers to all the park green spaces within the accessible space of residence place i (dil ≤ d0). Considering that the recreational activities of the residents who visit the park green space are mainly walking and cycling, distance threshold d0 is set to 1,000 m, that is, approximately 10–15 min’ walk. This threshold is determined for two reasons. First, 1,000 m (or 10–15 min) is an acceptable walking distance for residents to visit the park green space (You, 2016; Žlender and Ward Thompson, 2016; Guo et al., 2019; Nesbitt et al., 2019; Tu et al., 2020). In addition, the Gaussian-based two-step floating catchment area method itself accounts for the travel friction effect. Thus, a longer distance threshold can reduce the number of residential areas that have zero accessibility.
In the accessibility analysis of urban park green space, given that the residence place and the park green space are both polygons, the points that can represent them must be taken as the source (starting) and destination (end) points, respectively. In this study, two methods are used to select the source and destination points. First, the geometric centers of the subdistrict, community, and residential quarter areas are used as the source points and the geometric centers of the park green space are used as the destination points. Then, the distance between the source and destination points is the path distance between the two geometric centers (geometric center mode). Second, at the residential quarter scale, the entrance and exit positions are used as the source points, and the entrance and exit positions of the park green space are used as the destination points. Urban residential quarters are mainly closed, with one or more gates as entrances and exits. Some open urban villages have no gates. Thus, one or more intersections of urban roads with the main road through urban villages are selected as entrances and exits. Parks are also divided into two categories: closed walled parks with their gates as exits, and open park green space without enclosures, with the first place along each road from each direction to it serving as the entrances. Given that the residential quarter and the park green space may have more than one entrance and exit, multiple paths from the residential quarter to the park green space may exist. According to the principle of the best path, the shortest path distance is selected as the distance between the residential quarter and the park green space (entrance and exit mode), as shown in Figure 1.
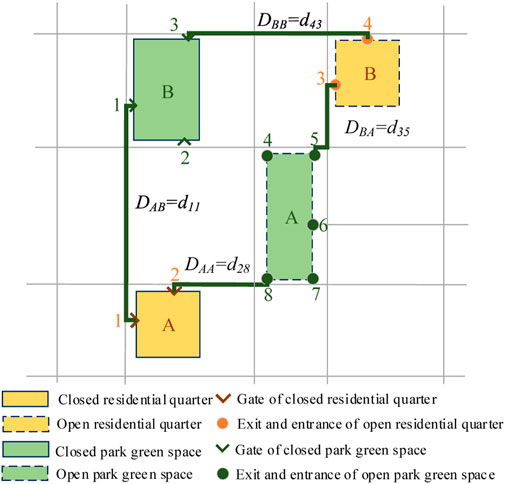
FIGURE 1. Schematic of the distance between residential quarter and park green space in entrance and exit mode.
Weidu District of Xuchang City, located in the middle of Henan Province has a long history. The district is an important birthplace of Chinese culture and has a beautiful environment. Weidu is known as the “National Ecological Garden City,” which is the highest comprehensive award in the field of urban construction in China. The district now has 16 subdistricts (including one economic and technological development zone) with a total area of 97 km2. In 2020, the permanent resident population was 598,600, and the gross domestic product is CNY 42.11 billion (Chen and Cui, 2021).
Weidu District belongs to the warm temperate monsoon zone with a mild climate. The annual average temperature is 14.7°C, the number of hours of sunshine is 2,280 h, the annual precipitation is 579 mm, and the frost-free period is 217 days. The district is located in the hinterland of the Central Plains, which has a flat terrain. The terrain inclines from northwest to southeast. In the west are gentle low hills with alluvial deposits in front of mountains, with the highest elevation of 95 m. The rest of the area is part of the Huanghuai alluvial plain, with the lowest elevation of 65 m. The river is part of the Yinghe River system of the Huaihe River Basin (Weidu District government, 2020).
Weidu District has 115 park and green spaces within 1 km, covering a total area of about 1,179 ha and mainly composed of riverside parks and leisure squares. In recent years, Xuchang City has implemented the river lake water system connection project in the central urban area. The newly built urban park green spaces are arranged along the water system, forming a connected open green leisure space without walls, as shown in Figure 2.
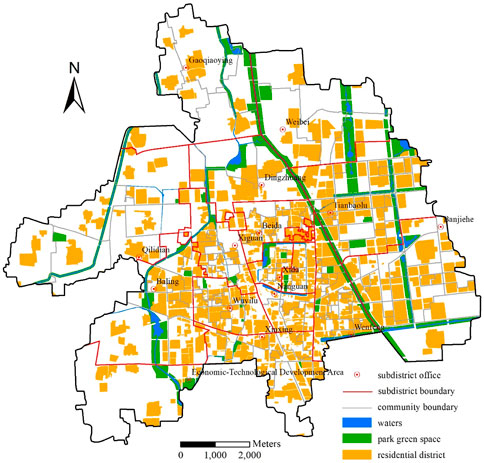
FIGURE 2. Distribution of subdistrict, community, and residential quarter and parks in the study area.
The data sources include subdistrict boundaries, community boundaries, the spatial distribution data of residential quarters, the population of residential quarters, urban road networks, and park green spaces. The subdistrict boundary data were obtained from the Yearbook of Weidu District, People’s Government of Weidu District Xuchang City, 2018. The community boundary data mainly came from the subdistrict-by-subdistrict field survey and some from the Xuchang Natural Resources and Planning Bureau. The spatial distribution data of residential quarters, urban road networks, and park green spaces were obtained from QuickBird images (.5 m panchromatic image and 2 m multispectral image) of the study area in 2014, and an unmanned aerial vehicle was used to update the data of the urban fringe to the end of 2020. Given the difficulty of obtaining the population data of the residential quarter scale in the study area, the number of residential buildings is used to replace the population. The number of residential buildings is obtained from three sources: the real estate service platform HomeLink (https://xc.lianjia.com/), the planning permission document of the Xuchang Natural Resources and Planning Bureau (http://zrzyhghj.xuchang.gov.cn/), and field surveys. The total number of residential buildings in the subdistrict and community levels is obtained through zonal statistics (Xu et al., 2017). Therefore, the result of this study is the accessibility situation of park green space when the occupancy rate reaches 100%. In addition, to avoid the boundary effect, we buffered the study area outward by 1 km during data processing. Accessibility analysis is implemented using ArcGIS10.7 and MATLAB R2015a.
The accessibility of the park green space at the subdistrict, community, and residential quarter scales is shown in Figures 3A–C, respectively. The source points are the geometric centers of the subdistrict, community, and residential quarter areas, and the destination points are the geometric centers of the park green space. The statistics of accessibility at different scales are shown in Table 1.
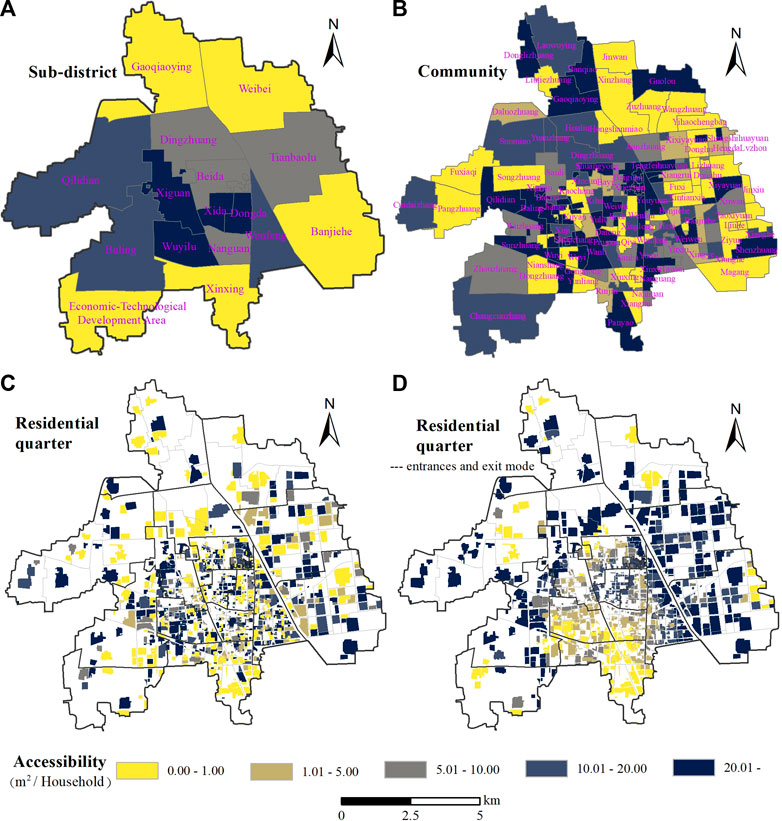
FIGURE 3. Figures (A–C) show the accessibility of the park green space at the subdistrict, community, and residential quarter scales under the geometric center mode. Figure (D) shows the accessibility at the residential quarter scale under the entrance and exit mode.
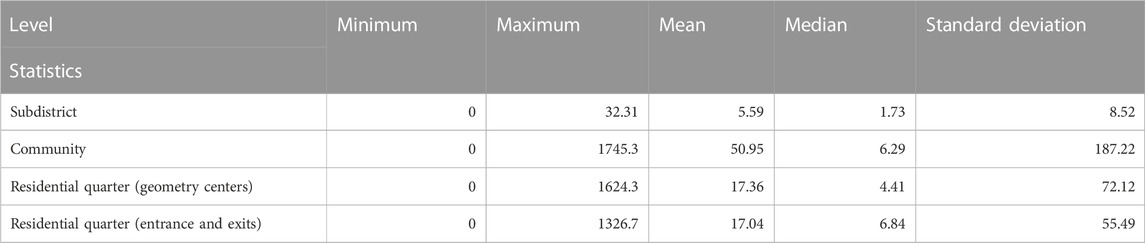
TABLE 1. Accessibility statistics under different research scales (m2/household).
From the spatial distribution perspective, the subdistrict scale shows completely different characteristics from the other two scales. At the subdistrict scale, the accessibility of park green space is slightly higher in the east-west central region than in the other regions and low in the south and north regions. At the community and residential quarter scales, the distribution characteristics are similar, that is, the accessibility in the east and midwest regions is higher than that in the other regions.
From the quantitative relationship among different scales, the accessibility on the subdistrict scale is generally low. The accessibility in 5 of the 16 subdistricts is 0, indicating that residents in these 5 subdistricts have no park green space to visit within the 1,000 m distance threshold, the average value is 5.59 m2/household, and the median value is only 1.73 m2/household. The accessibility at the subdistrict scale cannot reflect the comprehensive situation of the communities and residential quarters under its jurisdiction. For example, the accessibility of Gaoqiaoying subdistrict in the north is 0; among the six communities under its jurisdiction, the accessibility of the Banqiao community is as high as 1745.30 m2/household and that of the Daluozhuang community is as high as 694.85 m2/household, respectively, ranking first and second in accessibility at the community scale. The accessibility of Weibei subdistrict in the northeast is 0; among the five communities under its jurisdiction, the accessibility of the Guolou community is 566.24 m2/household, and that of the Jinwan and Wangzhuang communities are 59.98 and 15.09 m2/household, respectively. The accessibility of Banjiehe subdistrict in the southeast is 0, but at the community scale, 14 of the 19 communities under its jurisdiction are far greater than 0. The accessibility of Beida subdistrict in the center of the study area is 0, but the accessibility of 4 of the 6 communities under its jurisdiction are greater than 0.
To compare the relationship of accessibility between different scales in a statistical sense, the subdistrict and community scale accessibilities summarized by the residential quarter are obtained by weighted averaging the accessibility at the residential quarter scale according to the population (number of households). Weighted averaging the accessibility at the community scale according to the population (number of households) obtains the overall subdistrict scale accessibility of the community. The Spearman’s correlation coefficient between original accessibility and aggregate accessibility at the subdistrict and community scales is shown in Table 2. No significant correlation exists between the accessibility at the subdistrict scale and the two kinds of accessibility obtained by the weighted aggregation of the communities and the residential quarters, respectively. However, a significant correlation exists between the latter two, indicating a significant difference between the accessibility at the subdistrict scale and the community and residential quarter scales. The latter two have similar spatial distribution characteristics, which is also confirmed by the significant correlation between the accessibility at the community scale and the accessibility summarized by the residential quarters.
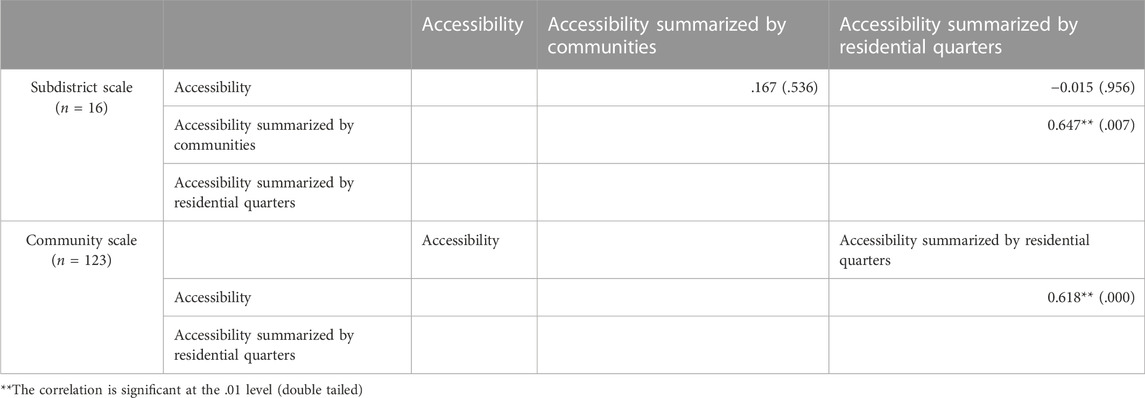
TABLE 2. Spearman’s correlation coefficient (p-value) between accessibility at subdistrict and community scales, and the corresponding weighted summary results.
The accessibility at the residential quarter scale is presented in Figure 3C, which shows that the geometric centers of the residential area and the park green space are taken as the source and destination points (geometric center mode), respectively. Figure 3D shows the entrances and exits of the residential quarter and the park green space as the source and destination points (entrance and exit mode), respectively.
From the spatial distribution perspective, overall similarities and local differences between the two accessibility modes can be observed. Overall, the south-central regions have poor accessibility, whereas the surrounding residential areas have good accessibility. This rule is obvious in the entrance and exit mode. Locally, the former has more residential quarters with poor accessibility than the latter. For example, the residential quarters with poor accessibility distributed at the edge of the study area shown in Figure 3C correspond to the high accessibility shown in Figure 3D).
From the statistical relationship between the two modes, the Spearman’s correlation coefficient is .730 (p = .000, n = 1,318), indicating a significant sequential correlation between the two modes and confirming their overall similar characteristics. The hierarchical statistical diagram of accessibility under the two modes is shown in Figure 4. Under the geometric center mode, many residential quarters have very low and high accessibility values, and the accessibility among different residential quarters changes greatly, indicating the poor spatial fairness of the park green space. However, in the entrance and exit mode, few residential quarters have very low or very high accessibility values, while many residential quarters have medium accessibility, and the accessibility changes are small, that is, the spatial fairness of park green space access is good. This finding can also be confirmed from Table 1.

FIGURE 4. Statistical chart of two accessibility levels at the scale of residential area.
To sum up, in addition to the overall similarity, the two accessibility modes also have the following differences: 1) In the geometric center mode, the accessibility of 236 residential quarters is 0, indicating that they have no park green space to access within the 1 km distance threshold. In the entrance and exit mode, the number of residential quarters with accessibility of 0 is reduced to 100. 2) In the entrance and exit mode, the accessibility of 720 residential quarters is greater than that of the geometric center mode, that of 498 residential quarters is less than that of the geometric center mode, and the accessibility of 100 residential quarters is unchanged (0 in both modes). 3) Under the entrance and exit mode, the accessibility difference between residential quarters is small, indicating that the fairness of accessing the park green space is good, while the accessibility difference between residential quarters under the geometric center mode is large, which corresponds to strong spatial unfairness.
Accessibility reflects the utilization possibilities of the park green space from a population perspective (Ala-Hulkko et al., 2016). In the Gaussian-based two-step floating catchment area method, the factors that affect the accessibility of urban park green space mainly include the number and spatial distribution of population, the number and spatial distribution of park green spaces, and the road network. The space range of the park green space is unchanged, while the population aggregation can be based on different scales. The impact of scale on accessibility is mainly manifested in two aspects: One is the scale effect caused by different levels of population spatial aggregation, and the other is the distance error between the residential area and the park green space. Spatial aggregation can affect the results of an accessibility analysis, with the results varying simply by changing the level of spatial aggregation (Miller, 2016). This is known as the scale effect in the modifiable areal unit problem. This study compares the accessibility results of the park green space under three spatial scales. The residential quarter is the most basic population gathering area of the city, while the community and subdistrict are the aggregation-level units. The population area and the park green space show a discrete or adjacent polygon distribution in space. In each polygon, the points that can represent the location of the population gathering area and the park green space are selected as the source and destination points in the accessibility analysis. No real starting point exists in the population aggregation-level units; it is often replaced by its geometric center. The area of the research unit affects the accessibility, and the uncertainty increases with the area. The accessibility on the subdistrict scale in the study area is generally low, which is different from the other two scales. The accessibility of 5 subdistricts is 0. One of the most important factors is that the area of the study unit is extremely large. The smallest subdistrict area spans 1.18 km2, the largest subdistrict area is 12.53 km2, and the average value is 5.72 km2. When the subdistrict area is more than 4 km2 and the path distance threshold is set to 1 km, the subdistrict has difficulty accessing the park green space outside its jurisdiction. The park inside the subdistrict must also be arranged near the geometric center point. And the road network has to be smooth. Otherwise, the subdistrict has no park green space to access, such as Gaoqiaoying subdistrict. Weibei subdistrict and the economic and technological development zone have many park green spaces. However, because they are far away from the geometric center and/or have a poor road network, their park green space accessibility is 0. Therefore, smaller zones or “homogeneous zones” are preferred in accessibility analysis (Riva et al., 2009; Ahuja et al., 2021). In our research, the residential quarter is the smallest and relatively homogeneous research unit because the house price and residents’ socioeconomic characteristics of the same residential quarter are relatively similar.
When the geometric centers are used as the source and destination points, the geometric center is connected to the nearest road when calculating the path distance between the source and destination points, with the vertical intersection between them taken as the starting and end points. The geometric centers of the polygons are affected by their location, shape, and area. Without changing the number and distribution of the population, changing the shape of the population gathering area and its aggregation unit is likely to change the position of its geometric center. The distributions of the population in urban space and the urban road network are uneven. There is a certain randomness in terms of which road the geometric center is closest to. Moreover, given that the acceptable path distance for walking to the park green space is mostly within 1 km, the error of this path distance is sufficient to bring uncertainty to the accessibility analysis results. Therefore, using true distance between zones rather than the centroid-to-centroid surrogate can reduce the impact of scale on accessibility calculation (Miller, 2016). However, as communities and subdistrict are population aggregation units, there is no real starting point, and distance error is inevitable. On the scale of residential quarters, they have real starting points (gates), and the distance error can be avoided.
The location of different source and destination points affects the accessibility by affecting the path distance between them. Place-based accessibility measures depend strongly on how distance is measured (Ahuja et al., 2021). In particular, the activities of visiting park and green space by walking in cities are highly sensitive to distance (Grahn et al., 2003). In the same research scale, the path distances between different source and destination points also vary, resulting in different accessibility results. In the geometric center mode, the system is associated with the geometric center with the nearest road and takes the vertical intersection of the geometric center and the nearest road as the starting and end points. The starting and end points are often not the location of the entrance and the exit. Therefore, certain differences in the distance between the two paths exist, thereby affecting the final accessibility. The distance difference between the two paths is also affected by the area of the residential quarter. Given that the area of the residential quarter is generally small relative to the distance threshold (the average value is .02 km2), a significant correlation exists between the accessibility under the two different source and destination point modes, and the spatial distribution characteristics of the accessibility are similar, but significant differences in local areas exist. The main reasons are as follows.
First, the geometric center mode will lead to the error of the path distance between the residential quarter and the park green space. Usually, the residential quarter and the park green space have more than one entrance and exit. Open and fenceless park green spaces have even more entrances and exits. Thus, multiple paths are available from the residential quarter to the park green space. According to the principle that human activities always tend to select the spatial location with the best effect according to certain goals, one of the shortest routes is selected as the path distance between the two. Therefore, the distance between the residential quarter and the park green space in the entrance and exit mode is usually shorter than that in the geometric center mode. As a result, the accessibility of most residential areas in the entrance and exit mode is higher than that in the geometric center mode. However, some residential quarters in the entrance and exit mode are less accessible than those in the geometric center mode. The main reason for this condition is that under a certain distance threshold (1 km here), many residential quarters can access the park green space under the entrance and exit mode (the number of residential communities with accessibility of 0 under the entrance and exit mode is greatly reduced), resulting in the increased service population of the corresponding park green space. Accordingly, the accessibility of the residential quarter that is near the park green space with a very high accessibility is reduced. The residential quarter with constant accessibility (equal to 0) is far from the park green space, and the path distance under both modes is greater than the distance threshold.
Second, in some special but not unusual cases, the geometric center mode will lead to the path distance mistake, and the final accessibility result is far from the actual situation. For example, the seven residential communities in the southeast of the Banjiehe subdistrict (yellow polygon in Figure 5A) are very near the park green space, but their accessibility is 0 under the geometric center mode, which obviously does not conform to the actual situation. The main reason for this phenomenon is that the geometric center of the park green space is near the road on the west side, so the end point is located on its west road. When the residents in the residential quarter located in the east of the park want to visit the park, they must go around the end point on the west side, thereby greatly increasing the path distance. When the path distance exceeds the threshold of 1 km, the accessibility of the residential quarter is 0, as shown in Figure 5C. In the entrance and exit mode, the entrance and the exit are located on the road, and the above problems do not exist (Figure 5B). The residential quarter in the figure has one entrance and exit, and the open park green space without walls has multiple entrances and exits. After calculation, the path distance from the entrance and exit of the residential quarter to the five entrances and exits of the park is less than 1 km, and the shortest one is taken as the path distance between the two (Figure 5D). Therefore, the accessibility of these seven residential areas in the entrance and exit mode is greater than 0, which is in line with the reality.
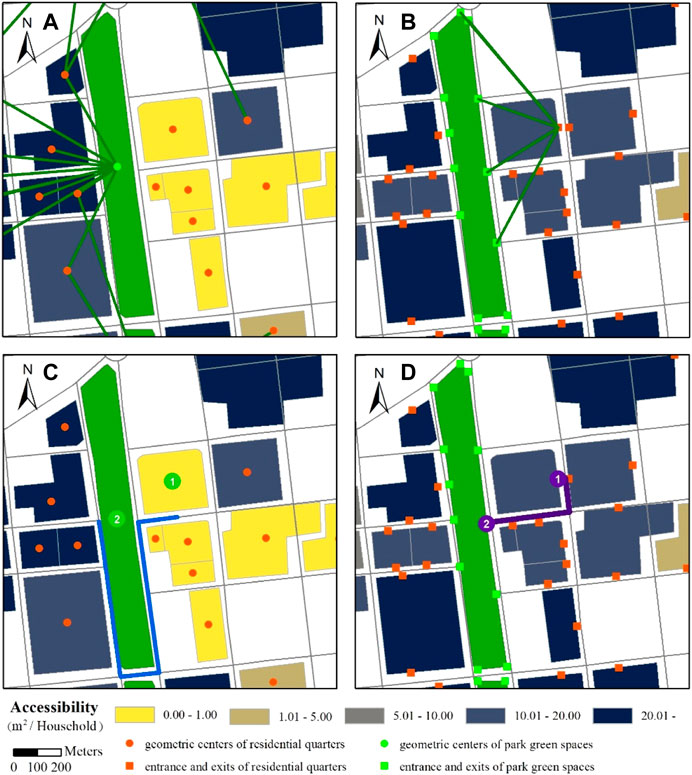
FIGURE 5. Figures (A, C) show the pathdistance between residential quarter and park green space under geometric center mode. Figures (B, D) show the path distance between them in the entrance and exit mode.
In view of the accessibility of park green space and the resulting spatial fairness, different conclusions may be obtained under different research scales. Therefore, the following three ideas are proposed for urban green space planning.
First, the evaluation and planning of urban green space should be conducted at a suitable scale. Activities such as visiting parks and green space are considered ecosystem cultural services. The assessment of urban ecosystem services under the correct scale and resolution is the premise of the application to urban planning practice (Cortinovis and Geneletti, 2018). Assessing under an inappropriate scale may even have a negative impact (Larondelle and Lauf., 2016). For recreational activities that involve walking as the main travel mode, the activity range is relatively small. When the basic research unit is far larger than the activity range, the risk of drawing a wrong conclusion is great. For example, the accessibility of the park green space calculated at the subdistrict scale in this study is far lower than that in the actual situation. The spatial distribution characteristics of the accessibility obtained at the community scale and the residential quarter scale are similar, but significant differences in numerical values exist. Therefore, the larger aggregation unit is unsuitable for the basic unit of accessibility analysis. The smaller aggregation unit can be used to analyze the overall characteristics of accessibility distribution, but the value will have certain errors. Therefore, a better approach would be to undertake accessibility analysis at the finest possible spatial scales (Mears et al., 2019). All kinds of life behaviors of urban residents are carried out around the residential quarters. Accordingly, the accessibility of park green space must be analyzed and urban green space planning must be guided by taking the residential quarter as the basic unit.
Second, the evaluation and planning of urban green space should not ignore the impact of details. A better approach would be to use the true distance between zones rather than the centroid-to-centroid surrogate (Miller, 2016). To our knowledge, place-based accessibility analysis is mostly based on the spatial aggregation level: administrative division units (e.g., You, 2016; Shen et al., 2017; Wei, 2017; Li et al., 2019; Wang and Lan, 2019; Hu et al., 2020; Shi et al., 2020; Zhang et al., 2022) or grid units (e.g., Ala-Hulkko et al., 2016; Xing et al., 2018; Guo et al., 2019; Shi et al., 2020), on which scale centroid-to-centroid surrogate is inevitable. When evaluating the accessibility of park green space and the fairness of its spatial distribution under the residential quarter scale, two different accessibility modes will lead to the difference in the path distance between the residential quarter and the park green space. This difference often increases with the area of the residential quarter and the park green space, thus increasing the difference in accessibility. In some cases, the accessibility results under the two modes are different. The accessibility difference between residential quarters under the geometric center mode is relatively large, corresponding to the relatively high spatial unfairness of accessing park green space, while the accessibility difference between residential quarters under the entrance and exit mode is relatively small, corresponding to a relatively low spatial unfairness of accessing park green space. For recreational activities that require people to reach the green space for experiential interaction to benefit, the consistency of the source and destination points with the reality will directly affect the scientificity and accuracy of the evaluation results and further affect the subsequent green space planning and optimization. For example, in the geometric center mode, the real situation of some residential quarters with low accessibility or even 0 is not the case but is caused by the calculation mode. Therefore, taking the entrance and exit of the residential quarter and the park green space as the source and destination points conforms to the daily activities of the residents. Without changing the existing population and the distribution status of the park green space, the accessibility of the park green space can be improved by optimizing the entrance and exit positions of the residential quarter and the park green space. For residential quarters with limited access to park green space, the park green space can be visited by increasing the entrance and exit of residential quarters, increasing the entrance and exit of park green space, or changing the closed park green space into an open one.
Third, the conclusions on the fairness of people with different social and economic backgrounds visiting the park green space obtained by taking the aggregation area as the research unit should be treated with caution. The accessibility analysis results are often further related to the population, social economy, and other factors in the study area, influencing the conclusion as to whether the access enjoyed by people with different social and economic backgrounds to the park green space is unfair. When this activity is performed on the aggregation area, the conclusions are often uncertain because the accessibility of the aggregation area is not obtained through simple summary statistics of the sub-areas, such as the population and other factors. Shen et al. (2017) analyzed the correlation between the accessibility of public green space and socioeconomic factors in downtown Shanghai on the basis of the subdistrict scale. The results show that the accessibility of public green spaces is related to social status and family composition. Married couples who have children have high accessibility, whereas the elderly and the unemployed population have low accessibility. However, Xiao et al. (2017) conducted a study based on the community scale in the same research area and found that the low-income groups in Shanghai are not at a disadvantage in terms of entering urban parks. In addition to the research scales, the two studies adopted different accessibility methods and indicators of social and economic factors.
The first limitation of this study is the determination of distance threshold. At present, the distance threshold values that were used include 300 m (Schipperijn et al., 2010a; Mears et al., 2019), 400 m (Tan and Samsudin, 2017; Wei, 2017), 500 m (Wüstemann et al., 2017), 600 m (Schipperijn et al., 2010b), 800 m (Wei, 2017), 1,000 m (You, 2016; Nesbitt et al., 2019; Tu et al., 2020), 1,200 m (Shen et al., 2017), 1,600 m (Xiao et al., 2017), or 10–20 min’ walking distance (Guo et al., 2019) and 15 min’ walking distance (Žlender and Ward Thompson, 2016). Given that the Gaussian-based two-step floating catchment area method itself accounts for the travel friction effect and a longer distance threshold can reduce the number of residential areas with zero accessibility, a distance threshold of 1 km was determined in this study. Because of the space limitation, this study did not compare the impact of scale on accessibility under other distance thresholds. From the results of this study, we can infer that the influence of scale on accessibility increases with the decrease in the distance threshold. In addition, although not the focus of this study, given the difficulty of obtaining the permanent population data of each residential quarter in this study, the number of building households is used to replace the number of population, that is, with the assumption that the occupancy rate of each residential quarter is 100% and each household has the same population, the final accessibility results may have a certain deviation. Finally, this feature is also a common disadvantage of all place-based accessibility measures that assume that the residential area is the most relevant area that affects residents’ behavior, thus facing the well-known problem of ecological fallacy, which involves erroneously ascribing attributes of an aggregate unit to individuals (Kwan and Hong, 2009). With the development of location-aware technologies, people-based accessibility research is no longer difficult. Place-based measures should be enhanced and complemented with people-based measures that are more sensitive to individual activity patterns and accessibility in space and time (Miller, 2016).
Accessibility analysis is one of the important methods of testing the rationality and fairness of spatial distribution and an important reference for the optimization of urban park green spaces. This analysis is the premise of application to urban green space planning to evaluate the accessibility of a city’s park green space under the correct scale and resolution. To measure the impact of research scale on accessibility, on the basis of the Gaussian-based two-step floating catchment area method, this paper compares and analyzes the accessibility characteristics of urban park green space under three spatial scales, namely, the subdistrict, community, and residential quarter scales, under the 1 km walking distance threshold in the research area. The influence of the two source and destination points modes on accessibility is analyzed at the residential quarter scale. The following conclusions can be drawn from the analysis:
(1) Accessibility analysis of park green space should be performed cautiously when the aggregation unit is taken as the basic research unit. The accessibility of the aggregation unit is not the statistical summary of its subunits, especially when the area of the aggregation unit is generally larger than the walking range of residents, and is thus likely to lead to wrong conclusions. In accessibility analysis, two types of polygon (i.e., population aggregation unit and park green space) must be abstracted into two types of points (i.e., source and destination points). A large area of the polygon corresponds to less representativeness of the points and to greater uncertainty.
(2) When the finest urban population gathering area (residential quarter here) is taken as the research unit, the consistency of the source and destination points with the reality will directly affect the scientificity and accuracy of the evaluation results. The accessibility values of the two different source and destination point modes in the study area are similar in overall distribution and different in local quantity. Overall, the accessibility of the park green space in the residential quarter under the entrance and exit mode is better than that under the geometric mode, and the accessibility difference between the residential quarters is small, that is, the spatial fairness of visiting the park green space is good. The main reason for this finding is that under the entrance and exit mode, residential quarters and parks often have more than one entrance and exit, so residents have multiple paths to choose from. In some cases, the geometric center mode will cause the path distance to be completely inconsistent with the reality, resulting in incorrect accessibility results.
(3) Place-based accessibility analysis should be conducted on the finest scale possible rather than the aggregation scale. Moreover, a better approach is to use true distance rather than the centroid-to-centroid surrogate between the source and destination points. Only when the research scale and distance measure match the daily travel of residents in reality can reliable accessibility be obtained, which is also an important prerequisite for further guiding urban green space planning.
The original contributions presented in the study are included in the article/supplementary material, further inquiries can be directed to the corresponding author.
SX proposed the original idea, designed the experiment, and wrote the draft. YW processed the basic data. Both of them read and revised this article, and approved the final manuscript.
The work was supported by the National Natural Science Foundation of China (NSFC) (Grant No. 42001265).
The authors declare that the research was conducted in the absence of any commercial or financial relationships that could be construed as a potential conflict of interest.
All claims expressed in this article are solely those of the authors and do not necessarily represent those of their affiliated organizations, or those of the publisher, the editors and the reviewers. Any product that may be evaluated in this article, or claim that may be made by its manufacturer, is not guaranteed or endorsed by the publisher.
Agimass, F., Lundhede, T., Panduro, T. E., and Jacobsen, J. B. (2018). The choice of forest site for recreation: A revealed preference analysis using spatial data. Ecosyst. Serv. 31, 445–454. doi:10.1016/j.ecoser.2017.11.016
Ahuja, R., and Tiwari, G. (2021). Evolving term “accessibility” in spatial systems: Contextual evaluation of indicators. Transp. policy 113, 4–11. doi:10.1016/j.tranpol.2021.03.006
Ala-Hulkko, T., Kotavaara, O., Alahuhta, J., Helle, P., and Hjort, J. (2016). Introducing accessibility analysis in mapping cultural ecosystem services. Ecol. Indic. 66, 416–427. doi:10.1016/j.ecolind.2016.02.013
Buchecker, M., and Degenhardt, B. (2015). The effects of urban inhabitants’ nearby outdoor recreation on their well-being and their psychological resilience. J. Outdoor Recreat. Tour. 10, 55–62. doi:10.1016/j.jort.2015.06.007
Chen, H., and Cui, G. (2021). Ecosystem services in urban plans: What is there, and what is still needed for better decisions. Land Use Policy 70, 298–312. doi:10.1016/j.landusepol.2017.10.017
Cortinovis, C., and Geneletti, D. (2018). Ecosystem services in urban plans: What is there, and what is still needed for better decisions. Land Use Policy 70, 298–312. doi:10.1016/j.landusepol.2017.10.017
Dai, D. (2011). Racial/ethnic and socioeconomic disparities in urban green space accessibility: Where to intervene? Landsc. Urban Plan. 102 (4), 234–244. doi:10.1016/j.landurbplan.2011.05.002
Grahn, P., and Stigsdotter, U. A. (2003). Landscape planning and stress. Urban For. Urban Green. 2 (1), 1–18. doi:10.1078/1618-8667-00019
Guo, S., Song, C., Pei, T., Liu, Y., Ma, T., Du, Y., et al. (2019). Accessibility to urban parks for elderly residents: Perspectives from mobile phone data. Landsc. Urban Plan. 191, 103642. doi:10.1016/j.landurbplan.2019.103642
Hu, S., Song, W., Li, C., and Lu, J. (2020). A multi-mode Gaussian-based two-step floating catchment area method for measuring accessibility of urban parks. Cities 105, 102815. doi:10.1016/j.cities.2020.102815
Hunter, R. F., Christian, H., Veitch, J., Astell-Burt, T., Hipp, J. A., and Schipperijn, J. (2015). The impact of interventions to promote physical activity in urban green space: A systematic review and recommendations for future research. Soc. Sci. Med. 124, 246–256. doi:10.1016/j.socscimed.2014.11.051
Hunter, R. F., Cleland, C., Cleary, A., Droomers, M., Wheeler, B. W., Sinnett, D., et al. (2019). Environmental, health, wellbeing, social and equity effects of urban green space interventions: A meta-narrative evidence synthesis. Environ. Int. 130, 104923. doi:10.1016/j.envint.2019.104923
Knudsen, C., Moreno, E., Arimah, B., Otieno, R. O., and Ogunsanya, O. (2020). World cities Report 2020: The value of sustainable urbanization. United Nations: United Nations Human Settlements Programme.
Kondo, M. C., Fluehr, J. M., McKeon, T., and Branas, C. C. (2018). Urban green space and its impact on human health. Int. J. Environ. Res. Public Health 15 (3), 445. doi:10.3390/ijerph15030445
Kruize, H., van der Vliet, N., Staatsen, B., Bell, R., Chiabai, A., Muinos, G., et al. (2019). Urban green space: Creating a triple win for environmental sustainability, health, and health equity through behavior change. Int. J. Environ. Res. Public Health 16 (22), 4403. doi:10.3390/ijerph16224403
Kwan, M. P., and Hong, I. (2009). From place-based to people-based exposure measures. Soc. Sci. Med. 69, 1311–1313. doi:10.1016/j.socscimed.2009.07.013
Larondelle, N., and Lauf, S. (2016). Balancing demand and supply of multiple urban ecosystem services on different spatial scales. Ecosyst. Serv. 22, 18–31. doi:10.1016/j.ecoser.2016.09.008
Lee, G., and Hong, I. (2013). Measuring spatial accessibility in the context of spatial disparity between demand and supply of urban park service. Landsc. Urban Plan. 69119 (9), 131185–131390. doi:10.1016/j.socscimed.2009.07.013
Li, L., Du, Q., Ren, F., and Ma, X. (2019). Assessing spatial accessibility to hierarchical urban parks by multi-types of travel distance in shenzhen, China. Int. J. Environ. Res. Public Health 16 (6), 1038. doi:10.3390/ijerph16061038
Liu, H., Remme, R. P., Hamel, P., Nong, H., and Ren, H. (2020). Supply and demand assessment of urban recreation service and its implication for greenspace planning-A case study on Guangzhou. Landsc. Urban Plan. 203, 103898. doi:10.1016/j.landurbplan.2020.103898
Luo, W., and Qi, Y. (2009). An enhanced two-step floating catchment area (E2SFCA) method for measuring spatial accessibility to primary care physicians. Health & Place 15 (4), 1100–1107. doi:10.1016/j.healthplace.2009.06.002
Mears, M., Brindley, P., Maheswaran, R., and Jorgensen, A. (2019). Understanding the socioeconomic equity of publicly accessible greenspace distribution: The example of Sheffield, UK. Geoforum 103, 126–137. doi:10.1016/j.geoforum.2019.04.016
Miller, H. J. (2016). “Place-based versus people-based accessibility,” in Access to destinations (Bingley: Emerald Group Publishing Limited), 63–89.
Nesbitt, L., Meitner, M. J., Girling, C., Sheppard, S. R. J., and Lu, Y. (2019). Who has access to urban vegetation? A spatial analysis of distributional green equity in 10 us cities. Landsc. Urban Plan. 181, 51–79. doi:10.1016/j.landurbplan.2018.08.007
Neutens, T., Schwanen, T., Witlox, F., and De Maeyer, P. (2010). Equity of urban service delivery: A Comparison of different accessibility measures. Environ. Plan. A 42 (7), 1613–1635. doi:10.1068/a4230
People's Government of Weidu District Xuchang City (2022). Entering Weidu 6.1. AvaliableAt: http://www.weidu.gov.cn/zjwd/walkIntoWD.html#page1.
Radke, J., and Mu, L. (2000). Spatial decompositions, modeling and mapping service regions to predict access to social programs. Ann. GIS 6 (2), 105–112. doi:10.1080/10824000009480538
Riva, M., Gauvin, L., Apparicio, P., and Brodeur, J. M. (2009). Disentangling the relative influence of built and socioeconomic environments on walking: The contribution of areas homogenous along exposures of interest. Soc. Sci. Med. 69 (9), 1296–1305. doi:10.1016/j.socscimed.2009.07.019
Schipperijn, J., Ekholm, O., Stigsdotter, U. K., Toftager, M., Bentsen, P., Kamper-Jørgensen, F., et al. (2010a). Factors influencing the use of green space: Results from a Danish national representative survey. Landsc. Urban Plan. 95 (3), 130–137. doi:10.1016/j.landurbplan.2009.12.010
Schipperijn, J., Stigsdotter, U. K., Randrup, T. B., and Troelsen, J. (2010b). Influences on the use of urban green space – a case study in Odense, Denmark. Urban For. Urban Green. 9 (1), 25–32. doi:10.1016/j.ufug.2009.09.002
Shen, Y., Sun, F., and Che, Y. (2017). Public green spaces and human wellbeing: Mapping the spatial inequity and mismatching status of public green space in the Central City of Shanghai. Urban For. Urban Green. 27, 59–68. doi:10.1016/j.ufug.2017.06.018
Shi, L., Halik, Ü., Abliz, A., Mamat, Z., and Welp, M. (2020). Urban green space accessibility and distribution equity in an arid oasis city: Urumqi, China. Forests 11 (6), 690. doi:10.3390/f11060690
Tan, P. Y., and Samsudin, R. (2017). Effects of spatial scale on assessment of spatial equity of urban park provision. Landsc. Urban Plan. 158, 139–154. doi:10.1016/j.landurbplan.2016.11.001
Tardieu, L., and Tuffery, L. (2019). From supply to demand factors: What are the determinants of attractiveness for outdoor recreation? Ecol. Econ. 161, 163–175. doi:10.1016/j.ecolecon.2019.03.022
Tu, X., Huang, G., Wu, J., and Guo, X. (2020). How do travel distance and park size influence urban park visits? Urban For. Urban Green. 52, 126689. doi:10.1016/j.ufug.2020.126689
Wang, Q., and Lan, Z. (2019). Park green spaces, public health and social inequalities: Understanding the interrelationships for policy implications. Land Use Policy 83, 66–74. doi:10.1016/j.landusepol.2019.01.026
Wei, F. (2017). Greener urbanization? Changing accessibility to parks in China. Landsc. Urban Plan. 157, 542–552. doi:10.1016/j.landurbplan.2016.09.004
Wüstemann, H., Kalisch, D., and Kolbe, J. (2017). Access to urban green space and environmental inequalities in Germany. Landsc. Urban Plan. 164, 124–131. doi:10.1016/j.landurbplan.2017.04.002
Xiao, Y., Wang, D., and Fang, J. (2019). Exploring the disparities in park access through mobile phone data: Evidence from Shanghai, China. Landsc. Urban Plan. 181, 80–91. doi:10.1016/j.landurbplan.2018.09.013
Xiao, Y., Wang, Z., Li, Z., and Tang, Z. (2017). An assessment of urban park access in Shanghai – implications for the social equity in urban China. Landsc. Urban Plan. 157, 383–393. doi:10.1016/j.landurbplan.2016.08.007
Xing, L., Liu, Y., Liu, X., Wei, X., and Mao, Y. (2018). Spatio-temporal disparity between demand and supply of park green space service in urban area of Wuhan from 2000 to 2014. Habitat Int. 71, 49–59. doi:10.1016/j.habitatint.2017.11.002
Xu, S., Liu, Y., Wang, X., and Zhang, G. (2017). Scale effect on spatial patterns of ecosystem services and associations among them in semi-arid area: A case study in ningxia hui autonomous region, China. Sci. Total Environ. 598, 297–306. doi:10.1016/j.scitotenv.2017.04.009
You, H. (2016). Characterizing the inequalities in urban public green space provision in Shenzhen, China. Habitat Int. 56, 176–180. doi:10.1016/j.habitatint.2016.05.006
Zhang, J., and Tan, P. Y. (2019). Demand for parks and perceived accessibility as key determinants of urban park use behavior. Urban For. Urban Green. 44, 126420. doi:10.1016/j.ufug.2019.126420
Zhang, S., Yu, P., Chen, Y., Jing, Y., and Zeng, F. (2022). Accessibility of park green space in wuhan, China: Implications for spatial equity in the post-COVID-19 era. Int. J. Environ. Res. Public Health 19 (9), 5440. doi:10.3390/ijerph19095440
Keywords: park green space, accessibility, spatial fairness, Gaussian-based two-step floating catchment area method, urban green space planning
Citation: Xu S and Wang Y (2023) Influence of spatial scale on the study of access fairness of urban park green space. Front. Environ. Sci. 10:1030796. doi: 10.3389/fenvs.2022.1030796
Received: 29 August 2022; Accepted: 19 December 2022;
Published: 10 January 2023.
Edited by:
Ying Jing, Zhejiang University, ChinaReviewed by:
Märit Jansson, Swedish University of Agricultural Sciences, SwedenCopyright © 2023 Xu and Wang. This is an open-access article distributed under the terms of the Creative Commons Attribution License (CC BY). The use, distribution or reproduction in other forums is permitted, provided the original author(s) and the copyright owner(s) are credited and that the original publication in this journal is cited, in accordance with accepted academic practice. No use, distribution or reproduction is permitted which does not comply with these terms.
*Correspondence: Shuna Xu, eHVzbjEwMjdAYWxpeXVuLmNvbQ==
Disclaimer: All claims expressed in this article are solely those of the authors and do not necessarily represent those of their affiliated organizations, or those of the publisher, the editors and the reviewers. Any product that may be evaluated in this article or claim that may be made by its manufacturer is not guaranteed or endorsed by the publisher.
Research integrity at Frontiers
Learn more about the work of our research integrity team to safeguard the quality of each article we publish.