 Wei Lu
 Yimin Zhu
 Yijia Hu
 Zhong Zhong
 Yao Ha
- 1College of Meteorology and Oceanography, National University of Defense Technology, Changsha, China
- 2Jiangsu Collaborative Innovation Center for Climate Change and School of Atmospheric Sciences, Nanjing University, Nanjing, China
This paper studies the interdecadal transition of interannual variability of summertime intraseasonal rainfall (SIR) over South China (SC). It is found that after the mid-1990s (1995/96), the interannual oscillation of SIR over SC has significantly enhanced. The inner connection and possible physical processes associated with the atmospheric intraseasonal oscillation (ISO) involved in the interdecadal transition of the interannual variability of SIR over SC are discussed. The results show that the “Silk Road” teleconnection wave trains distributed zonally across Eurasia from western Europe to northeastern China in the mid-to-high latitudes and the intraseasonal component of the western Pacific subtropical high (WPSH) are two major factors that control the increase of SIR interannual oscillation over SC after 1996. In the period after 1996, the low-frequency perturbation kinetic energy of the wave activity flux associated with the “Silk Road” teleconnection converges more significantly over SC. At the same time, note that the positive SIR anomaly years tend to be in the El Niño decaying phase, the eastward-propagating Kelvin waves triggered by the warm Indian ocean can promote the development of the western Pacific anticyclonic anomaly, which subsequently strengthens the WPSH effectively. The interannual variability of the WPSH east-west movement increases the low-level intraseasonal change of atmospheric circulation over SC. Low-level circulation anomalies in the low latitudes combined with the dispersion of Rossby wave energy in the mid-to-high latitudes eventually lead to an increased interannual variability of SIR over SC.
1 Introduction
South China (SC) is a region with complicated terrain and large differences between land and ocean. Rainfall is most abundant in this region over East Asia, where the long rainy season lasts from April to September (Miao et al., 2019). Six significant regional rainy seasons from spring to autumn have been identified in China, including two in SC, where the rainfall amount shows a double-peak pattern (Ding et al., 2008; Ma et al., 2018; Li et al., 2021). Highly concentrated rainfall during the rainy season often leads to floods under abnormal conditions (Wu et al., 2006; Ji et al., 2021).
Intraseasonal variability (ISV) is a typical expression of internal changes in summer rainfall over SC (Hong and Ren, 2013; Zhu et al., 2015; Ren et al., 2017; Zhu and Li, 2017; Li and Mao 2019). Madden and Julian (1971) pointed out that changes in pressure and winds in the tropical atmosphere demonstrate a large-scale oscillation pattern with a cycle of 40-50d. This type of variability in the tropical atmospheric activity is called the Madden and Julian Oscillation (MJO, Madden and Julian, 1971).
Summer rainfall in SC is mainly controlled by the East Asian summer monsoon (EASM) system (Ding et al., 2008; Huang et al., 2017; Yin et al., 2021). The EASM system consists of convective activities is associated with the summertime intraseasonal oscillation (ISO). The boreal summer ISO (BSISO), which exhibits prominent features of MJO in summer, presents active and break cycles of convective activities associated with northward propagating convection in a period of 30–60 days in the tropical Asian monsoon region (Ramamurthy, 1969; Murakami, 1972; Hartmann and Michelsen, 1989; Wang and Xie, 1997; Jiang et al., 2004; Zhu et al., 2022). The ISO of summer rainfall in SC could also be influenced by perturbations from both the tropics and the mid-to-high latitudes (Zhang et al., 2009; Hong and Ren 2013; Chen et al., 2015; Li et al., 2015; Hsu et al., 2016; Zheng and Huang, 2018; Wang et al., 2019; Liu et al., 2020). MJO may enhance or suppress summer rainfall in SC through its eastward-propagation from the tropical Indian Ocean (Zhang et al., 2009). The ISO in the mid-to-high latitudes can influence the mid-latitude weather and climate through teleconnection wave trains, and also influence rainfall in SC (Hendon and Liebmann, 1990; Ding and Wang, 2007).
SC rainfall experiences multi-scale variabilities including interdecadal variability, interannual variability, intraseasonal variability and synoptic variability (Chen et al., 2012, 2015, 2017; Wang et al., 2017; Nie and Sun, 2022), etc. Synoptic variability of rainfall is mainly affected by synoptic scale systems. For example, synoptic-scale rainfall over SC is mainly associated with low-level shear lines, where the wind convergence provides a lifting condition favorable for the development of convection. However, previous studies have revealed that persistent weather anomalies on regional scale are often beyond the time scale of synoptic systems and demonstrate variation characteristics on intraseasonal time scale. The intraseasonal component of rainfall anomaly is mainly influenced by activities of low-frequency circulations (Mao et al., 2010; Zhu and Li, 2017; Wang et al., 2021). Rainfall anomaly is the result of interaction between global sea-land systems. As the most important external forcing to atmospheric circulation anomalies, sea surface temperature anomalies (SSTA) have great impacts on global climate, especially on rainfall. Several previous studies have found that ENSO and Pacific Decadal Oscillation (PDO) can influence interannual and interdecadal variations of summer rainfall over SC (Chan and Zhou, 2005; Zhou et al., 2006; Zhao et al., 2022a).
Recent studies pointed out that the interannual and interdecadal variability of weather and climate becomes more and more important (Yamaura and Kajikawa, 2017; Cao et al., 2019; Wang et al., 2019; Chen et al., 2021; Lu et al., 2022). The interdecadal variability of the EASM (Wu et al., 2009; Zhu et al., 2015) and the western North Pacific monsoon has been studied in recent years. A decadal change of the ISV that occurred in the mid-1990s over the South China Sea (SCS) has been detected, which shows an obvious periodicity and spatiotemporal evolution. This interdecadal change may be attributed to the merging process of the northward propagating convection from the Maritime Continent and the westward propagating convection from the central North Pacific, which is evident only during 1979–1993 (Kajikawa et al., 2009). This merging process enhances the cyclonic circulation over the SCS, while the southwesterlies embedded in the cyclonic circulation transport more moisture to the SCS and the Philippine Sea (Hsu and Weng, 2001). It is also found that the BSISO activities during 1999–2008 are significantly greater than that during 1984–1998, which may be linked to the variability of seasonal mean sea surface temperature (SST) (Yamaura and Kajikawa, 2017).
Summertime rainfall in SC also experienced an obvious interdecadal increase in the early 1990s (Kwon et al., 2007; Ding et al., 2008; Yao et al., 2008; Ding et al., 2009; Wu B et al., 2010; Li et al., 2012). It is found that the 10–30 days summer SC rainfall exhibited a significant increase in 1992/1993, which is resulted from more frequent northward propagation of the ISO controlled by summertime mean southerlies in the middle and lower troposphere over the SCS (Chen et al., 2015; Cheng et al., 2020). The calculation of Wang et al. (2017) indicates that the BSISO-induced rainfall increase accounts for about 17.4% of the observed decadal rainfall increase. The interdecadal changes in the BSISO track and the occurrence frequency of active BSISO phase are likely related to coherent changes in atmospheric circulation and SST over the Indian Ocean and the western Pacific. These studies have revealed the impacts of ISO on summer rainfall at both intraseasonal and interdecadal scales.
Summertime intraseasonal rainfall (SIR) over SC shows significant interannual and interdecadal variabilities (Chen et al., 2015; Wang et al., 2017; Cheng et al., 2020). The complexity of multi-scale rainfall variability is reflected not only in the mean value and variation trend of rainfall, but also in the variance characteristics of the interannual series of rainfall, that is, differences in the year-to-year changes are regarded as the interannual changes of rainfall, which reflect the stability of interannual variability of rainfall (Hu et al., 2014; Zhao et al., 2022b; Cai et al., 2022). On interdecadal scale, the interannual variability of rainfall also presents differences between different decades. It is worth noting that the interannual variability of SIR over SC displays obvious variance differences on interdecadal scale. Specifically, the mid-1990s is the dividing line, after which the variance of the SIR interannual variability has increased significantly. A more significant interannual increment appears in the study period after the mid-1990s, showing the overall interdecadal transition of interannual variability. This study focuses on the characteristics and causes of the interannual variability change of SIR over SC during the past 40 years. The physical processes and influencing factors that lead to the occurrence of the interdecadal transition are also analyzed.
The remainder of the study is organized as follows. Data and methodology are described in Section 2. In Section 3, interdecadal change of interannual variability of summertime intraseasonal rainfall are examined. The low-frequency atmospheric circulation anomalies associated with SIR are analyzed in Section 4. In Section 5, the impacts of the “Silk Road” teleconnection and WPSH on the interdecadal change of summertime intraseasonal rainfall are discussed. Conclusions and discussion are given in Section 6.
2 Datasets and methodology
Daily rainfall dataset is derived from the Climate Prediction Center (CPC) Global Rainfall dataset, which has a spatial resolution of 0.5° × 0.5°. The CPC dataset is provided by the National Oceanic and Atmospheric Administration (NOAA) (Xie et al., 2007). Daily outgoing longwave radiation (OLR) dataset produced based on NOAA polar-orbiting satellite remote sensing data on global 2.5° × 2.5° grids (Liebmann and Smith, 1996) is used. Daily wind, geopotential height and specific humidity are obtained from the National Centers for Environmental Prediction (NCEP) Reanalysis product with a resolution of 2.5° × 2.5° (Kalnay et al., 1996).
The study period covers 41 years from 1980 to 2020 on June to September (JJAS). According to the previous study, the dominant intraseasonal modes of the summer rainfall in SC are on the 2–8 days and 30–90 days time-scale (Wang et al., 2017; Liu et al., 2022). Therefore, a 30–90 days Lanczos bandpass filtering is applied to extract the intraseasonal component in this study. Before filtering, the climatology of rainfall has been removed from the raw daily rainfall time series.
To examine if the interannual variability of SIR over SC is characterized by interdecadal transition, a 10-year window F-test is performed on the 30–90-day filtered time series.
To find out propagation of wave trains in the mid-to-high latitudes, a phase-independent wave activity flux (WAF) proposed by Takaya and Nakamura (2001) is calculated. WAF has been widely used to study wave trains in the mid-to-high latitudes on intraseasonal timescale (Yang and Li, 2016; Gao et al., 2017; Wang et al., 2018), which is expressed as:
where
3 Interdecadal change of interannual variability of summertime intraseasonal rainfall
Figure 1A shows the time series of 30–90 days intraseasonal summer mean rainfall over SC. The interannual variability of SIR displays a significant interdecadal variation. The mid-1990s is the dividing line, and the interannual variability of SIR presents discontinuous changes from small to large. The red line in Figure 1B shows the results of the sliding F test of SIR within a 10-year window. The results indicate that around 1995/1996, the interannual variability of SIR experienced a significant interdecadal transition. The blue line in Figure 1B shows absolute values of interannual difference of the SIR. It is found that the mean value of the interannual difference of rainfall is 0.73
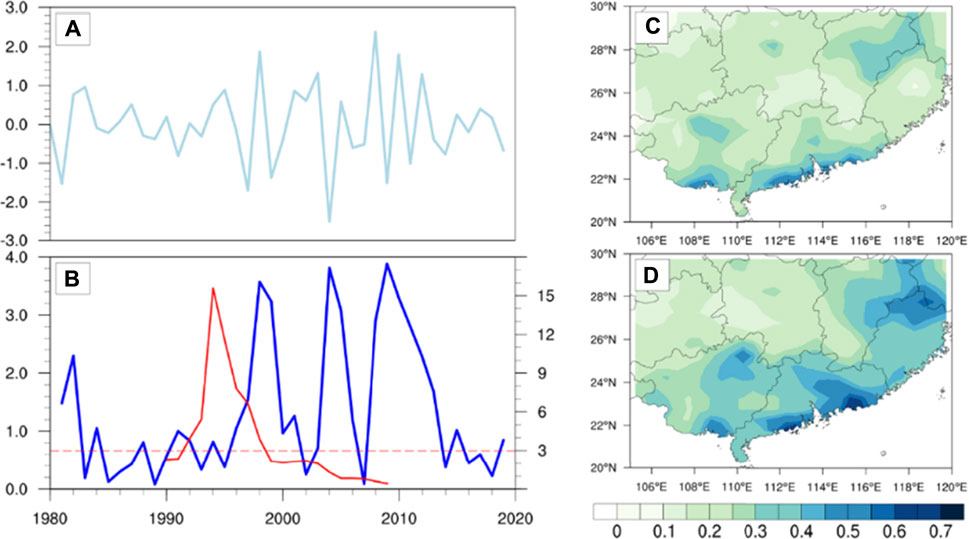
FIGURE 1. (A) Time Series and (B) absolute values of interannual difference (blue line, normalized, interannual difference refers to the difference between the current year and last year) and 10-year running F test values (red line) of intraseasonal rainfall (30–90 days filtered summer rainfall anomalies) over SC (the red dashed line in b indicates significant values exceeding the 95% confidence level). Spatial patterns of SC intraseasonal rainfall variance for the periods (C) 1980–1996 and (D) 1997–2019, respectively.
4 Low-frequency atmospheric circulation anomalies associated with summertime intraseasonal rainfall
In order to explore the reasons for the large differences in the interannual variance of SIR in different decades, in this section we mainly analyze characteristics of low-frequency atmospheric changes and circulation anomalies on the interdecadal scale. The years of rainfall anomaly are identified for P1 (1980–1996) and P2 (1997–2013), respectively. In P1, the positive years (1984, 1985, 1987, 1993, 1994, 1995 and 1996) and negative years (1986, 1988, 1989, 1990, 1991 and 1992) are identified by the threshold of 0 standard deviation of the normalized time series. Since the interannual variability in a few years within P2 is relatively small, in order to highlight the main characteristics of the large interannual variability in P2, the years with rainfall values greater than 0.7 are identified to be positive years (1998, 2001, 2003, 2008, 2010 and 2012), and the years with rainfall value smaller than -0.7 are determined to be negative years (1997, 1999, 2000, 2004, 2007, 2009 and 2011). In order to reveal the generation mechanism for the interdecadal transition of the interannual variability of SIR, composite analysis of atmospheric circulation that can reflect the ISO characteristics are conducted for the positive and negative years of P1 and P2, respectively. Differences in the characteristics of atmospheric low-frequency oscillation are then compared.
Figure 2 shows composite low-frequency geopotential height anomalies at 500 hPa and 200 hPa as well as 850 hPa wind field anomalies for positive and negative years of P2. Differences between them (positive years minus negative years) are also presented. Comparing the composite intraseasonal geopotential height anomalies at 200 hPa and 500 hPa between the positive and negative years, we can clearly find two ISO systems that affect SIR anomalies in the P2 period, i.e., the “Silk Road” teleconnection wave trains and the intraseasonal component of the western Pacific subtropical high (WPSH). The “Silk Road” teleconnection wave trains are distributed zonally across Eurasia from western Europe to northeastern China in the mid-to-high latitudes. The wave trains distribution displays a “- + - + -” pattern in positive years (Figures 2A,D), while the opposite pattern shows in negative years (Figures 2B,E). Looking at the intraseasonal component of the WPSH (Figure 2D), significantly positive anomalies are obvious over the Northwest Pacific during positive years. In contrast, significantly negative anomalies develop over the Northwest Pacific in negative years (Figure 2E). In positive years, an anomalous cyclone can be found over SC, which is shown clearly in the low-level wind field (Figure 2G). Under the influence of this anomalous cyclone, low-level southwesterlies on the southeastern side of the cyclone strengthens and cyclonic convergence over SC also intensifies in lower levels. Such a circulation pattern is favorable for the increase of SIR over SC. In negative years, however, an anomalous anticyclone is observed at the same place (Figure 2H), which effectively suppresses the increase of SIR over SC. Comparison of composite circulations in the positive and negative years during P2 indicates that the intraseasonal atmospheric circulation exhibits characteristics of opposite-phase in the positive and negative years throughout the troposphere, and this significant opposite-phase feature has great impacts on the interannual variation of SIR over SC.
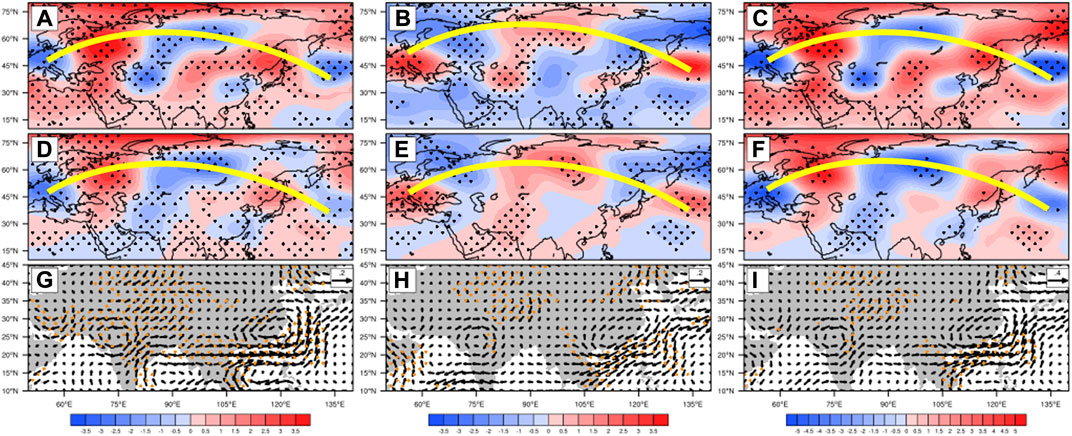
FIGURE 2. Top row: composite 30–90 days filtered geopotential height anomalies at 200 hPa (unit: gpm). Middle row: composite 30–90 days filtered geopotential height anomalies at 500 hPa (unit: gpm). Bottom row: composite 30–90 days filtered wind anomalies at 850 hPa (
Figure 3 shows composite low-frequency geopotential height anomalies at 500 hPa and 200 hPa as well as 850 hPa wind field anomalies in positive and negative years of P1. Differences between them (positive years minus negative years) are also displayed. It can be seen that the teleconnection wave trains that affect the SIR anomalies are also distributed zonally across the Eurasian continent in the mid-to-high latitudes. They present a “- + - +” distribution in positive years (Figures 3A,D) and “+ - + -” in negative years (Figures 3B,E). Similar to that in P2, the tropical influencing factor is also the intraseasonal component of WPSH, which presents negative anomalies in positive years (Figure 3D) and positive anomalies in negative years (Figure 3E) of P1. At 850 hPa, composite intraseasonal wind anomalies in positive years (Figure 3G) show that there exists an anomalous cyclone, which is located in the SCS and affects the SIR over SC. SC is located on the northern side of this anomalous cyclone and is under great influence of easterly jet stream associated with the abnormal cyclonic circulation. As a result, the low-level circulation cannot produce strong convergence over SC, and thus is not conducive to the growth of SIR over SC. However, in negative years (Figure 3H), there is no abnormal cyclone or anticyclone occurring near SC. By comparing composite circulation anomalies in positive and negative years of P1, it is found that spatial distributions of the differences in 200 hPa and 500 hPa intraseasonal geopotential height anomalies (Figures 3C,F) as well as 850 hPa wind anomalies (Figure 3I) are also similar to their corresponding composites in the positive years. However, in the map of wind anomaly differences, the anomalous cyclone in the SCS is weaker. The whole atmosphere does not show significant circulation anomalies in both the positive and negative years, which explains why the interannual variation of rainfall is relatively gentle with a significantly smaller variance than that in P2. Looking at composite intraseasonal geopotential height anomalies in the same phase of P1 and P2 and their differences, it is found that the circulation anomaly associated with the wave trains in the mid-to-high latitudes and the tropical intraseasonal component of WPSH in P2 are more significant than that in P1. Therefore, when the positive and negative phases in P2 switch between each other, the SIR will undergo a remarkable interannual change. Intraseasonal wind fields in lower levels also have similar characteristics. The phase transition between anomalous cyclones and anticyclones over SC during P2 directly controls the strength of uplift conditions for SIR.
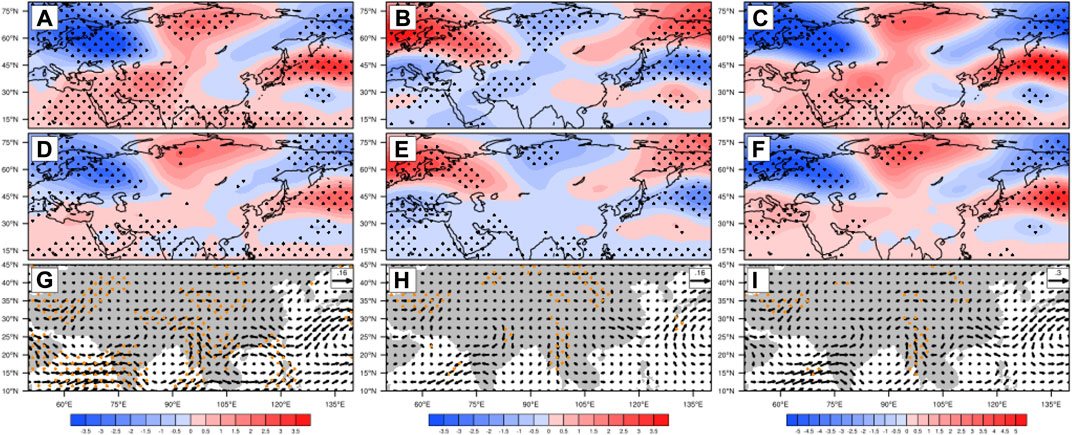
FIGURE 3. Same as Figure 2, but for P1.
Figure 4 displays composite intraseasonal 850 hPa vorticity anomalies, 200 hPa divergence anomalies, OLR anomalies, 500 hPa omega anomalies, and water vapor flux and flux divergence anomalies in the 1,000–500 hPa layer in P2. Differences in the above composites between the positive and negative years are also presented. The composites of anomalies in the positive years of P2 show significant positive vorticity anomalies in lower levels and positive divergence anomalies in upper levels (Figure 4A) over SC, indicating that the atmospheric circulation on the intraseasonal scale is convergent in lower levels and divergent in upper levels. Anomalous intraseasonal convective activities develop over SC (Figure 4D), while the water vapor flux anomalies in the middle and lower levels propagate from the North Indian Ocean and the Bay of Bengal to SC and converge there (Figure 4G). Composites for the negative years during P2 show that there are negative vorticity anomalies in lower levels and negative divergence anomalies in upper levels over SC (Figure 4B), and convection is suppressed (Figure 4E). The water vapor flux anomalies in the middle and lower levels originate from the northwestern Pacific and propagate to the southwest, eventually diverge over SC (Figure 4H). The distributions of the differences between the composite anomalies of positive and negative years are highly similar to the spatial distributions of the composite anomalies in positive phase (Figures 4C,F,I). In addition, the anomalies of the low-frequency environmental fields agree well the observations of large interannual variation of SIR over SC in P2.

FIGURE 4. Top row: composite 30–90 days filtered 850 hPa vorticity anomalies (shaded,
As shown in composite anomalies of the positive years during P1, the center of low-level positive vorticity anomalies is located in the SCS, the center of high-level positive divergence anomalies is located in the tropical western Pacific and the Bay of Bengal, and the vorticity and divergence anomalies over SC are not significant (Figure 5A). Note that the centers of negative OLR and omega anomalies are also located in the SCS (Figure 5D). Miao et al. (2019) pointed out that in active phase of convection in the SCS, the increase of rainfall over SC will be suppressed. Composite anomalies of negative years indicate that there are negative vorticity anomalies in lower levels and negative divergence anomalies in upper levels over SC (Figure 5B). While both OLR and omega anomalies are positive (Figure 5E), their magnitudes are relatively small. Composite of water vapor flux anomalies in the positive years of P1 mainly originates from the southern Indian Ocean and the Bay of Bengal, and the water vapor convergent center is also located in the SCS (Figure 5G). However, note that the composite water vapor anomalies near SC in the negative phase are not significant (Figure 5H), and the water vapor convergence and divergence are also weak. The spatial distributions of the differences between the composite anomalies of positive and negative years are highly similar to the spatial distributions of the composite anomalies in positive phase (Figures 5C,F,I). It is worth noting that the magnitudes of the anomalies of these variables in P1 are smaller than their counterparts in P2, which implies that the differences between the anomalies of positive and negative phases are not as large as that in P2. Figures 4, 5 actually illustrate the process mechanism of the interdecadal transition of interannual variability of SIR based on the configuration of atmospheric circulations in lower and upper levels, which actually reflects the convergence and divergence of the circulation, the activity of convection and the water vapor transport in the middle and lower levels on the intraseasonal scale. By comparing the composite anomalies between the positive and negative phases in P1 and P2, it is not difficult to find that in lower and upper levels, the transition between the positive and negative phases of the environmental field anomalies in P2 is distinctly more significant than that in P1.
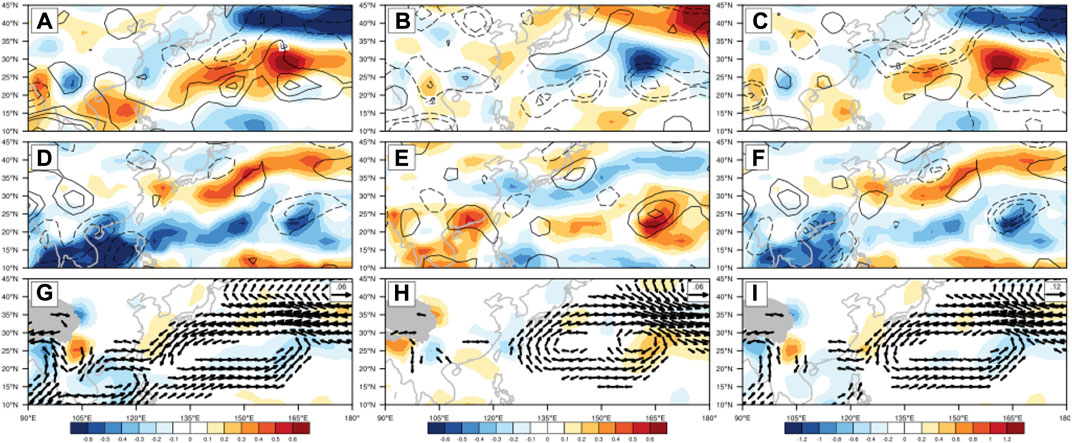
FIGURE 5. Same as Figure 4, but for P1.
In order to clarify the anomalous characteristics of the environmental fields that are closely related to the SIR over SC in different interdecadal backgrounds, Figure 6 shows the regressions of 30–90 days intraseasonal 500 hPa, 200 hPa geopotential height anomalies and 850 hPa wind field anomalies onto the time series of SIR during P1 (Figures 6A,C,E) and P2 (Figures 6B,D,F), respectively. Overall, the spatial distributions shown in the regression plots are very similar to the positive phase composite plots shown in Figures 2, 3. In P1, circulation anomalies in lower and upper levels of the troposphere, which are closely related to the SIR over SC, present a characteristic of zonal distributions (Figures 6A,C). The distribution of this kind of barotropic structure does not cause circulation changes in the lower troposphere over East Asia (Figure 6E). In P2, the signals of low-frequency circulation anomalies over the Eurasian continent are spread to East Asia through the “Silk Road” teleconnection wave trains (Figures 6B,D). In addition, there are also potential synergistic effects of low-frequency systems in the low latitudes western Pacific.
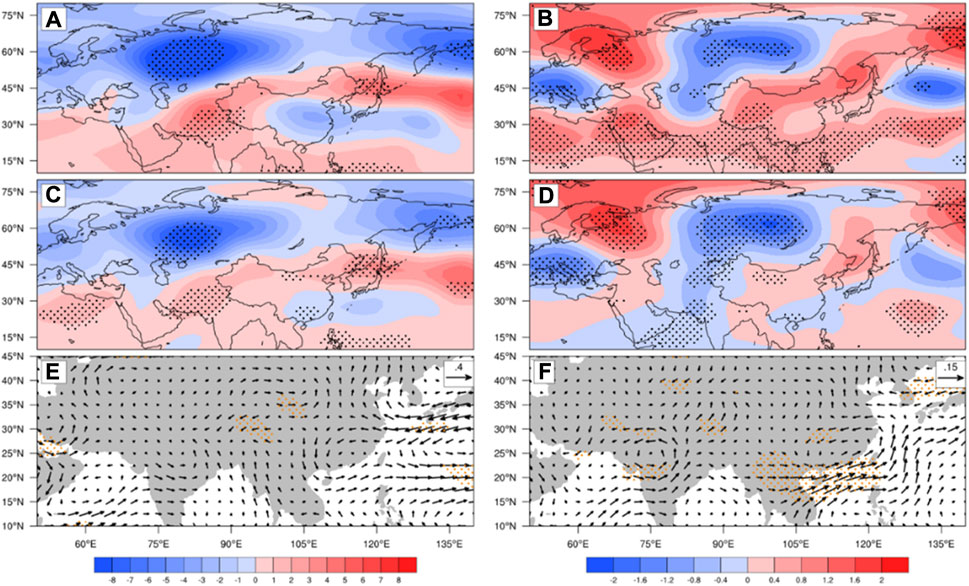
FIGURE 6. Regressions of 30–90 days filtered 200 hPa (A,B) and 500 hPa (C,D) geopotential height anomalies (
5 Impacts of the “Silk Road” teleconnection and WPSH on the interdecadal change of summertime intraseasonal rainfall
The morphological structure of the wave trains is described by the TN wave activity flux (WAF) to further illustrate the propagation characteristics of the “Silk Road” teleconnection wave trains in the mid-to-high latitudes (Miao et al., 2019). When the WAF vector converges, the wave energy aggregation is conducive to the enhancement of perturbation. In order to further reveal the modulation effect of these two systems on the interdecadal transition of interannual variability of SIR, we analyze the signals in the mid-to-high latitudes and in the tropics, respectively. The distributions of composite 200 hPa WAF vector and divergence in the positive phase in different interdecadal backgrounds show that the propagation of the wave vector and the convergence and divergence have similar characteristics in the two periods. Wave energy propagates along the channel of “Silk Road” teleconnection wave trains in the mid-to-high latitudes, and converges over SC and the subtropical western Pacific (Figure 7B). Further analysis of the convergence intensity of wave energy over SC shows that the regional and multi-year mean WAF divergence at the convergence center is −2.20 in P2, which is significantly stronger than that (−1.55) in P1 (Figure 7C). The perturbation growth of the wave energy in P2 is stronger than that in P1, indicating that the low-frequency perturbation kinetic energy of the WAF in P2 has a larger variability over SC.
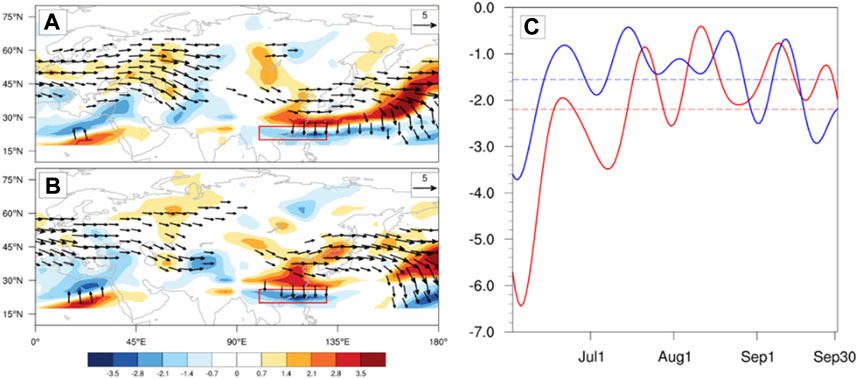
FIGURE 7. Composites of 200 hPa wave activity flux (vectors,
In addition, the zonal dipole distribution of geopotential height anomalies along the western Pacific and SC appears in P2 (shown in Figure 6D), which suggests that the WPSH may contribute to SIR over SC during P2. To reveal the influence mechanism of WPSH on the differences between interannual variability of SIR in P1 and P2, we first composite the original 500 hPa geopotential height field to examine whether there exists decadal variation of WPSH. It is worth noting that there is no significant difference between the composites of WPSH in the positive and negative phases of P1 (Figure 8A). However, the area of composite WPSH in the positive phase of P2 is significantly larger than that in the negative phase. The westward extension of the WPSH is also significantly larger (Figure 8B), reflecting a more significant interannual variation of WPSH in P2. Moreover, comparing the WPSH difference between positive and negative phases of both P1 and P2, it is found that in the subtropical region where the WPSH is located, the WPSH difference between the positive and negative phases of P1 is very small with the value basically between −5 and 5 gpm. In P2, however, the composite WPSH in the positive phase extends further westward than in the negative phase with the difference up to 10–15 gpm in the large difference center. The above studies show that the interdecadal transition of interannual variability of SIR over SC is closely related to interdecadal variation of the WPSH.
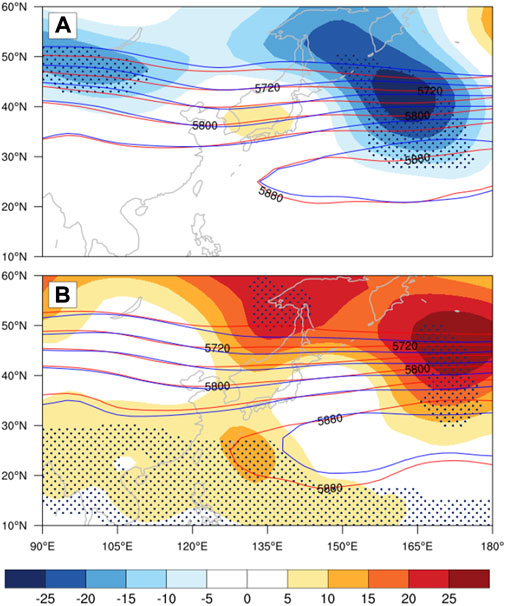
FIGURE 8. Composites of 500 hPa geopotential height (contours,
When note the large interannual variability of the WPSH in P2 shown in Figure 8, there is a clear connection between the interdecadal variation of the WPSH and the interdecadal transition of interannual variability of SIR over SC. The question here is, what physical processes are involved in the WPSH influence on SIR over SC? When the WPSH moves westward in positive years of P2, SC is under the control of southwesterlies on the north side of the WPSH. In contrast, when the WPSH moves eastward in negative years of P2, northeasterlies prevail over SC. This is the same as the results of the intraseasonal low-level wind fields composited in the positive and negative phases (shown in Figure 2). Different to that in P2, the WPSH difference between the positive and negative phases in P1 is not large, and there is no consistent strong jet stream in the SC low-level wind field in both the positive and negative phases in P1. The variation of low-level intraseasonal wind field is relatively weak as shown in Figure 3. The WPSH intensity directly affects low-level wind field over SC through synoptic circulation, and the water vapor transport and uplift mechanism associated with the low-level wind fields greatly affect the amount of SIR over SC. Therefore, 850 hPa zonal wind anomalies after the 30–90 days filtering are averaged over (10–25°N, 105–120°E) and defined as the SCS zonal wind index (SCSZWI). Temporal changes of the SCSZWI index can to a certain extent reflect the change trend of the WPSH. The time series of SCSZWI is displayed in Figure 9A, which shows a trend of interannual variability consistent with that of SIR, and the correlation coefficient between the two series can reach 0.51 (Figure 9A). The sliding F-test method with a 10-year window is also applied to SCSZWI. The result indicates that the interannual variability of SCSZWI also experienced an interdecadal transition at around 1995/1996 (the red solid line in Figure 9B). The blue line in Figure 9B shows absolute values of interannual difference of SIR. It is found that the mean value of the interannual rainfall variability during P1 is 0.93, while that in P2 is 1.39. This result indicates that around the mid-1990s, the interannual variance characteristics of the intraseasonal zonal wind over SCS intensified in line with that of SIR over SC. Therefore, the good synergy between the time series of SCSZWI and SIR indicates that the interdecadal variation of the WPSH has a significant modulation effect on the interdecadal transition of interannual variability of SIR.
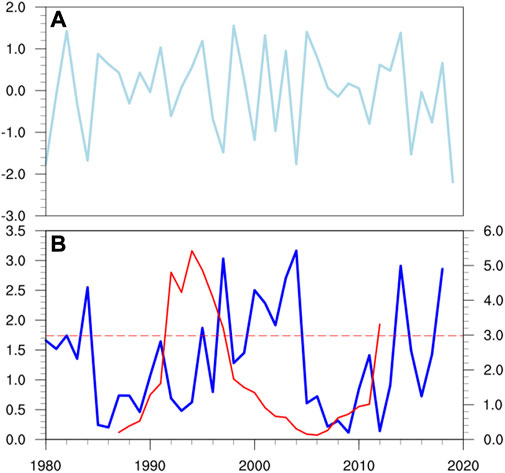
FIGURE 9. (A) Time Series and (B) absolute values of annual difference (blue line) and 10 years running F test values (red line) of SCSZWI (the red dashed line in b indicates significant values exceeding the 95% confidence level).
6 Conclusions and discussion
The summer rainfall over SC exhibits an obvious periodicity on the 30–90-day intraseasonal time scale. Previous studies have shown that the SIR over SC has significant interdecadal variation characteristics, but most of these studies more focus on abnormally high or low rainfall (Wang et al., 2017; Chen et al., 2020). The present study reveals that the interannual variability of SIR over SC also experiences a significant interdecadal transition that occurred around 1995/1996. After the transition, the interannual variability of SIR increases significantly. By comparing the ISO signals of atmospheric environmental variables composited by the positive and negative phases of SIR in the former decadal period (P1:1984–1996) and the later decadal period (P2:1997–2013), the reasons for the interdecadal transition of the interannual variability of SIR are discussed.
Composites of intraseasonal geopotential height anomalies in the positive and negative phases of P1 and P2 are compared, and the results show that the characteristics of atmospheric low-frequency anomalies in P1 are not significant. The large interannual variance of SIR in P2 is caused by two ISO systems, i.e., the “Silk Road” teleconnection wave trains are distributed zonally across Eurasia from western Europe to northeastern China in the mid-to-high latitudes and the intraseasonal component of the WPSH. Compared with that in P1, both the teleconnection wave trains in the mid-to-high latitudes and the tropical intraseasonal WPSH circulation anomalies are more significant in P2. When the positive and negative phases in P2 switch between each other, the SIR will undergo a remarkable interannual change. Low-level wind fields also have similar characteristics. The phase transition between cyclone and anticyclone anomalies over SC in P2 directly controls the strength of uplift conditions for SIR.
In order to reveal detailed processes of the two key ISO systems affecting the SIR, the TN WAF is implemented to describe the morphological structure of the “Silk Road” wave trains in the mid-to-high latitudes and illustrate their propagation characteristics. It is found that the propagation of the wave vector and the convergence and divergence during the two periods have similar characteristics. The wave energy propagates along the pathway of the “Silk Road” teleconnection wave trains in the mid-to-high latitudes and converges over SC and the subtropical western Pacific. Note that in summer, especially in June and July, the wave energy perturbation growth in P2 is stronger than that in P1. Furthermore, because the intensity of the WPSH directly affects low-level wind field over SC through synoptic circulations, while the water vapor transport and uplift mechanism associated with the low-level wind field can greatly affect the amount of SIR over SC, the South China Sea Zonal Wind Index (SCSZWI) is defined in the present study to characterize intraseasonal variation of the WPSH. The interannual variability of SCSZWI displays a trend consistent with that of SIR. The good synergy between the time series of SCSZWI and SIR indicates that the interdecadal variation of WPSH has a significant modulation effect on the interdecadal transition of interannual variability of SIR. Therefore, from the perspective of the convergence and divergence of the pressure field and the activity of convection and water vapor transport in the middle and lower levels, the oscillation between the positive and negative phases of the environmental field anomalies in the middle and upper levels in P2 is more significant than that in P1 on the intraseasonal scale. The above factors directly lead to the stronger interannual variability of SIR over SC in P2 compared to that in P1.
Many studies pointed out that the Northwest Pacific convective activities related to the WPSH intensity may be forced by SSTA over the Pacific and Indian Ocean (Xu et al., 2019; Nie and Sun, 2022). The question that needs to be discussed is: how does SSTA affect the WPSH intensity and what physical processes are involved? Wu et al. (2009) pointed that consistent warming of IOBM during the summer of El Niño decay year can influence the Northwest Pacific anticyclone through atmospheric Kelvin waves. Subsequent numerical experiments (Wu R et al., 2010) also indicate that the maintenance of the anomalous anticyclone in the Northwest Pacific during the summer of El Niño decay year is the result of the combined effects of the modal remote forcing in the Indian Ocean (TIO) basin and the local forcing of negative SSTA in the Northwest Pacific. When the EIO-WP has strong positive SSTA, it heats the tropospheric atmosphere in the west of the Northwest Pacific (including TIO region) and the surface pressure decreases in the low latitudes. Such a circulation pattern promotes low-level convergence and upward movement, which is favorable for the development of convective activity and anomalous enhancement of easterly winds in the tropical Pacific. The positive SSTA can trigger eastward-propagating equatorial baroclinic Kelvin waves, which increase negative vorticity at the top of the boundary layer in the outer equatorial region, leading to divergence in the boundary layer and the formation of anomalous anticyclonic circulation at lower levels. Meanwhile, the enhancement of negative vorticity anomaly also results in anomalous descending motions and surface pressure increase (Ha et al., 2013). The atmospheric heating by the underlying ocean makes the entire atmosphere to warm up and triggers planetary waves, resulting in atmospheric circulation anomalies similar to the Matsuno-Gill mode (Matsuno, 1966; Gill, 1980; Wu et al., 2009). In summary, in the summer of El Niño decay year, the eastward-propagating Kelvin waves triggered by warm sea temperature of the IOBM promotes the development of the Western Pacific anomalous anticyclone, which effectively strengthens the WPSH, and thereby changes the low-level intraseasonal atmospheric circulation field in the SC-SCS region. Low-level circulation anomalies and the energy dispersion of Rossby wave trains in the mid-to-high latitudes jointly cause the increase in the interannual variability of SIR over SC.
Data availabilitystatement
The original contributions presented in the study are included in the article/Supplementary Material, further inquiries can be directed to the corresponding authors.
Author contributions
YH and YZ contributed to conception and design of the study. WL wrote the first draft of the article. ZZ and YH reviewed and edited the article.
Funding
This work is sponsored jointly by the National Natural Science Foundation of China (41975090), the Natural Science Foundation of Hunan Province, China (2022JJ20043), the Scientific Research Program of National University of Defense Technology (18/19-QNCXJ) and the Jiangsu Collaborative Innovation Center for Climate Change in Nanjing University.
Conflict of interest
The authors declare that the research was conducted in the absence of any commercial or financial relationships that could be construed as a potential conflict of interest.
Publisher’s note
All claims expressed in this article are solely those of the authors and do not necessarily represent those of their affiliated organizations, or those of the publisher, the editors and the reviewers. Any product that may be evaluated in this article, or claim that may be made by its manufacturer, is not guaranteed or endorsed by the publisher.
References
Cai, Y., Han, X., Zhao, H., Klotzbach, P. J., Wu, L., Raga, G. B., et al. (2022). Enhanced predictability of rapidly intensifying tropical cyclones over the western north pacific associated with snow depth changes over the Tibetan plateau. J. Clim. 35 (7), 2093–2110. doi:10.1175/jcli-d-21-0758.1
Cao, X., Liu, Y., Wu, R., Bi, M., Dai, Y., and Cai, Z. (2019). Northwestwards shift of tropical cyclone Genesis position during autumn over the Western North Pacific after the late 1990s. Int. J. Climatol. 40 (3), 1885–1899. doi:10.1002/joc.6310
Chan, J. C. L., and Zhou, W. (2005). PDO, ENSO and the early summer monsoon rainfall over south China. Geophys. Res. Lett. 32 (8), 088100. doi:10.1029/2004gl022015
Chen, J., Wen, Z., Wu, R., Wang, X., He, C., and Chen, Z. (2017). An interdecadal change in the intensity of interannual variability in summer rainfall over southern China around early 1990s. Clim. Dyn. 48, 191–207. doi:10.1007/s00382-016-3069-8
Chen, J., Wu, R., and Wen, Z. (2012). Contribution of South China Sea tropical cyclones to an increase in southern China summer rainfall around 1993. Adv. Atmos. Sci. 29 (3), 585–598. doi:10.1007/s00376-011-1181-6
Chen, J., Wen, Z., Wu, R., Chen, Z., and Zhao, P. (2015). Influences of northward propagating 25–90-day and quasi-biweekly oscillations on eastern China summer rainfall. Clim. Dyn. 45, 105–124. doi:10.1007/s00382-014-2334-y
Chen, R., Wen, Z., Lu, R., and Liu, W. (2021). Interdecadal changes in the interannual variability of the summer temperature over Northeast Asia. J. Clim. 34, 1–50. doi:10.1175/jcli-d-21-0115.1
Chen, X., Li, C., Li, L., Yu, P., and Yang, M. (2020). Interannual variations of the influences of MJO on winter rainfall in southern China. Environ. Res. Lett.
Cheng, Y., Wang, L., and Li, T. (2020). Causes of interdecadal increase in the intraseasonal rainfall variability over southern China around the early 1990s. J. Clim. 33, 9481–9496. doi:10.1175/jcli-d-20-0047.1
Ding, Q., and Wang, B. (2007). Intraseasonal teleconnection between the summer eurasian wave train and the Indian monsoon. J. Clim. 20 (15), 3751–3767. doi:10.1175/jcli4221.1
Ding, Y. H., Wang, Z. Y., and Sun, Y. (2008). Interdecadal variation of the summer precipitation in East China and its association with decreasing Asian summer monsoon Part I: Observed evidences. Int. J. Climatol. 28 (9), 1139–1161. doi:10.1002/joc.1615
Ding, Y. H., Wang, Z. Y., Sun, Y., and Song, Y. F. (2009). Inter-decadal variation of the summer precipitation in China and its association with decreasing Asian summer monsoon Part II: Possible causes. Int. J. Climatol. 29 (13), 1926–1944. doi:10.1002/joc.1759
Gao, L., Huang, J., Chen, X., Chen, Y., and Liu, M. (2017). Risk of extreme precipitation under nonstationarity conditions during the second flood season in the Southeastern coastal region of China. JHM 18, 669–681.
Gill, A. E. (1980). Some simple solutions for heat-induced tropical circulation. Q. J. R. Meteorol. Soc. 106 (449), 447–462. doi:10.1002/qj.49710644905
Ha, Y., Zhong, Z., and Yang, X. Q. (2013). Eastward shift of northwest Pacific tropical cyclone genesis frequency anomaly in decaying El Niño. J. Meteorological Soc. Jpn. 91 (5), 597–608. doi:10.2151/jmsj.2013-503
Hartmann, D. L., and Michelsen, M. L. (1989). Intraseasonal periodicities in Indian rainfall. J. Atmos. Sci. 46 (18), 2838–2862. doi:10.1175/1520-0469(1989)046<2838:ipiir>2.0.co;2
Hendon, H. H., and Liebmann, B. (1990). The intraseasonal (30–50 day) oscillation of the Australian summer monsoon. J. Atmos. Sci. 47 (24), 2909–2924. doi:10.1175/1520-0469(1990)047<2909:tidoot>2.0.co;2
Hong, W., and Ren, X. J. (2013). Persistent heavy rainfall over South China during may–august: Subseasonal anomalies of circulation and sea surface temperature. Acta Meteorol. Sin. 27 (6), 769–787. doi:10.1007/s13351-013-0607-8
Hsu, H., and Weng, C. (2001). Northwestward propagation of the intraseasonal oscillation in the western north pacific during the boreal summer: Structure and mechanism. J. Clim. 14 (18), 3834–3850. doi:10.1175/1520-0442(2001)014<3834:npotio>2.0.co;2
Hsu, P., Lee, J., and Ha, K. (2016). Influence of boreal summer intraseasonal oscillation on rainfall extremes in southern China. Int. J. Climatol. 36 (3), 1403–1412. doi:10.1002/joc.4433
Hu, Y. J., Zhu, Y. M., Zhong, Z., and Ha, Y. (2014). New predictors and a statistical forecast model for mei-yu onset date in the middle and lower reaches of the yangtze river valley. Weather Forecast. 29 (3), 654–665. doi:10.1175/waf-d-13-00109.1
Huang, R., Liu, Y., Du, Z., Chen, J., and Huangfu, J. (2017). Differences and links between the east asian and south asian summer monsoon systems: Characteristics and variability. Adv. Atmos. Sci. 34, 1204–1218. doi:10.1007/s00376-017-7008-3
Ji, Y., Sun, X., Xu, Y., Yao, J., and Yang, X. Q. (2021). Summer regional pentad extreme precipitation in eastern China and their possible causes. Front. Earth Sci. (Lausanne). 8, 598025. doi:10.3389/feart.2020.598025
Jiang, X., Li, T., and Wang, B. (2004). Structures and mechanisms of the northward propagating boreal summer intraseasonal oscillation. J. Clim. 17 (5), 1022–1039. doi:10.1175/1520-0442(2004)017<1022:samotn>2.0.co;2
Kajikawa, Y., Yasunari, T., and Wang, Bin. (2009). Decadal change in intraseasonal variability over the South China Sea. Geophys. Res. Lett. 36 (6), L06810. doi:10.1029/2009gl037174
Kalnay, E., Kanamitsu, M., Kistler, R., Collins, W., Deaven, D., Gandin, L., et al. (1996). The NCEP/NCAR 40-year reanalysis project. Bull. Amer. Meteor. Soc. 77, 437–470. doi:10.1175/1520-0477(1996)077<0437:TNYRP>2.0.CO;2
Kwon, M., Jhun, J., and Ha, K. (2007). Decadal change in east Asian summer monsoon circulation in the mid-1990s. Geophys. Res. Lett. 34 (21), L21706. doi:10.1029/2007gl031977
Li, C., Li, T., Lin, A., Gu, D., and Zheng, B. (2015). Relationship between summer rainfall anomalies and sub-seasonal oscillations in South China. Clim. Dyn. 44, 423–439. doi:10.1007/s00382-014-2172-y
Li, J., and Mao, J. (2019). Coordinated influences of the tropical and extratropical intraseasonal oscillations on the 10–30-day variability of the summer rainfall over southeastern China. Clim. Dyn. 53, 137–153. doi:10.1007/s00382-018-4574-8
Li, X., Wang, C., and Lan, J. (2021). Role of the south China sea in southern China rainfall: meridional moisture flux transport. Clim. Dyn. 56, 2551–2568. doi:10.1007/s00382-020-05603-w
Li, X. Z., Wen, Z. P., Zhou, W., and Wang, D. X. (2012). Atmospheric water vapor transport associated with two decadal rainfall shifts over East China. J. Meteorological Soc. Jpn. 90 (5), 587–602. doi:10.2151/jmsj.2012-501
Liebmann, B., and Smith, C. A. (1996). Description of a complete (interpolated) OLR dataset. Bull. Amer. Meteor. Soc. 77, 1275–1277.
Liu, F., Ouyang, Y., Wang, B., Yang, J., Ling, J., and Hsu, P. (2020). Seasonal evolution of the intraseasonal variability of China summer precipitation. Clim. Dyn. 54, 4641–4655. doi:10.1007/s00382-020-05251-0
Liu, F., W, B., Ouyang, Y., Wang, H., Qiao, S., Chen, G., et al. (2022). Intraseasonal variability of global land monsoon precipitation and its recent trend. npj Clim. Atmos. Sci. 5 (1), 30–13. doi:10.1038/s41612-022-00253-7
Lu, W., Zhu, Y., Ha, Y., Zhong, Z., and Hu, Y. (2022). Recent decadal weakening of the summertime rainfall interannual variability over yellow-huaihe river valley attributable to the western pacific cooling. Front. Earth Sci. 10, 946252. doi:10.3389/feart.2022.946252
Ma, W. Q., Huang, W. Y., Yang, Z. F., Wang, B., Lin, D. Y., and He, X. S. (2018). Dynamic and thermodynamic factors associated with different precipitation regimes over South China during pre-monsoon season. Atmosphere 9 (6), 219. doi:10.3390/atmos9060219
Madden, R. A., and Julian, P. R. (1971). Detection of a 40–50 Day oscillation in the zonal wind in the tropical pacific. J. Atmos. Sci. 28 (5), 702–708. doi:10.1175/1520-0469(1971)028<0702:doadoi>2.0.co;2
Mao, J., Sun, Z., and Wu, G. X. (2010). 20–50–day oscillation of summer Yangtze rainfall in response to intraseasonal variations in the subtropical high over the Western North Pacific and South China Sea. Clim. Dyn. 34 (5), 747–761. doi:10.1007/s00382-009-0628-2
Matsuno, T. (1966). Quasi-geostrophic motions in the equatorial area. J. Meteorological Soc. Jpn. 44 (1), 25–43. doi:10.2151/jmsj1965.44.1_25
Miao, R., Wen, M., Zhang, R., and Li, L. (2019). The influence of wave trains in mid-high latitudes on persistent heavy rain during the first rainy season over South China. Clim. Dyn. 53, 2949–2968. doi:10.1007/s00382-019-04670-y
Murakami, T. (1972). Equatorial stratospheric waves induced by diabatic heat sources. J. Atmos. Sci. 29 (6), 1129–1137. doi:10.1175/1520-0469(1972)029<1129:eswibd>2.0.co;2
Nie, Y., and Sun, J. (2022). Causes of interannual variability of summer precipitation intraseasonal oscillation intensity over southwest china. J. Clim. 35 (12), 3705–3723. doi:10.1175/JCLI-D-21-0627.1
Ramamurthy, K. (1969). Monsoon of India: Some aspects of the ‘break’ in the Indian southwest monsoon during july and august. Forecast. Man. 1, 1–57.
Ren, X., Yang, X., and Hu, H. (2017). Subseasonal variations of wintertime north Pacific evaporation, cold air surges, and water vapor transport. J. Clim. 30 (23), 9475–9491. doi:10.1175/jcli-d-17-0140.1
Takaya, K., and Nakamura, H. (2001). A formulation of a phase-independent wave activity flux for stationary and migratory quasigeostrophic eddies on a zonally varying basic flow. J. Atmos. Sci. 58, 608–627. doi:10.1175/1520-0469(2001)058<0608:afoapi>2.0.co;2
Wang, B., and Xie, X. (1997). A model for the boreal summer intraseasonal oscillation. J. Atmos. Sci. 54 (1), 72–86. doi:10.1175/1520-0469(1997)054<0072:amftbs>2.0.co;2
Wang, J., Wen, Z., Wu, R., and Lin, A. (2017). The impact of tropical intraseasonal oscillation on the summer rainfall increase over southern China around 1992/1993. Clim. Dyn. 49, 1847–1863. doi:10.1007/s00382-016-3425-8
Wang, L., Li, T., and Nasuno, T. (2018). Impact of Rossby and Kelvin wave components on MJO eastward propagation. J. Clim. 31, 6913–6931.
Wang, M., Wang, J., Duan, A., Yang, J., and Liu, Y. (2019). Quasi-biweekly impact of the atmospheric heat source over the Tibetan Plateau on summer rainfall in Eastern China. Clim. Dyn. 53, 4489–4504. doi:10.1007/s00382-019-04798-x
Wang, X., Zhang, L., Wang, Y., and Zhang, Y. (2021). Influences of the mid-latitude westerly trough on stratospheric gravity waves generated by typhoon Lekima (2019). JGR. Atmos. 126, e2021JD035399. doi:10.1029/2021JD035399
Wu, B., Li, T., and Zhou, T. J. (2010). Relative contributions of the Indian Ocean and local SST anomalies to the maintenance of the western north pacific anomalous anticyclone during the El Niño decaying summer*. J. Clim. 23 (11), 2974–2986. doi:10.1175/2010jcli3300.1
Wu, B., Zhou, T., and Li, T. (2009). Seasonally evolving dominant interannual variability modes of east asian climate. J. Clim. 22 (11), 2992–3005. doi:10.1175/2008jcli2710.1
Wu, R., Wen, Z., Yang, S., and Li, Y. (2010). An interdecadal change in southern China summer rainfall around 1992/93. J. Clim. 23 (9), 2389–2403. doi:10.1175/2009jcli3336.1
Wu, Z. W., Jiang, Z. H., and He, J. H. (2006). Comparative analysis of flood and drought features during the first flood period in South China, Meiyu period in the Yangtze-Hui River valleys and the rainy season in North China in the last 50 years. Chin. J. Atmos. Sci. 30 (3), 391–401.
Xie, P., Yatagai, A., Chen, M., Hayasaka, T., Fukushima, Y., Liu, C., et al. (2007). A gauge-based analysis of daily precipitation over East Asia. J. Hydrometeorol. 8, 607–626. doi:10.1175/jhm583.1
Xu, P., Wang, L., Chen, W., Feng, J., and Liu, Y. (2019). Structural Changes in the Pacific–Japan Pattern in the Late 1990s. J. Climate 32, 607–621.
Yamaura, T., and Kajikawa, Y. (2017). Decadal change in the boreal summer intraseasonal oscillation. Clim. Dyn. 48, 3003–3014. doi:10.1007/s00382-016-3247-8
Yang, S., and Li, T. (2016). Intraseasonal variability of air temperature over the mid-high latitude Eurasia in boreal winter. Clim. Dyn. 47, 2155–2175.
Yao, C., Yang, S., Qian, W. H., Lin, Z. M., and Wen, M. (2008). Regional summer precipitation events in Asia and their changes in the past decades. J. Geophys. Res. 113 (D17), D17107. doi:10.1029/2007jd009603
Yin, X., Zhou, L., and Huangfu, J. (2021). Weakened connection between east China summer rainfall and the east asia-pacific teleconnection pattern. Atmosphere 12, 704. doi:10.3390/atmos12060704
Zhang, L., Wang, B., and Zeng, Q. (2009). Impact of the madden–julian oscillation on summer rainfall in southeast China. J. Clim. 22 (2), 201–216. doi:10.1175/2008jcli1959.1
Zhao, H., Lu, Y., Jiang, X., Klotzbach, P. J., Wu, L., and Cao, J. (2022a). A statistical intraseasonal prediction model of extended boreal summer western north pacific tropical cyclone genesis. J. Clim. 35 (8), 2459–2478. doi:10.1175/jcli-d-21-0110.1
Zhao, H., Zhao, K., Klotzbach, P. J., Wu, L., and Wang, C. (2022b). Interannual and interdecadal drivers of meridional migration of western north pacific tropical cyclone lifetime maximum intensity location. J. Clim. 35, 2709–2722. (published online ahead of print 2022). doi:10.1175/jcli-d-21-0797.1
Zheng, B., and Huang, Y. (2018). Mechanisms of meridional-propagating high-frequency intraseasonal oscillation associated with a persistent rainfall over South China. Mon. Weather Rev. 146 (5), 1475–1494. doi:10.1175/mwr-d-17-0260.1
Zhou, W., Li, C., and Chan, J. C. L. (2006). The interdecadal variations of the summer monsoon rainfall over South China. Meteorol. Atmos. Phys. 93 (3-4), 165–175. doi:10.1007/s00703-006-0184-9
Zhu, X., Zhong, Z., Zhu, Y., Hu, Y. J., Ha, Y., and Guo, T. (2022). Sensitivity experiments on the role of moisture in the eastward propagation of MJO. Clim. Dyn. 59, 263–280. doi:10.1007/s00382-021-06126-8
Zhu, Z., Li, T., Hsu, P.-C., and He, J. (2015). A spatial–temporal projection model for extended-range forecast in the tropics. Clim. Dyn. 45, 1085–1098. doi:10.1007/s00382-014-2353-8
Keywords: summertime intraseasonal rainfall, interdecadal transition, interannual variability, “Silk Road” teleconnection, Western Pacific subtropical high, South China
Citation: Lu W, Zhu Y, Hu Y, Zhong Z and Ha Y (2022) Causes of the interdecadal transition in interannual variability of summertime intraseasonal rainfall over Southern China. Front. Environ. Sci. 10:1030737. doi: 10.3389/fenvs.2022.1030737
Received: 29 August 2022; Accepted: 05 October 2022;
Published: 25 October 2022.
Edited by:
Haikun Zhao, Nanjing University of Information Science and Technology, ChinaReviewed by:
Zhiping Wen, Fudan University, ChinaDong Si, Institute of Atmospheric Physics (CAS), China
Copyright © 2022 Lu, Zhu, Hu, Zhong and Ha. This is an open-access article distributed under the terms of the Creative Commons Attribution License (CC BY). The use, distribution or reproduction in other forums is permitted, provided the original author(s) and the copyright owner(s) are credited and that the original publication in this journal is cited, in accordance with accepted academic practice. No use, distribution or reproduction is permitted which does not comply with these terms.
*Correspondence: Yimin Zhu, zhuyimin@21cn.com; Yao Ha, haoyao86@nudt.edu.cn, hayao1986@yeah.net