 Zhang Wenjie
 An Mengyang3
 Zhao Fang
94% of researchers rate our articles as excellent or good
Learn more about the work of our research integrity team to safeguard the quality of each article we publish.
Find out more
ORIGINAL RESEARCH article
Front. Environ. Sci., 25 October 2022
Sec. Atmosphere and Climate
Volume 10 - 2022 | https://doi.org/10.3389/fenvs.2022.1030301
This article is part of the Research TopicAir Pollution Remote Sensing and the Subsequent Interactions with Ecology on Regional Scales - Volume IIView all 10 articles
The mountain base elevation, which refers to the initial altitude of a mountain or the mountain altitudinal belt, is of great significance for the study of mountain altitudinal zonality and the mass elevation effect. However, a fast and efficient algorithm for the automatic extraction of a mountain base elevation is still lacking; therefore, a new method based on mountain structure modeling to calculate the mountain base elevation is proposed for the Qinling-Daba Mountains (QDM). The result shows that 1) the mountain structures in different catchments of the Qinling-Daba Mountains can be divided into six types, namely, pyramid, low-diamond, diamond, inverse pyramid, hourglass, and ellipsoid, and each type has a specific distribution law; 2) based on the mountain structure, the calculation result of the mountain base elevation in the Qinling-Daba Mountains ranges from 99 m to 3,979 m, being high in the west, north, and south and low in the east and middle, which is consistent with the overall terrain distribution of the Qinling-Daba Mountains; and 3) there is a good linear correlation between the mountain base elevation and the average altitude in the Qinling-Daba Mountains with R2 = 0.96 (p < 0.01), which also indicates that the mountain base elevation quantification algorithm works well in the mountain areas with a complex terrain.
The mass elevation effect (MEE), a phenomenon that shows the distribution boundary of internal similar vegetation, is higher than that of peripheral isolated mountains, and this occurs widely in large mountains and plateaus (Grubb, 1971; Holtmeier, 2009; Zhao et al., 2014; Zhao et al., 2015). It not only changes and destroys the horizontal zonality but also shapes the non-zonality of vegetation and climate distribution in mountainous areas (Zhang and Yao, 2016) and has become a hot field in mountain geography research recently (Han, 2011a; Yao and Zhang, 2012; Zhao et al., 2014; Zhao et al., 2015; Zhang and Yao, 2016; Han et al., 2018; Zhao et al., 2021; Tian et al., 2022). The mountain base elevation (MBE), which is closely related to MEE, is the key topographic factor for the MEE (Han, 2011a; Han et al., 2012; Zhao et al., 2014; Zhao et al., 2015). Generally, a higher MBE can cause a higher surface temperature in terms of the same altitude, and this can result in a higher vegetation distribution (Shreve, 1922; Han, 2011a; Yao and Zhang, 2013; Lan et al., 2022). Therefore, the MBE is used widely as a proxy of MEE to reveal the important influence of the MEE on the altitudinal distribution of timberline and snowline (Han, 2011a; Han et al., 2012; Zhao et al., 2014; Zhao et al., 2015). The automatic extraction of the MBE will be helpful for the quantitative study of the MEE and in explaining the intensity and mechanism of the non-zonal effect of mountain vegetation distribution.
The MBE is the initial elevation of different parts of a mountain system or plateau, determining the structure of the mountain altitudinal spectrum and the type of the vegetation altitudinal belt (Hou, 1981). For the same orientation, same soil, and rock texture, the vegetation types on the mountain are also roughly similar. For mountains that are not far apart, the higher MBE is generally associated with a higher altitudinal distribution elevation (Shreve, 1922). For this reason, the extraction of the MBE is considered helpful to explain the structure and distribution of mountain altitudinal belts. However, traditionally, the mountain base belt and MBE are mostly obtained by manual means (Hou, 1981; Liu, 1981; Zhao et al., 2014; Tian et al., 2022), which is not only inefficient but also inaccurate because of the lack of scientific standard and the existence of subjectivity. With the development of modern Earth observation technology and GIS technology (Zhu et al., 2021), especially with the development and application of the digital elevation model (DEM) data, the automatic quantification of the MBE becomes feasible.
The extraction of the MBE depends on the research scale and mountain structure. From the mountain system scale perspective, the mountain base is the turning surface of the regional topography. It is relatively flat and occupies a large area corresponding to the altitude, which is usually accompanied by an obvious increase in altitude above it and valleys or plains below it. According to Elsen’s classification of global mountain systems, all mountains can be divided into four types (Elsen and Tingley, 2015), namely, pyramid, inverse pyramid, diamond, and hourglass, according to the law of mountain surface area changes with elevation. For the pyramid type, the maximum surface area appears at a lower elevation closer to the bottom of the mountain, while the other three types do not. In a certain altitudinal range, the mountain surface area of the other three types increases with altitude, resulting in a higher mountain base elevation than in a pyramid mountain. However, when looking deeply into the internal structure of a mountain system, it can be found that there are obvious differences in mountain base elevation at different positions for the same mountain. For example, the mountains of the European Alps have a mountain base elevation close to sea level in the northern and southern edges, but 1,000–1,500 m in the internal relatively continental climate zone. This means that there are unignorable differences in mountain base elevation within the mountain system, and it is necessary to further divide the mountains with complex terrain and identify a more refined mountain base elevation, thus laying a foundation for the further study of the MEE within the mountain system. This method can solve the shortcomings of low efficiency and inaccuracy of previous methods by total automatic extraction of MBE. The accurate MBE would, in the future, contribute to the quantification of the MEE and construct a foundation for an in-depth explanation of the vegetation distribution and climate pattern inside mountains.
The Qinling-Daba Mountains (QDM) lie between 30 ∼ 36°N and 101–114°E, with a length of about 1,000 km from east to west and an area of about 3,00,000 km2 (Figure 1). It extends from the west of Dieshan Mountain in Gansu to the east of Shennongjia Mountain in Hubei, spanning six provinces and cities of Gansu, Sichuan, Shaanxi, Chongqing, Hubei, and Henan, and consists of the towering western Qinling Mountains in the west, the northern Qinling Mountains in the north, the Daba Mountain in the south, and the Hanjiang Valley in the middle.
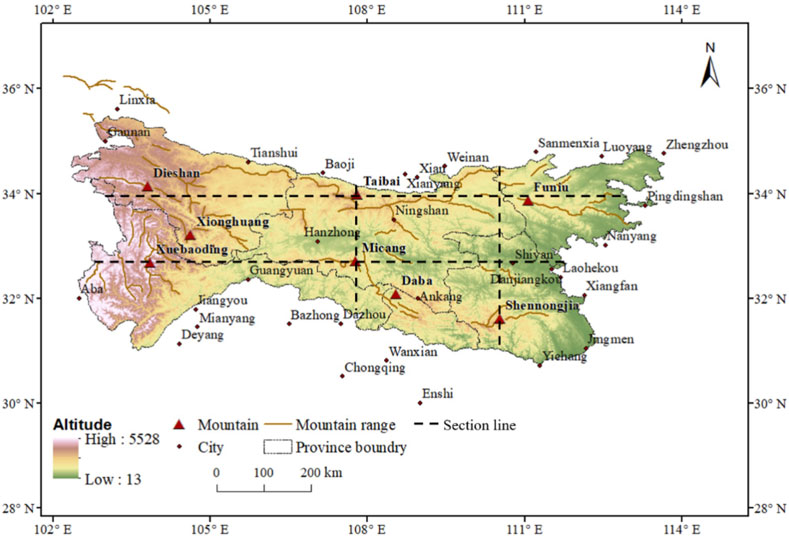
FIGURE 1. Topography of Qinling-Daba Mountains and the position of four section lines.
As one of the most important mountain ranges in China, the QDM, located in central China, is not only the boundary between the Yangtze River Basin and Yellow River Basin but also the natural boundary of geography and climate between northern and southern China. Specifically, the southern part of the Daba Mountains is in the north subtropical zone, with the evergreen broad-leaved forest as the main vegetation, while the northern part of the Qinling Mountains is in the warm temperate zone with the deciduous broad-leaved forest as the major vegetation community. On the whole, the terrain inside the mountains is quite complex, with high elevation in the west, north and south, and low elevation in the east and middle. For example, the southern slope of the Qinling Mountains is a fold belt, where the terrain is relatively flat. From the ridge line of the Qinling Mountains (3,600–3,700 m in elevation) to the Hanshui Valley (400–500 m) on the southern edge, the slope length can reach 100–120 km, and the mountain base elevation presents complex changes. On the contrary, the northern slopes of the Qinling Mountains form the shield, which is mainly composed of the Shifeng Forest and the Great Cliff Layer (Yu, 1958; Fu et al., 1996; Liu et al., 2004), and the terrain is extremely steep. From the main peak (∼3,700 m) to the Weihe plain (∼400–500 m) on the northern edge, the slope is less than 40 km long, with fewer uplands and a lower base elevation. Therefore, the Qinba Mountain range exhibits a complex mountain effect, and it is not difficult to understand that the complex terrain of the Qinba Mountains leads to completely different mountain base elevations in different parts, which makes it representative for the study of MEE.
The quantification of MBE mainly consists of three steps, namely, mountain partitioning, mountain structure judgment, and MBE calculation (Figure 2). The first step is to divide the large area of the QDM into smaller mountain units and calculate the surface area at different altitudes in each partition. The second step is to determine the structure type of each partition according to the area–elevation relationship. The last step is to determine the mountain base elevation according to the average elevation below the altitude of the maximum surface area and explore the correlation between the MBE and the average elevation.
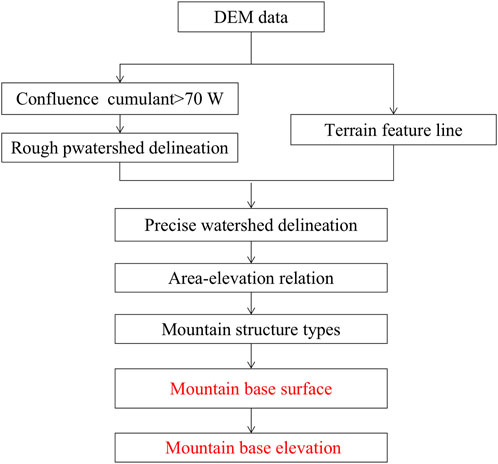
FIGURE 2. Flow map of MBE quantification.
In this study, the catchment divisions form the basis for judging the mountain structure and calculating mountain base elevation, and these are mainly based on the terrain feature line (Xiao et al., 2008) and hydrological analysis (Nie, 2008). The terrain feature line normally contains features such as the ridge line or valley line, which can be used in the catchment divisions. However, manual division is unavoidable in this process. The other hydrological method divides the inverted mountain into watersheds by setting a certain threshold of confluence accumulation, which is simulated by a hydrological analysis algorithm based on DEM (https://asterweb.jpl.nasa.gov/gdem.asp). In this method, the boundary line of each watershed of the inverted mountain is roughly the valley line of the upright mountain. Compared with the terrain feature line method, the hydrological analysis method is simpler and more scientific, but its high dependence on the partition algorithm is a vital defect, which makes it difficult to find inappropriate situations in the partition progress. Therefore, the combination of the two methods is considered the best solution to make up for their shortcomings, which not only ensures the scientificity of the calculation process but also reduces the possibility of unreasonable partition.
The QDM partition is carried out by the hydrological analysis tools of ArcGIS 10.2 software, and the specific steps are as follows: first, invert the QDM terrain, which is primarily to ensure that the obtained watershed partition results have the significance of mountain zoning. Second, extract the watershed of the inverted terrain as a rough QDM partition after a series of steps, including the filling of depressions, the calculation of flow direction and discharge, and the extraction of the threshold value of confluence accumulation in turn. Finally, extract the terrain feature lines and manually determine the final fine partition combined with the watershed boundaries.
In watershed zoning, the determination of the threshold value of confluence accumulation is the key to the whole method. If the threshold value is too high, the actual river channel will be neglected, while if the threshold value is too small, a large number of pseudo-rivers will be produced, which will severely interfere with the research. Previous studies have often determined the river threshold based on the “trial and error method (Zhu et al., 2013),” plotting the curve of the river network density changing with confluence accumulation. It is found that the curve tends to be stable when the accumulation of confluence in the QDM reaches 700,000 (Liu et al., 2018). Therefore, in this study, the threshold value of confluence accumulation is set to 7,00,000.
In this study, the law of the mountain surface area changing with altitude proposed by Elsen (Lan et al., 2022) is used to describe the mountain structure. The mountain structure of the QDM is re-divided based on Elsen’s study but considers more interior information about the mountain. To facilitate automatic classification by the computer, an algorithm is designed to determine the mountain structure according to the number of the curve peak and the ratio of the elevation where the area peak is located to the whole mountain (Figures 3, 4).
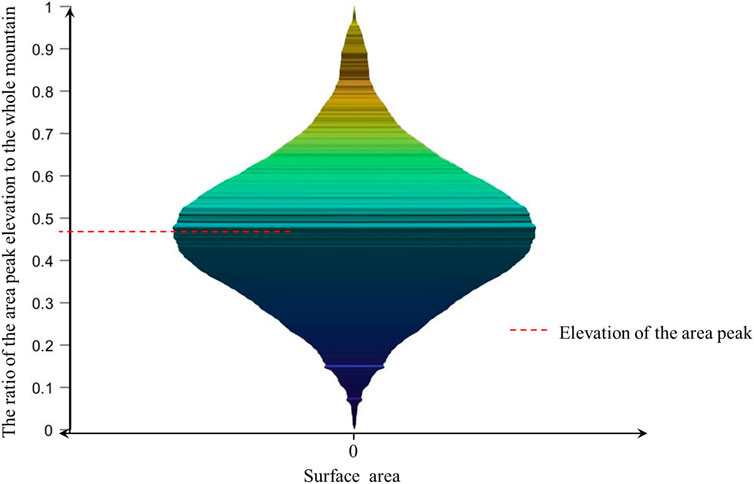
FIGURE 3. Model of the relationship between the mountain surface area and altitude.
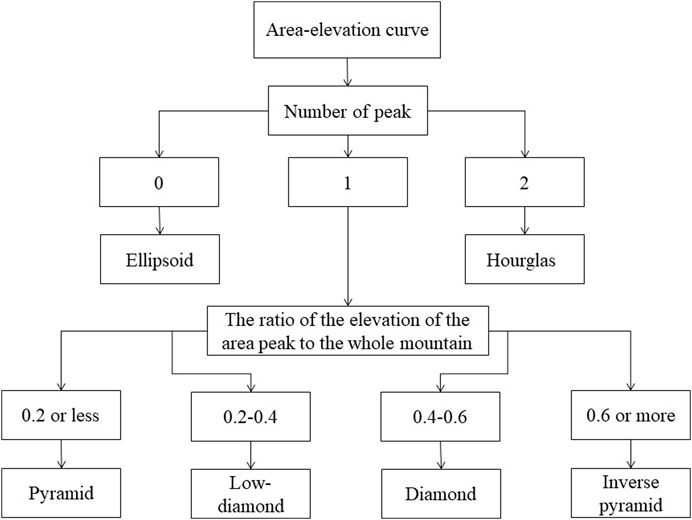
FIGURE 4. Algorithm for judging the mountain structure.
In accordance with the curve of the mountain surface area changing with altitude in every partition of the QDM, the mountains are divided into six types, namely, pyramid, low-diamond, diamond, ellipsoid, inverse pyramid, and hourglass (Figure 5). Among the six types, the peak surface area of the pyramid appears at the bottom of the mountain and decreases with the increase in altitude; the diamond type is one whose surface area peak appears roughly in the middle of the mountain, and it is the most common among all types; the low-diamond type is between the pyramid type and diamond type, with the surface area peak appearing in the middle and lower parts of the mountain; the ellipsoid type has a form showing a gentle change, where the surface area peak is not prominent; the inverse pyramid type is completely opposite to the pyramid type, with the surface area peak located in the upper part of the mountain and which decreases with the decrease in the altitude; and the hourglass type has two surface area peaks which are far apart, and the surface area shrinks sharply in the middle of the mountain.
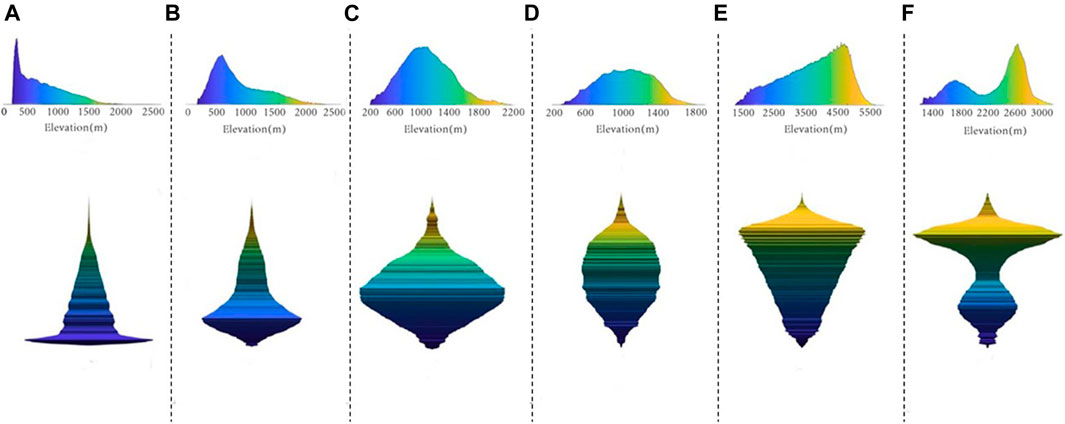
FIGURE 5. Types of mountain structures: (A) Pyramid type, (B) low-diamond type, (C) diamond type, (D) ellipsoid type, (E) inverse pyramid type, and (F) hourglass type.
Generally, the mountain base surface can be considered as the base of the whole mountain, which is related to the location where the maximum surface area of the mountain appears to a greater extent; therefore, this study regards where the peak of the mountain is located as the upper limit. The value of the MBE is defined as the average of the altitude of the surface peak area, and the lowest altitude of the mountain
where Hb is the mountain base elevation, Hm is the altitude where the peak surface area is located, and Hl is the lowest altitude of the mountain.
By using the watershed zoning method and terrain feature line method, we divide the QDM into 209 zones (Figure 6). Each partition is connected by small valleys, and the surface runoff flows into them and forms small watersheds. These valleys are considered to have an independent MBE. The average altitude of each partition in the QDM (Figure 7) is calculated, and its distribution is consistent with the overall terrain pattern in the QDM, which is generally higher in the west and lower in the east. Due to the obvious differences in average altitudes, different partitions will form different watersheds, thus forming different MBEs.
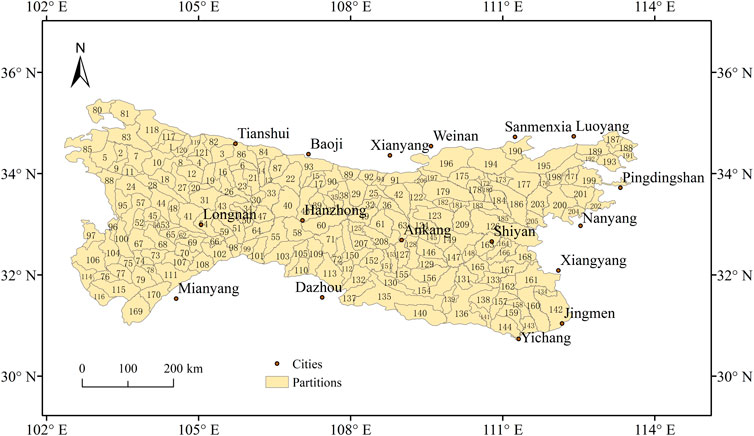
FIGURE 6. Catchment divisions (209) in the Qinling-Daba Mountains.
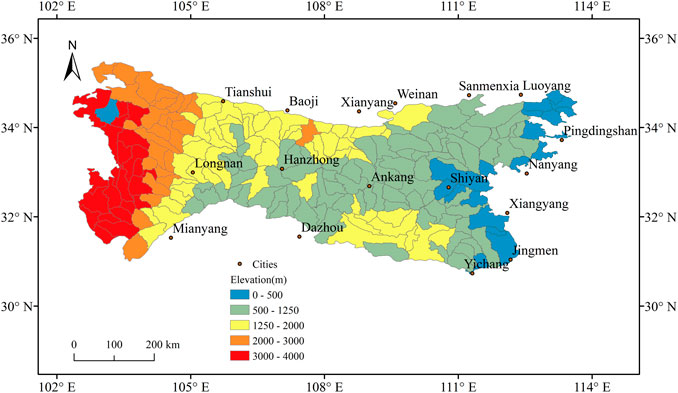
FIGURE 7. Average altitude of each catchment in the Qinling-Daba Mountains.
For different profiles, the average elevation of the partitions is consistent with the terrain (Figure 8). For instance, the average elevation of the QDM shows a similar step-like rising from east to west along the two latitude profiles of 32.67°N and 33.96°N. The average elevation first decreases and then rises from north to south along the two longitude profiles of 110.53°E and 107.81°E, covering the Qinling Mountains (north), the Hanjiang Valley in the middle, and the Daba Mountains in the south. In addition, for the 107.81°E profile, the average elevation of the Qinling Mountains (near Taibai Mountain) is higher than that of the Daba Mountains, while for another 110.53°E profile, the average elevation of the Daba Mountains (near Shennongjia) is higher than that of the Qinling Mountains (near Funiu Mountain). This is consistent with the actual terrain conditions.
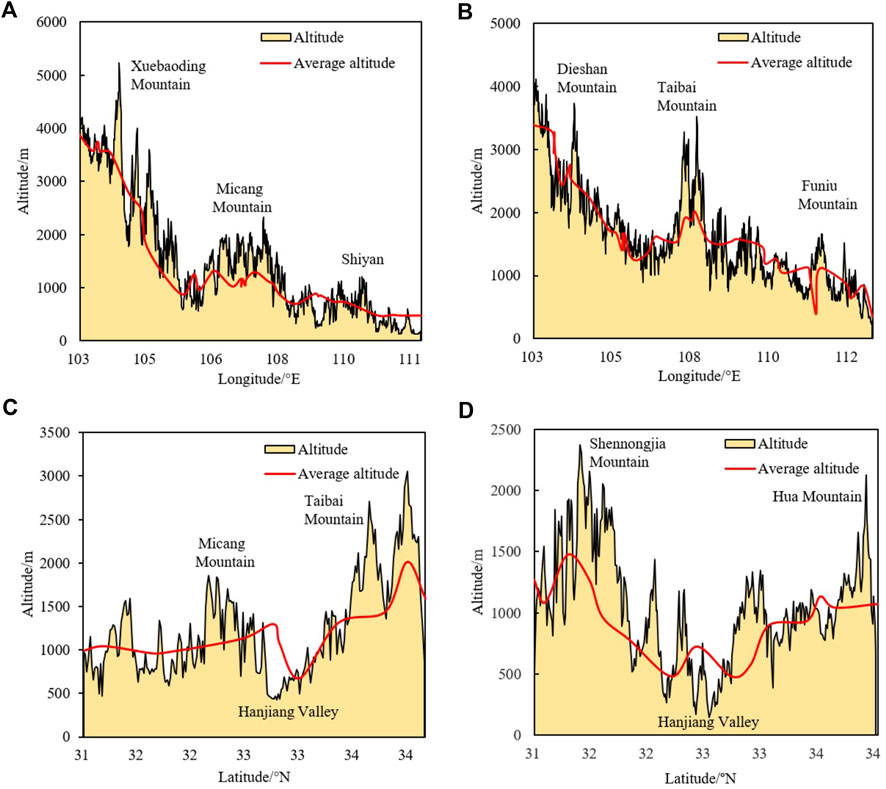
FIGURE 8. Altitude and average altitude along four profiles of (A) 32.67°N, (B) 33.96°N, (C) 107.81°E, and (D) 110.53°E in the Qinling-Daba Mountains.
Based on the automatic extraction algorithm of mountain structures at a regional scale, the mountain structure types of 209 partitions are divided into six patterns, namely, ‘pyramid,’ ‘low-diamond,’ ‘diamond,’ ‘inverse pyramid,’ ‘hourglass,’ and ‘ellipsoid,’ and each type has a specific altitude distribution range. As shown in Figure 9 and Figure 10, the pyramid mountains are mainly distributed in the relatively flat terrain in the east, some low mountains in the middle, and a small number of low mountains on the southern edge of the western alpine group in the QDM, with an average elevation range of about 500–1,000 m. Slightly higher than pyramid mountains, low-diamond mountains are usually distributed around pyramid mountains, such as the north and south sides of the Hanjiang Valley and the periphery of the western high mountains, with an altitude range of 1,000–1,500 m. As the most common type, diamond mountains are widely distributed in the northwest and north of the QDM, and also in some higher altitude areas in the south, with an average altitude of about 1,500–3,000 m. The inverse pyramid mountain is the highest type, with an average altitude of about 2000–4,000 m, is concentrated in the lofty areas in the west of the QDM, and also scattered in other prominent areas. Ellipsoidal mountains are scattered and roughly located near ridges or in areas with severe topographic changes, and the average elevation is 1,000–1,500 m.
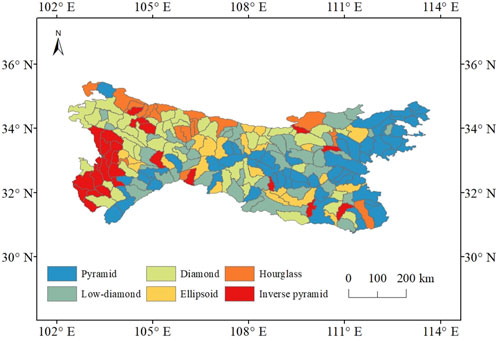
FIGURE 9. Spatial distribution of different mountain structure types in the Qinling-Daba Mountains.
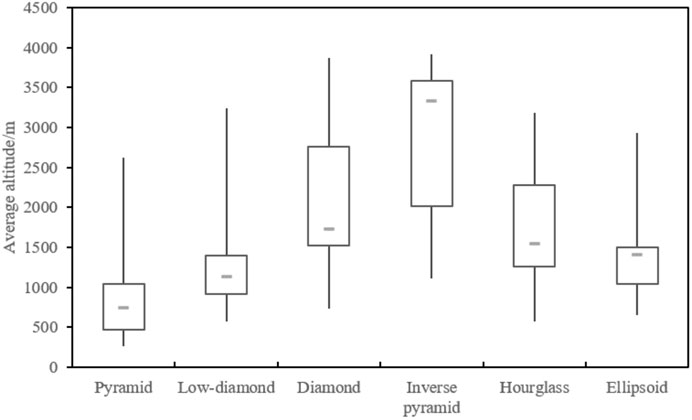
FIGURE 10. Average elevation ranges of different mountain structure types in the Qinling-Daba Mountains.
Along the longitudes, 110.53°E and 107.81°E, eight partitions near each section line are selected to draw the mountain structure sequence (Figure 11). It is not difficult to find that the area–elevation relation curve changes regularly with the terrain. Specifically, at the Qinling and Daba mountain ridges, the peak of the surface area is at the highest elevation, while it is relatively low on the southern and northern slopes, and reaches the lowest in Hanjiang Valley in the middle, showing a high–low–high change rule in a north–south direction. Accordingly, the mountain structure types also show regular changes. Along the longitude 107.81°E, the mountain structure types at the Qinling Mountains and Daba Mountains are diamond, the south and north slopes are low-diamond, and the Hanjiang Valley is a pyramid. At another section line of 110.53°E, the structure of the Qinling ridge becomes an inverse pyramid, the southern slope of the Daba Mountains becomes ellipsoid and other parts are the same as those at 107.81°E. Obviously, the distribution law of the mountain structure is completely consistent with the actual terrain trend, which reflects the important significance of the mountain structure in exhibiting the mountain terrain.
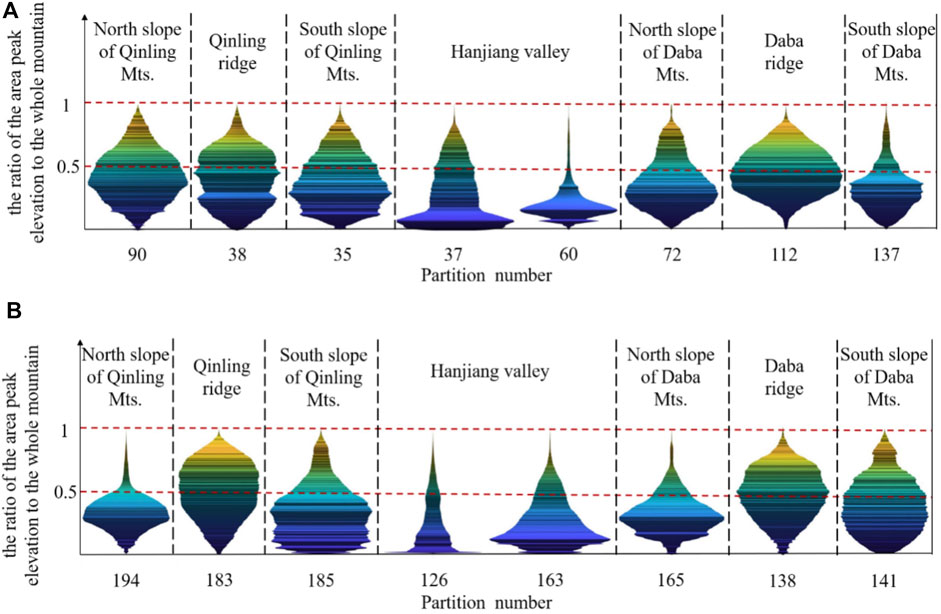
FIGURE 11. Mountain structure recognitions near 107.81°E (A) and 110.53°E (B) in the QDM.
Based on the peak feature of the mountain structure curve, the mountain base elevation is finally determined, showing an obvious spatial distribution law in the QDM (Figures 12, 13). From east to west, the MBE of the Qinba Mountains increases in a step-like manner. For example, the MBE on the west side of Dieshan Mountain, Xionghuang Mountain, and Xuebaoding Mountain is over 2,250 m, then ranges from 1,250 m to 2,250 m between their east sides and the Jialing River, and then ranges from 500 m to 1,250 m in Laicang Mountain, Daba Mountain, and Taibai Mountain, and finally to less than 500 m in Funiu Mountain and Shennongjia Mountain in the east of the QDM. From south to north, the Qinba Mountains present a high–low–high distribution characteristic. Along 107.81°E, the MBE near the Daba Mountains in the south at 32.67°N is more than 1,000 m, while it is less than 500 m at the Hanjiang River between 32.67°N and 33.96°N, and then more than 1,000 m again in Taibai Mountain near 33.96°N. Along 110.53°E, the MBE of the Daba Mountains and the south slope of Shennongjia Mountain is between 500 and 1,250 m, then becomes less than 750 m at the north slope of Shennongjia Mountain and the south slope of Taibai Mountain and Funiu Mountain, and then returns to 500–1,250 m in Taibai Mountain and the northern slope of Funiu Mountain. As mentioned earlier, on different profile lines, the variation of the MBE of the QDM is consistent with the average altitude (Figure 13). Furthermore, the regression analysis of the MBE and the average altitude in each partition shows that there is a significant positive correlation (Figure 14), with R2 as high as 0.96 (p < 0.01). This implies that the higher the average altitude of the mountain is, the higher the MBE is. Specifically, it is about 873 m for every 1,000 m increase in average altitude. To some extent, it also proves that the MBE can reflect the terrain change and mountain effect.
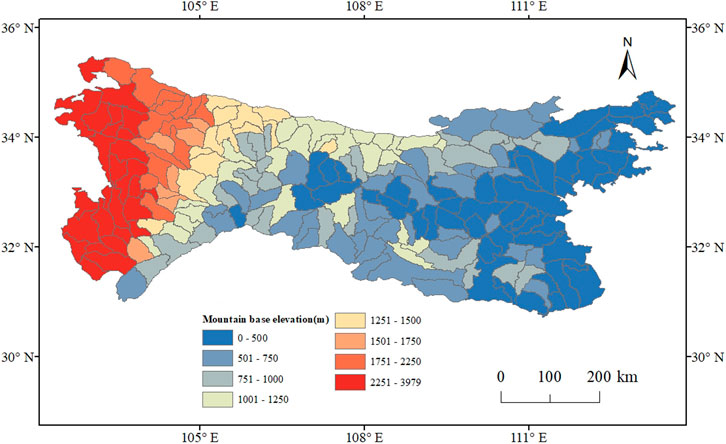
FIGURE 12. Spatial distribution of mountain base elevation in the Qinling-Daba Mountains.
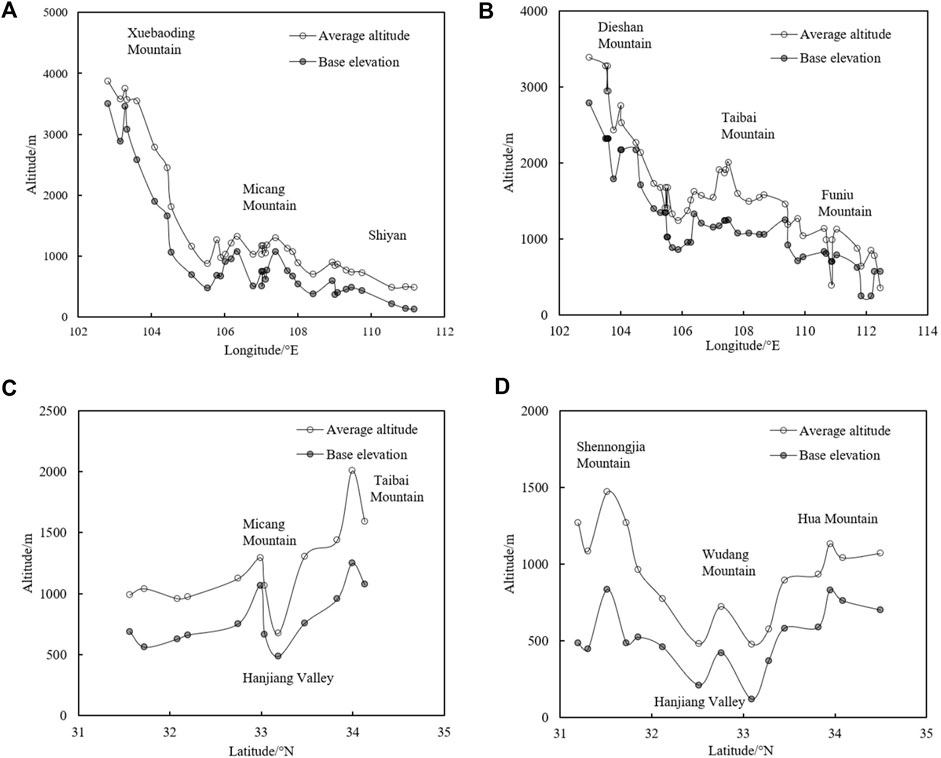
FIGURE 13. Average altitude and mountain base elevation in the QDM along four profiles of (A) 32.67°N, (B) 33.96°N, (C) 107.81°E, and (D) 110.53°E.
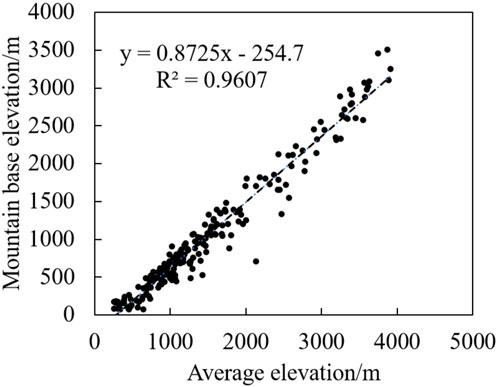
FIGURE 14. Scatter plot of the mean altitude and base elevation in the Qinling-Daba Mountains.
The MEE has an important influence on the boundary of mountain altitudinal belts and timberline distribution. As a heating surface that absorbs solar radiation, the towering mountains produce an obvious thermal effect which enhances the heat conditions inside the giant mountain systems and plateaus, thus leading to a higher mountain altitudinal belt elevation (Holtmeier, 2009). Closely related to the MEE, the MBE is a key index of quantification of the mountain effect. However, the traditional MBE extraction method is mostly manual (Han, 2011a), which is not only inefficient but also inaccurate because of the lack of scientific criterion and the existence of subjectivity. Previous studies tried to use terrain and hydrological features to automatically partition the mountain base elevation (Zhang et al., 2012), but for the specific MBE, it is still necessary to interpret zone-by-zone manually according to the topographic features, which is not suitable for numerous partitions. In recent years, some studies have proposed calculating the MBE according to the terrain fluctuation degree and the average elevation of the partition after automatically partitioning, which further reduces human intervention and improves the calculation efficiency. However, these methods are all based on two-dimensional considerations and lack consideration of the three-dimensional mountain structure; therefore, it is unable to reflect the overall mountain structure and establish a three-dimensional model. According to the relationship between the mountain area and altitude, this study established three-dimensional modeling of mountain structures at a regional scale. Due to the complexity and diversity of mountain structures at the QDM, this study divided the mountain structure into six categories adding two additional types, namely, low-diamond mountains and ellipsoid mountains, in addition to Elsen’s four categories at the global scale (Elsen and Tingley, 2015). Based on watershed segmentation and mountain structure information, we automatically obtained MBE for 209 sub-basins.
The QDM is located in the transitional area between the Qinghai–Tibet Plateau and the eastern plains of China. Its basic terrain of high west and low east determines the distribution characteristics of the MBE. From the east–west perspective, the mountain base elevation of the QDM shows an obvious step-like increase from east to west. From north to south, the base elevation first increases to a ridge and then decreases, in both the Qinling Mountains and Daba Mountains. Among them, the MBE of the Hanjiang Valley is the lowest (<500 m), which is consistent with the changing trend of the average altitude, proving that the MBE is closely related to the average altitude, and R2 of them reaches 0.96 in the QDM. In addition, the mountain structure is closely related to the surface area of the mountain, which means that the higher the MBE, the larger the area receiving radiation is, and this can result in a stronger mountain warming effect.
In addition, the higher the MBE of the selected zone within the QDM generally, the higher the boundary of the mountain altitudinal zone is. For example, the upper limit of the mixed forest in Taibai Mountain (MBE of 1,250 m) is 120 m higher than that in the Hanjiang Valley (MBE of 491 m), and the upper limit of the birch forest is 200 m higher than that in the Hanjiang Valley (Liu et al., 2018). It demonstrates that the influence of the MEE determined by the MBE even affects the position of the north–south boundary (Zhao et al., 2019; Zhang et al., 2021). It can also be foreseen that the quantification of MBE is of great significance in the division of the north–south boundary in China. However, it is important to note that the MBE is a common substitute factor for quantifying the MEE but is not the only influencing factor. There are other possible influencing factors, such as the slope direction, shading degree, and lithology, which contribute to the MEE to some extent.
By using the watershed partition method and terrain feature line method, the QDM is divided into 209 zones, which are considered to have independent MBEs. The average elevation of the MBE in QDM is generally higher in the west, north, and south and lower in the east and the middle, which is consistent with the overall terrain of the QDM. The MBE along the four profile lines of 32.67°N, 33.96°N, 107.81°E, and 110.53°E also evidences this pattern. According to the area–elevation relationship, the mountain structure types of 209 partitions are divided into six patterns, namely, ‘pyramid,’ ‘low-diamond,’ ‘diamond,’ ‘inverse pyramid,’ ‘hourglass,’ and ‘ellipsoid,’ and their average elevation interval is, respectively, 500–1,000 m, 1,000–1,500 m, 1,500–3,000 m, 2000–4,000 m, 1,000–2,500 m, and 1000–1,500 m. The higher MBEs are more likely to be found in the inverse pyramid, diamond, and hourglass mountains, and the lower and medium MBEs are usually distributed in the pyramid and low-diamond mountains. In addition, the significant and positive correlations between the MBEs and the average altitude (R2 = 0.96, p < 0.05) prove the usefulness of our algorithm.
The original contributions presented in the study are included in the article/supplementary material; further inquiries can be directed to the corresponding author.
ZW, ZF, and CY designed the study. ZW, AM, CG, and TJ conducted the analysis and wrote the manuscript. ZW and ZF interpreted the results and revised the manuscript.
This research is funded by a grant from the State Key Laboratory of Resources and Environmental Information System and supported by the National Natural Science Foundation of China (Nos. 42201053, 41601091, and 41975183) and the Integrated Scientific Investigation of the North–South Transitional Zone of China (No. 2017FY100900).
The authors are thankful for the DEM data support from NASA. They also thank the reviewers for their comments and suggestions that improved this study.
The authors declare that the research was conducted in the absence of any commercial or financial relationships that could be construed as a potential conflict of interest.
All claims expressed in this article are solely those of the authors and do not necessarily represent those of their affiliated organizations, or those of the publisher, the editors, and the reviewers. Any product that may be evaluated in this article, or claim that may be made by its manufacturer, is not guaranteed or endorsed by the publisher.
Elsen, P. R., and Tingley, M. W. (2015). Global mountain topography and the fate of montane species under climate change. Nat. Clim. Chang. 5 (8), 772–776. doi:10.1038/nclimate2656
Fu, Z. J., Zhang, X. Y., Liu, S. Y., and Liu, T. M. (1996). A summary of the study on flora and vegetation in Qinling Mountains. Acta Bot. Boreali-Occidentalia Sin. (05), 93–106.
Grubb, J. P. (1971). Interpretation of the ‘massenerhebung’ effect on tropical mountains. Nature 229, 44–45. doi:10.1038/229044a0
Han, F., Yao, Y. H., Dai, S. B., Wang, C., Sun, R., Xu, J., et al. (2012). Mass elevation effect and its forcing on timberline altitude. J. Geogr. Sci. 22 (4), 609–616. doi:10.1007/s11442-012-0950-1
Han, F., Zhang, B-p., Zhao, F., Wan, L., Tan, J., and Liang, T. (2018). Characterizing the mass elevation effect across the Tibetan plateau. J. Mt. Sci. 15 (12), 2651–2665. doi:10.1007/s11629-018-4978-2
Han, F. (2011a). A study of the forcing of mass elevation effect on the pattern of mountain altitudinal belts [M]. Beijing: Graduate University of Chinese Academy of Sciences.
Holtmeier, F. K. (2009). Mountain timberlines ecology, patchiness, and dynamics. 2nd edn. New York: Springer-Verlag.
Hou, X. Y. (1981). Regularity of geographical distribution of vegetation in China. Acta Bot. Boreali-Occidentalia Sin. 1 (2), 1.
Tian, H., Zhang, J., Zhu, L., Qin, J., Liu, M., Shi, J., et al. (2022). Revealing the scale- and location-specific relationship between soil organic carbon and environmental factors in China’s north-south transition zone. Geoderma 409, 115600. doi:10.1016/j.geoderma.2021.115600
Lan, X., Li, W., Tang, J., Shakoor, A., Zhao, F., and Fan, J. (2022). Spatiotemporal variation of climate of different flanks and elevations of the Qinling–Daba mountains in China during 1969–2018. Sci. Rep. 12, 6952. doi:10.1038/s41598-022-10819-3
Liu, H. X. (1981). Vertical distribution law of mountain vegetation in China. Acta Geogr. Sin. 36 (3), 267.
Liu, J. J., Qin, F., Zhao, F., and Cao, Y. P. (2018). Extraction and distribution of mountain base elevation in the qinling-daba mountains. J. Geo-information Sci. 20 (10), 1457.. doi:10.12082/dqxxkx.2018.180227
Liu, K., Ma, N. X., Xu, Y. L., and Sun, G. N. (2004). Protection and construction of eco-environment in Qinling Mountainous area. Chin. J. Ecol. (03), 157.
Nie, Z. G. (2008). A study on the digital watershed water system building based on G rid DEM. [D]; Beijing Forestry University.
Shreve, F. (1922). Conditions indirectly affecting vertical distribution on desert mountains. Ecology 3 (4), 269–274. doi:10.2307/1929428
Xiao, F., Zhang, B. P., Ling, F., Xue, H. P., Du, G., Wu, H. Z., et al. (2008). DEM based auto-extraction of geomorphic units. Geogr. Res. (02), 459.. doi:10.11821/yj2008020023
Yao, Y. H., and Zhang, B. P. (2013). A preliminary study of the heating effect of the Tibetan plateau. PLoS ONE 8 (7), e68750. doi:10.1371/journal.pone.0068750
Yao, Y. H., and Zhang, B. P. (2012). MODIS-based air temperature estimation in the southeastern Tibetan Plateau and neighboring areas. J. Geogr. Sci. 22 (1), 152–166. doi:10.1007/s11442-012-0918-1
Yu, X. F. (1958). Physical geography of qinling mountains. J. South China Normal Univ. Nat. Sci. (01), 157.
Zhang, B., and Yao, Y. (2016). Implications of mass elevation effect for the altitudinal patterns of global ecology. J. Geogr. Sci. 26 (7), 871–877. doi:10.1007/s11442-016-1303-2
Zhang, S., Yao, Y. H., Pang, Y., Zhao, F., Qi, W., and Zhang, B. (2012). Mountain basal elevation extraction in the taiwan island. J. Geo-information Sci. 14 (05), 562–568. doi:10.3724/sp.j.1047.2012.00562
Zhang, W. J., Zhang, B. P., Zhu, W. B., Tang, X. L., Li, F. J., Liu, X. S., et al. (2021). Comprehensive assessment of MODIS-derived near-surface air temperature using wide elevation-spanned measurements in China. Sci. Total Environ. 800, 149535. doi:10.1016/j.scitotenv.2021.149535
Zhao, F., Zhang, B. P., Pang, Y., and Yao, Y. (2014). A study of the contribution of mass elevation effect to the altitudinal distribution of timberline in the Northern Hemisphere. J. Geogr. Sci. 24 (2), 226–236. doi:10.1007/s11442-014-1084-4
Zhao, F., Zhang, B. P., Zhu, L. Q., Yao, Y. H., Cui, Y. P., Liu, J. J., et al. (2019). Spectra structures of altitudinal belts and their significance for determining the boundary between warm temperate and subtropical zones in the Qinling-Daba Mountains. Acta Geogr. Sin. 74 (05), 889. doi:10.11821/dlxb201905004
Zhao, F., Zhang, B., Zhang, S., Qi, W. w., He, W. h., Wang, J., et al. (2015). Contribution of mass elevation effect to the altitudinal distribution of global treelines. J. Mt. Sci. 12 (2), 289–297. doi:10.1007/s11629-014-3223-x
Zhao, F., Lan, X., Li, W., Zhu, W., and Li, T. (2021). Influence of land use change on the surface albedo and climate change in the qinling-daba mountains. Sustainability 13 (18), 10153. doi:10.3390/su131810153
Zhu, F., Ning, Y., Chen, X., Zhao, Y., and Gang, Y. (2021). On removing potential redundant constraints for SVOR learning. Appl. Soft Comput. 102, 106941. doi:10.1016/j.asoc.2020.106941
Keywords: mass elevation effect, altitudinal zonality, mountain base elevation, mountain structure, Qinling-daba Mountains
Citation: Wenjie Z, Mengyang A, Guanhong C, Fang Z, Yong C and Jiale T (2022) The quantification of mountain base elevation based on mountain structure modeling. Front. Environ. Sci. 10:1030301. doi: 10.3389/fenvs.2022.1030301
Received: 28 August 2022; Accepted: 30 September 2022;
Published: 25 October 2022.
Edited by:
Xinyao Xie, Institute of Mountain Hazards and Environment Chinese Academy of Sciences (CAS), ChinaReviewed by:
Song Leng, Research Center for Eco-environmental Sciences Chinese Academy of Sciences (CAS), ChinaCopyright © 2022 Wenjie, Mengyang, Guanhong, Fang, Yong and Jiale. This is an open-access article distributed under the terms of the Creative Commons Attribution License (CC BY). The use, distribution or reproduction in other forums is permitted, provided the original author(s) and the copyright owner(s) are credited and that the original publication in this journal is cited, in accordance with accepted academic practice. No use, distribution or reproduction is permitted which does not comply with these terms.
*Correspondence: Zhao Fang, emhhb2Zhbmc4NEAxNjMuY29t
Disclaimer: All claims expressed in this article are solely those of the authors and do not necessarily represent those of their affiliated organizations, or those of the publisher, the editors and the reviewers. Any product that may be evaluated in this article or claim that may be made by its manufacturer is not guaranteed or endorsed by the publisher.
Research integrity at Frontiers
Learn more about the work of our research integrity team to safeguard the quality of each article we publish.