 Umer Khalil
 Iqra Imtiaz2
 Bilal Aslam
 Israr Ullah
 Aqil Tariq
94% of researchers rate our articles as excellent or good
Learn more about the work of our research integrity team to safeguard the quality of each article we publish.
Find out more
ORIGINAL RESEARCH article
Front. Environ. Sci., 16 September 2022
Sec. Environmental Informatics and Remote Sensing
Volume 10 - 2022 | https://doi.org/10.3389/fenvs.2022.1028373
This article is part of the Research TopicPhysics and Modelling of LandslidesView all 10 articles
Landslides are natural disasters deliberated as the most destructive among the others considered. Using the Muzaffarabad as a case study, this work compares the performance of three conventional Machine Learning (ML) techniques, namely Logistic Regression (LGR), Linear Regression (LR), Support Vector Machine (SVM), and two Multi-Criteria Decision Making (MCDM) techniques, namely Analytical Hierarchy Process (AHP) and Technique for Order of Preference by Similarity to Ideal Solution (TOPSIS) for the susceptibility mapping of landslides. Most of these techniques have been used in the region of Northern Pakistan before for the same purpose. However, this study for landslide susceptibility assessment compares the performance of various techniques and provides additional insights into the factors used by adopting multicollinearity analysis. Landslide-inducing factors considered in this research are lithology, slope, flow direction, fault lines, aspect, elevation, curvature, earthquakes, plan curvature, precipitation, profile curvature, Normalized Difference Water Index (NDWI), Normalized Difference Vegetation Index (NDVI), roads, and waterways. Results show that SVM performs better than LGR and LR among ML models. On the other hand, the performance of AHP was better than TOPSIS. All the models rank slope, precipitation, elevation, lithology, NDWI, and flow direction as the top three most imperative landslide-inducing factors. Results show 80% accuracy in Landslide Susceptibility Maps (LSMs) from ML techniques. The accuracy of the produced map from the AHP model is 80%, but for TOPSIS, it is less (78%). In disaster planning, the produced LSMs can significantly help the decision-makers, town planners, and local management take necessary measures to decrease the loss of life and assets.
Considerable life and economic losses, and harmful influences on communities, environment, and infrastructure, relentlessly disturbing land use and urban development are caused by landslides, which are common natural hazards (Shahabi and Hashim, 2015; Flentje and Chowdhury, 2018; Zhu et al., 2018; Bragagnolo et al., 2020). Due to the increasing deforestation rates, unrestrained urbanization, and rising population density, the dangers of landslides have grown (Flentje and Chowdhury, 2018; Froude and Petley, 2018; Bragagnolo et al., 2020). To reduce and manage disasters related to landslides, it is vital to appraise zones susceptible to landslides (Hong et al., 2016a; Chen et al., 2018b). A widespread assumption that future landslide locations are linked to past and present landslides is based on all the prediction-related studies involving different techniques (Capitani et al., 2013). In other words, the failures of slopes are ascertained by a specified set of regulating factors, and impending failures are anticipated to happen under identical circumstances.
Landslides usually occur in those areas where few factors, such as mountains, steep slopes, higher precipitations, and higher seismicity, are substantially found (Hong et al., 2016a; Chen et al., 2018b; Maqsoom et al., 2021; Aslam et al., 2022). Mapping of landslide susceptibility is also of eminent value for land use planning and facilitates planners in making potential development-related decisions (Erener et al., 2016; Bragagnolo et al., 2020; Aslam et al., 2022). Consequently, in current times, appraising different models for landslide susceptibility has become a key research topic globally.
Formerly many studies have used several methods aiming at the susceptibility mapping of landslides in different regions of the world. These different methods can be largely categorized as Qualitative and Quantitative methods. Different researchers extensively utilized qualitative methods until the late 1970s. Qualitative techniques weigh each landslide-causing factor based on researchers’ expertise. These methods have been utilized broadly to evaluate landslide susceptible areas (Yoshimatsu and Abe, 2006; Abella and Van Westen, 2007) and are considered subjective in nature (Fall et al., 2006). Quantitative techniques, which have been developed and used frequently in recent years, comprise approaches to evaluate the associations among causes of landslides based on probabilistic models (Raghuvanshi et al., 2014). They are considered objective in nature (Girma et al., 2015). The development of computer and Geographic Information System (GIS) technology has assisted in the application of these approaches, and they have become prevalent in recent times (Shano et al., 2020).
Additionally, methods to map landslide susceptibility can be classified into four groups, namely statistical, physical-based, heuristic, and data-driven or Machine Learning (ML) methods (Chen et al., 2018b; Zhang et al., 2018). Statistical methods are used to choose and examine landslide-causing factors in areas with environmental situations like those where past landslides have been reported. Statistical methods such as the Weight of Evidence (Baeza et al., 2010; Tsangaratos et al., 2017), the Certainty Factors (Devkota et al., 2013; Azareh et al., 2019), the Frequency Ratio (Youssef et al., 2015; Chen et al., 2016a), the Analytical Hierarchy Process (AHP) (Pourghasemi et al., 2012; Shahabi et al., 2014; Kanwal et al., 2017), the Evidential Belief Function (Chen et al., 2019a), and the Technique for Order of Preference by Similarity to Ideal Solution (TOPSIS) (Najafabadi et al., 2016; Razavi and Shirani, 2019), are easy to manage and simple to comprehend and therefore have been used frequently for mapping landslide susceptibility in different areas of the world. The physical-based models handle complex parameters effectively, but these parameters can only be established by executing problematic experiments to apply to larger areas (Pradhan and Kim, 2016; Bui et al., 2017). Heuristic approaches are used by geomorphologists to examine aerial photographs or to perform site surveys. Heuristic models are usually indelicately scaled (Ruff and Czurda, 2008).
Due to the enhancement of GIS technology and easier access to land surface remote sensing images and digital earth surface elevation models, data-driven or ML models are extensively applied in landslide susceptibility mapping. The most frequently used models include the Multivariate Adaptive Regression Spline (Wang et al., 2015), the Naïve Bayes Tree (Tsangaratos and Ilia, 2016), the Adaptive Neuro-Fuzzy Inference System (Chen et al., 2019b), Random Forests (Hong et al., 2016b), Kernel Logistic Regression (Bui et al., 2016), Artificial Neural Networks (Pradhan and Lee, 2010; Pham et al., 2016b; Wang et al., 2016), Logistic Regression (LGR) (Süzen and Kaya, 2012; Umar et al., 2014; Trigila et al., 2015), Decision Trees (Saito et al., 2009; Pradhan, 2013), Support Vector Machine (SVM) (Yao et al., 2008; Marjanović et al., 2011; Xu et al., 2012; San, 2014; Pham et al., 2016b; Shirzadi et al., 2017; Pawluszek et al., 2018), and Linear regression (LR) (Onagh et al., 2012a; 2012b). Analysis of the literature reveals that every model has its benefits and limitations conditional on the characteristics of the study area and the variation of used datasets. The behavior also fluctuates accordingly among different models. Therefore, comparisons among different models are highly desired to assess landslide susceptibility.
Muzaffarabad district, situated in the state of Azad Jammu and Kashmir and falls in the lower Himalayas of Northern Pakistan, is encompassed geologically by Hazara–Kashmir Syntax. The main boundary thrust (MBT) and Bagh-Balakot and Fault, recognized for tectonic uplift and crustal deformation, dissect this region (Kazmi and Jan, 1997; Saba et al., 2010). In Muzaffarabad city and the areas around the city, the 2005 earthquake disrupted several slopes and prompted 158 landslides (Kamp et al., 2008; Khan et al., 2011). Previously, the region has been subjected to numerous earthquakes of various extents (Rossetto and Peiris, 2009). In the future, there is a chance for a high-magnitude earthquake (Wallace et al., 2005; Raghukanth, 2008). Therefore, for activating the landslides in this region, rainfalls and earthquakes are regarded as the two major contributory processes (Owen et al., 2008).
There have been a few studies targeting this region in the past concerning the mapping of landslides. Most of the studies are confined to the landslides that resulted from the 2005 earthquake, or they just targeted the 2005 earthquake region. Moreover, most of these studies have used conventional statistical or decision-making methods to map landslide susceptibility. For example, Kamp et al. (2008) conducted a study for mapping landslide susceptibility in the 2005 earthquake region using a GIS-based multi-criteria evaluation method by exploiting eight landslide triggering factors. A few other studies that involved the assessment of landslide hazards targeting the same area are Owen et al. (2008); Khattak et al. (2010); Saba et al. (2010). Therefore the present study tried to fill the research gap by using conventional decision-making techniques and compared them with the most prevalent ML techniques.
The current research aims to present the landslide susceptibility analysis of the Muzaffarabad district using Multi-Criteria Decision Making (MCDM) and Machine Learning (ML) techniques. The methods used involves two MCDM techniques, AHP and TOPSIS, and three ML techniques, explicitly LGR, LR, and SVM. The purpose of using these various techniques is to assess the performance of each technique for the designated area. So far, several studies have been carried out using a single or two techniques, and no comparative studies have been carried out using five techniques in the targeted area. Also, this study used a set of multiple datasets derived from the latest available data; hence it provides the latest landslide susceptibility mapping. Ultimately, this research provides novel Landslide Susceptibility Maps (LSMs) and identifies the results to see how much aerial overlap between the models by susceptibility type. How much do these models geographically agree? Do these areas overlap at all?
Muzaffarabad district is situated in the Pakistan-administered territory of Azad Jammu and Kashmir. The district has a very hilly terrain and is located on the banks of the Neelum and Jhelum rivers. Muzaffarabad is the capital city of the state of Azad Jammu and Kashmir having geographical coordinates as 34° 21ʹ 30ʹʹ N and 73° 28ʹ 20ʹʹ E and covers an area of 20665 m2. The Mansehra and Abbottabad district of Khyber Pakhtunkhwa bounds the district on the Western side, the Baramullah and Kupwara districts of the Indian-administered Jammu and Kashmir are on the East, and the North and South sides face the Neelum and Bagh Districts of Azad Kashmir. The district of Muzaffarabad geologically lies in the lower Himalayan region of Pakistan. The district is well known for its deadliest 7.5 magnitude earthquake in 2005, killing more than 80000 people (Kamp et al., 2008; Owen et al., 2008; Saba et al., 2010). The climate of the district varies considerably.
December, January, and February happen to be cold months. While June, July, and August are relatively warmer. The mean maximum and minimum temperatures during January are 16°C and 3°C, respectively, and the mean maximum and minimum temperature during July are about 35°C and 23°C, respectively. The annual average high and low temperatures are 22.3°C and 11.1°C, respectively. The average annual precipitation of the district is 1,242.8 mm. During the monsoon spell from June to September, the region receives the highest amount of precipitation as in the rest of the months. July is the wettest, with an average precipitation of 328.7 mm, followed by August, which has an average of 229.9 mm. The region receives slight rainfall from October to December, with the lowest average observed in November (37.2 mm). The Muzaffarabad region has experienced plenty of landslides yearly, especially after the Kashmir 2005 earthquake, especially during the rainy monsoon season in July and August (Kamp et al., 2008; Owen et al., 2008; Khattak et al., 2010). Thus, taking immediate and effective measures to counter landslide happenings is imperative. Therefore, this study tried to focus on assessing landslide susceptibility in the area, thus, paving the way for policymakers to take precautionary measures to alleviate the destruction caused by landslides (Figure 1).
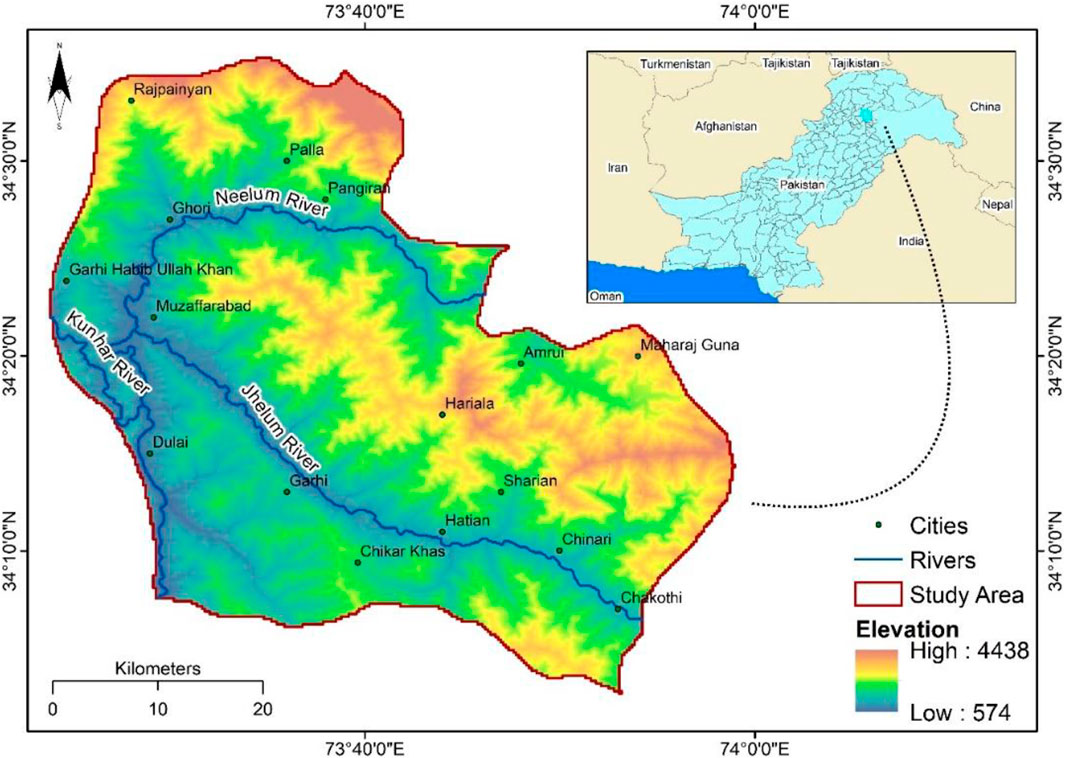
FIGURE 1. Map of the study area showing the elevation and the rivers of the area.
Because of the development and the complex nature of landslides, there is no explicit agreement on their exact origins (Hong et al., 2016a; Bui et al., 2016). However, several conditioning factors, such as geological and topographical, besides climatic conditions, and their association with landslides have been studied by many scientists in the past (Hong et al., 2017). Anthropogenic activities also greatly influence the geological environment (Yang et al., 2017). Consequently, established on former landslide susceptibility investigations (Saha et al., 2005; Owen et al., 2008; Khattak et al., 2010; Saba et al., 2010; Pourghasemi et al., 2012; Kanwal et al., 2017; Ali et al., 2019) and examination of the features of the Muzaffarabad region (Kamp et al., 2008; Owen et al., 2008; Khan et al., 2019), 15 landslide inducing factors including slope, aspect, elevation, lithology, curvature, plan curvature, profile curvature, flow direction, fault lines, precipitation, Normalized Difference Water Index (NDWI), Normalized Difference Vegetation Index (NDVI), distance from roads, earthquake, and distance from waterways were considered in this study.
In this study, the ASTER DEM with 30 m × 30 m resolution was used. Six geomorphometric factors, like curvature, slope, aspect, plan curvature, profile curvature, and elevation, were extracted using the DEM. The factors of NDVI and NDWI were extracted from Landsat 8 images with a spatial resolution of 30 × 30 m. Landsat 8 images were downloaded from https://earthexplorer.usgs.gov/(June 2022). NDVI was calculated using infrared (IR) and red (R) bands with the help of the following formula (Hong et al., 2016a; Chen et al., 2018b):
NDWI was derived from green (G) and near-infrared (NIR) channels. NDWI was calculated using the formula (Xu, 2006):
Geological maps of Pakistan, at a scale of 1:2,000,000, were used to produce the thematic maps of faults, earthquakes, and lithology, and fault distance was calculated using proximity analysis (Pavelsky and Smith, 2008). Pakistan Meteorological Department (PMD) station data was used to construct the precipitation map. The precipitation from the available data was calculated using the following formula (Arnoldus, 1980):
Where p is the average yearly rainfall while pi represents average monthly rainfall. The annual precipitation was used to calculate rainfall erosivity in this research. The reason for using rainfall erosivity instead of direct rainfall was because rainfall erosivity highlights the area which may be affected the most due to rainfall. Topographic maps of Pakistan were used for the thematic maps of distance to roads and distance to the waterway.
The standardization and normalization of all the factors were done. All the maps of landslide trigging factors were transformed into raster format with a resolution of 30 m × 30 m Lastly, all the rasterized maps were reclassified based on the level of susceptibility for inducing landslides into five categories. To each category, a value was assigned, such as very high influence was ranked as 5, the high influence was ranked as 4, the medium influence was ranked as 3, the low influence was ranked as 2, and very low influence was ranked as 1. For categorical data like lithology, the reclassification was still based on the rating of 1–5 in such a way that every class was assigned a score based on their influence. Since all the factors were reclassified into 1 to 5 classes, the weights were obtained for each factor from the methods multiplied by its subclass weight to get the total landslide susceptibility score to produce the LSMs.
The formulation of the aerial distribution of present landslide areas is the primary phase in landslide susceptibility mapping (Cevik and Topal, 2003). For probabilistic analysis of landslide susceptibility, precise recognition of the landslide’s locality is very significant. To find the landslide distribution over the area and to produce a statistical database of landslides for the individual division of the landslide activating factors, a landslide inventory map was generated. Several researchers’ used satellite and aerial photographs to prepare the landslide inventory map (Pradhan et al., 2009; Pradhan, 2010; Choi et al., 2012; Umar et al., 2014). In the current study, the past landslide areas (from 2000 to 2021) were marked using satellite data (Landsat), and historical records from official data of Pakistan. A similar methodology as of Aslam et al. (2022) was adopted for the inventory preparation.
To implement the ML techniques, both landslide and non-landslide locations are needed to produce the LSMs (Ballabio and Sterlacchini, 2012; Chen et al., 2017). Therefore, 606 past landslide locations (the center points of landslide polygons) were marked as “1,” and the same number of randomly sampled non-landslide locations was marked as “0”. Moreover, for the implementation of ML models, landslide inventory is split into testing and training datasets. The training dataset is used to build the model. The models examine the factors such as topographical, lithological, and hydrological from the training dataset. The testing data is used to validate the training of the model. This whole procedure, as a result, assists in proposing the weightage of individual factors. A total of 1212 datasets were used, which were randomly divided into the ratio of 2/3 and 1/3, which means 70% of the dataset was arbitrarily designated as training samples. The remaining 30% was used for testing purposes. The ratio of 70/30 is a generally accepted way of splitting data (Wang et al., 2016; Chen et al., 2018a; Wang et al., 2019).
For the specified objective various topographical, geomorphological, lithological, and hydrogeological factors were used, which were selected relying on the studies that were conducted formerly and the study area’s characteristics. Historical data, satellite images, and official data from the state departments were exercised to formulate a landslide conditioning factors database for the study area. The LR, SVM, and LGR models were constructed using the training dataset. R programming language was used for the implementation of ML techniques. The models were constructed using 10 cross folds to prevent over-fitting and reduce inconsistency. Tuning of models was done to increase the accuracy of models. The accuracy was calculated among the predicted and actual points in testing datasets for all three ML models. The weights of individual factors were the outcome of the ML models. The weights were also obtained from the two MCDM methods. These weights were then used to prepare the final LSMs in ArcGIS using weighted overlay analysis. The produced LSMs were reclassified into five susceptibility classes, i.e., very high, high, moderate, low, and very low. These classes were generated based on equal intervals for each class. This was done based on the field visit and considering the landslides from the past. A correlation was also computed between the LSMs and the historical landslide locations to check for the accuracies of LSMs. A comprehensive overview of the methodology is shown in Figure 2. The practiced methods are discussed as follows:
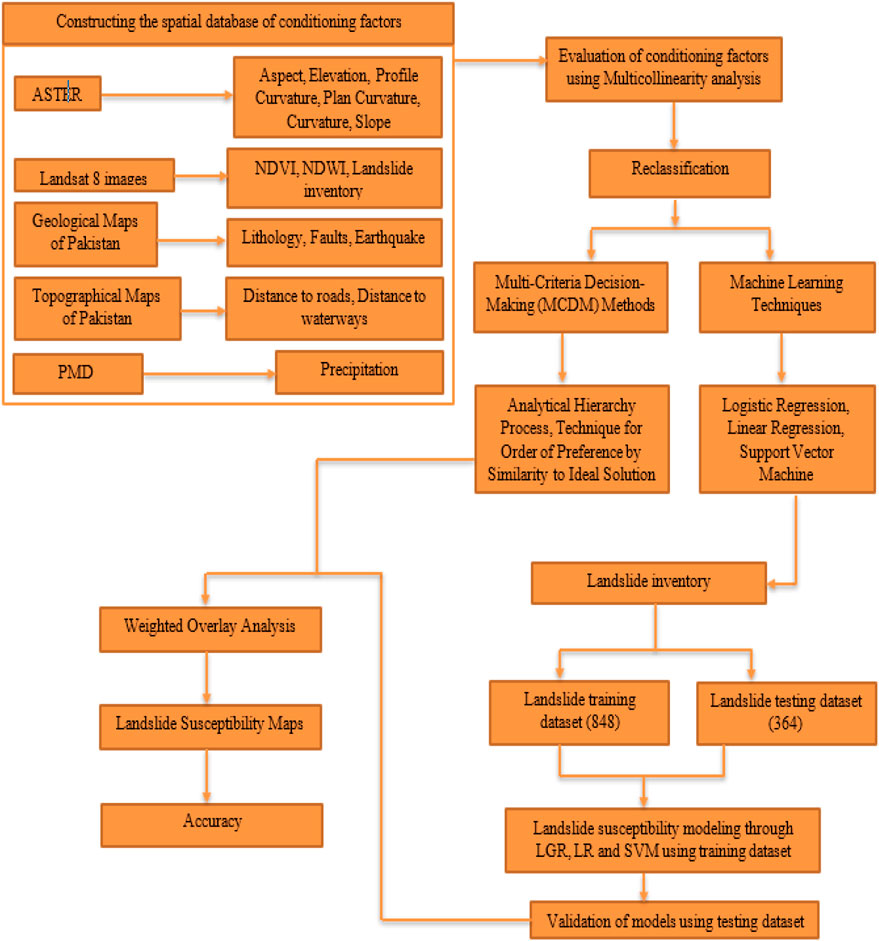
FIGURE 2. Methodology flow chart.
Multicollinearity analysis was used to evaluate the correlation among landslide conditioning factors. It is a statistical phenomenon in which a high-level relationship exists between two or more variables in a multiple regression model (O’brien, 2007). To detect multicollinearity among conditioning factors, the tolerance (TOL) and variance inflation factor (VIF) was utilized in this study. Let X = {X1, X2, …, XN} describe a given independent variable set and
The reciprocal of the VIF value gives the TOL value. The TOL value signifies the degree of linear correlation between independent variables. If the TOL value is less than 0.1 and the VIF value is greater than 10, the corresponding factors show multicollinearity and ought to be eliminated from further analysis (Wang et al., 2019).
The basic theory for SVM is the statistical learning theory (Cortes and Vapnik, 1995). The SVM reduces together model complications and the error test. SVM uses support vectors to define the margin of the hyperplane. The number of support vectors held from the first dataset is information subordinate. It differs, considering the information unpredictability caught by the information dimensionality and class distinguishableness. SVM used different kernel functions to map the data into higher dimensional space. The most popular kernel functions are linear, polynomial, radial, and sigmoid kernel functions. However, the present study used the radial basis function. The used kernel function is shown in Eq. 3 below:
Where, r is the bias term, d is the polynomial degree, and
It is a classification algorithm that assigns observations to a discrete set of classes using the logistic or sigmoid function to transform its output. Its concept is based on probability and predictive analysis algorithms. A relationship between some dependent factors and a categorical variable is clarified by this model, which might be categorical, binary, or continuous variables (Hong et al., 2016a). Using the algorithm has the advantage that there is no need for the normal distribution of variables (Pradhan and Lee, 2010). Binomial, multinomial, and ordinal are types of LGR. Independent variables that denote the landslide presence and absence in the LGR were designated as 1 and 0, respectively. The equation used for LGR is shown below (Hong et al., 2016a; Aslam et al., 2022):
where, Y is the dependent variable (landslide occurrence), b0 is the intercept, all the b’s are expectation of the target variable (weights), and all the x’s are the independent variables. This study used a sigmoid activation function.
It is a supervised ML algorithm with a constant slope and is used to predict a continuous output. It reveals how the changing standard deviation of predictors and independent variables changes the dependent variable. The used equation for LR is shown below (Onagh et al., 2012a; Aslam et al., 2022):
where, L is the occurrence of landslides, all the X’s represent the independent variables (factors), all the b’s represent the estimated coefficients (weights), and ϵ represents the model error. The used LR type in this study was multiple linear regression. The best fit line during the implementation of LR was computed using mean squared error.
AHP is an MCDM technique comprising a pair-wise assessment of numerous factors contributing towards a certain cause and establishing ranks of these factors. A pair-wise comparison matrix is developed as proposed by Saaty (1990) and Saaty and Vargas (2001) for estimating the weights of different factors for solving a problem. Another tempting attribute of the AHP is the aptitude to appraise pair-wise rating variation. It allows the pair-wise relative comparison between every factor, and afterward values from 1 to 9 are assigned based on the relative importance. The following steps are very important to execute AHP: 1) to break the composite problem into different parts; 2) to assemble the conditioning factors into hierarchic order; 3) to allocate the numerical values to evaluate the comparative significance of each conditioning factor; 4) to constitute a comparison matrix and provide weights to every factor (Saaty, 1990). The implementation of the AHP was adopted from Maqsoom et al. (2021).
Hwang and Yoon (1981) introduced TOPSIS, an MCDM technique that assesses the dilemma in an n × m matrix (m criteria and n alternatives). This method is founded on the notion that each designated factor must have the maximum detachment from the negative ideal (the least important factor) and the least detachment from the positive ideal (the most critical factor) (Lin and Wu, 2004). The basic principle of TOPSIS is that the decision would be the nearest to the best result and remotest from the non-ideal result. It assumes that each factor is uniformly increasing or decreasing, making it visually easy to locate the best and worst selection. Normalization is important because the factors are inconsistent in dimensions. After normalization, positive and negative ultimate results are measured. Then the detachment from the ultimate result is calculated. Lastly, the preference value is assigned to each factor (Rao and Davim, 2008; Krohling and Pacheco, 2015; Najafabadi et al., 2016; Razavi and Shirani, 2019). The implementation of the TOPSIS method was adopted from Najafabadi et al. (2016).
It is essential to evaluate the validity of the used models in landslide susceptibility analysis since they, without validation, lack scientific significance (Pradhan and Kim, 2016). The ML models were validated by calculating their accuracy using their confusion matrixes (Deng et al., 2016; Maria Navin and Pankaja, 2016). However, for checking the logical consistency in pair-wise comparisons, the AHP method integrates an operative practice. Consistency Ratio (CR) (Saaty, 1980) is a tool that articulates the compatibility of the matrix of paired comparisons of all the parameters involved. The CR value less than 0.1 indicates that the matrix outcomes are satisfactory (Saaty, 1980); otherwise, the judgments need to be reviewed. Moreover, a logical procedure was adopted for the performance assessment of the TOPSIS method. The relative closeness coefficient (cli+) to the ideal solution was calculated for each alternative. The best alternatives are those with higher values (Krohling and Pacheco, 2015; Najafabadi et al., 2016).
The importance of all the landslide conditioning factors was assessed utilizing the training set centered on multicollinearity analysis. The outcomes of the multicollinearity analysis of landslide conditioning factors are presented in Table 1. The factor of roads was found to have a VIF value that is considerably larger than the rest of the factors, but still, it is less than 10. None of the factors were found to have a VIF value larger than the threshold value of 10. Therefore, none of the factors was removed from the further processes.
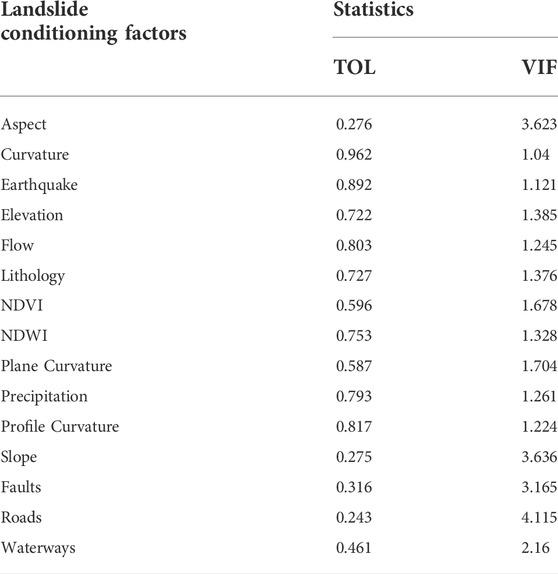
TABLE 1. Outcomes of Multicollinearity analysis.
The aspect was classified into Flat, North, Northeast, East, Southeast, South, Southwest, West, and Northwest (Figure 3A). Most of the exploratory area lies in the Northern and Southward orientations. The value of −0.0000001 is all the flat or no aspect pixels, 45 breaks between North and East, 135 breaks between East and South, 225 breaks between South and West, and 315 breaks between West and North. These orientations were reclassified into five categories to understand better the contribution level in triggering landslides. Based on the reclassification, the class intervals of −1 to −0.00000001 were weighted as 1, 0–45, and 315–360 equal to 2, 45–135 equivalent to 3, 135 to 225 equal to 4, and 225–315 equal to 5. Furthermore, the elevation was divided into five classes, from the lowest class of 575–1000 m to higher elevated areas of 1000–2000 m, 2000–3000 m, 3000–4000 m, and 4000–4438 m (Figure 3B). It can be observed that the Southwest area is low elevated while the Northeast has a higher elevation.
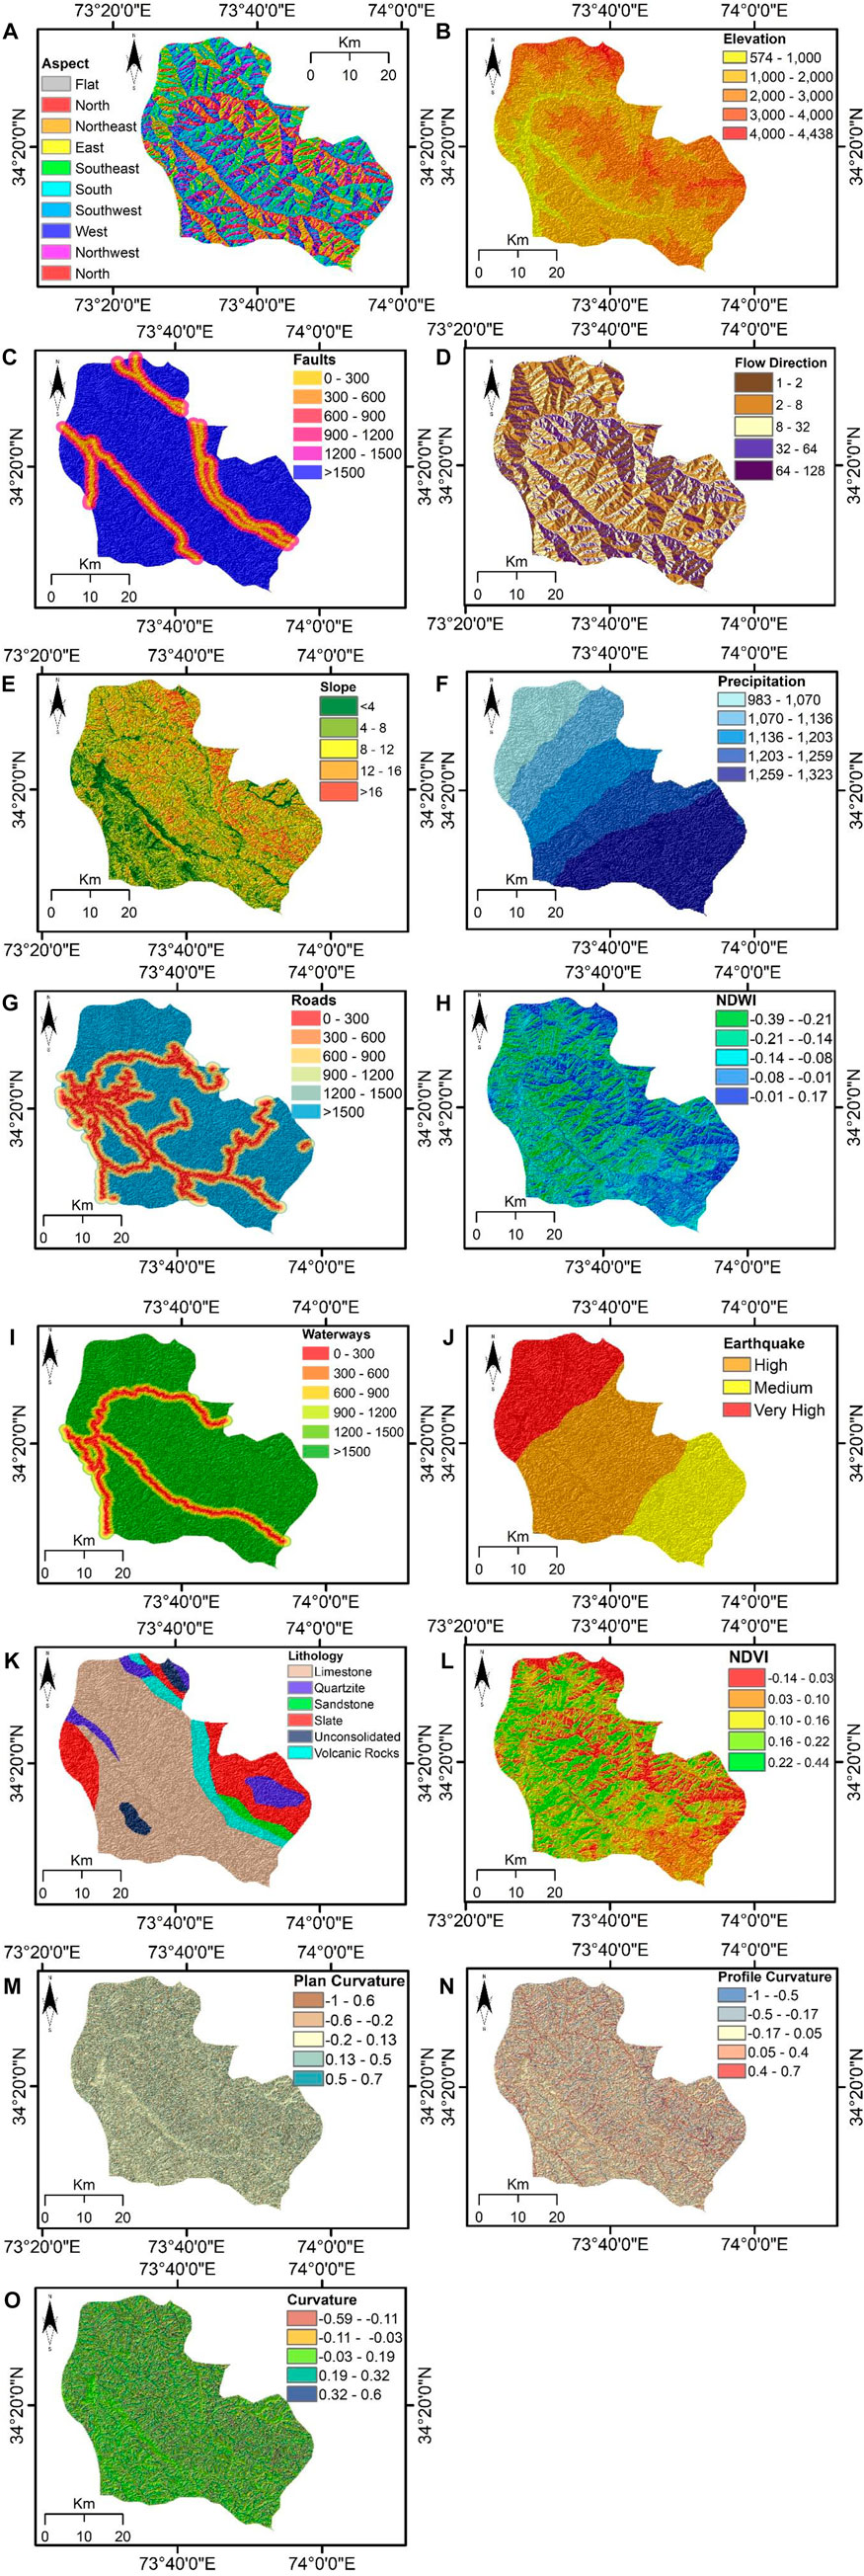
FIGURE 3. Input derived datasets: (A) aspects, (B) elevation, (C) faults, (D) flow direction, (E) slope, (F) precipitation, (G) roads, (H) NDWI, (I) waterways, (J) earthquake, (K) lithology, (L) NDVI, (M) plan curvature, (N) profile curvature, (O) curvature.
This region is seismically very active and has several faults in the region. Areas nearer to the fault lines have a higher potential for landslides, while as the remoteness from the fault line increases, the level of landslide susceptibility also decreases gradually. So, a buffer of 0–300 m was ranked as 5 since this region has a higher potential of landslide susceptibility while 300–600 m as 4, 600–900 m as 3, 900–1200 m as 2, 1200–1500, and >1500 m as 1 (Figure 3C). In addition to the faults, the flow direction is also among the key contributing factors in landslide susceptibility because it shows which direction the soil slush will flow. The higher the flow direction value, the higher the susceptibility potential, and vice versa. So based on this fact, it was divided into five categories depending on the possibility of susceptibility. 64–128 was ranked as 5 while 32–64 as 4, 8–32 as a 3, 2–8 as 2, and 1–2 as 1 (Figure 3D). The Northward flow has a higher susceptibility. In the considered study area, the flow is from North to South. Thus, more slopes are cut to Northward flow, resulting in higher landslide susceptibility.
The slope is also a foremost contributing factor in the landslide because steeper slope areas have a higher chance of rockfall than the gentle slope area. Hence five categories depending on the potential of susceptibility were established. >16
Soil moisture has a direct influence on soil compactness and rock strength. Higher soil moisture has the potential to cause landslides as compared to lesser moisture. Thus, the area with a higher NDWI value was ranked the highest (a rating of 5) and vice versa (Figure 3H). Like faults and roads, areas nearer to the water bodies have a higher potential for landslides. At the same time, as the distance increases from the water bodies, the level of susceptibility also decreases gradually. So, a buffer of 0–300 m was ranked as 5 while 300–600 m as 4, 600–900 m as 3, 900–1200 m as 2, and 1200–1500 and >1500 m as 1 (Figure 3I). Furthermore, earthquakes have a direct role in causing landslides, as landslides occur after ground shaking. The region is in a subduction zone where seismicity is very high. The Northern portion of the exploratory area lies in a highly high seismic zone. Since this region receives larger magnitude earthquakes hence this region was classified as very high (a rating of 5), high (a rating of 4), and medium only (a rating of 3) (Figure 3J).
A larger part of the study area comprises limestone, and other prominent lithologies are slate, volcanic rock, and quartzite (Figure 3K). Limestone and slate are an example of weak lithologies. Based on the strength, these lithologies were ranked from 1 to 5 during the reclassification. The positive NDVI value shows a high concentration of vegetation, while the negative value depicts no vegetation. High vegetation covers on the slope surface reduce soil erosion and slope failure. In contrast, no vegetation on the slope increases the chances of failure as it is exposed to the atmosphere. This logic was adopted during the reclassification process. The NDVI value for most of the study area is high, which is consistent with the high vegetation coverage observed for the mountainous area (Figure 3L).
The curvature value represents the morphology of topography. The curvature proposes information about the flow’s divergent or convergent and accelerated or deaccelerated character. The convexity (positive curvature) or concavity (negative curvature) of the earth’s surface greatly influences the soil’s moisture-holding capacity, which in turn affects the slope stability. This fact was based for the reclassification of different curvature types. For plan curvature, the concave surfaces are shown by the positive values, and the convex character of the surfaces is signified by the negative values (Figure 3M). However, for profile curvature, the negative curvature value relates to the concave slope, and the positive curvature value relates to the convex slope (Figure 3N). The research area is diversely dominated by convex, straight, and concave slopes. The convex slope is related to the positive curvature value, and the concave slope is associated with the negative curvature value (Figure 3O).
From Table 2, it can be perceived that a similar controlling element can have a varied influence according to distinct models. For the SVM model, flow direction, elevation, and precipitation have the highest contributions of 13%, 12%, and 12%. As per the SVM model, the remaining conditioning factors contribute less. For the LGR, LR, AHP, and TOPSIS models, the influences of the landslide controlling elements are very much alike. Flow direction, elevation, lithology, precipitation, and slope have extreme impacts based on these four models, but the effects of the remaining factors varied slightly.
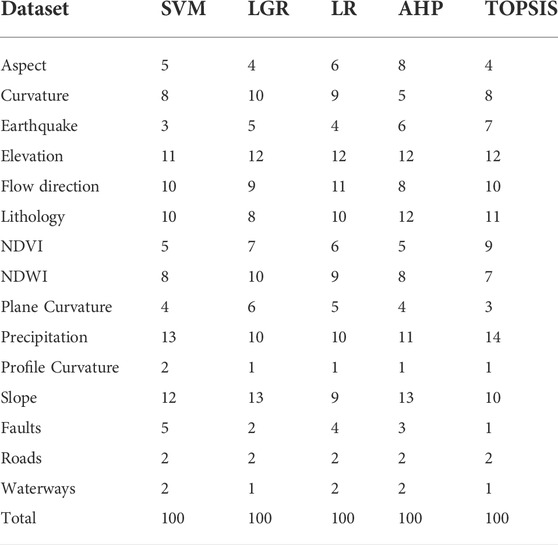
TABLE 2. Resulted weights of the contributing factors from different techniques.
The developed LSM (Figure 4) of the considered area after the application of the LGR model illustrates that an area of 4.04% is classed as very low and 22.87% as low susceptible zones, predominantly located on the Northeast side of the region. The moderate susceptible area covers 43.03% of the total area, and 23.32% of the total area is sorted as a high susceptible zone, as evident from Table 3. The very high susceptible area is 6.75%, and these zones are mainly located in the Southwest of the region. Whereas the LR model’s generated LSM (Figure 5A) shows that the very low susceptibility class encompasses 1.95%, and the low susceptibility class covers 16.73% of the considered area, which is less than the LGR model’s respective classes. 29.83% and 5.85% of the explorative area come under the high and very high susceptibility classes, respectively, and these zones are primarily located in the central and southwest parts of the area. An area of 45.64% falls in the moderate susceptibility class, which is slightly higher than the moderate class area of both other ML models, as can be seen from Table 3. SVM-based susceptibility map shows that 42.16% of the area is under moderate susceptibility (Figure 5B). It can be viewed from the SVM model generated LSM that the very high susceptibility class comprises 8.05% of the considered area, and it is more as compared to all other used models. The high and low susceptibility classes encompass 36.03% and 12.70% of the explorative area. The percentage of the research area that accounts for very low susceptibility is 1.06%, and it is the least percentage of area in this class than other models, as shown in Table 3. The zones in the extreme North of the region have the lowest susceptibility. The spatial distribution of the susceptible areas according to the ML models produced LSMs is somewhat the same, but it differs in proportions of area.
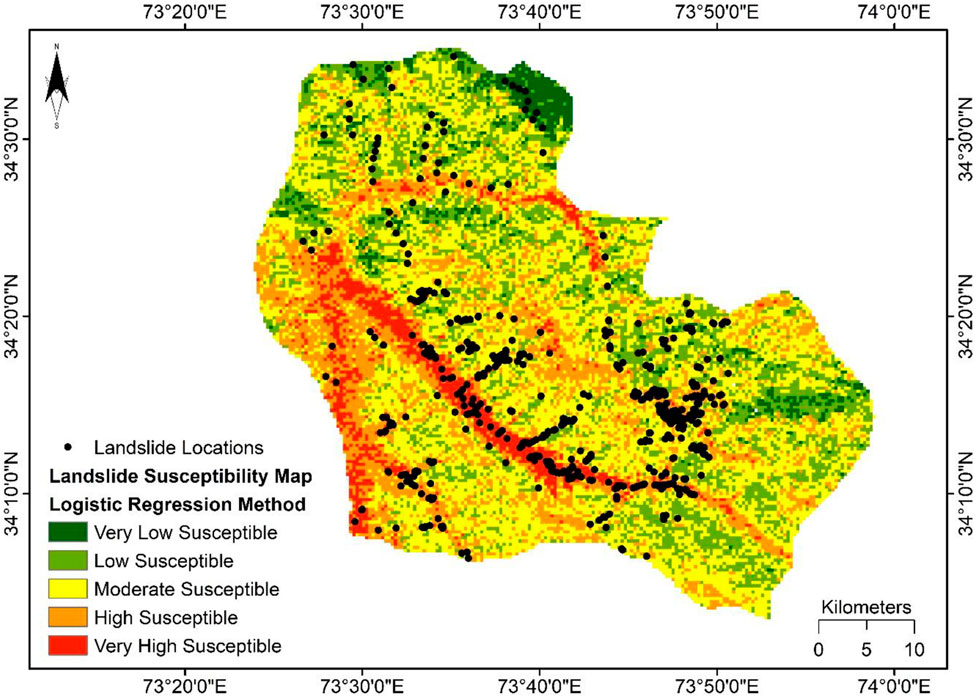
FIGURE 4. Landslide susceptibility derived from LGR.

TABLE 3. Division of different landslide susceptibility classes for different methods.
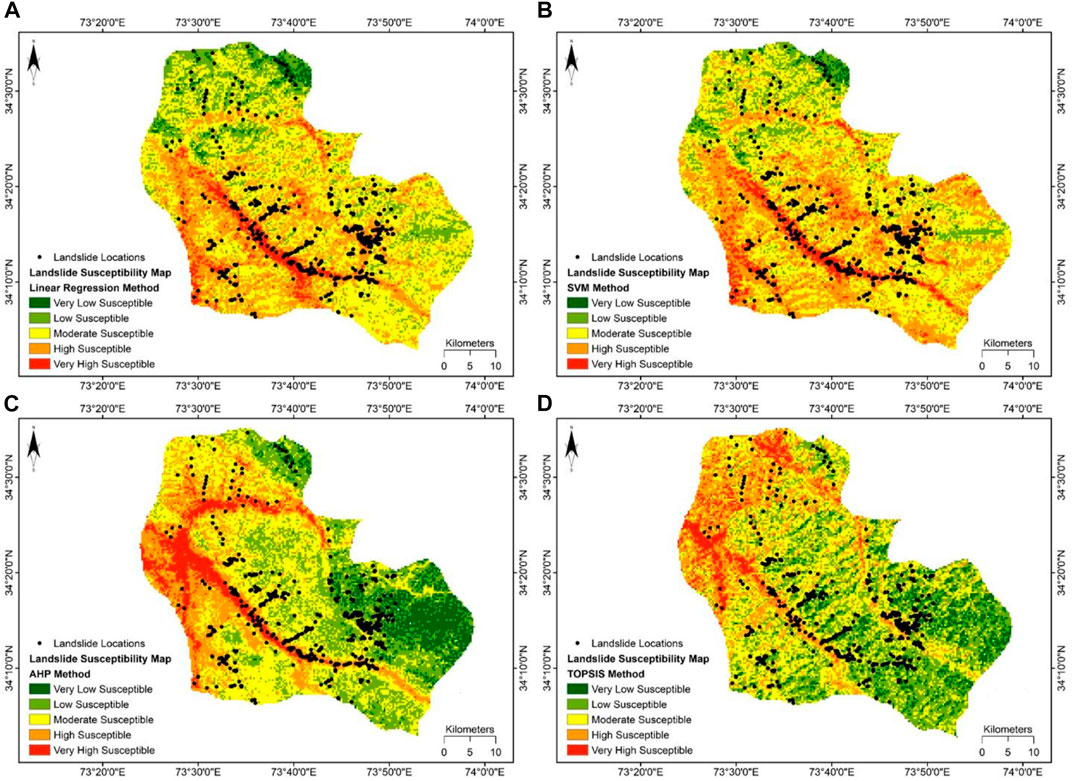
FIGURE 5. Landslide susceptibility maps derived from (A) LR (B) SVM (C) AHP and (D) TOPSIS.
The LSM (Figure 5C) generated by exercising the AHP technique illustrates that 9.16% of the area is very low, whereas 25.90% is under low susceptibility. These two classes are mainly concentrated on the Southeast side of the region, which is different from the results of ML models in which these two classes are majorly positioned in the extreme North. The moderate susceptibility class encompasses 36.48% of the deliberated area. Besides this, 20.69% of the research area accounts for the high susceptibility, and the very high susceptibility represents 7.78% of the total area. Both these classes are concentrated on the central and Northwest sides of the region. The pattern of susceptibility classes is comparatively different from the results of ML models. As portrayed in Table 3, the results of the AHP show that the percentage of the exploratory area subjected to high susceptibility is more than the results of the TOPSIS. The generated LSM (Figure 5D) by the TOPSIS technique also exhibits similar trends as the AHP method LSM. The very low susceptibility class represents 8.64% of the research area. The low and moderate susceptibility classes comprise 31.28% and 34.86% of the study area, respectively. Finally, 19.50% of the considered area comes under the high susceptibility class, and the portion of the investigative area falls into the very high susceptibility class is 5.71%.
In the current research, the obtained value of CR was less than 0.1, which validated the AHP technique. For TOPSIS technique, the values of cli + ranged from 0 to 1. An option with a score close to 1 was considered the best. For all three ML models, SVM, LGR, and LR, the accuracy was calculated using the predicted and actual results for the testing dataset. The higher accuracy value demonstrates that the model calculations are precise. The confusion matrixes used to calculate the accuracy of all three models are shown in Table 4.
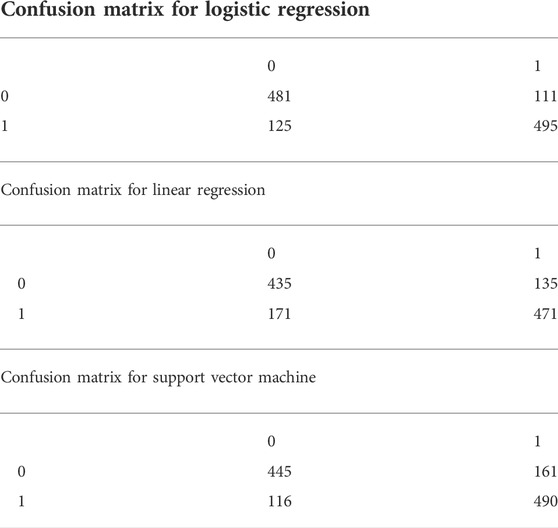
TABLE 4. Confusion matrixes for Machine Learning models.
The results of the LGR model showed that out of 1212 points, 481 non-landslide and 495 landslide points were accurately predicted. In comparison, 125 non-landslide and 111 landslide points are wrongly predicted by the model. As seen from Table 4, out of 1212 points, the LR model accurately predicted 435 non-landslide and 471 landslide points, while 135 non-landslide and 171 landslide points were wrongly predicted. The confusion matrix for the SVM model reveals that, out of 1212 points, the SVM model accurately predicted 445 non-landslide and 490 landslide points, while 161 non-landslide and 116 landslide points were wrongly predicted. The calculated accuracy of the models based on the confusion matrix is presented in Table 5. The accuracy of the SVM model (84%) is more than the remaining two models, followed by LGR with 80% and LR with 75% accuracy (Table 5).
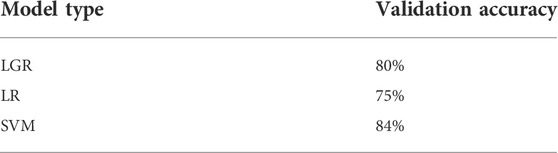
TABLE 5. Validation results of Machine Learning models.
The Muzaffarabad district of Azad Kashmir in Pakistan has been subjected to devastating landslides. There is a risk of future landslides due to the high precipitation levels, steeper slopes, high mountains composed of weaker lithology, etc. Therefore, it is vital to assess the landslide susceptibility of the region. In this study, for mapping the landslide susceptibility in the area, the landslide susceptibility maps (LSMs) were generated by exercising three ML techniques: SVM, LR, and LGR, besides two MCDM techniques: TOPSIS and AHP. Based on the literature review and the geographical setting of the area, 15 influencing factors were selected for mapping the landslide susceptibility.
Insights into the relative importance of inducing factors as a landslide susceptibility indicator are essential. Table 2 shows that all the models have marked slope and elevation as the most significantly impacting factors on landslide occurrence, followed by lithology, precipitation, flow direction, and NDWI. The elevation of an area controls the profile curvature, slope angle, and aspect of a geographical area. Thus, it is an important parameter. Slope plays an essential role in initiating landslides. Therefore, it is used frequently to prepare LSMs (Lee, 2005; Saha et al., 2005; Pourghasemi et al., 2012). According to the produced LSMs, landslide susceptible regions are majorly those with elevations ranging from 575 to 2000 m and steep slopes.
Precipitation is a crucial landslide triggering factor, and this region receives a significant amount of precipitation over a year, varying from an average of 983–1323 mm at different places. Precipitation triggers unexpected floods, which also produce shallow landslides. Water infiltrates rapidly into the soil due to higher levels of precipitation and thus increases the degree of saturation of the soil (Mandal and Mandal, 2018). Saturated soil has the potential to slide easily. NDWI is the amount of moisture in the soil which has a more significant role in initiating landslides. Soil water content disturbs soil cohesion and thus changes the shear strength of the soil (Del Gaudio et al., 2013; von Ruette et al., 2013). When the moisture increases, the material composition of the slope becomes loose, and the risk of slipping increases.
Lithology offers material support for the incident of landslides and forms the foundation of landslide development. Many studies have considered lithological features as an influencing factor for landslide susceptibility mapping (Pourghasemi et al., 2012; Chen et al., 2016b; Wang et al., 2016). The weaker lithologies are responsible for causing landslides because they do not possess enough strength to withstand the higher precipitations and can easily slip away. The pondered area in this research receives a considerable amount of rainfall, and most of the landslides that have occurred were positioned near the rivers and were debris flow (Saba et al., 2010). The Jhelum river drains the study area and its two tributaries, the Neelum and Kunhar rivers. These rivers flow North to the West, developing profound antecedent valleys before gushing Southwards alongside wider ones valleys to the Indo-Gangetic Plain (Kamp et al., 2008). The flow of the rivers is very swift owing to the area’s topography, thus cutting the slopes and causing debris flow while flowing from North to South. This makes the flow direction a critical factor for mapping landslide susceptibility. All these factors are related, and their combined effect can cause landslides in areas where they are present.
For every produced map as an application of the five methods, it can be seen that for landslide susceptibility, the categorized five classes vary in their percentages and locations in the area (Figures 4, 5). Overall, the spatial distribution of landslide susceptibility zones reveals vital training data selection. Table 3 displays the comprehensive outcomes of all the practiced models in statistical form. The accuracy of the produced LSMs was assessed using the data of previous landslide locations. The established data of landslide locations were compared with the LSMs for performing the accuracy assessment. The results disclosed acceptable conformity amid the LSMs and the previously present data on landslide positions, as evident from Table 6. For the landslide susceptibility mapping, the SVM model based LSM outperformed the other models. The SVM model based LSM accomplished the maximum implementation accuracy, which is 87%, followed by the LR model (83%), AHP (80%), LGR model (79%), and lastly, TOPSIS (78%).
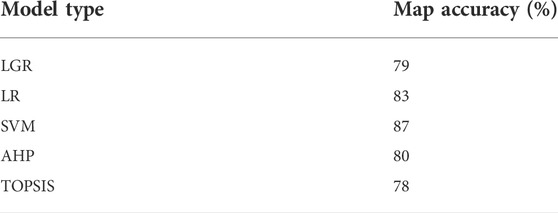
TABLE 6. Accuracy assessment of produced landslide susceptibility maps.
In general, the performance of ML techniques was better than the performance of MCDM techniques. The results are quite like the results of different studies carried out previously in different parts of the world using a range of ML and MCDM models. For mapping landslide susceptibility at the Haraz watershed, Iran Pourghasemi et al. (2012) applied two MCDM techniques, Fuzzy Logic, and AHP, and evaluated the performance of both models. The results showed that the Fuzzy Logic model, with an accuracy of 89.7%, performed better than AHP, which showed an accuracy of 81.1%. The results of both MCDM techniques are considerably different in the mentioned study. But in the present case, there is a marginal difference between the two practiced MCDM techniques. This can be due to conditioning factors, as the study area’s geographic location controls them. Erener et al. (2016) used the GIS-based MCDM method (AHP), Association Rule Mining (ARM), and LGR to carry out a comparative study for landslide susceptibility mapping for Şavşat in Artvin Province (NE Turkey). The authors found that ARM and LGR methods are more accurate than GIS-based MCDM for landslide susceptibility mapping. These results are as per the results of this study. In the present study, the LGR model also performs better than AHP. Razavi and Shirani (2019) used Frequency Ratio (FR), entropy methods, and an MCDM method (TOPSIS) for landslide hazard zoning for the Fahliyan basin, Fars. The results exhibited that the statistical methods entropy (91%) and FR (87.7%) have better accuracy than TOPSIS (84%). In the current analysis the accuracy of TOPSIS also turns out to be the least as compared to the other models.
In another study by Tsangaratos and Ilia (2016), a comparison between the performances of NB and LGR was made for the landslide susceptibility mapping in Greece, and the validation results showed an accuracy for NB at 82.61% and LGR at 87.50%. The study conducted by Pham et al. (2016a) for the evaluation of the performance of five ML methods SVM, LGR, NB, Fisher’s Linear Discriminant Analysis (FLDA), and Bayesian Network (BN) applied for landslide susceptibility assessment demonstrated that SVM has the highest accuracy compared to the other methods. Goetz et al. (2015) used multiple statistical and ML techniques for the landslide hazard mapping of the province of Lower Austria. They used LGR, SVM, WOE, RF, Bootstrap Aggregated Classification Trees (bundling) with Penalized Discriminant Analysis (BPLDA) and Generalized Additive Model (GAM) method. The authors found that all methods gave similar accuracy and results, but the BPLDA, WOE, and RF had marginally better accuracy.
In these previously mentioned two studies, SVM performed better in one, but in the other study, the accuracy of SVM was marginally less. So, it can be concluded that the performance varies from location to location and depends on the conditioning factors. The results of previous studies also show that the ML techniques perform better than the MCDM techniques. Thus, indicating that the generated results of this study are acceptable. Even though the employed models in this research produced reasonable results; however, it must be perceived that the landslide position statistics, that is, the landslide inventory map, directly affect the reliability of the results.
An essential aspect of data-driven methods is that they are most prevailing for landslide susceptibility mapping since they contain less subjectivity. The accuracy of the SVM can be affected by the training sample selection, indicated by the fact that the best hyperplane is fitted by the SVM model that can detach non-landslides from landslides efficiently, even though specific complexity could come across for non-detachable landslide factors in fitting the hyperplane (Ballabio and Sterlacchini, 2012; Bui et al., 2016). High-dimensional data does not affect the workability of SVM, which means that it can handle the high number of landslide conditioning factors (Mountrakis et al., 2011; Kavzoglu et al., 2014). SVM accuracy is less affected by categorical influences, for instance, lithology and land use. The purpose is that the number of designated landslides might not differ among different classes when deciding on different landslide training data subsets. However, more effects can be witnessed in continuous elements such as slope and altitude as the values differ relentlessly.
In contrast, for training data selection, the LGR model was observed to be less complex. To the landslide inventory data, the LGR model strives to fit a linear location and might usually place the landslide sites among classes as high and very high susceptibility. It was determined that the LGR model undoubtedly highlights the interrelation present between the occurrence of landslides and instability factors. Besides the SVM and LGR, the LR method has been used due to the ease of data attainment and examination and less time consumption.
TOPSIS and AHP are the most rational and extensively used among all the MCDM methods (Rao and Davim, 2008; Achour et al., 2017; RAZAVI and Shirani, 2019; Bahrami et al., 2020; Maqsoom et al., 2021). An optimal result can be produced by their combination, provided that the strengths of one model can offset the weaknesses of another model (Rao and Davim, 2008). Unfortunately, TOPSIS is unreliable in its valuation of decisions and lacks weights, according to the stated purpose, to determine the relative importance of different indicators; this technique requires a workable procedure. The AHP method also delivers such a practice (Rao and Davim, 2008). A rating system based on expert opinion is used for the conventional AHP model. In fact, for solving composite problems like landslides, expert opinion is very beneficial. However, to some extent, views may be imperiled by cognitive restrictions with partiality and vagueness. They may vary for every individual expert. Therefore, the analysis of spatial relationships is important amongst landslide locations and the landslide activating factors. Though the AHP technique is primarily centered on professional judgment, it is supposed that the choice of landslide activating factors based on landslide incidences can neutralize the partiality perception in this technique (Achour et al., 2017; Maqsoom et al., 2021).
A detailed comparison of the results in terms of area under different susceptibility classes, as shown by the susceptibility maps, is provided in Figure 6. In contrast with all the other methods, the LR model’s generated LSM shows that the maximum area is in the moderate susceptibility class (>9000 m2). The SVM model outcomes show that the least area is under the very low susceptibility class compared to the other models. The representation shows that the area under low susceptibility is higher for the TOPSIS model (>6000 m2) than the area of other models. However, the area under the high and very high susceptibility class of SVM is considerably higher than the results of TOPSIS and AHP. The overall results of the models indicate that primarily the investigative area has moderate landslide susceptibility, which comprises approximately 40% of the considered area.
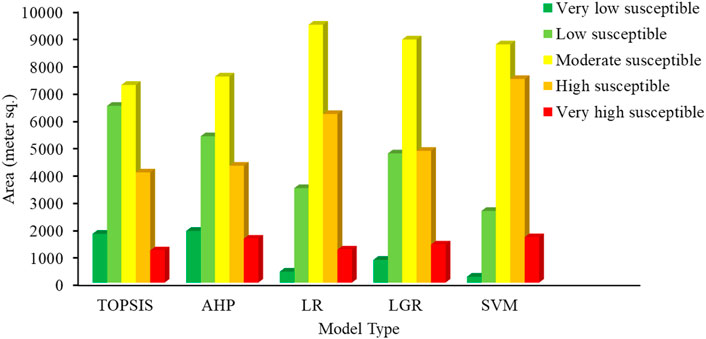
FIGURE 6. Landslide susceptibility class division in terms of area for different methods.
All the LSMs (Figures 4, 5) show that the high and very high susceptibility classes are in the lower elevation areas, including the floodplains of the main rivers. This is because most of the landslides in the study area occur along the rivers and are debris flows. Due to this, the models have predicted high susceptibility in the lower elevation areas, including the floodplains of main rivers. Moreover, the practiced models in this research have computed very low or low susceptibility in the Northern region with a cluster of landslide points. This shows the limitation of the practiced conventional ML and MCDM techniques. Therefore, it is suggested that future researchers should practice contemporary deep learning techniques the evaluate the landslide potential in this study area.
There are several advised practices for landslide susceptibility mapping. However, in this study, to assess the landslide susceptibility of the Muzaffarabad district, a comparison was made between the results of three ML techniques, LGR, LR, and SVM, and the results of two MCDM techniques, TOPSIS and AHP. Based on the landslide’s physical mechanics in the study area and other related knowledge, selected slope, profile curvature, aspect, plan curvature, elevation, lithology, curvature, flow direction, fault lines, precipitation, NDWI, NDVI, distance from roads, earthquake, and distance from waterways as landslides inducing factors for this study. A total of 1212 data points, 606 landslide locations, and 606 randomly selected non-landslide locations were used for the analysis. 70% of the data was used as training and 30% as testing data. The training data was used to train the ML models, and the testing data was used for checking the validity of trained SVM, LGR, and LR models. All the methods ranked slope, precipitation, elevation, flow direction, and lithology as the most critical landslide-inducing factors, but the assigned weights differed. The accuracy assessment of produced maps showed that the performance of all the methods was relatively decent. Still, the accuracy of the SVM model-produced map was somewhat higher (85%), followed by LR (83%), AHP (80%), LGR (79%), and TOPSIS (78%). By offering the LSMs, this study provides a baseline for decision-makers for effective countermeasures that can be practiced for the study areas’ susceptible zones, including drainage measures, revetments, stabilizing piles, anchor bolts, and long-term monitoring. This can, as a result, help reduce the loss of life and property in diverse situations.
The raw data supporting the conclusions of this article will be made available by the authors, without undue reservation.
Conceptualization, UK and BA; methodology, UK, II, and BA; software, II, IU, and BA; validation, UK, IU, and BA; formal analysis, AT; investigation, II and AT; resources, II, BA, and IU; data curation, BA and IU; writing—original draft preparation, UK and BA; writing—review and editing, UK, BA, IU, and AT; visualization, II and AT; supervision, AT and SQ; project administration, AT and SQ; funding acquisition, SQ. All authors have read and agreed to the published version of the manuscript.
The research is financially supported by the National Key Research and Development Program of China (2021YFC3200301), National Natural Science Foundation of China Youth Fund (52209068), Postdoctoral Research Foundation of China (2020M682477), and the Fundamental Research Funds for the Central Universities (2042021kf0053).
The authors declare that the research was conducted in the absence of any commercial or financial relationships that could be construed as a potential conflict of interest.
All claims expressed in this article are solely those of the authors and do not necessarily represent those of their affiliated organizations, or those of the publisher, the editors and the reviewers. Any product that may be evaluated in this article, or claim that may be made by its manufacturer, is not guaranteed or endorsed by the publisher.
Abella, E. C., and Van Westen, C. (2007). Generation of a landslide risk index map for cuba using spatial multi-criteria evaluation. Landslides 4 (4), 311–325. doi:10.1007/s10346-007-0087-y
Achour, Y., Boumezbeur, A., Hadji, R., Chouabbi, A., Cavaleiro, V., and Bendaoud, E. A. (2017). Landslide susceptibility mapping using analytic hierarchy process and information value methods along a highway road section in constantine, algeria. Arab. J. Geosci. 10 (8), 194–216. doi:10.1007/s12517-017-2980-6
Ali, S., Biermanns, P., Haider, R., and Reicherter, K. (2019). Landslide susceptibility mapping by using a geographic information system (GIS) along the china–pakistan economic corridor (Karakoram Highway), pakistan. Nat. Hazards Earth Syst. Sci. 19 (5), 999–1022. doi:10.5194/nhess-19-999-2019
Arnoldus, H. M. J. (1980). An approximation of the rainfall factor in the universal soil loss equation, Editor M. De Boodt, and D. Gabriels (New York: Assessment of Erosion, John Wiley and Sons), 127–132.
Aslam, B., Maqsoom, A., Khalil, U., Ghorbanzadeh, O., Blaschke, T., Farooq, D., et al. (2022). Evaluation of different landslide susceptibility models for a local scale in the Chitral District, Northern Pakistan. Sensors 22 (9), 3107. doi:10.3390/s22093107
Azareh, A., Rahmati, O., Rafiei-Sardooi, E., Sankey, J. B., Lee, S., Shahabi, H., et al. (2019). Modelling gully-erosion susceptibility in a semi-arid region, Iran: Investigation of applicability of certainty factor and maximum entropy models. Sci. Total Environ. 655, 684–696. doi:10.1016/j.scitotenv.2018.11.235
Baeza, C., Lantada, N., and Moya, J. (2010). Influence of sample and terrain unit on landslide susceptibility assessment at La Pobla de Lillet, Eastern Pyrenees, Spain. Environ. Earth Sci. 60 (1), 155–167. doi:10.1007/s12665-009-0176-4
Bahrami, Y., Hassani, H., and Maghsoudi, A. (2020). Landslide susceptibility mapping using AHP and fuzzy methods in the Gilan province, Iran. Rasht: GeoJournal, 1
Ballabio, C., and Sterlacchini, S. (2012). Support vector machines for landslide susceptibility mapping: The staffora river basin case study, Italy. Math. Geosci. 44 (1), 47–70. doi:10.1007/s11004-011-9379-9
Bragagnolo, L., da Silva, R. V., and Grzybowski, J. M. V. (2020). Landslide susceptibility mapping with r. landslide: A free open-source GIS-integrated tool based on artificial neural networks. Environ. Model. Softw. 123, 104565. doi:10.1016/j.envsoft.2019.104565
Bui, D. T., Nguyen, Q. P., Hoang, N.-D., and Klempe, H. (2017). A novel fuzzy K-nearest neighbor inference model with differential evolution for spatial prediction of rainfall-induced shallow landslides in a tropical hilly area using GIS. Landslides 14 (1), 1–17. doi:10.1007/s10346-016-0708-4
Bui, D. T., Tuan, T. A., Klempe, H., Pradhan, B., and Revhaug, I. (2016). Spatial prediction models for shallow landslide hazards: A comparative assessment of the efficacy of support vector machines, artificial neural networks, kernel logistic regression, and logistic model tree. Landslides 13 (2), 361–378. doi:10.1007/s10346-015-0557-6
Capitani, M., Ribolini, A., and Bini, M. (2013). The slope aspect: A predisposing factor for landsliding? Comptes Rendus Geosci. 345 (11-12), 427–438. doi:10.1016/j.crte.2013.11.002
Cevik, E., and Topal, T. (2003). GIS-based landslide susceptibility mapping for a problematic segment of the natural gas pipeline, Hendek (Turkey). Environ. Geol. 44 (8), 949–962. doi:10.1007/s00254-003-0838-6
Chen, W., Ding, X., Zhao, R., and Shi, S. (2016a). Application of frequency ratio and weights of evidence models in landslide susceptibility mapping for the Shangzhou District of Shangluo City, China. Environ. Earth Sci. 75 (1), 64. doi:10.1007/s12665-015-4829-1
Chen, W., Panahi, M., Tsangaratos, P., Shahabi, H., Ilia, I., Panahi, S., et al. (2019b). Applying population-based evolutionary algorithms and a neuro-fuzzy system for modeling landslide susceptibility. Catena 172, 212–231. doi:10.1016/j.catena.2018.08.025
Chen, W., Pourghasemi, H. R., Kornejady, A., and Zhang, N. (2017). Landslide spatial modeling: Introducing new ensembles of ANN, MaxEnt, and SVM machine learning techniques. Geoderma 305, 314–327. doi:10.1016/j.geoderma.2017.06.020
Chen, W., Pourghasemi, H. R., and Naghibi, S. A. (2018a). Prioritization of landslide conditioning factors and its spatial modeling in shangnan county, china using GIS-based data mining algorithms. Bull. Eng. Geol. Environ. 77 (2), 611–629. doi:10.1007/s10064-017-1004-9
Chen, W., Wang, J., Xie, X., Hong, H., Van Trung, N., Bui, D. T., et al. (2016b). Spatial prediction of landslide susceptibility using integrated frequency ratio with entropy and support vector machines by different kernel functions. Environ. Earth Sci. 75 (20), 1344. doi:10.1007/s12665-016-6162-8
Chen, W., Zhang, S., Li, R., and Shahabi, H. (2018b). Performance evaluation of the GIS-based data mining techniques of best-first decision tree, random forest, and naïve Bayes tree for landslide susceptibility modeling. Sci. total Environ. 644, 1006–1018. doi:10.1016/j.scitotenv.2018.06.389
Chen, W., Zhao, X., Shahabi, H., Shirzadi, A., Khosravi, K., Chai, H., et al. (2019a). Spatial prediction of landslide susceptibility by combining evidential belief function, logistic regression and logistic model tree. Geocarto Int. 34 (11), 1177–1201. doi:10.1080/10106049.2019.1588393
Choi, J., Oh, H.-J., Lee, H.-J., Lee, C., and Lee, S. (2012). Combining landslide susceptibility maps obtained from frequency ratio, logistic regression, and artificial neural network models using ASTER images and GIS. Eng. Geol. 124, 12–23. doi:10.1016/j.enggeo.2011.09.011
Cortes, C., and Vapnik, V. (1995). Support-vector networks. Mach. Learn. 20 (3), 273–297. doi:10.1007/bf00994018
Del Gaudio, V., Wasowski, J., and Muscillo, S. (2013). New developments in ambient noise analysis to characterise the seismic response of landslide-prone slopes. Nat. Hazards Earth Syst. Sci. 13 (8), 2075–2087. doi:10.5194/nhess-13-2075-2013
Deng, X., Liu, Q., Deng, Y., and Mahadevan, S. (2016). An improved method to construct basic probability assignment based on the confusion matrix for classification problem. Inf. Sci. 340, 250–261. doi:10.1016/j.ins.2016.01.033
Devkota, K. C., Regmi, A. D., Pourghasemi, H. R., Yoshida, K., Pradhan, B., Ryu, I. C., et al. (2013). Landslide susceptibility mapping using certainty factor, index of entropy and logistic regression models in GIS and their comparison at Mugling–Narayanghat road section in Nepal Himalaya. Nat. Hazards (Dordr). 65 (1), 135–165. doi:10.1007/s11069-012-0347-6
Erener, A., Mutlu, A., and Düzgün, H. S. (2016). A comparative study for landslide susceptibility mapping using GIS-based multi-criteria decision analysis (MCDA), logistic regression (LR) and association rule mining (ARM). Eng. Geol. 203, 45–55. doi:10.1016/j.enggeo.2015.09.007
Fall, M., Azzam, R., and Noubactep, C. (2006). A multi-method approach to study the stability of natural slopes and landslide susceptibility mapping. Eng. Geol. 82 (4), 241–263. doi:10.1016/j.enggeo.2005.11.007
Flentje, P., and Chowdhury, R. (2018). Resilience and sustainability in the management of landslides. Proceedings of the institution of Civil engineers-engineering sustainability 171 (1), 3–14.
Froude, M. J., and Petley, D. N. (2018). Global fatal landslide occurrence from 2004 to 2016. Nat. Hazards Earth Syst. Sci. 18 (8), 2161–2181. doi:10.5194/nhess-18-2161-2018
Girma, F., Raghuvanshi, T., Ayenew, T., and Hailemariam, T. (2015). Landslide hazard zonation in Ada Berga District, Central Ethiopia–a GIS based statistical approach. J. Geom. 9, 25–38.
Goetz, J., Brenning, A., Petschko, H., and Leopold, P. (2015). Evaluating machine learning and statistical prediction techniques for landslide susceptibility modeling. Comput. geosciences 81, 1–11. doi:10.1016/j.cageo.2015.04.007
Hong, H., Chen, W., Xu, C., Youssef, A. M., Pradhan, B., and Tien Bui, D. (2017). Rainfall-induced landslide susceptibility assessment at the Chongren area (China) using frequency ratio, certainty factor, and index of entropy. Geocarto Int. 32 (2), 1–16. doi:10.1080/10106049.2015.1130086
Hong, H., Naghibi, S. A., Pourghasemi, H. R., and Pradhan, B. (2016a). GIS-based landslide spatial modeling in Ganzhou City, China. Arab. J. Geosci. 9 (2), 112. doi:10.1007/s12517-015-2094-y
Hong, H., Pourghasemi, H. R., and Pourtaghi, Z. S. (2016b). Landslide susceptibility assessment in lianhua county (China): A comparison between a random forest data mining technique and bivariate and multivariate statistical models. Geomorphology 259, 105–118. doi:10.1016/j.geomorph.2016.02.012
Hwang, C., and Yoon, K. (1981). Multi-objective decision making–methods and application. A state-of-the-art study. New York: Springer-Verlag.
Kamp, U., Growley, B. J., Khattak, G. A., and Owen, L. A. (2008). GIS-based landslide susceptibility mapping for the 2005 Kashmir earthquake region. Geomorphology 101 (4), 631–642. doi:10.1016/j.geomorph.2008.03.003
Kanwal, S., Atif, S., and Shafiq, M. (2017). GIS based landslide susceptibility mapping of northern areas of Pakistan, a case study of Shigar and Shyok Basins. Geomatics, Nat. Hazards Risk 8 (2), 348–366. doi:10.1080/19475705.2016.1220023
Kavzoglu, T., Sahin, E. K., and Colkesen, I. (2014). Landslide susceptibility mapping using GIS-based multi-criteria decision analysis, support vector machines, and logistic regression. Landslides 11 (3), 425–439. doi:10.1007/s10346-013-0391-7
Kazmi, A. H., and Jan, M. Q. (1997). Geology and tectonics of Pakistan. Wollongong, Australia: Graphic publishers.
Khan, A. N., Collins, A. E., and Qazi, F. (2011). Causes and extent of environmental impacts of landslide hazard in the himalayan region: A case study of murree, Pakistan. Nat. Hazards (Dordr). 57 (2), 413–434. doi:10.1007/s11069-010-9621-7
Khan, H., Shafique, M., Khan, M. A., Bacha, M. A., Shah, S. U., and Calligaris, C. (2019). Landslide susceptibility assessment using Frequency Ratio, a case study of northern Pakistan. Egypt. J. Remote Sens. Space Sci. 22 (1), 11–24. doi:10.1016/j.ejrs.2018.03.004
Khattak, G. A., Owen, L. A., Kamp, U., and Harp, E. L. (2010). Evolution of earthquake-triggered landslides in the Kashmir Himalaya, northern Pakistan. Geomorphology 115 (1-2), 102–108. doi:10.1016/j.geomorph.2009.09.035
Krohling, R. A., and Pacheco, A. G. (2015). A-TOPSIS–an approach based on TOPSIS for ranking evolutionary algorithms. Procedia Comput. Sci. 55, 308–317. doi:10.1016/j.procs.2015.07.054
Lee, S. (2005). Application of logistic regression model and its validation for landslide susceptibility mapping using GIS and remote sensing data. Int. J. Remote Sens. 26 (7), 1477–1491. doi:10.1080/01431160412331331012
Lin, C., and Wu, W.-W. (2004). A fuzzy extension of the DEMATEL method for group decision making. Eur. J. Operational Res. 156, 445–455. doi:10.1016/S0377-2217(02)00914-1
Mandal, B., and Mandal, S. (2018). Analytical hierarchy process (AHP) based landslide susceptibility mapping of Lish river basin of eastern Darjeeling Himalaya, India. Adv. Space Res. 62 (11), 3114–3132. doi:10.1016/j.asr.2018.08.008
Maqsoom, A., Aslam, B., Khalil, U., Kazmi, Z. A., Azam, S., Mehmood, T., et al. (2021). Landslide susceptibility mapping along the China Pakistan Economic Corridor (CPEC) route using multi-criteria decision-making method. Model. Earth Syst. Environ. 8, 1519–1533. doi:10.1007/s40808-021-01226-0
Maria Navin, J., and Pankaja, R. (2016). Performance analysis of text classification algorithms using confusion matrix. Int. J. Eng. Tech. Res. (IJETR) 6, 75–78.
Marjanović, M., Kovačević, M., Bajat, B., and Voženílek, V. (2011). Landslide susceptibility assessment using SVM machine learning algorithm. Eng. Geol. 123 (3), 225–234. doi:10.1016/j.enggeo.2011.09.006
Mountrakis, G., Im, J., and Ogole, C. (2011). Support vector machines in remote sensing: A review. ISPRS J. Photogrammetry Remote Sens. 66 (3), 247–259. doi:10.1016/j.isprsjprs.2010.11.001
Najafabadi, R. M., Ramesht, M. H., Ghazi, I., Khajedin, S. J., Seif, A., Nohegar, A., et al. (2016). Identification of natural hazards and classification of urban areas by TOPSIS model (case study: Bandar Abbas city, Iran). Geomatics, Nat. Hazards Risk 7 (1), 85–100. doi:10.1080/19475705.2013.871353
O’brien, R. M. (2007). A caution regarding rules of thumb for variance inflation factors. Qual. Quant. 41 (5), 673–690. doi:10.1007/s11135-006-9018-6
Onagh, M., Kumra, V., and Rai, P. K. (2012b). Application of multiple linear regression model in landslide susceptibility zonation mapping the case study narmab basin Iran. Int. J. Geol. Earth Environ. Sci. 2 (2), 87
Onagh, M., Kumra, V., and Rai, P. K. (2012a). Landslide susceptibility mapping in a part of Uttarkashi district (India) by multiple linear regression method. Int. J. Geol. Earth Environ. Sci. 2 (2), 102
Owen, L. A., Kamp, U., Khattak, G. A., Harp, E. L., Keefer, D. K., and Bauer, M. A. (2008). Landslides triggered by the 8 october 2005 Kashmir earthquake. Geomorphology 94 (1-2), 1–9. doi:10.1016/j.geomorph.2007.04.007
Pavelsky, T. M., and Smith, L. C. (2008). RivWidth: A software tool for the calculation of river widths from remotely sensed imagery. IEEE Geosci. Remote Sens. Lett. 5 (1), 70–73. doi:10.1109/lgrs.2007.908305
Pawluszek, K., Borkowski, A., and Tarolli, P. (2018). Sensitivity analysis of automatic landslide mapping: Numerical experiments towards the best solution. Landslides 15 (9), 1851–1865. doi:10.1007/s10346-018-0986-0
Pham, B. T., Bui, D. T., Dholakia, M., Prakash, I., and Pham, H. V. (2016b). A comparative study of least square support vector machines and multiclass alternating decision trees for spatial prediction of rainfall-induced landslides in a tropical cyclones area. Geotech. Geol. Eng. (Dordr). 34 (6), 1807–1824. doi:10.1007/s10706-016-9990-0
Pham, B. T., Pradhan, B., Bui, D. T., Prakash, I., and Dholakia, M. (2016a). A comparative study of different machine learning methods for landslide susceptibility assessment: A case study of uttarakhand area (India). Environ. Model. Softw. 84, 240–250. doi:10.1016/j.envsoft.2016.07.005
Pourghasemi, H. R., Pradhan, B., and Gokceoglu, C. (2012). Application of fuzzy logic and analytical hierarchy process (AHP) to landslide susceptibility mapping at Haraz watershed, Iran. Nat. Hazards (Dordr). 63 (2), 965–996. doi:10.1007/s11069-012-0217-2
Pradhan, A., and Kim, Y. (2016). Evaluation of a combined spatial multi-criteria evaluation model and deterministic model for landslide susceptibility mapping. Catena 140, 125–139. doi:10.1016/j.catena.2016.01.022
Pradhan, B. (2013). A comparative study on the predictive ability of the decision tree, support vector machine and neuro-fuzzy models in landslide susceptibility mapping using GIS. Comput. Geosciences 51, 350–365. doi:10.1016/j.cageo.2012.08.023
Pradhan, B. (2010). Landslide susceptibility mapping of a catchment area using frequency ratio, fuzzy logic and multivariate logistic regression approaches. J. Indian Soc. Remote Sens. 38 (2), 301–320. doi:10.1007/s12524-010-0020-z
Pradhan, B., Lee, S., and Buchroithner, M. F. (2009). Use of geospatial data and fuzzy algebraic operators to landslide-hazard mapping. Appl. Geomat. 1 (1-2), 3–15. doi:10.1007/s12518-009-0001-5
Pradhan, B., and Lee, S. (2010). Landslide susceptibility assessment and factor effect analysis: Backpropagation artificial neural networks and their comparison with frequency ratio and bivariate logistic regression modelling. Environ. Model. Softw. 25 (6), 747–759. doi:10.1016/j.envsoft.2009.10.016
Raghukanth, S. (2008). Ground motion estimation during the Kashmir earthquake of 8th October 2005. Nat. Hazards (Dordr). 46 (1), 1–13. doi:10.1007/s11069-007-9178-2
Raghuvanshi, T. K., Ibrahim, J., and Ayalew, D. (2014). Slope stability susceptibility evaluation parameter (SSEP) rating scheme–an approach for landslide hazard zonation. J. Afr. Earth Sci. 99, 595–612. doi:10.1016/j.jafrearsci.2014.05.004
Rao, R. V., and Davim, J. P. (2008). A decision-making framework model for material selection using a combined multiple attribute decision-making method. Int. J. Adv. Manuf. Technol. 35 (7-8), 751–760. doi:10.1007/s00170-006-0752-7
Razavi, S., and Shirani, K. (2019). Landslide hazard zoning using frequency ratio, entropy methods and TOPSIS decision making methods (Case study: Fahliyan basin. Fars).
Rossetto, T., and Peiris, N. (2009). Observations of damage due to the Kashmir earthquake of October 8, 2005 and study of current seismic provisions for buildings in Pakistan. Bull. Earthq. Eng. 7 (3), 681–699. doi:10.1007/s10518-009-9118-5
Ruff, M., and Czurda, K. (2008). Landslide susceptibility analysis with a heuristic approach in the Eastern Alps (Vorarlberg, Austria). Geomorphology 94 (3-4), 314–324. doi:10.1016/j.geomorph.2006.10.032
Saaty, T. L. (1990). Decision making for leaders: The analytic hierarchy process for decisions in a complex world. RWS publications.
Saaty, T. L., and Vargas, L. G. (2001). “How to make a decision,” in Models, methods, concepts & applications of the analytic hierarchy process (Springer), 1
Saaty, T. (1980). The analytic hierarchy process, 70. New York: Mcgraw Hill Agricultural Economics Review.
Saba, S. B., van der Meijde, M., and van der Werff, H. (2010). Spatiotemporal landslide detection for the 2005 Kashmir earthquake region. Geomorphology 124 (1-2), 17–25. doi:10.1016/j.geomorph.2010.07.026
Saha, A. K., Gupta, R. P., Sarkar, I., Arora, M. K., and Csaplovics, E. (2005). An approach for GIS-based statistical landslide susceptibility zonation—With a case study in the Himalayas. Landslides 2 (1), 61–69. doi:10.1007/s10346-004-0039-8
Saito, H., Nakayama, D., and Matsuyama, H. (2009). Comparison of landslide susceptibility based on a decision-tree model and actual landslide occurrence: The akaishi mountains, Japan. Geomorphology 109 (3-4), 108–121. doi:10.1016/j.geomorph.2009.02.026
San, B. T. (2014). An evaluation of SVM using polygon-based random sampling in landslide susceptibility mapping: The candir catchment area (Western antalya, Turkey). Int. J. Appl. earth observation geoinformation 26, 399–412. doi:10.1016/j.jag.2013.09.010
Shahabi, H., and Hashim, M. (2015). Landslide susceptibility mapping using GIS-based statistical models and Remote sensing data in tropical environment. Sci. Rep. 5 (1), 9899–9915. doi:10.1038/srep09899
Shahabi, H., Khezri, S., Ahmad, B. B., and Hashim, M. (2014). Retracted: Landslide susceptibility mapping at central zab basin, Iran: A comparison between analytical hierarchy process, frequency ratio and logistic regression models. Catena 115, 55–70. doi:10.1016/j.catena.2013.11.014
Shano, L., Raghuvanshi, T. K., and Meten, M. (2020). Landslide susceptibility evaluation and hazard zonation techniques–a review. Geoenvironmental Disasters 7 (1), 18–19. doi:10.1186/s40677-020-00152-0
Shirzadi, A., Shahabi, H., Chapi, K., Bui, D. T., Pham, B. T., Shahedi, K., et al. (2017). A comparative study between popular statistical and machine learning methods for simulating volume of landslides. Catena 157, 213–226. doi:10.1016/j.catena.2017.05.016
Süzen, M. L., and Kaya, B. Ş. (2012). Evaluation of environmental parameters in logistic regression models for landslide susceptibility mapping. Int. J. Digital Earth 5 (4), 338–355. doi:10.1080/17538947.2011.586443
Trigila, A., Iadanza, C., Esposito, C., and Scarascia-Mugnozza, G. (2015). Comparison of logistic regression and random Forests techniques for shallow landslide susceptibility assessment in giampilieri (NE sicily, Italy). Geomorphology 249, 119–136. doi:10.1016/j.geomorph.2015.06.001
Tsangaratos, P., and Ilia, I. (2016). Comparison of a logistic regression and naïve bayes classifier in landslide susceptibility assessments: The influence of models complexity and training dataset size. Catena 145, 164–179. doi:10.1016/j.catena.2016.06.004
Tsangaratos, P., Ilia, I., Hong, H., Chen, W., and Xu, C. (2017). Applying Information Theory and GIS-based quantitative methods to produce landslide susceptibility maps in Nancheng County, China. Landslides 14 (3), 1091–1111. doi:10.1007/s10346-016-0769-4
Umar, Z., Pradhan, B., Ahmad, A., Jebur, M. N., and Tehrany, M. S. (2014). Earthquake induced landslide susceptibility mapping using an integrated ensemble frequency ratio and logistic regression models in west Sumatera Province, Indonesia. Catena 118, 124–135. doi:10.1016/j.catena.2014.02.005
von Ruette, J., Lehmann, P., and Or, D. (2013). Rainfall‐triggered shallow landslides at catchment scale: Threshold mechanics‐based modeling for abruptness and localization. Water Resour. Res. 49 (10), 6266–6285. doi:10.1002/wrcr.20418
Wang, L.-J., Guo, M., Sawada, K., Lin, J., and Zhang, J. (2015). Landslide susceptibility mapping in mizunami city, Japan: A comparison between logistic regression, bivariate statistical analysis and multivariate adaptive regression spline models. Catena 135, 271–282. doi:10.1016/j.catena.2015.08.007
Wang, Q., Li, W., Xing, M., Wu, Y., Pei, Y., Yang, D., et al. (2016). Landslide susceptibility mapping at gongliu county, china using artificial neural network and weight of evidence models. Geosci. J. 20 (5), 705–718. doi:10.1007/s12303-016-0003-3
Wang, Y., Fang, Z., and Hong, H. (2019). Comparison of convolutional neural networks for landslide susceptibility mapping in yanshan county, china. Sci. total Environ. 666, 975–993. doi:10.1016/j.scitotenv.2019.02.263
Wallace, K., Bilham, R., Blume, F., Gaur, V. K., and Gahalaut, V. (2005). Surface deformation in the region of the 1905 Kangra Mw = 7.8 earthquake in the period 1846–2001. Geophys. Res. Lett. 32, L15307. doi:10.1029/2005GL022906
Xu, C., Dai, F., Xu, X., and Lee, Y. H. (2012). GIS-based support vector machine modeling of earthquake-triggered landslide susceptibility in the Jianjiang River watershed, China. Geomorphology 145, 70–80. doi:10.1016/j.geomorph.2011.12.040
Xu, H. (2006). Modification of normalised difference water index (NDWI) to enhance open water features in remotely sensed imagery. Int. J. remote Sens. 27 (14), 3025–3033. doi:10.1080/01431160600589179
Yang, Z., Qiao, J., Uchimura, T., Wang, L., Lei, X., and Huang, D. (2017). Unsaturated hydro-mechanical behaviour of rainfall-induced mass remobilization in post-earthquake landslides. Eng. Geol. 222, 102–110. doi:10.1016/j.enggeo.2017.04.001
Yao, X., Tham, L., and Dai, F. (2008). Landslide susceptibility mapping based on support vector machine: A case study on natural slopes of Hong Kong, China. Geomorphology 101 (4), 572–582. doi:10.1016/j.geomorph.2008.02.011
Yoshimatsu, H., and Abe, S. (2006). A review of landslide hazards in Japan and assessment of their susceptibility using an analytical hierarchic process (AHP) method. Landslides 3 (2), 149–158. doi:10.1007/s10346-005-0031-y
Youssef, A. M., Al-Kathery, M., and Pradhan, B. (2015). Landslide susceptibility mapping at Al-Hasher area, Jizan (Saudi Arabia) using GIS-based frequency ratio and index of entropy models. Geosci. J. 19 (1), 113–134. doi:10.1007/s12303-014-0032-8
Zhang, Y., Liao, J., Long, Y., An, J., Xu, S., and Wang, X. (2018). Dating reservoir deposits to reconstruct sediment yields from a small limestone catchment in the yimeng mountain region, China. Catena 166, 1–9. doi:10.1016/j.catena.2018.03.012
Keywords: disaster planning, landslide susceptibility maps, machine learning techniques, multi-criteria decision making techniques, weight determining method
Citation: Khalil U, Imtiaz I, Aslam B, Ullah I, Tariq A and Qin S (2022) Comparative analysis of machine learning and multi-criteria decision making techniques for landslide susceptibility mapping of Muzaffarabad district. Front. Environ. Sci. 10:1028373. doi: 10.3389/fenvs.2022.1028373
Received: 25 August 2022; Accepted: 05 September 2022;
Published: 16 September 2022.
Edited by:
Biswajeet Pradhan, University of Technology Sydney, AustraliaReviewed by:
Yacine Achour, University of Bordj Bou Arréridj, AlgeriaCopyright © 2022 Khalil, Imtiaz, Aslam, Ullah, Tariq and Qin. This is an open-access article distributed under the terms of the Creative Commons Attribution License (CC BY). The use, distribution or reproduction in other forums is permitted, provided the original author(s) and the copyright owner(s) are credited and that the original publication in this journal is cited, in accordance with accepted academic practice. No use, distribution or reproduction is permitted which does not comply with these terms.
*Correspondence: Aqil Tariq, YXQyMTM5QG1zc3RhdGUuZWR1; Shujing Qin, U2h1amluZy5xaW5Ad2h1LmVkdS5jbg==
† These authors have contributed equally to this work
Disclaimer: All claims expressed in this article are solely those of the authors and do not necessarily represent those of their affiliated organizations, or those of the publisher, the editors and the reviewers. Any product that may be evaluated in this article or claim that may be made by its manufacturer is not guaranteed or endorsed by the publisher.
Research integrity at Frontiers
Learn more about the work of our research integrity team to safeguard the quality of each article we publish.