 Cao Jianrong1
 Yu Sujie
- 1School of Geography and Environment, Liaocheng Univeristy, Liaocheng, China
- 2Center for Materials Forming (CEMEF), Mines Paris—PSL Research University, Paris, France
The occurrence of organic pollutants [i.e. polycyclic aromatic hydrocarbons (PAHs) and polychlorinated biphenyls (PCBs)] had been assessed in the soil samples collected from two sub-regions (an oil field and the Yellow River Estuary) in the Yellow River Delta (YRD), China. The concentrations of PAHs and PCBs in the soil were in the range of 157.8–481.7 μg kg−1 (dry weight) and 5.6–56.6 μg kg−1 (dry weight), respectively. The average concentration of PAHs in the soil samples from the oil field were 274.0 μg kg−1, and that in the estuary soil samples were 244.4 μg kg−1. The average concentration of PCBs in the soil samples from the oil field and the estuary were 24.2 μg kg−1 and 10.8 μg kg−1, respectively. The contribution of low molecular weight PAHs (two-ring and three-ring PAHs) was larger in the soil samples from the oil field than that in the estuary soil samples. Both PAHs and PCBs contaminations in the estuary area were lower than that in the oil field area. By using diagnostic ratios analysis, the main source of PAHs was attributed to petroleum input caused by the fuel oil or light refined petroleum products in the Gudong Oilfield. The amount of low-chlorine congeners (three to four chlorine atoms) PCBs in soil samples from the oil field were higher than that in the estuary soil samples. The congeners analysis of PCBs and the correlation analysis between the concentrations of PAHs and PCBs were employed. The results indicated that the emission of PCBs in YRD were influenced by both Gudong oilfield and other industrial sources.
Introduction
Polycyclic aromatic hydrocarbons (PAHs) and polychlorinated biphenyls (PCBs) are persistent organic pollutants, whose pollution are ubiquitous anthropogenic. Organic pollutants are typically persistent in the environment and are known to accumulate in soils, sediments, plants, animals and human beings (Harvey 1991; Kannan et al., 1995; Wilcke, 2000; Senthilkumar et al., 2001). PAHs are a large group of organic compounds with at least two condensed rings. Many PAHs are possessed of mutagenic, carcinogenic and teratogenic properties (Xue and Warshawsky, 2004). Because PAHs are ubiquitous environmental contaminants, communities surrounding petroleum can be exposed at increased risk of cancer and other adverse health outcomes consequently (Kaldor et al., 1984; Pan et al., 1994; Lin et al., 2001). Being probably carcinogenic to humans, 16 PAHs has been identified as “priority pollutants” by the US Environmental Protection Agency (US EPA, 2002). Similar to PAHs, PCBs has been widely detected in various environmental media and biota in the Arctic (Muir and Norstrom, 2000; Ikonomou et al., 2002; Wit et al., 2006; Ross et al., 2008). A large number of persistent organic pollutants have been produced in China (Hua and Shang, 1996). It was reported that approximately 10,000 tons of PCBs were produced from 1965 to the early 1980s in China, accounting for about 1% of the global production (Zheng et al., 2012). Environmental pollution in soil by PAHs and PCBs is a matter of great concern because of their prolonged persistence, lipophilic nature and tendency to accumulate in animal and plant tissues. Concerns have focused on many coastal regions owing to high anthropogenic influence and various contamination sources (Liu et al., 2009a; Hu et al., 2009; Hui et al., 2009; Wang et al., 2011).
The Yellow River Delta (YRD) in China is a triangular-shaped region, which covers an area of 5450 km2. The economy of the YRD region has developed rapidly. The Shengli Oil Field, the second largest oil field in China, is located in the YRD. Because of the ecological risk of YRD causing by oil production and refinement, a few studies on hydrocarbon pollutants and PAHs in YRD have been undertaken (Luo et al., 2005; Hui et al., 2009; Wang et al., 2011; Xie et al., 2011). Xie et al. (2011) had studied the distribution of PAHs in the topsoil of the YRD on a county-scale and Wang et al. (2011) tried to find out the source of PAHs in YRD. However, few people did such a contrastive research on the concentrations, distribution, and composition of PAHs and PCBs in the Oil soil and Estuary soil. The effect of the oil production and refinement in YRD to the adjacent soil environment in the regional-scale remains scarcely touched.
This paper represents the first contrastive study of the PAHs and PCBs in the soil samples from two different regions in the YRD, the Oil Filed soil versus the Estuary soil. The main objectives of the study were: 1) to assess the level of PAHs and PCBs contamination in the two different sub-regions in the YRD; and 2) to identify the sources of PAHs and PCBs in these areas using the analysis of PAHs isomer ratios and PCB congeners.
Materials and methods
Sampling
Thirty-seven soil samples were collected and analyzed for persistent organic pollutants in November 2018, among which twenty-five samples were taken from the Gudong Oilfield which is a part of Shengli Oilfield, and twelve samples were taken from the estuary of the YRD. These samples were far away from industrial zones in order to avoid the influence of point pollution. Sampling locations are shown in Figure 1.
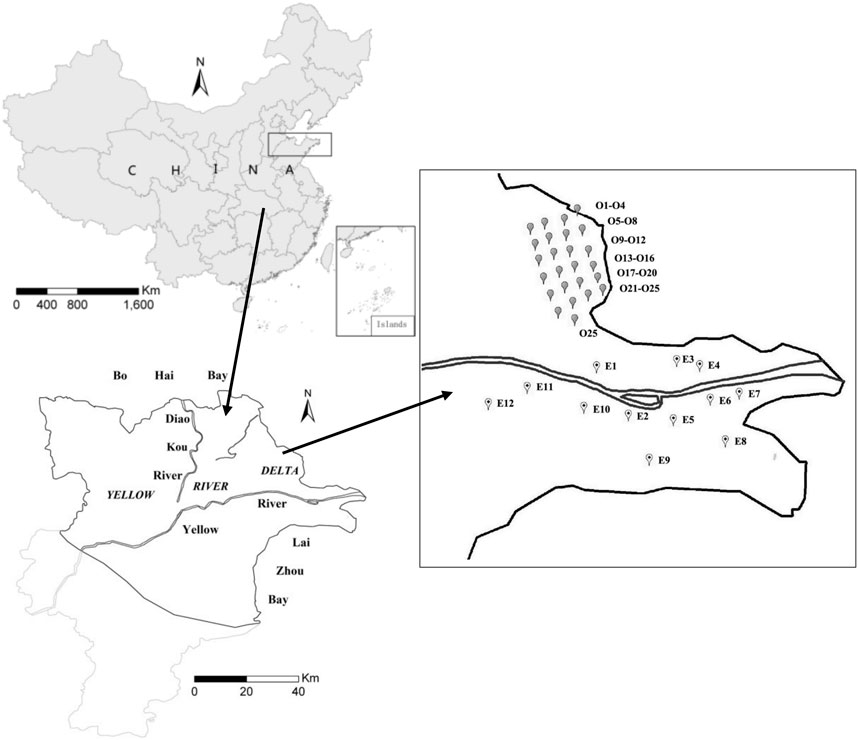
FIGURE 1. Map of sampling locations in the oil field and estuary in the YRD: O1-O25 mean Oil soil samples, (b) mean Estuary soil samples.
Soil samples (about1 kg) were collected, and thenput in cleaned polyethylene bags with zippers and transported on ice to the laboratory. Thse samples were dried using a freezing dryer and then grounded to pass through a 1 mm × 1 mm stainless steel sieve and fully homogenized. All the soil samples were kept at −20°C until chemical analysis.
Chemicals
The EPA-610-16PAHs mixed standard solutions used in this study included acenaphthylene (Ace), acenaphthene (Acy), anthracene (Ant), benzo-a-anthracene (BaA), benzo-a-pyrene (BaP), benzo-b-pyrene (BbF), benzo-ghi-pyrene (Bgp), benzo-k-pyrene (BkF), chrysene (Chr), bibenz-ah-anthracene (DaA), fluorine (Fl), fluoranthene (Fla), indeno-123-cd-pyrene (Inp), naphthalene (Nap), phenanthrene (Phe) and pyrene (Pyr). Sixteen PAHs (16 compounds specified in EPA Method 610) in a mixture were purchased from Supelco company (United States). The PCBs mixed standard solutions including PCB28, PCB52, PCB101, PCB118, PCB153, PCB138 and PCB180 were purchased from o2si company (United States). Hexane and dichloromethane used for sample pretreatment were all pesticide analysis grades.
Sample extraction and clean-up
The mixture of soil sample (3 g) and quartz sand (10 g) was then Soxhlet-extracted with 20ml of hexane and dichloromethane solvent mixture (1:1, v/v) for 48 h. The extract was concentrated to approximately 1ml by a rotary evaporator (Buchi E-96, Switzerland).
For the determination of PCBs, the concentrated extract was treated with sulfuric acid (98%) before clean-up. A silica gel column chromatograph was used to clean up and fractionate the extract. The column was the glass column with an inner diameter of 25 cm * 1 cm and was filled with glass wool, 1cm anhydrous Na2SO4, 1.5 cm silica gel, and 1 cm anhydrous Na2SO4 in turn. PCBs were eluted with 20 ml hexane. The hexane fraction was then evaporated to dryness and spiked with hexane retaining constant volume to 1 ml.
For the determination of PAHs, the extract was cleaned up with a silica gel column. The column was rinsed with 5 ml hexane and dichloromethane solvent mixture (9:1, v/v) before using. PAHs were eluted with 20 ml hexane and dichloromethane solvent mixture (1:1, v/v). The solvent mixture was evaporated to dryness and spiked with hexane retaining constant volume to 1.5 ml.
Instrument analysis
In the study, sixteen polycyclic aromatic hydrocarbons in soil had been analyzed using GC/MS (7890/5975). A capillary column HP-5 (30 m × 0.32 mm × 0.25 µm) was employed. The carrier gas was purified nitrogen at the flow rate of 1.0 ml min−1. The temperature of the injector was maintained at 290 °C. For PAHs analysis, the splitless injection was employed. The column oven temperature program was as follows: The oven temperature was initially maintained at 80°C and held for 2 min, and then increased to 290°C at the rate of 6°C min−1 and held for 5 min until the sample was completely out of the column. SIM mode was used for quantification of PAHs.
Seven PCBs in soil had been analyzed using Agilent 7890 GC-µECD. A capillary column HP-5 (30 m × 0.25 mm × 0.25 µm) was employed. Carrier gas was purified nitrogen at the flow rate of 2.0 ml min−1. The temperature of injector and detector were maintained at 220 and 280°C. For PCBs analysis, Splitless injection was employed for PCBs analysis. The column oven temperature program was as follows: The oven temperature was initially maintained at 60°C and held for 1 min and then increased to 140°C at the rate of 20°C min−1; subsequently, the oven temperature was increased to 260°C at the rate of 12°C min−1 and held for 3 min until the sample was completely out of the column.
Quality assurance and quality control
The external standard method was used to determine the concentrations of target compounds. A procedural blank consisting of all chemicals and solvents was run to check for interferences and cross contamination. The recoveries ranged from 74.52 to 105.66% for sixteen PAHs and ranged from 73.2 to 96.3% for seven PCBs.
Results and discussion
Concentrations, proportions, and compositions of PAHs
The concentrations of PAHs in soil from the YRD were presented in Table 1. In the thirty-seven soil samples, most of the sixteen PAH compounds were observed with high detect rates. Twelve of them were detected in over 90% of the soil samples. The detect rates of BbF (67.6%), BkF (59.5%), BaP (75.7%) and BgP (67.6%) were relatively low. The concentrations of PAH compounds in the YRD were compared with those reported from elsewhere as listed in Table 2. Total PAHs had been detected in all the soil samples, which ranged from 157.8 to 481.7 μgkg−1 (dry weight, DW). The concentrations observed in this study were higher than those in agricultural soils reported in Shunde (ranged from 33.7 to 350 μg kg−1) (Li et al., 2008) and Tianjin (ranged from 1.08 to 6.25 μg kg−1) (Tao et al., 2004), as well as the concentrations in sediments at the YRD (3.6–27.1 μg kg−1) (Wang et al., 2011). However, the concentrations detected in this study were significantly lower than those reported in Seine River basin (ranged from 450 to 5650 μg kg−1) (Motelay-Massei et al., 2004) and Guiya (ranged from 44.8 to 3206 μg kg−1) (Wong et al., 2007). A slight difference was found between the samples from the oil field (274.0 μg kg−1) and the estuary (244.4 μg kg−1). Maliszewska-Kordybach (1996) established the classification of soil contamination by PAHs, which was summarized in Table 3. According to the classification, both the Oil soil and Estuary soil samples can be considered as weakly contaminated.
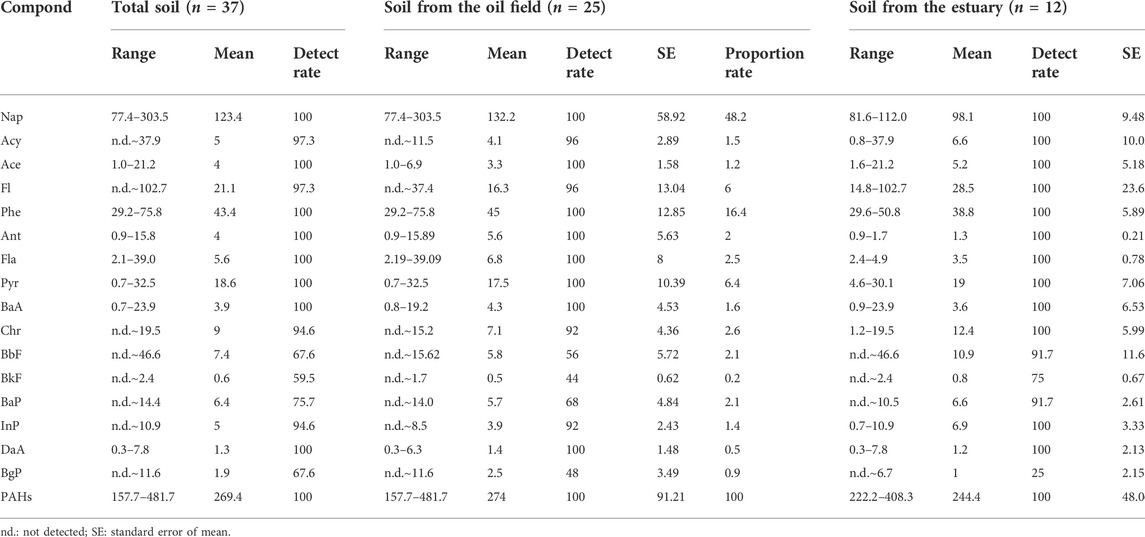
TABLE 1. PAH concentrations (μg kg−1), detect rates and proportions in different soil samples.
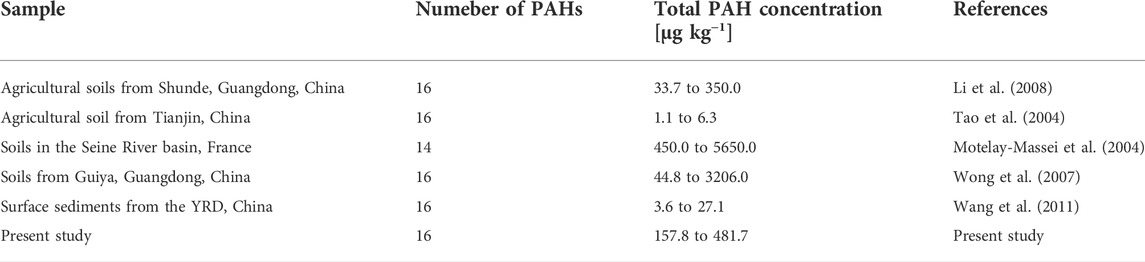
TABLE 2. Total PAH concentrations in soil samples reported in previous literature.
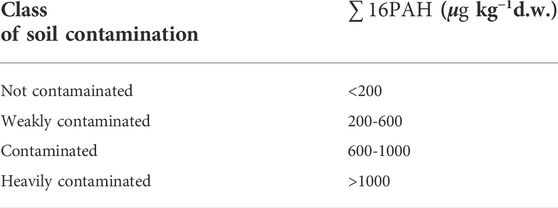
TABLE 3. Classification of soil contamination by PAHs.
The proportions of individual compounds in PAHs in samples from the oil field and the estuary were depicted in Table 1. On the whole, the proportion of Nap in all the samples was the highest among the sixteen individual compounds, which accounted for 48.2% in the soil samples from the oil field and 35.6% in the estuarine samples. But the standard error of mean of Nap in the oil soil samples was 59.0%, which showed great different with the other twenty-four soil samples collected from the oil field. The standard error of mean of Nap in the estuarine samples was only 9.48%. Following Nap, the proportion of Phe was higher than the other 14 compounds. The main compounds of PAHs in the samples from the oil field and the estuary were the same. The contributions of Nap and Phe to total PAHs in the samples from the oil field and the estuary were 64.7 and 56.0%, respectively. The proportions of Nap and Phe in the samples from the oil field were significantly higher than those in the soil samples from the estuary. Conversely, the Fl, Chr, BbF, and Inp in the oil field samples were obviously lower than those in the estuarine samples.
Furthermore, the compositions of different benzenes had been analyzed in order to obtain accurate information about the characteristics of PAHs. The compositions of different benzenes in total PAH in the samples from the oil field and the estuary were shown in Figure 2. As seen in Figure 2, the proportions of low-molecular-weight (LMW) PAHs (2- and 3-ring) in all samples are higher than 70%. Samples from the oil field contain a proportionally higher amount of low-ring PAHs. In all samples, there’s high amount of LMW PAHs, which was the same as the profiles reported in Bincheng (Xie et al., 2011). However, the result was different from those reported in Beijing and Tianjin, China, which were characterized by high molecular-weight (HMW) PAHs (Wang et al., 2010). Compared with the estuary sites, the proportions of LMW PAHs in the oil field samples were close to 80%. It was reported that the high amount of LMW PAHs observed in soil samples from Tianjin industrial near shore area could be due to the input of the oil exploitation and biological processes (Jiao et al., 2009). The high content of phenanthrene in the sediments could be related to the petroleum input from local derived products (Yunker et al., 1996; Shi et al., 2005), while low-temperature combustion inputs could be also responsible for naphthalene and phenanthrene and their alkylated homologs (Mai et al., 2001). Soil petroleum contamination was characterized by high concentrations of LWM PAHs, particularly Nap and Phe (Aislabie et al., 1999; Nadal et al., 2007). In the present study, the abundance of LMW PAHs in soil samples from the oil field was higher than that from the estuary. The composition of different benzenes probably indicated the impact of petroleum in the study area, especially for the oil Filed region.
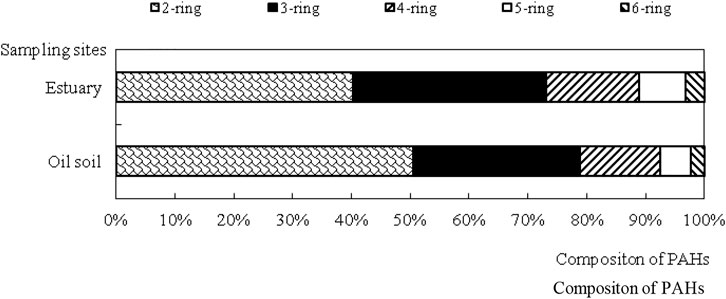
FIGURE 2. Compositions of different benzenes in total PAHs in Oil soil and Estuary soil samples.
Concentrations, proportions, and compositions of PCBs
The concentrations of individual congeners of PCB and the total concentration on the basis of dry weight are presented in Table 4. The concentrations of total PCB in the thirty-seven soil samples ranged from 5.6 to 56.6 μg kg−1, with a mean value of 38.9 μg kg−1. Five of seven PCB congeners were observed over 80%. As listed in Table 5, the total concentration of PCBs in the soil from the Yellow River Delta was higher than that from Balang Mountain, Ny-Ålesund and London Island, and Tianjin, but it is lower than that in the soil from Guiya, India. Concentrations of PCBs reported in the present study were lower comparing with the Australian and New Zealand ecological investigation level (1000 μg kg−1) and the Canadian guidelines for soil (1300 μg kg−1) (ANZECC and NHMRC, 1992; CCME, 2003). The detection frequencies of PCB congeners in the samples from the oil field samples were lower than the estuarine ones. However, the mean concentrations of PCB congeners in the samples from the oil field were higher than the ones from the estuary, which were 24.2 and 10.8 μg kg−1, respectively.
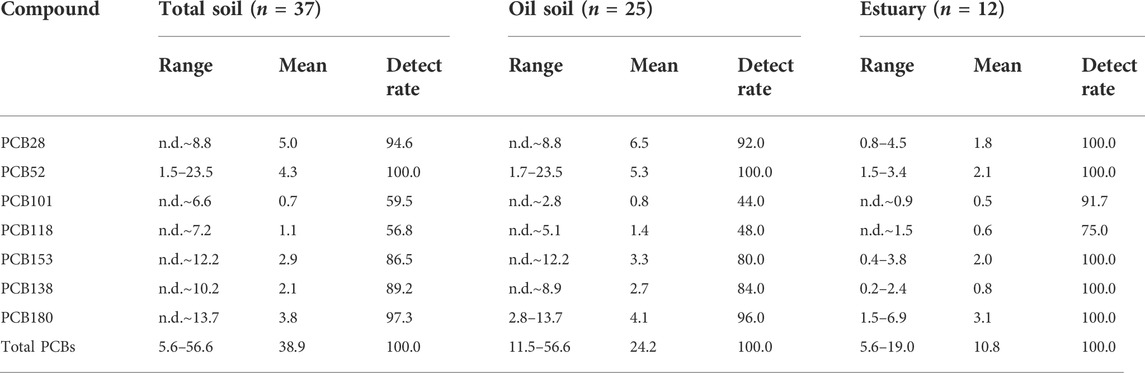
TABLE 4. The concentrations of PCB congeners (μg kg−1) in different soil samples.

TABLE 5. Total PCB concentrations in soil samples reported from literature [μg kg−1].
From Figure 3, we can see that the proportions of individual congeners in total PCBs in soil samples from the oil field and the estuary. The proportions of the former samples differed from that of the latter ones. Among all congeners in the samples from the oil field, PCB-28 (27%) exhibited higher concentration, followed by PCB-52 (22%), PCB-180 (17.1%), PCB-153 (13.6%), PCB-138 (11.3%), PCB-118 (5.8%), and PCB-101 (3.2%). In the soil samples collected from the estuary, the concentrations of PCBs congeners were in the following order: PCB-180 (28.5%) > PCB-52 (19.4%) > PCB-153 (18.4%) > PCB-28 (16.3%) > PCB-138 (7%) > PCB-118 (5.7%) > PCB-101 (4.7%). Compositions of different chlorines in total PCBs in soil samples from the oil field and the estuary were shown in Figure 4. As illustrated in Figure 4, difference of the composition of PCBs was observed in the samples collected from the two different sites. The proportions of high-chlorine congeners (PCB101, PCB118, PCB153, PCB138 and PCB180) were 49.0%, and those of (PCB28 and PCB52) were 51.0% in Oil soil sites. The proportions are approximately similar between high-chlorine congeners and low-chlorine congeners in Oil soil sites. The proportions of various PCBs congeners in the samples from the oil field and the estuary showed significant difference. In the samples from the estuary, the total percentage of the congeners that contain five to seven chlorine atoms (PCB101, PCB118, PCB153, PCB138, and PCB180) were higher than that with three to four chlorine atoms (PCB28 and PCB52). Unlike the estuarine samples, percentage of the high-chlorine congeners are approximately similar to that of the low-chlorine congeners in the oil field samples.
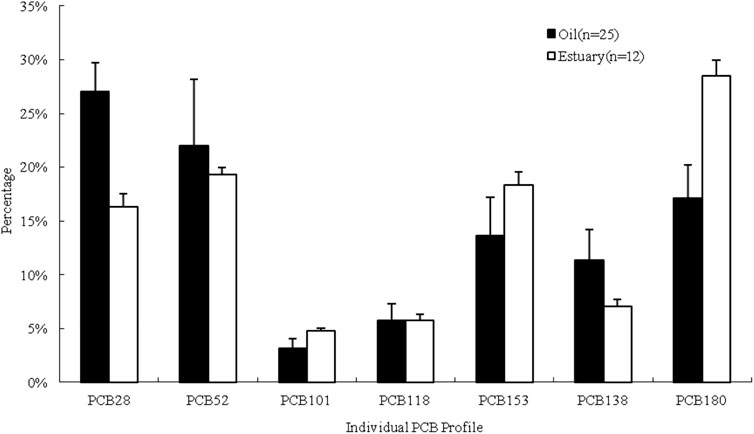
FIGURE 3. Proportions of individual congeners in total PCBs in oil soil and estuarine soil samples.
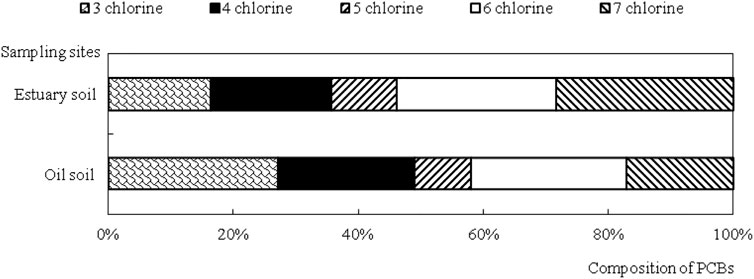
FIGURE 4. Compositions of different chlorines in total PCBs in oil soil and estuarine soil samples.
PAHs source identification
Low-molecular-weight/high-molecular-weight hydrocarbon ratio (LMW/HMW) have been frequently used to identify the sources of PAHs (A. Melnyk et al., 2015). Pyrogenic sources, such as the combustion derived PAHs, were depleted in LMW 2-ring PAHs and enriched in HMW four to six ring PAHs, leading to the LMW/HMW ratios were less than 1 (Soclo et al., 2000 and Rocher et al., 2004). In contrast, petrogenic sources, such as fuel oil or light refined petroleum products, are dominated by LMW PAHs and have LMW/HMW ratios larger than 1. Therefore, LMW/HMW ratios have been used to determine the source of PAHs, where the LMW acronym defines the total concentration of six PAHs (Nap + Acy + Ace + Flu + Phe + Ant), and the HMW acronym defines the total concentration of 10 PAHs (Fla + Pyr + BaA + Chy + BbF + BkF + BaP + InP + DaA + BgP). In this study, the LMW/HMW ratios of PAHs in all the oil field samples were larger than 1 with a mean ratio of 4.06; the LMW/HMW ratios of PAHs in all the estuarne soil samples were larger than 1 with a mean ratio of 2.81. These results confirmed that the sources of PAHs in all the soil samples in the study area were petrogenic. Although the LMW/HMW ratios in the samples from the two sites are significantly different from each other, both of them identified the petrogenic PAHs sources. Gudong Oilfield is part of Shengli Oilfield and might play an important role in the distribution of PAHs due to the operation of oil exploration and refineries.
PAH isomer ratios such as Ant/(Phe + Ant), BaA/(BaA + Chr), Flu/(Flu + Pyr) and Inp/(Inp + BgP) were also extensively used to identify the PAHs sources (Yunker et al., 2002; Yang et al., 2009). Ant/(Phe + Ant) ratio<0.10 is indicated as petroleum input or diagenetic source, whereas values > 0.10 is characteristic of combustion process. Flu/(Flu + Pyr) ratio less than 0.4 indicates petroleum input, between 0.4 and 0.5 indicates liquid fossil fuel combustion, and larger than 0.5 indicates grass, wood or coal combustion. BaA/(BaA + Chr) ratio less than 0.20 implies petroleum input, between 0.20 and 0.35 indicates petroleum or combustion, and larger than 0.35 implies combustion of vegetation and fossil fuel. Inp/(Inp + BgP) ratio below 0.20 shows petroleum, from 0.20 to 0.50 to liquid fossil fuel combustion, while a ratio over 0.50 has been attributed to grass, wood and coal combustion (Yunker et al., 2002). In this study, the Flu/(Flu + Pyr) ratios of oil field samples and estuarine samples are 0.31 and 0.18, relatively. These indicated that petroleum input is an important source of PAHs in soil at the Yellow River Delta. Meanwhile, BaA/(BaA + Chr) ratios ranged from 0.10 to 0.90 in the oil field samples, and 0.07 to 0.95 in the estuarine samples. These ranges suggested that the PAHs sources in this study area were complicated. Moreover, most of the Inp/(Inp + BgP) ratios were over 0.50, which indicated the major sources were combustion of grass, wood and coal. For each soil sample, the PAH isomer ratios were paired and plotted in Figure 5 [Ant/(Phe + Ant) against BaA/(BaA + Chr) and Inp/(Inp + BgP) against Flu/(Flu + Pyr)]. It is clearly demonstrated that eight samples from the oil field (O9, O10, O12, O19, O21, O23, O24, O25) and ten samplesfrom the estuary region (E1, E2, E4, E5, E6, E7, E8, E9, E11, E12) exhibited evidence of petroleum derived pollution, while other samples may be derived primarily from biomass and coal combustion. Morever, the plots of Inp/(Inp + BgP) against Flu/(Flu + Pyr) shows that the PAHs in most samples mainly originated from combustion, Nevertheless, petroleum-derived pollution cannot be ignored in this case. Consequently, the isomer ratios noted above could not yet verify the sources of PAHs clearly in this study. The use of petroleum biomarkers has been proved to be more realistic for investigating petroleum contribution (Silva and Bícego, 2010; Tobiszewski and Namieśnik, 2012) and could be applied in the future study.
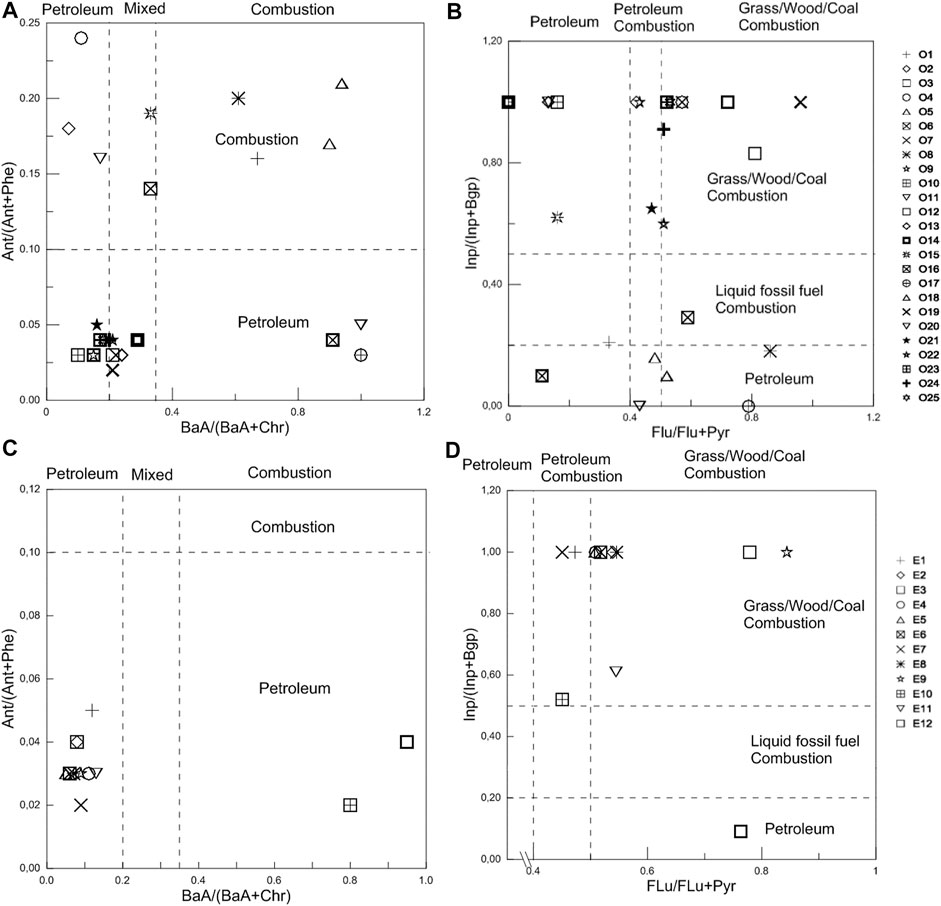
FIGURE 5. Plots of PAH isomer pair ratios for source identification: (A) Ant/(Ant + Phy) versus BaA/(BaA + Chr) in Oil soil samples, (B) Inp/(Inp + BgP) versus Flu/(Flu + Pyr) in Oil soil samples, (C) Ant/(Ant + Phy) versus BaA/(BaA + Chr) in Estuary soil samples, (D) Inp/(Inp + BgP) versus Flu/(Flu + Pyr) in Estuary soil samples.
PCBs source identification
The distributions of PCBs could be influenced by the soil characteristics, the stability of different PCB congeners, and the function of emission sources. It is difficult to establish the correlation between the PCB congener profiles and the sources, especially in the condition of multi-sources.
Variety of methods have been tested to identify the sources of PCBs. The dominant component of PCBs could be used to identify the source of PCBs (Yu et al., 2014). Principal component analysis (PCA) has also been used to track the PCBs sources (Li et al., 2011a). The proportions of the individual PCB congeners from four categories of sampling sites, including industrial, urban, suburban, and remote sites, were normalized to congener 153 and used to find the spatial trend and to identify the source of PCBs(A. Motelay-Massei et al., 2004). According to Motelay-Massei’s study, homogeneous proportions (the amount of light compounds equals to that of the heavy ones) indicated that the PCB signature is preserved over a short transport distance. The predominant PCBs are the high-molecular-weight PCBs at the urban sites. The lightest molecular weight PCBs contributes to the remote sites. The mode of PCB deposition on the soil is uncovered by those results. Different from the less chlorinated congeners, which are easier to be transported over longer distances, the most chlorinated congeners tend to be adsorbed on particles and to settle near sources by dry or wet deposition.
The concentrations of PCB congeners in the samples from the oil field and the estuary were normalized to congener 153 and shown in Table 6.
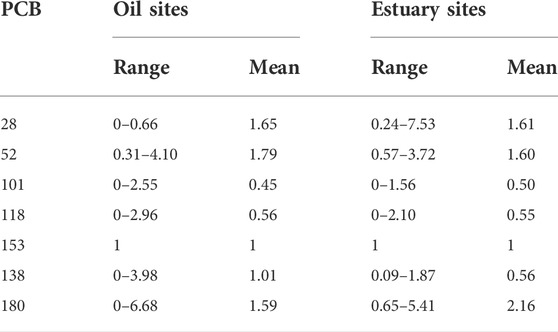
TABLE 6. Concentrations proportions of the seven congeners normalized to congener 153.
As listed in Table 6, the samples from the two kinds of sites were both characterized by a signature with high proportions of the congeners with lightest and the heaviest molecular weight, and low proportions of compounds with intermediate molecular weight. This suggested the existence of two potential sources, local and remote. The concentrations of PCBs in the oil field samples were found higher than those in the estuarine samples. This was probably because the sampling sites were located in the Gudong oil field. According to the congener index listed in Table 6, the proportion of the heaviest congener, PCB180, was higher than other congeners. According to Motelay-Massei’s study, the remote sites are characterized by a greater contribution of the lightest molecular weight PCBs. There’re some other sources away from the estuarine sites.
Because PCBs were chemically synthesized, it was hard to determine their points of origin according to molecular ratios (Wolska et al., 2012). But, after owning data on the origins of PAHs, the probable emission sources of PCBs could be attemptted to pinpoint by comparing and seeking mutual correlations (Lidia et al., 2014). In this study, two different sources were identified by comparing the congeners normalized to conger 153. In order to obtain more accurate identification of the sources of PCBs, the relationships between PAHs and PCBs in different sites were discussed. The maximum correlation index in the oil field is 0.359, and the maximum correlation index in the estuarine sites is −0.323. Correlation was not significant (
Conclusion
Both PAHs and PCBs were detected with high frequency at YRD, and the average concentrations of PAHs in the samples from the oil field and the estuary were 274.0 μg kg−1 and 244.4 μg kg−1, relatively, which can be considered as weakly contaminated. The average concentrations of PCBs in the oil field samples and the estuarine samples were 24.2 μg kg−1and 10.8 μg kg−1, respectively. Overall, the contamination in the estuarine area is weaker than that in the oil field area. In all samples, the proportions of low-molecular-weight (LMW) PAHs (2- and 3-ring) were higher than 50%. The contributions of Nap and Phe to total PAHs in oil field samples and estuarine samples were high, which were 64.7 and 56.0%, respectively. In the present study, the abundance of LMW PAHs in the oil field area was higher than that in the estuary area. According to the source identification, oil exploration and refineries in Gudong Oilfield could contribute to the PAHs contamination observe in the samples collected from the oil field. The analysis of diagnostic ratios and LMW/HMW ratios indicated that petrogenic PAHs were more significant in the samples from the oil filed due to the production activities. The PCB28 and PCB52 congeners had the highest proportions in the majority of soil samples, especially in the oil field samples. And the highest contents of PCBs in soil samples of estuaries (PCB180 and PCB52) were different from those in the oil field samples. The low-chlorine congeners (three to four chlorine atoms) PCBs in the oil field samples were more abundant than that in the estuarine samples. The analysis of congeners of PCBs and the correlation index between PCBs and PAHs showed that the emission of PCBs in the oil field area were influenced by the petrogenic sources from Gudong Oilfield and other industrial sources. The soil environmental management of the YRD could reference from the study.
Data availability statement
The original contributions presented in the study are included in the article/Supplementary Material, further inquiries can be directed to the corresponding author.
Author contributions
CJ was responsible for the experimental design and writing; LY was responsible for supporting CJ’s experiments; YS was responsible for the correction of the paper.
Funding
This work was funded by the 801 Institute of Hydrogeology and Engineering Geology, Shandong Provincial Bureau of Geology and Mineral Resources, and Shandong Engineering Research Center for Environmental Protection and Remediation on Groundwater.
Conflict of interest
The authors declare that the research was conducted in the absence of any commercial or financial relationships that could be construed as a potential conflict of interest.
Publisher’s note
All claims expressed in this article are solely those of the authors and do not necessarily represent those of their affiliated organizations, or those of the publisher, the editors and the reviewers. Any product that may be evaluated in this article, or claim that may be made by its manufacturer, is not guaranteed or endorsed by the publisher.
References
Aislabie, J., Balks, M., Astori, N., Stevenson, G., and Symons, R. (1999). Polycyclic aromatic hydrocarbons in fuel-oil contaminated soils, Antarctica. Chemosphere 39 (13), 2201–2207. doi:10.1016/s0045-6535(99)00144-7
Harvey, R. G. (1991). Polycyclic aromatic hydrocarbons: Chemistry and carcinogenic. Cambridge: Cambridge University Press.
Hu, L. M., Guo, Z. G., Feng, J. L., Yang, Z., and Fang, M. (2009). Distributions and sources of bulk organic matter and aliphatic hydrocarbons in surface sediments of the Bohai Sea, China. Mar. Chem. 113 (3-4), 197–211. doi:10.1016/j.marchem.2009.02.001
Hua, X. M., and Shang, Z. J. (1996). The production and application of pesticides and factor analysis for their pollution in environment in China (in Chinese). Adv. Environnental Sci. 2, 33–45.
Hui, Y. M., Zheng, M. H., Liu, Z. T., and Gao, L. (2009). Distribution of polycyclic aromatic hydrocarbons in sediments from Yellow River estuary and yangtze River Estuary, China. J. Environ. Sci. 21 (12), 1625–1631. doi:10.1016/s1001-0742(08)62465-1
Ikonomou, M. G., Rayne, S., and Addison, R. F. (2002). Exponential increases of the brominated flame retardants, polybrominated diphenyl ethers, in the Canadian arctic from 1981 to 2000. Environ. Sci. Technol. 36 (9), 1886–1892. doi:10.1021/es011401x
Jiao, W., Lu, Y., Li, J., Han, J., Wang, T., Luo, W., et al. (2009). Identification of sources of elevated concentrations of polycyclic aromatic hydrocarbons in an industrial area in Tianjin, China. Environ. Monit. Assess. 158 (1-4), 581–592. doi:10.1007/s10661-008-0606-x
Kaldor, J., Harris, J. A., Glaser, S., Neutra, R., Mayberry, R., et al. (1984). Statistical association between cancer incidence and major-cause mortality, and estimated residential exposure to air emissions from petroleum and chemical plants. Environ. Health Perspect. 54, 319–332. doi:10.1289/ehp.8454319
Kannan, K., Tanabe, S., and Tatsukawa, R. (1995). Geographical distribution and accumulation features of organochlorine residues in fish in Tropical Asia and Oceania. Environ. Sci. Technol. 29, 2673–2683. doi:10.1021/es00010a032
Li, X. M., Li, Y. M., Zhang, Q. H., Wang, P., Yang, H., Jiang, G., et al. (2011a). Evaluation of atmospheric sources of PCDD/Fs, PCBs and PBDEs around a steel industrial complex in northeast China using passive air samplers. Chemosphere 84 (7), 957–963. doi:10.1016/j.chemosphere.2011.06.004
Li, Y. T., Li, F. B., Chen, J. J., Yang, G. Y., Wan, H. F., Zhang, T. B., et al. (2008). The concentrations, distribution and sources of PAHs in agricultural soils and vegetables from Shunde, Guangdong, China. Environ. Monit. Assess. 139 (1-3), 61–76. doi:10.1007/s10661-007-9816-x
Li, Z. Y., Kong, S. F., Chen, L., Bai, Z., Ji, Y., Liu, J., et al. (2011b). Concentrations, spatial distributions and congener profiles of polychlorinated biphenyls in soils from a coastal city – Tianjin, Chinafiles of polychlorinated biphenyls in soils from a coastal city – Tianjin, China. Chemosphere 85, 494–501. doi:10.1016/j.chemosphere.2011.08.010
Lidia, W., Agata, M., Justyna, R., and Namiesnik, J. (2014). Polychlorinated biphenyls (PCBs) in bottom sediments: Identification of sources. Chemosphere 111, 151–156. doi:10.1016/j.chemosphere.2014.03.025
Lin, M. C., Yu, H. S., Tsai, S. S., Cheng, B. H., Hsu, T. Y., Wu, T. N., et al. (2001). Adverse pregnancy outcome in a petrochemical polluted area in Taiwan. J. Toxicol. Environ. Health A 63 (8), 565–574. doi:10.1080/152873901316857743
Liu, A. X., Lang, Y. H., Xue, L. D., and Liu, J. (2009a). Ecological risk analysis of polycyclic aromatic hydrocarbons (PAHs) in surface sediments from Laizhou Bay. Environ. Monit. Assess. 159 (1-4), 429–436. doi:10.1007/s10661-008-0640-8
Luo, X. M., Liu, C. M., and He, M. C. (2005). Distribution and origin of polycyclic aromatic hdrocarbons (PAHs) in sediment from the Yellow River. Res. Environ. Sci. 18 (2), 48–50.
Mai, B. X., Fu, J. M., Zhang, G., Zheng, L., Yushun, M., Guoying, S., et al. (2001). Polycyclic aromatic hydrocarbons in sediments from the pearl river and estuary, China: Spatial and temporal distribution and sources. Appl. Geochem. 16 (01), 1429–1445. doi:10.1016/s0883-2927(01)00050-6
Melnyk, A., Dettlaff, A., Kukinska, K., Namiesnik, J., and Wolska, L. (2015). Concentration and sources of polycyclic aromatic hydrocarbons (PAHs) and polychlorinated biphenyls (PCBs) in surface soil near a municipal solid waste (MSW) landfill. Sci. Total Environ. 530–531C, 18–27. doi:10.1016/j.scitotenv.2015.05.092
Motelay-Massei, D., Garban, B., Teil, M., Blanchard, M., and Chevreuil, M. (2004). Distribution and spatial trends of PAHs and PCBs in soils in the Seine River basin, France. Chemosphere 55 (4), 555–565. doi:10.1016/j.chemosphere.2003.11.054
Muir, D. C. G., and Norstrom, R. J. (2000). Geographical differences and time trends of persistent organic pollutants in the Arctic. Toxicol. Lett. (Shannon) 112-113 (3), 93–101. doi:10.1016/s0378-4274(99)00255-6
Nadal, M., Schuhmacher, M., and Domingo, J. (2007). Levels of metals, PCBs, PCNs and PAHs in soils of a highly industrialized chemical/petrochemical area: Temporal trend. Chemosphere 66 (2), 267–276. doi:10.1016/j.chemosphere.2006.05.020
Pan, B. J., Hong, Y. J., Chang, G. C., Wang, M. T., Cinkotai, F. F., and Ko, Y. C. (1994). Excess cancer mortality among children and adolescents in residential districts polluted by petrochemical manufacturing plants in Taiwan. J. Toxicol. Environ. Health 43 (1), 117–129. doi:10.1080/15287399409531908
Ross, M. S., Verreault, J., Letcher, R. J., Gabrielsen, G. W., and Wong, C. S. (2008). Chiral organochlorine contaminants in blood and eggs of glaucous gulls (Larus hyperboreus) from the Norwegian Arctic. Environ. Sci. Technol. 42 (19), 7181–7186. doi:10.1021/es8000147
Senthilkumar, K., Kannan, K., Sbramanian, A., and Tanabe, S. (2001). Accumulation of persistent organochlorine pesticides and polychlorinated biphenyls in sediments, aquatic organisms, birds, bird eggs and bats collected from South India. Environ. Sci. Pollut. Res. 8 (1), 35–47. doi:10.1007/BF02987293
Shi, Z., Tao, S., Pan, B., Fan, W., He, X., Zuo, Q., et al. (2005). Contamination of rivers in Tianjin, China by polycyclic aromatic hydrocarbons. Environ. Pollut. 134 (1), 97–111. doi:10.1016/j.envpol.2004.07.014
Silva, D. A. M. D., and Bícego, M. C. (2010). Polycyclic aromatic hydrocarbons and petroleum biomarkers in são sebastião channel, Brazil: Assessment of petroleum contamination. Mar. Environ. Res. 69 (69), 277–286. doi:10.1016/j.marenvres.2009.11.007
Tao, S., Cui, Y. H., Xu, F. L., Li, B., Cao, J., Liu, W., et al. (2004). Polycyclic aromatic hydrocarbons (PAHs) in agricultural soil and vegetables from Tianjin. Sci. Total Environ. 320 (1), 11–24. doi:10.1016/s0048-9697(03)00453-4
Tobiszewski, M., and Namieśnik, J. (2012). PAH diagnostic ratios for the identification of pollution emission sources. Environ. Pollut. 162, 110–119. doi:10.1016/j.envpol.2011.10.025
US EPA (2002). Polycyclic organic metter. Available at: http://www.epa.gov/ttn/atw/hlthef/polycycl.html (Accessed March 10, 2006).
Wang, C. Y., Wang, W. C., He, S., Du, J., and Sun, Z. (2011). Sources and distribution of aliphatic and polycyclic aromatic hydrocarbons in Yellow River Delta nature reserve, China. Appl. Geochem. 26 (8), 1330–1336. doi:10.1016/j.apgeochem.2011.05.006
Wang, W., Massey Simonich, S. L., Xue, M., Zhao, J., Zhang, N., Wang, R., et al. (2010). Concentrations, sources and spatial distribution of polycyclic aromatic hydrocarbons in soils from Beijing, Tianjin and surrounding areas, North China. Environ. Pollut. 158 (5), 1245–1251. doi:10.1016/j.envpol.2010.01.021
Wilcke, W. (2000). Polycyclic aromatic hydrocarbons (PAHs) in soil: A review. J. Plant Nutr. Soil Sci. 163, 229–248. doi:10.1002/1522-2624(200006)163:3<229::aid-jpln229>3.0.co;2-6
Wit, C. A. D., Alaee, M., and Muir, D. C. G. (2006). Levels and trends of brominated flame retardants in the Arctic. Chemosphere 64 (2), 209–233. doi:10.1016/j.chemosphere.2005.12.029
Wolska, L., Mechlińska, A., Rogowska, J., and Namiesnik, J. (2012). Sources and fate of PAHs and PCBs in the marine environment. Crit. Rev. Environ. Sci. Technol. 42 (11), 1172–1189. doi:10.1080/10643389.2011.556546
Wong, M. H., Wu, S. C., Deng, W. J., Yu, X., Luo, Q., Leung, A., et al. (2007). Export of toxic chemicals a review of the case of uncontrolled electronic-waste recycling. Environ. Pollut. 149 (2), 131–140. doi:10.1016/j.envpol.2007.01.044
Xie, W. J., Chen, A. P., Li, J. Y., Liu, Q., Yang, H., Wu, T., et al. (2011). Topsoil dichlorodiphenyltrichloroethane and polychlorinated biphenyl concentrations and sources along an urban-rural gradient in the Yellow River Delta. J. Environ. Sci. 24 (9), 1655–1661. doi:10.1016/s1001-0742(11)60989-3
Xue, W. L., and Warshawsky, D. (2004). Metabolic activation of polycyclic and heterocyclic aromatic hydrocarbons and dna damage: A review. Toxicol. Appl. Pharmacol. 206 (1), 73–93. doi:10.1016/j.taap.2004.11.006
Yang, Z. F., Wang, L. L., Niu, J. F., Wang, J., and Shen, Z. (2009). Pollution assessment and source identifications of polycyclic aromatic hydrocarbons in sediments of the Yellow River Delta, a newly born wetland in China. Environ. Monit. Assess. 158 (1-4), 561–571. doi:10.1007/s10661-008-0603-0
Yu, Y., Li, Y. X., Shen, Z. Y., Yang, Z., Mo, L., Kong, Y., et al. (2014). Occurrence and possible sources of organochlorine pesticides (OCPs) and polychlorinated biphenyls (PCBs) along the Chao River, China. Chemosphere 114 (22), 136–143. doi:10.1016/j.chemosphere.2014.03.095
Yunker, M. B., Macdonald, R. W., Vingarzan, R., Mitchell, R. H., Goyette, D., and Sylvestre, S. (2002). PAHs in the fraser River basin: A critical appraisal of PAH ratios as indicators of PAH source and composition. Org. Geochem. 33 (4), 489–515. doi:10.1016/s0146-6380(02)00002-5
Yunker, M. B., Snowdon, L. R., Macdonald, R. W., Smith, J. N., Fowler, M. G., Skibo, D. N., et al. (1996). Polycyclic aromatic hydrocarbon composition and potential sources for sediment samples from the Beaufort and Barents Seas. Environ. Sci. Technol. 30 (4), 1310–1320. doi:10.1021/es950523k
Zheng, X. Y., Liu, X. D., Jiang, G. B., Wang, Y., Zhang, Q., Cai, Y., et al. (2012). Distribution of PCBs and PBDEs in soils along the altitudinal gradients of Balang Mountain, the east edge of the Tibetan Plateau. Environ. Pollut. 161 (1), 101–106. doi:10.1016/j.envpol.2011.09.036
Zhu, C. F., Li, Y. M., Wang, P., Chen, Z., Ren, D., Ssebugere, P., et al. (2015). Polychlorinated biphenyls (PCBs) and polybrominated biphenyl ethers (PBDEs) in environmental samples from Ny-Ålesund and London Island, Svalbard, the Arctic. Chemosphere 126, 40–46. doi:10.1016/j.chemosphere.2015.01.043
Keywords: polycyclic aromatic hydrocarbons (PAHs), polychlorinated biphenyls (PCBs), proportion, distribution, sources
Citation: Jianrong C, Yanjun L and Sujie Y (2022) The concentrations and sources of PAHs and PCBs in soil from an oil field and estuary in the Yellow River Delta, China. Front. Environ. Sci. 10:1028299. doi: 10.3389/fenvs.2022.1028299
Received: 25 August 2022; Accepted: 15 September 2022;
Published: 06 October 2022.
Edited by:
Yalçın Tepe, Giresun University, TurkeyCopyright © 2022 Jianrong, Yanjun and Sujie. This is an open-access article distributed under the terms of the Creative Commons Attribution License (CC BY). The use, distribution or reproduction in other forums is permitted, provided the original author(s) and the copyright owner(s) are credited and that the original publication in this journal is cited, in accordance with accepted academic practice. No use, distribution or reproduction is permitted which does not comply with these terms.
*Correspondence: Liu Yanjun, bGl1eWFuanVuQGxjdS5ldWQuY24=; Yu Sujie, eXVzdWppZTEwMjhAMTYzLmNvbQ==