
94% of researchers rate our articles as excellent or good
Learn more about the work of our research integrity team to safeguard the quality of each article we publish.
Find out more
ORIGINAL RESEARCH article
Front. Environ. Sci. , 12 October 2022
Sec. Environmental Informatics and Remote Sensing
Volume 10 - 2022 | https://doi.org/10.3389/fenvs.2022.1027423
This article is part of the Research Topic Geo-information for Geohazard and Georisk View all 11 articles
 Fakhrul Islam1
 Salma Riaz2Bushra Ghaffar3
 Aqil Tariq4,5*Safeer Ullah Shah6Muhammad Nawaz7Mian Luqman Hussain8
 Naz Ul Amin9Qingting Li10Linlin Lu11*Munawar Shah12Muhammad Aslam13
Landslides are a recurrent environmental hazard in hilly regions and affect the socioeconomic development in Pakistan. The current study area is the tourism and hydro energy hub of Pakistan and is affected by environmental hazard. A landslide susceptibility mapping (LSM) of the Hindu Kush Himalayan, Swat District, Pakistan, can be created to reduce demographic losses due to landslides. This current study is conducted to apply three bivariate models, including weights of evidence (WOE), frequency ratio (FR), and information value (IV) for an LSM that has not been explored or applied in the current study area. For this purpose, first, an inventory map of 495 landslides was constructed from both ground and satellite data and randomly divided into training (70%) and testing (30%) datasets. Furthermore, 10 conditioning factors (elevation, slope, aspect, curvature, fault, rainfall, land use land cover (LULC), lithology, road, and drainage) used for the mapping of landslides were prepared in ArcGIS 10.8. Finally, LSM is generated based on WOE, FR, and IV models and validated the performance of LSM models using the area under receiver operating characteristic curve (AUROC). The findings of success rate curve (SRC) of the WOE, FR, and IV models were 67%, 93%, and 64%, respectively, while the prediction rate curves (PRCs) of the three models were 87%, 95%, and 73%, respectively. The validation results for WOE, FR, and IV justified that the FR model is the most reliable technique of all three of these models to produce the highest accuracy LSM for the present study area. Policymakers can use the findings of current research work to mitigate the loss due to landslide hazard.
Landslides triggered in mountainous areas can have catastrophic consequences, threaten human life, and cause billions of dollars in economic losses. A landslide is a geological process in which material moves downward from its parent rocks due to slope failure (Zhang et al., 2020; Zhou W. et al., 2021; Yue et al., 2021; Zhu B. et al., 2022). Landslides are the most catastrophic geo-environmental hazard in mountainous regions, severely impacting the world’s socioeconomic trends (Ullah et al., 2022). Landslide hazard is a frequent disaster phenomenon in the mountainous regions in developing countries like Pakistan (Zhang et al., 2019b, 2019a; Wang S. et al., 2021; Quan et al., 2021). Landslide hazard is expected to grow due to anthropogenic interventions such as deforestation, population growth, urbanization, etc. and natural phenomena due to topographic, geologic, and climatic factors (Rahman et al., 2020; Xie et al., 2021a, 2021b; Guo et al., 2022; Ren et al., 2022; Wahla et al., 2022). Since the 20th century, mortality caused landslides has reached 6.2 million and has caused up to 10 billion US dollars of damage. It is essential to assess the anthropogenic and natural predisposing factors of landslides to reduce their consequences in mountainous areas (Raghuvanshi, 2019; Tariq et al., 2021b; Yin et al., 2022a, 2022b; Zhu Z. et al., 2022; Chen et al., 2022).
It is expected that landslides will originate in certain areas due to the combined effects of many causative parameters instead of a single causative factor. Therefore, assessing all-natural and human-induced parameters and their association with landslide inventory can help develop LSM for predicting landslides to minimize the damages of said hazard (Girma et al., 2015; Chimidi et al., 2017; Zhang et al., 2021; Shah et al., 2022). An LSM may be produced based on the postulation that the predisposing factors for the imminent landslide will be the same as in earlier landslides (Pham et al., 2015; Zhou et al., 2021a, 2021b; Sharifi et al., 2022; Zhan et al., 2022). An LSM demarcates the region exposed to landslide hazards and classifies the area into different potential hazard zones by using various approaches to manage the landslide hazard in the region of interest. Researchers have developed various GIS-based techniques for landslide modeling (Pourghasemi et al., 2005; Reichenbach et al., 2018; Tian et al., 2021a; Wang P. et al., 2021, 2022; Fu et al., 2022).
Generally, these methods can be grouped into qualitative and quantitative versions to construct detailed LSM of the area. The qualitative approach is subjectively used by researchers based on their relevant experience and judgment. A quantitative method is an objective-based method in which the inventory of landslides and causative factors is evaluated through mathematical and statistical ways to produce LSM (Milevski et al., 2019; Majeed et al., 2022). Qualitative and quantitative methods can be used to assess landslide inventories and causative factors, and both techniques incorporate various pros and cons in the research (Tian et al., 2019, 2020; Tian et al., 2021b; Chen et al., 2021; Li Y. et al., 2022). Qualitative methods play significant roles in LSMs, but this technique is time-consuming in landslide research (Barredo et al., 2000; Zuhairi et al., 2020; Zhao et al., 2021; Li Q. et al., 2022; Sadiq Fareed et al., 2022). An LSM is generated using quantitative methods like bivariate and multivariate analysis in the modern era due to their high accuracy results and easy implementation. These approaches can compute the impacts of each class of causative factor with landslide events (Lee and Pradhan, 2007; Dahal et al., 2008; Pradhan, 2010; Choi et al., 2012; Park et al., 2013; Vakhshoori and Zare, 2016; Fayez et al., 2018). The GIS-based statistical approach used the association of landslide inventory and predisposing landslide factors to generate LSM (Khanchou et al., 2020; Narimah Samat and Ismail, 2020). This study we used bivariate statistical models, such as weights of evidence (WOE), frequency ratio (FR), and information value (IV), to compute the association between landslide events and causative factors.
In this study, we used bivariate statistical models like WOE, FR, and IV to compute the mathematical association between landslide events and causative factors. These quantitative models quantify the authentic and reliable association between the variables more accurately than in the qualitative and semi-quantitative models. WOE is a GIS-based statistical model that estimates probability using the Bayesian principle and the concepts of prior and posterior probability. This technique is mostly applied in prediction mapping (Elmoulat et al., 2015; Hussain et al., 2022). The FR technique is considered to be a consistent and experimental method that can be used to calculate the association of landslide events with causative factors and to produce applicable LSM of the study area (Oh et al., 2017; Farhan et al., 2022). This model (IV) is a GIS-based bivariate models and has been applied to produce predicted study maps based on dependent and independent variables (Li et al., 2021; Tariq et al., 2021c; Imran et al., 2022).
Swat is Pakistan’s emerging tourism and hydel energy hub and has been affected by terrorism and various natural hazards, i.e., floods, landslides, etc. Many researchers have worked on different hazards using diverse techniques and models. Some researchers have focused on floods, while few have concentrated on slope instability in the Swat region. However, scientists of various fields ignored landslide investigation in the current study area using satellite data, Google Earth Engine (GEE), and geospatial modeling. In this study, we used GIS-RS-based emerging and innovative techniques to fill the research gap in the Hindu Kush Himalaya Ranges in Swat District of Pakistan. We selected this area because it has not been explored and nor investigated by researchers regarding landslide mapping using integrated study of GIS-RS with ground truth information.
The main goal of the present research work is to assess the quantities association of dependent variable (landslide events) with independent variables (causative factors) to generate an accurate, updated LSM of the study area using GIS-RS based methods and precariously emphasize the low, medium, high, and very high zone of landslides in Swat District of Pakistan. Finally, the LSM of models is validated by area under receiver operating characteristic curve (AUROC) technique and by ground data from the field, which can be helpful to decision makers at organizations to reduce the loss to hazard in the study region.
This study is conducted in Swat District of Khyber Pakhtunkhwa (KPK), as shown in Figure 1. Geographically, the Swat District is situated within a latitude and longitude range of 34° 30′ 00″ 34° 30′ 00″’ North and 72° 05′ 00″’ and 72° 50′ 00″’ East, at 500–6,500 m elevation above sea level (Atta-ur-Rahman and Khan, 2011). Topographically, the study area is part of the Hindu Kush Himalayan range (Qasim and Hubacek, 2013), and the tourism hub of KPK has an area of 5,337 km2. The study area is divided into semi-arid, sub-humid, and humid climate regions (Bahadar et al., 2015; Sharifi et al., 2022; Zamani et al., 2022). Geologically the research area is engraved in a Suture Zone (SZ) between the Indian Plate and Kohistan Island Arc (KIA). The SZ between KIA and the Asian Plate occurs on the Northside and is tectonically the most active geomorphic region (Tahirkheli, 1979; Abbas et al., 2021; Hu et al., 2021; Waqas et al., 2021).
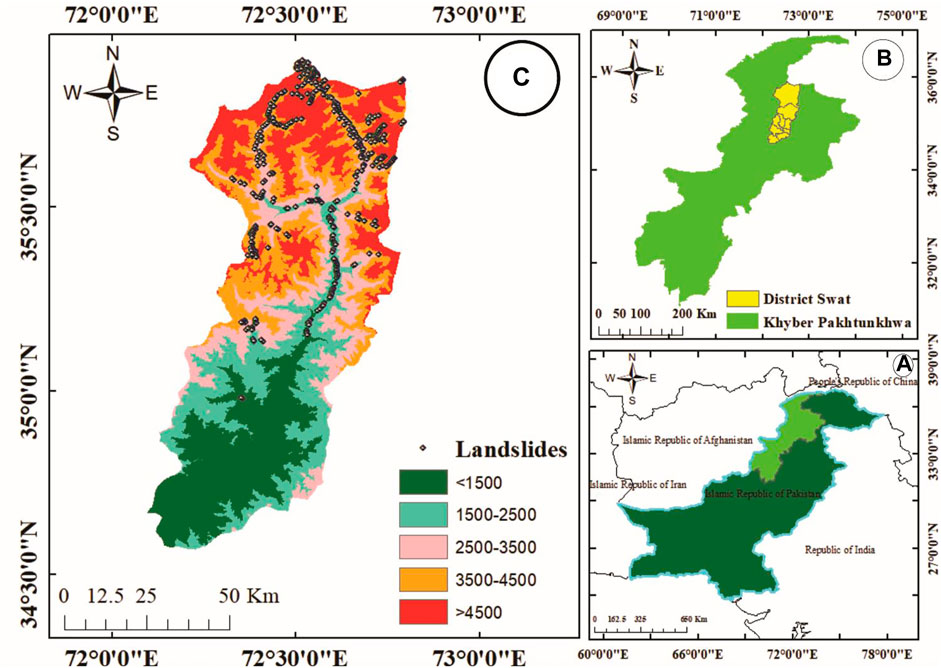
FIGURE 1. Map of the study area along with elevation in meters and spatial location of landslide events: (A) Pakistan administrative boundaries of KPK province; (B) Swat District in KPK shapefile; (C) elevation and landslide inventory of study area.
In this research, we used both satellite and ground datasets to achieve the goal of the present study. The satellite data used in this study was composed of Landsat-8 Operational Land Imager (OLI), Sentinel-2, Advanced Land Observing Satellite Digital Elevation Model (ALOS DEM), Climate Hazards Group InfraRed Precipitation with Station data (CHIRPS), and Google Earth. Landsat-8 images from July 2020 with a spatial resolution of 30 m were used for the LULC classification of the present study area. Sentinel-2 data were used to detect and map landslide events. We used sentinel-2 images with Google Earth and a field survey to produce an updated landslide inventory map. ALOS DEM data were downloaded from Earth data, Alaska Satellite Facility (ASF), to compute the topographic causative factors. CHIRPS data from 2010 to 2020 were used to prepare a rainfall map of the study area.
The ground data consist of rainfall, geological, and road network data. The daily rainfall data from three meteorological stations, i.e., Saidu Sharif (34.73°N, 72.35°E), Kalam (35.52°N, 72.54°), and Malam Jabba (34.83°N, 72.55°E), for 2010–2020 were obtained from Pakistan Meteorological Department (PMD), Peshawar Regional Center (Tariq et al., 2022a; 2022b). The geological map was scanned and digitized from the geological map of northern Pakistan to prepare a lithological and tectonic map of the study area. The updated road data was acquired from KPK Highway Authority (PKHA). The details of both RS and ground datasets of the current study area are mentioned in Table 1. Further details are presented in Figure 2.
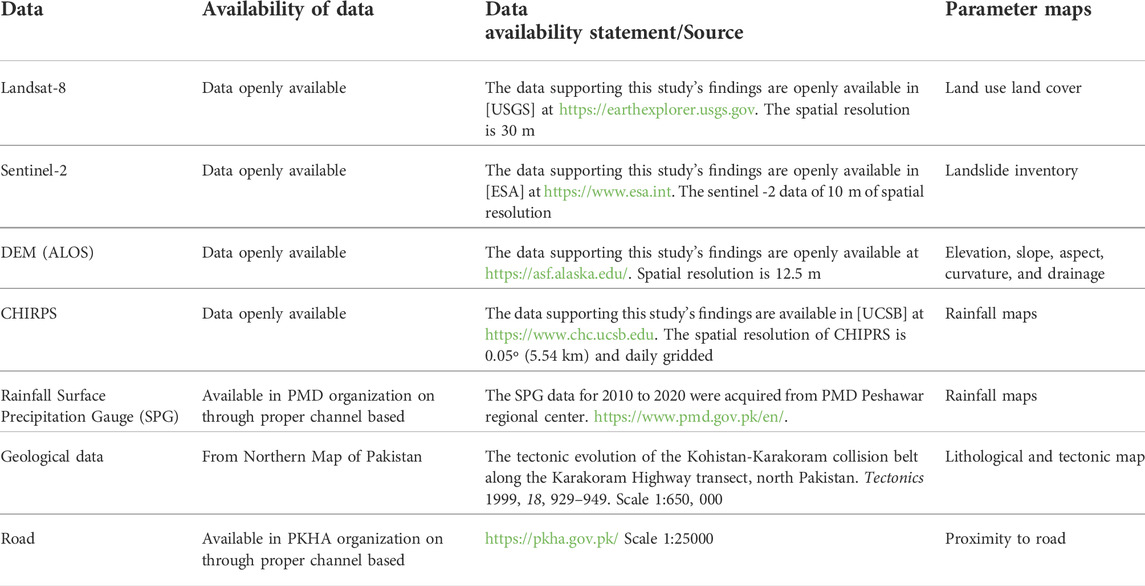
TABLE 1. Detailed RS and ground data availability, statement, source, and purpose.

FIGURE 2. Methodology for GIS and RS-based landslide susceptibility mapping.
Past and current landslide inventory data are a significant factor in predicting landslide potential in a study area (Guzzetti et al., 1995). Therefore, a landslide inventory map is the first mandatory element for generating and compiling authentic LSM of a study area (Aslam et al., 2022a). The inventory map is a significant parameter for performing various quantitative analyses and validating the models’ accuracy (Chalkias et al., 2014; Baloch et al., 2021; Baqa et al., 2021; Shah et al., 2021). The landslide inventory map for this study was developed using Sentinel-2 and Google Earth images and validated with field survey data. In the research area, 495 past and present landslide events were detected from satellite imageries and ground-based data, as shown in Figure 1. After landslide inventory generation, we developed the non-landslide area of the research region. First we extract the landslide polygon from the study area polygon to generate non-landslide area. Then we used ArcGIS tools to produce random points in the study area which have been considered as non-landslide area in the current research. During a field survey we validated the satellite-based inventory of landslide and observed the impacts of various type of landslide on forest, water quality, infrastructure, and human loss. Landslide hazard has had significant effects on the forest and environment of Swat District. This environmental hazard also affected the infrastructure and engineering structures. The impacts of the different type of landslide are shown in Figure 3.
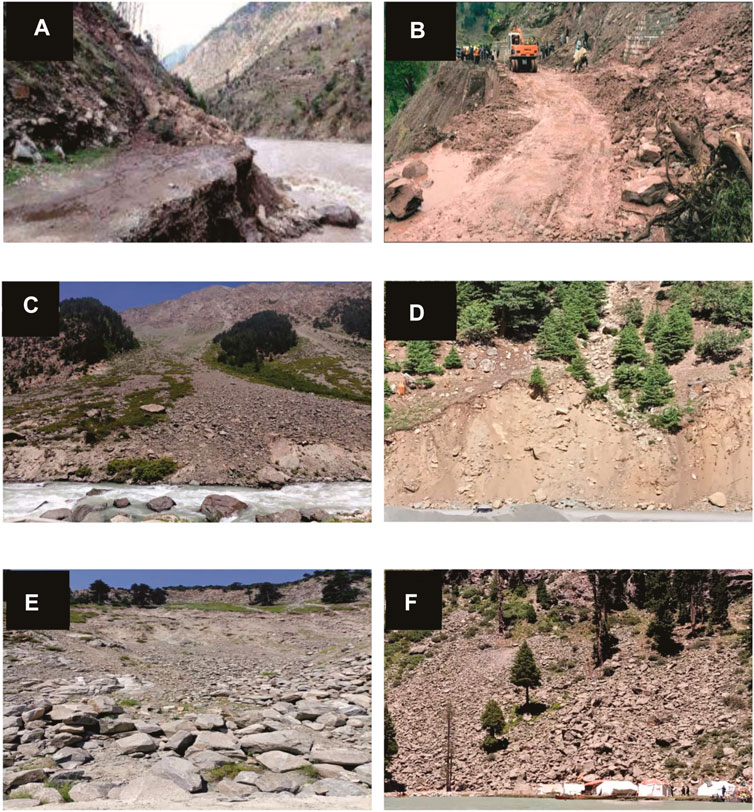
FIGURE 3. Field photographs of the study area showing the impacts of various types of landslide: (A) affected road and water quality; (B) affected road and vegetation; (C) affected water quality and vegetation; (D) affected vegetation; (E) affected road; (F) affected infrastructure.
The incidence of landslides is predisposed by the combined effects of topographic, hydrological, and geological parameters (Costanzo et al., 2012; Marchesini et al., 2014; Tariq and Shu, 2020; Tariq et al., 2021a). Therefore, selecting causative factors is a significant step toward producing LSM. In this paper, We selected 10 precondition factors as independent variables for developing LSM for the region of interest. These factors are elevation, slope, aspect, curvature, precipitation, land use land cover (LULC), proximity to the fault, lithology, road proximity, and drainage network. In the following paragraphs, we briefly present the significance of each causative factor in the LSM. The details of causative factors are as follows.
Elevation is an influential precondition for landslide incidence (Tosic et al., 2014). Altitude is used for landslide susceptibility mapping and investigation (Dou et al., 2015). Elevation was extracted from advanced land observation satellite (ALOS) with a 12.5 m spatial resolution and reclassified into different classes using the natural break algorithm in ArcGIS 10.8, as shown in Figure 4A.
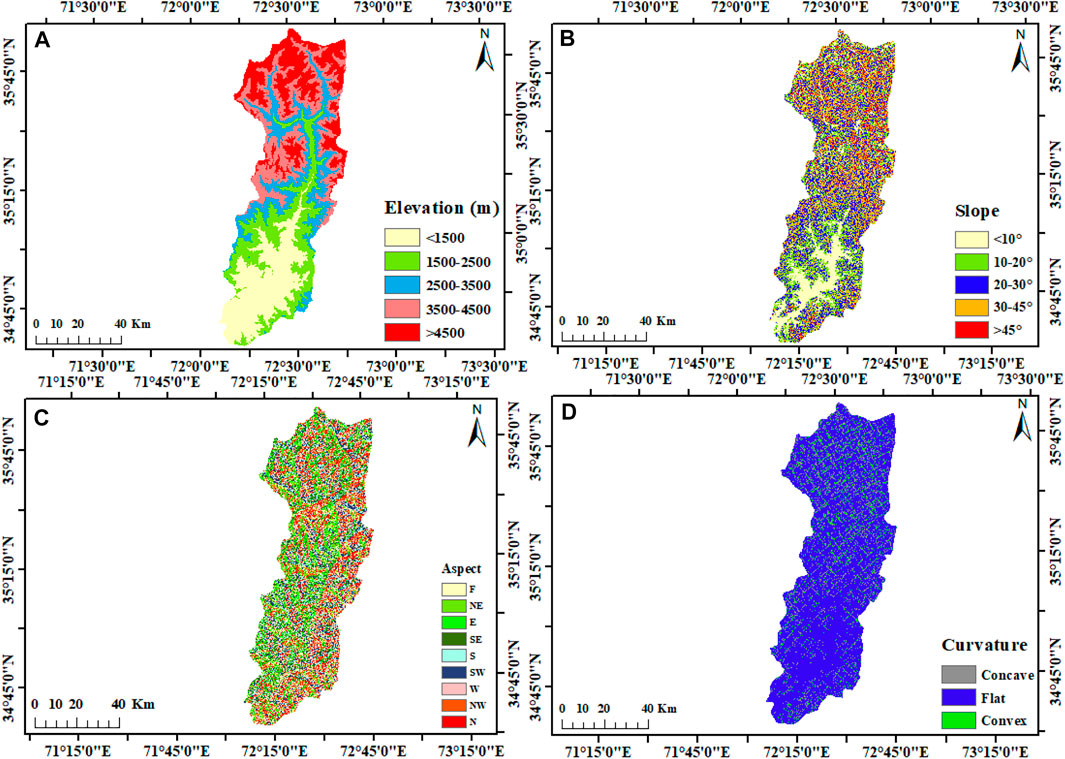
FIGURE 4. Topographic parameters derived from DEM for LSM: (A) elevation map; (B) slope map; (C) aspect map; (D) curvature map for the study area.
The slope is a crucial causative factor in landslide investigation because it triggers the downslope movement of loose sediment material (Nolasco-Javier et al., 2015). The slope of the current study area was computed from ALOS DEM having 12.5 m spatial resolution. The calculated slope was then reclassified into five classes in ArcGIS 10.8, as shown in Figure 4B.
Aspect also plays an influential role in the instability of strata because it controls moisture in the rocks and soil due to wind and sunlight exposure in the study area. The slope aspect map in the current study area was calculated from ALOS DEM using ArcGIS 10.8 and reclassified into nine classes, as shown in Figure 4C.
The curvature is a morphological parameter and has a significant role in LSM. The geomorphic structures of the terrain can be classified based on curvature style (Pourghasemi et al., 2013). Curvature affects surface water flow and regulates landslides (Pham et al., 2019). The curvature of the current study area was extracted from ALOS DEM and reclassified into three classes, i.e., using ArcGIS 10.8 platform as shown in Figure 4D.
Precipitation is a triggering parameter for landslide occurrence globally (Hong et al., 2017; Tariq et al., 2021a; Farhan et al., 2022). Precipitation infiltrates the pore spaces and fractures of strata and affects the landslide frequency (Dou et al., 2015). The rainfall map of the current research was generated from CHIRPS satellite data and validated with ground data of PMD, as shown in Figure 5A. The rainfall map was rescaled to a 12.5 m resolution using the ArcGIS platform.
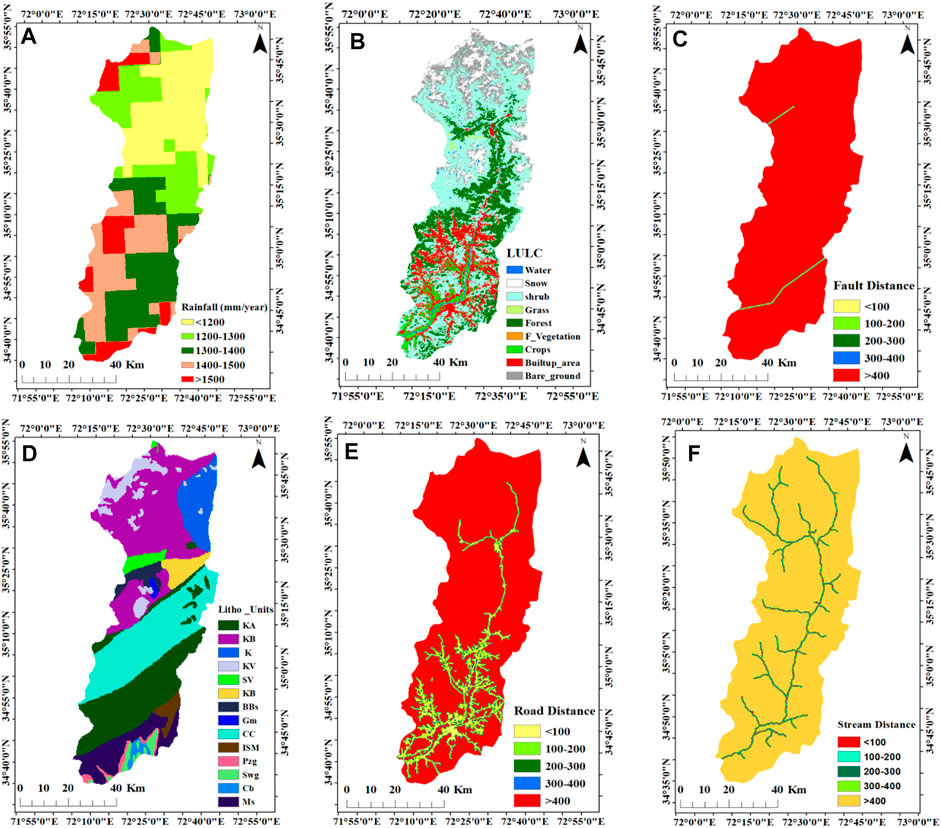
FIGURE 5. Different parameters for landslide susceptibility mapping: (A) precipitation map; (B) LULC map; (C) fault buffer; (D) lithological map; (E) road buffer; (F) stream buffer.
Many scientists have evaluated the impacts of LULC change in landslide investigation (Miller et al., 2009). LULC was computed from Landsat eight images using GEE, as shown in Figure 5B. LULC parameter was rescaled to 12.5 m spatial resolution to run model smoothly.
The geological fault is generally considered the external causative factor in regulating the instability of beds and landslide occurrence. The tectonic map of the study area was scanned and digitized from the geological map of northern Pakistan (Searle et al., 1999), as shown in Figure 5C. The fault map was rescaled to same spatial resolution as ALOS DEM.
Lithology is a crucial predisposing factor for landslides through stresses in the geological mass body (De Vallejo and Ferrer, 2011). Geology is the significant and prominent internal contributory factor in landslide susceptibility mapping (Abdollahi et al., 2019). The consolidated and compacted rocks show more resistance to mass wasting than loose rocks. A lithological map of the study area polygon vector maps was prepared and digitized from the geological map of northern Pakistan and rescaled to 12.5 m resolution, as shown in Figure 5D.
Road construction is considered a human-induced factor for slope instability (Wu and Chen, 2009). The road network map is a polyline vector produced from the data of PKHA, as shown in Figure 5E. According to the literature, the spatial resolution of road map was rescaled to the resolution of ALOS-DEM to perform well.
Hydrology is a significant and influencing external parameter in the instability of strata to trigger landslides in the area. Another critical factor in the formation of landslides (Pham et al., 2015). The surface drainage network is considered one of the most active and crucial factors in landslide occurrence (Tosic et al., 2014). This parameter was computed from ALOS DEM 12.5 m resolution and divided the distance from drainage to landslide into five classes, as shown in Figure 5F.
Appropriate terrain mapping is important in generating the LSM of the study area (Aslam et al., 2022b). We used WoE, FR, and IV techniques to compute LSM for the study area. The details of the mentioned methods are as follows.
WOE is a bivariate statistical model that uses the Bayesian rule to estimate probability, adopting the concepts of prior and posterior probability (Elmoulat et al., 2015). Researchers have used this method for mineral exploration mapping. Later on, this method was widely used in landslide prediction mapping due to its authentic results compared to field and other deterministic approaches (Cao et al., 2021).
In this technique, positive (W+) and negative (W−) weights are given to different classes of causative factors and computed from Eq. 2.
In Eq. 2, h shows probability, and ln denotes the natural log. B denotes the presence of the landslide evidence parameter B ̅on appearance of the landslide evidence parameter. Similarly,
We further used Eq. 3 to evaluate the impacts of causative factors on LS occurrence.
where
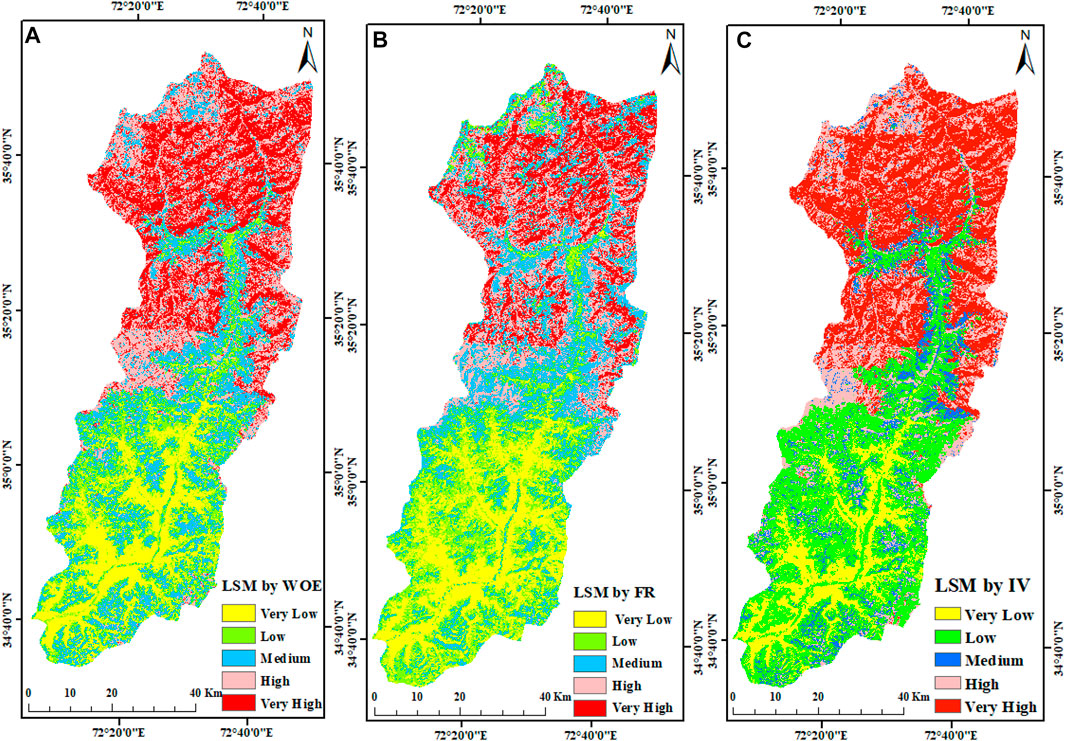
FIGURE 6. Landslide susceptibility mapping derived from bivariate models: (A) LSM by WOE; (B) LSM by FR; (C) LSM by IV.
The FR model is considered to be among the best bivariate statistical models for use in computing the spatial association between two variables (Oh et al., 2017). This statistical method is a reliable experimental technique to produce LSM in the research area (Fayez et al., 2018). Eq. 5 is used to calculate the FR for each factor.
where FR = frequency ratio,
The following mathematical representation is used to generate LSI for the region of interest.
The expression
In this work, the IV method generates the LSM of the study area. This statistically based GIS technique predicts the spatial association between landslide inventory and classes of predisposing factors (Li et al., 2021).
This analysis can be achieved through the following calculation:
where W denotes the weight of the causative factor for landslides.
where
In this research, 495 landslide events were detected by the integrated interpretation of satellite imageries and ground-based data in the study area. The spatial distribution of landslide events is given in Figure 1. These landslide events consist of different types of landslides, i.e., mudflow, debris, rockfall, rockslide, topple, and creep. In the current study, three bivariate models are applied to produce the LSM of the study area. The details of the results for each model are shown in Table 2. The comprehensive, detailed description of Table 2 is as follows.
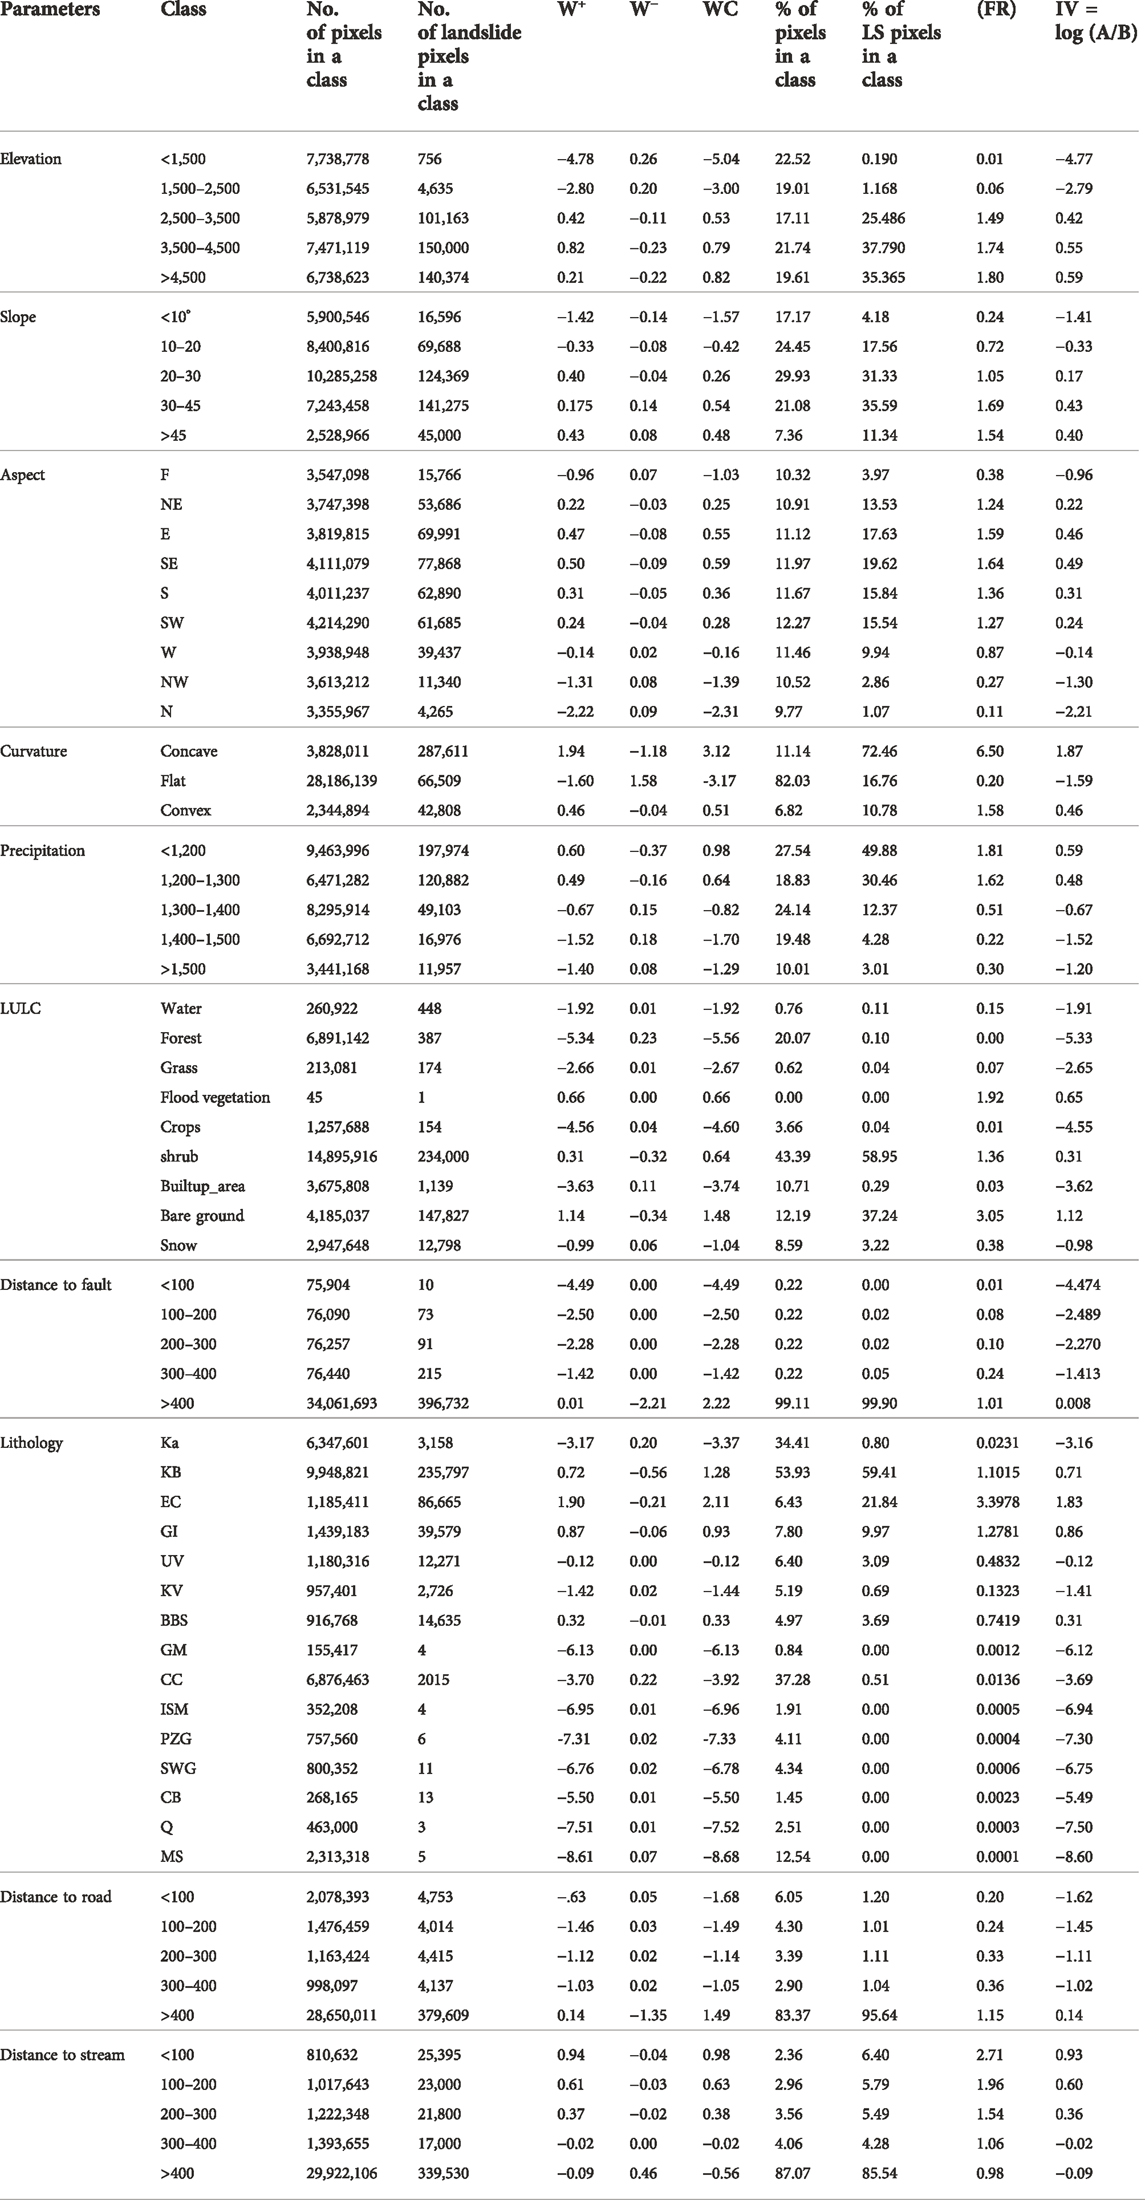
TABLE 2. Detailed analysis of different causative parameters with landslide events using bivariate models (IV, FR, and WoE) to understand the impacts of each class in LSM.
The elevation parameters used in the current study represent a strong association with landslide events. The most influential class of elevation is >4,500 m, followed by 3,500–4,500 m and 2,500–3,500 m. The < 1,500 m class of elevation is less susceptible. The independent variable, i.e., the slope, is considered the crucial factor in the present study. The slope factor is influential up to 45° because as slope increases, landslide occurrence also increases, but above 45°, landslide activity declines with increasing slope, as shown in Table 2. The results revealed that 30°–45° is the most susceptible class of slope while, slopes of <10° are the most resistant to landslide, followed by 10°–20° class of slope. Table 2 indicates that SE is the most crucial class of aspects, followed by E, S, and SW. The tabulated results explained that concave structure is the critical class of landslides, as noted in Table 2. In the present study, a rainfall map was generated from CHIRPS data, validated with ground-based data, and then reclassified into five classes to evaluate the association of rainfall parameters with landslide events. As shown in Table 2 for precipitation, the results indicated that rainfall is a significant factor for landslides. The results revealed that <1,200 mm/year precipitation class is the censorious class for landslide, followed by 1,200–1,300, 1,300–1,400, 1,400–1,500, and >1,500 mm/year. In the current research, the tabulated results clearly explained that every class of LULC has diverse impacts on landslide events. The results of Table 2 show that the barren land and flooded vegetation of the present study area is most susceptible to landslides. The forest and built-up area show greater resistance to landslides in the study area than other classes of LULC.
The results of the present study demonstrate that faults have no direct influence on landslide occurrence, as shown in Table 2. The results illustrate that very a smaller number of landslide pixels occurred in a <100 m buffer zone near the fault, i.e., values of −4.49, 0.01, and −4.47 for WOE, FR, and IV, respectively. The most vulnerable buffer zone of a geological fault is >400 m, as most landslide events occur in this buffer region. The WOE, FR, and IV models for the >400 m buffer are 2.22, 1.01, and 0.008, respectively.
The results prove that lithology is a significant causative factor for landslide investigation. As shown in Table 2, EC is the most susceptible geological formation for landslides, followed by GI and KB. The output results of bivariate models for road association with landslide events, as shown in Table 2, indicate that the road network has no direct impact on the instability of strata. The <100 m buffer zone of road network is not susceptible to landslides in the study area. No direct association can be observed between the dependent variable and the road network. The >400 m buffer zone of the road network is most susceptible to landslides with values of 1.49, 1.15, and 0.14 for the WOE, FR, and IV models.
The results for landslide events and stream networks show that both variables feature a substantial direct association with each other, because in this study, we observed that most landslide events and landslide pixels occurred near streams, while smaller numbers of landslide events were observed far from drainage. The bivariate statistical results revealed that a <100 m buffer from the stream network is the most susceptible class to landslide occurrence followed by 100–200 m and 200–300 m. The WOE, FR, and IV models values of −0.56, 0.98, and −0.09 revealed that both dependent variable and independent variables in the >400 m buffer zone are not susceptible to landslide.
The tabulated analysis concluded that the concave structure is the most crucial class for landslide occurrence, followed by lithology, barren land, stream network, and elevation. The influential factors for the WOE results mentioned above are 3.12, 2.11, 1.48, 0.98, and 0.82, respectively. The FR model results for concave, lithology, bare ground, stream network, and elevation are 6.50, 3.39, 3.05, 2.71, and 1.80, respectively. The IV model values for concave, lithology, bare ground, stream network, and elevation are 1.87, 1.83, 1.12, 0.93, and 0.59.
This study used GIS-based statistical analysis of various causative factors with landslide events in ArcGIS 10.8 to produce the LSM of the research area, as shown in Figure 6. These were reclassified into five classes, i.e., very low, low, high, and very high. The LSM produced by WOE, as shown in Figure 6A, indicated that the major portion of the north region of the study area is highly susceptible to landslides, followed by high and moderate susceptibility class of landslides, while the south region of the LSM is occupied has low and low susceptibility classes. The south region of the study area is safe according to results of WOE model. The final LSM generated by FR model, as shown in Figure 6B, reveals that the most northern area of LSM is exposed to very high, high, moderate susceptibility. By contrast to the WOE model in the results for this technique, we observe some low and very low susceptibility zones in the region of the study area. The resulting map of the IV model is different from both mentioned models. In this LSM map, the north region is mostly susceptible to the very high and high class. The very low zone is not mentioned in the north region, and the moderate class is negligible in this LSM relative to WOE and FR. The WOE and FR on this LSM of the IV model contains low and very low class of susceptibility in the north region, which was not identified in the previous two models. The south portion of LSM, generated by the IV model, consists of very low and low susceptibility class and contains some high zones that are not mentioned in the previous model amps. Beyond the north and south zones of the LSM, the central region of the WOE and FR models are mostly susceptible to high and moderate susceptibilities, while some areas have low and very high classes as well. In the LSM generated by IV model the central region is mostly susceptible to low class. According to the IV model, the central region is safe.
To validate the performance of bivariate models, we used the AUROC method. The validation graphs of WOE, FR, and IV are shown in Figure 7 using 30% of landslide inventory data. AUC chart for the WOE model showed that the SRC and PRC values of the model are 67.3% and 87%, respectively. The SRC and PRC graphs for the WOE model are shown in Figures 7A,B. The validation charts of the FR bivariate model illustrate values of 0.93 and 0.95 for the SRC and PRC, respectively. Based on training and validation data, these SRC and PRC values can be represented in percentage format, i.e., 93% and 95%, respectively. The SRC and PRC graphs are illustrated in Figures 7C,D. The visual record for the IV model revealed that the chart values were 0.64 and 0.73 for SRC and PRC, respectively meant that the model accuracy is 64% and 73.85%. The SRC and PRC graphical representation for the IV model is shown in Figures 7E,F. The validation outcomes of WOE, FR, and IV indicate that the FR is a reliable model to produce LSM for the present study area.
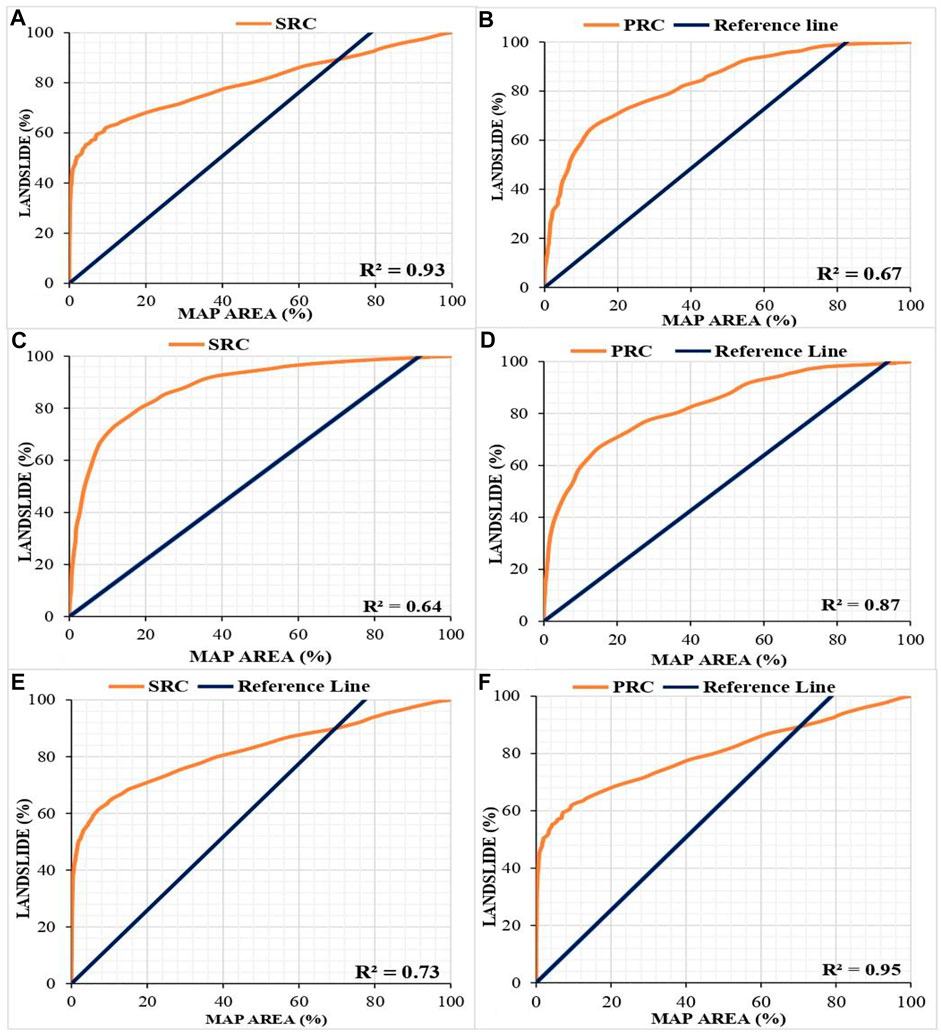
FIGURE 7. Success rate curve (SRC) and predicted rate curve (PRC) for WOE, FR, and IV model: (A) SRC for WOE; (B) PRC for WOE; (C) SRC for FR model; (D) PRC for FR model; (E) SRC for IV; (F) PRC for IV.
Landslide development is a multifaceted phenomenon because it is triggered and predisposed by various natural and human-induced factors (Chen et al., 2019). In this study, LSM was generated using geospatial techniques based on landslide events and predisposing factors (elevation, slope, aspect, curvature, precipitation, LULC, distance to fault, lithology, distance to road, and distance to streams) to mitigate current and future hazard impacts. All 10 causative factors were considered important because they were selected and prepared according to the literature, but some parameters are more influential than others. First of all, we prepared an inventory map using satellite and ground-based data. The topographic factors of altitude, slope, aspect, and curvature are reflected as the influential parameters for landslides (Alkhasawneh et al., 2013; Tariq et al., 2020; Ghaderizadeh et al., 2021). This paper focused on topographic causative factors that are associated with landslide events, and a tabulated explanation is given in Table 2. The outcome results of topographic parameters in this study prove that these are the most influential independent variables for landslide occurrence. The results section of this paper indicates that curvature, lithology, barren ground, stream network, and elevation are the most significant parameters, while the contribution of other factors also can never be ignored. The concave curvature is more strongly associated with landslide events than convex structures (Xu et al., 2014). The results of the present study clearly showed that concave structure is mainly affected by landslides than convex curvature.
The precipitation is the most influential external triggering factor for landslides but also depend on the lithology, slope, and LULC of the study area (Silalahi et al., 2019). In the present study heavy precipitation occurred in the hilly region which have compacted lithology and vegetation cover, so the area was not affected by landslide hazard. In the same study area some region have low precipitation with major landslide because low precipitation area was occupied by loose lithology and barren land.
The LSM literature indicates that lithology is often considered an influential factor (Segoni et al., 2020). The findings this analysis agree that lithology is an influential and significant internal factors in LSM. The literature suggests that barren class of land cover is the most influential triggering factor in landslide occurrence (Khan et al., 2019). The findings of this study confirm that barren land is the susceptible class of land cover for a landslide. The last causative factor found in this research but not the least is drainage network, which is an external influential causative factor in landslide occurrence (Pradhan et al., 2012). This study revealed strongly positive correlation of drainage with landslides. During a field survey, we validated ground truth information with GIS-based models and concluded that all landslide-affecting factors contribute to landslide occurrence, but curvature, lithology, barren ground, stream network, and elevation are the most trigging causative factors of landslides in the current study area.
In the current paper, lithology was proven to have a crucial role in landslide occurrence. The literature indicates that bare ground is more susceptible to landslide occurrence (Khan et al., 2019). This paper also showed that barren land is the most susceptible class to landslides, with values of 1.48, 3.05, and 1.12 for WOE, FR, and IV. The drainage network is an influential factor in a landslide (Pradhan et al., 2012), and in this study, drainage is strongly associated with landslide events.
The outcomes demonstrated that the findings of success rate curve (SRC) of the WOE, FR, and IV models were 67%, 93%, and 64%, respectively, while the prediction rate curve (PRC) of the three models were 87%, 95%, and 73%, respectively. In the current research, the FR model has 93% and 95% values for SRC and PRC, respectively, and produces the best prediction mapping of the landslide, as shown in Figure 6B. The WOE model also made a good prediction map for the study area. In contrast, the IV model has not produced satisfactory results.
Geoscientists have adopted various statistical models in numerous regions and attained different findings. This type of discrepancy is mostly due to weight differences, along with the selection of models and causative factors. Therefore, landslide detection, the selection of landslide-affecting factors, and appropriate models for the study area is very important for reducing uncertainty in model processing and prediction (Pham et al., 2019). This is because GIS-based models depend upon the reliability and quality of input data. In this research, we used quantitative models and achieved superior accuracy to qualitative and semi-quantitative methods.
This research was designed to generate an LSM of the study area using geospatial techniques to mitigate the consequences of hazards. Three GIS-based statistical models, i.e., WOE, FR, and IV, were applied in the current research to compute the association of dependent variables (landslide causative factors) and dependent variables (landslide events/inventory). The study results delivered significant evidence concerning landslide existence in the study area. The results explained landslides instigated by various causative factors in the study area. This study was executed to identify regions susceptible to landslides and classify them into deficient, low, medium, high, and very high zones to alleviate their consequences, using geospatial techniques. This research was conducted to evaluate the association of causative factors with landslide occurrence. These parameters were topographic, geologic, hydrologic, climatic, and geomorphic. The three GIS-based statistical models were used to investigate the association of landslide occurrence with causative factors to produce LSM.
From the above discussion and due to the results of analysis, we concluded that the highest value for LSM in the current research area by bivariate analysis was the value of curvature, lithology, barren ground, stream network, and elevation. The most susceptible class of curvature was a concave structure having values of 3.12, 6.50, and 3.12 values for the WOE, FR and IV models, respectively. The WOE, FR, and IV models for flat class were −3.17, 0.20, and −1.59, respectively, which shows that it is the most less susceptible class. The results revealed that the EC is the most susceptible formation in the current study, having association values of 2.11, 3.39, and 1.83 for the WOE, FR, and IV models, respectively. The results concluded that barren land the association values were WOE, FR, and IV are 1.48, 3.05, and 1.12. The tabulated analysis revealed that <100 m buffer zone of the stream network was most susceptible to landslide occurrence. The analytical results for this buffer zone of WOE, FR, and IV were 0.98, 2.71, and 0.93, respectively.
The validation results, i.e., SRC and PRC for the WOE, FR, and IV models, were 0.67, 0.87, 0.93, 0.95, 0.64, and 0.73, respectively. The validation results revealed that FR model is a credible method for the LSM, as this model showed accuracies of 0.93 and 0.95 for SRC and PRC, respectively. It can be concluded that GIS-based statistical modeling is the most reliable, flexible, and authentic method for generating LSM. Various organizations can use the final LSM of the bivariate models to reduce the effects of landslide hazards in the study area.
The original contributions presented in the study are included in the article/Supplementary Material. Further inquiries can be directed to the corresponding authors.
Fl: Conceptualization, Methodology, Validation, Formal analysis, Investigation, Data curation, Writing – original draft, Visualization. SR: Writing – review and editing, Visualization. BG: Writing – review and editing, Visualization. AT: Conceptualization, Methodology, Validation, Formal analysis, Investigation, Data curation, Writing – original draft, Visualization, Supervision, Project administration. SUS: Writing – review and editing, Visualization. MN: Writing – review and editing, Visualization. MLH: Writing – review and editing, Visualization. NUA: Writing – review and editing, Visualization. QL: Writing – review and editing, Visualization, Project administration, Funding. LL: Writing – review and editing, Visualization, Project administration, Funding. MS: Writing – review and editing, Visualization. MA: Writing – review and editing, Visualization.
This work is supported by the National Natural Science Foundation of China (grant no. 41901292 and grant no. 42071321).
The authors declare that the research was conducted in the absence of any commercial or financial relationships that could be construed as a potential conflict of interest.
All claims expressed in this article are solely those of the authors and do not necessarily represent those of their affiliated organizations, or those of the publisher, the editors, and the reviewers. Any product that may be evaluated in this article, or claim that may be made by its manufacturer, is not guaranteed or endorsed by the publisher.
Pham, B. T., Bui, D. T., Prakash, I., and Dholakia, M. B. (2015). Landslide susceptibility assessment at a part of uttarakhand Himalaya, India using GIS – based statistical approach of frequency ratio method. Int. J. Eng. Res. 4. doi:10.17577/ijertv4is110285
Abbas, I., Liu, J., Amin, M., Tariq, A., and Tunio, M. H. (2021). Strawberry fungal leaf scorch disease identification in real-time strawberry field using deep learning architectures. Plants 10, 2643. doi:10.3390/plants10122643
Abdollahi, S., Pourghasemi, H. R., Ghanbarian, G. A., and Safaeian, R. (2019). Prioritization of effective factors in the occurrence of land subsidence and its susceptibility mapping using an SVM model and their different kernel functions. Bull. Eng. Geol. Environ. 78, 4017–4034. doi:10.1007/s10064-018-1403-6
Alkhasawneh, M. S., Ngah, U. K., Tay, L. T., Mat Isa, N. A., and Al-Batah, M. S. (2013). Determination of important topographic factors for landslide mapping analysis using MLP network. Sci. World J. 2013, 1–12. doi:10.1155/2013/415023
Aslam, B., Maqsoom, A., Khalil, U., Ghorbanzadeh, O., Blaschke, T., Farooq, D., et al. (2022a). Evaluation of different landslide susceptibility models for a local scale in the chitral district, northern Pakistan. Sensors 22, 3107. doi:10.3390/s22093107
Aslam, B., Zafar, A., and Khalil, U. (2022b). Comparative analysis of multiple conventional neural networks for landslide susceptibility mapping. Netherlands: Springer. doi:10.1007/s11069-022-05570-x
Atta-ur-Rahman, A., and Khan, A. N. (2011). Analysis of flood causes and associated socio-economic damages in the Hindukush region. Nat. Hazards 59, 1239–1260. doi:10.1007/s11069-011-9830-8
Bahadar, I., Shafique, M., Khan, T., Tabassum, I., and Ali, M. Z. (2015). Flood hazard assessment using hydro-dynamic model and GIS/RS tools: A case study of babuzai-kabal tehsil swat basin, Pakistan. J. Himal. Earth Sci. 48, 129–138.
Baloch, M. Y. J., Zhang, W., Chai, J., Li, S., Alqurashi, M., Rehman, G., et al. (2021). Shallow groundwater quality assessment and its suitability analysis for drinking and irrigation purposes. WaterSwitzerl. 13, 3361–3425. doi:10.3390/w13233361
Baqa, M. F., Chen, F., Lu, L., Qureshi, S., Tariq, A., Wang, S., et al. (2021). Monitoring and modeling the patterns and trends of urban growth using urban sprawl matrix and CA-markov model: A case study of karachi, Pakistan. Land 10 (7), 700. doi:10.3390/land10070700
Barredo, J. I., Benavides, A., Hervás, J., and Van Westen, C. J. (2000). Comparing heuristic landslide hazard assessment techniques using GIS in the Tirajana basin, Gran Canaria Island, Spain. Int. J. Appl. Earth Obs. Geoinf. 2000, 9–23. doi:10.1016/s0303-2434(00)85022-9
Cao, Y., Wei, X., Fan, W., Nan, Y., Xiong, W., and Zhang, S. (2021). Landslide susceptibility assessment using the weight of evidence method: A case study in xunyang area, China. PLoS One 16, 02456688–e245718. doi:10.1371/journal.pone.0245668
Chalkias, C., Ferentinou, M., and Polykretis, C. (2014). GIS-based landslide susceptibility mapping on the Peloponnese Peninsula, Greece. Geosci. (Basel). 4, 176–190. doi:10.3390/geosciences4030176
Chen, J., Du, L., and Guo, Y. (2021). Label constrained convolutional factor analysis for classification with limited training samples. Inf. Sci. (N. Y). 544, 372–394. doi:10.1016/j.ins.2020.08.048
Chen, W., Panahi, M., Tsangaratos, P., Shahabi, H., Ilia, I., Panahi, S., et al. (2019). Applying population-based evolutionary algorithms and a neuro-fuzzy system for modeling landslide susceptibility. Catena 172, 212–231. doi:10.1016/j.catena.2018.08.025
Chen, Z., Liu, Z., Yin, L., and Zheng, W. (2022). Statistical analysis of regional air temperature characteristics before and after dam construction. Urban Clim. 41, 101085. doi:10.1016/j.uclim.2022.101085
Chimidi, G., Raghuvanshi, T. K., and Suryabhagavan, K. V. (2017). Landslide hazard evaluation and zonation in and around gimbi town, Western Ethiopia—A GIS-based statistical approach. Appl. Geomat. 9, 219–236. doi:10.1007/s12518-017-0195-x
Choi, J., Oh, H. J., Lee, H. J., Lee, C., and Lee, S. (2012). Combining landslide susceptibility maps obtained from frequency ratio, logistic regression, and artificial neural network models using ASTER images and GIS. Eng. Geol. 124, 12–23. doi:10.1016/j.enggeo.2011.09.011
Costanzo, D., Rotigliano, E., Irigaray, C., Jiménez-Perálvarez, J. D., and Chacón, J. (2012). Factors selection in landslide susceptibility modelling on large scale following the gis matrix method: Application to the river Beiro basin (Spain). Nat. Hazards Earth Syst. Sci. 12, 327–340. doi:10.5194/nhess-12-327-2012
Dahal, R. K., Hasegawa, S., Nonomura, A., Yamanaka, M., Dhakal, S., and Paudyal, P. (2008). Predictive modelling of rainfall-induced landslide hazard in the Lesser Himalaya of Nepal based on weights-of-evidence. Geomorphology 102, 496–510. doi:10.1016/j.geomorph.2008.05.041
De Vallejo, L. G., and Ferrer, M. (2011). Geological engineering. London: Geological Engineering. CRC Press.
Dou, J., Bui, D. T., Yunus, A. P., Jia, K., Song, X., Revhaug, I., et al. (2015). Optimization of causative factors for landslide susceptibility evaluation using remote sensing and GIS data in parts of Niigata, Japan. PLoS One 10, e0133262. doi:10.1371/journal.pone.0133262
Elmoulat, M., Ait Brahim, L., Mastere, M., and Ilham Jemmah, A. (2015). Mapping of mass movements susceptibility in the zoumi region using satellite image and GIS technology (Moroccan rif). Int. J. Sci. Eng. Res. 6.
Farhan, M., Moazzam, U., Rahman, G., Munawar, S., Tariq, A., Safdar, Q., et al. (2022). Trends of rainfall variability and drought monitoring using standardized precipitation index in a scarcely gauged basin of northern Pakistan. Water 14, 1132. doi:10.3390/w14071132
Fayez, L., Pazhman, D., Pham, B. T., Dholakia, M. B., Solanki, H. A., Khalid, M., et al. (2018). Application of frequency ratio model for the development of landslide susceptibility mapping at part of uttarakhand state, India. Int. J. Appl. Eng. Res. 13, 6846–6854.
Fu, C., Cheng, L., Qin, S., Tariq, A., Liu, P., Zou, K., et al. (2022). Timely plastic-mulched cropland extraction method from complex mixed surfaces in arid regions. Remote Sens. (Basel). 14, 4051. doi:10.3390/rs14164051
Ghaderizadeh, S., Abbasi-Moghadam, D., Sharifi, A., Zhao, N., and Tariq, A. (2021). Hyperspectral image classification using a hybrid 3D-2D convolutional neural networks. IEEE J. Sel. Top. Appl. Earth Obs. Remote Sens. 14, 7570–7588. doi:10.1109/JSTARS.2021.3099118
Girma, F., Raghuvanshi, T. K., Ayenew, T., and Hailemariam, T. (2015). Landslide hazard zonation in Ada Berga District, Central Ethiopia–a GIS based statistical approach. J. Geom. 9, 25–38.
Guo, Y., Yang, Y., Kong, Z., and He, J. (2022). Development of similar materials for liquid-solid coupling and its application in water outburst and mud outburst model test of deep tunnel. Geofluids 2022, 1–12. doi:10.1155/2022/8784398
Guzzetti, F., Carrara, A., Cardinali, M., and Reichenbach, P. (1995). Stern, 1991] and one of the NAVZ (Northern Austral Vol- canic Zone) volcanic events [3010 yr. Geomorphology 13, 1995.
Hong, H., Chen, W., Xu, C., Youssef, A. M., Pradhan, B., and Tien Bui, D. (2017). Rainfall-induced landslide susceptibility assessment at the Chongren area (China) using frequency ratio, certainty factor, and index of entropy. Geocarto Int. 32, 1–16. doi:10.1080/10106049.2015.1130086
Hu, P., Sharifi, A., Tahir, M. N., Tariq, A., Zhang, L., Mumtaz, F., et al. (2021). Evaluation of vegetation indices and phenological metrics using time-series modis data for monitoring vegetation change in Punjab, Pakistan. WaterSwitzerl. 13, 2550–2615. doi:10.3390/w13182550
Hussain, S., Lu, L., Mubeen, M., Nasim, W., Karuppannan, S., Fahad, S., et al. (2022). Spatiotemporal variation in land use land cover in the response to local climate change using multispectral remote sensing data. Land 11, 595. doi:10.3390/land11050595
Imran, M., Ahmad, S., Sattar, A., and Tariq, A. (2022). Mapping sequences and mineral deposits in poorly exposed lithologies of inaccessible regions in Azad Jammu and Kashmir using SVM with ASTER satellite data. Arab. J. Geosci. 15, 538. doi:10.1007/s12517-022-09806-9
Khan, H., Shafique, M., Khan, M. A., Bacha, M. A., Shah, S. U., and Calligaris, C. (2019). Landslide susceptibility assessment using Frequency Ratio, a case study of northern Pakistan. Egypt. J. Remote Sens. Space Sci. 22, 11–24. doi:10.1016/j.ejrs.2018.03.004
Khanchoul, K., Balla, F., and Othmani, O. (2020). Assessment of soil erosion by rusle model using gis: A case study of chemorah basin, Algeria. Malays. J. Geosci. 4, 70–78. doi:10.26480/mjg.02.2020.70.78
Lee, S., and Pradhan, B. (2007). Landslide hazard mapping at Selangor, Malaysia using frequency ratio and logistic regression models. Landslides 4, 33–41. doi:10.1007/s10346-006-0047-y
Li, B., Wang, N., and Chen, J. (2021). GIS-based landslide susceptibility mapping using information, frequency ratio, and artificial neural network methods in qinghai province, northwestern China. Adv. Civ. Eng. 2021, 1–14. doi:10.1155/2021/4758062
Li, Q., Song, D., Yuan, C., and Nie, W. (2022a). An image recognition method for the deformation area of open-pit rock slopes under variable rainfall. Meas. (Mahwah. N. J). 188, 110544. doi:10.1016/j.measurement.2021.110544
Li, Y., Du, L., and Wei, D. (2022b). Multiscale CNN based on component analysis for SAR ATR. IEEE Trans. Geosci. Remote Sens. 60, 1–12. doi:10.1109/TGRS.2021.3100137
Majeed, M., Lu, L., Haq, S. M., Waheed, M., Sahito, H. A., Fatima, S., et al. (2022). Spatiotemporal distribution patterns of climbers along an abiotic gradient in jhelum district, Punjab, Pakistan. Forests 13, 1244. doi:10.3390/f13081244
Marchesini, I., Mergili, M., Rossi, M., Santangelo, M., Cardinali, M., Ardizzone, F., et al. (2014). “A GIS approach to analysis of deep-seated slope stability in complex geology,” in Landslide science for a safer geoenvironment (Springer), 483–489.
Milevski, I., Dragićević, S., and Zorn, M. (2019). Statistical and expert-based landslide susceptibility modeling on a national scale applied to North Macedonia. Open Geosci. 11, 750–764. doi:10.1515/geo-2019-0059
Miller, S., Brewer, T., and Harris, N. (2009). Rainfall thresholding and susceptibility assessment of rainfall-induced landslides: Application to landslide management in St Thomas, Jamaica. Bull. Eng. Geol. Environ. 68, 539–550. doi:10.1007/s10064-009-0232-z
Narimah Samat, M. S. S., and Ismail, M. H. (2020). The integration of gis, ahp, and remote sensing methods for potential areas groundwater: Case study for pontian district, johor, Malaysia. Malays. J. Geosci. 5, 06–11. doi:10.26480/mjg.01.2021.06.11
Nolasco-Javier, D., Kumar, L., and Tengonciang, A. M. P. (2015). Rapid appraisal of rainfall threshold and selected landslides in Baguio, Philippines. Nat. Hazards 78, 1587–1607. doi:10.1007/s11069-015-1790-y
Oh, H. J., Lee, S., and Hong, S. M. (2017). Landslide susceptibility assessment using frequency ratio technique with iterative random sampling. J. Sens. 2017, 1–21. doi:10.1155/2017/3730913
Park, S., Choi, C., Kim, B., and Kim, J. (2013). Landslide susceptibility mapping using frequency ratio, analytic hierarchy process, logistic regression, and artificial neural network methods at the Inje area, Korea. Environ. Earth Sci. 68, 1443–1464. doi:10.1007/s12665-012-1842-5
Pham, B. T., Prakash, I., Khosravi, K., Chapi, K., Trinh, P. T., Ngo, T. Q., et al. (2019). A comparison of Support Vector Machines and Bayesian algorithms for landslide susceptibility modelling. Geocarto Int. 34, 1385–1407. doi:10.1080/10106049.2018.1489422
Pourghasemi, H. R., Moradi, H. R., and Fatemi Aghda, S. M. (2013). Landslide susceptibility mapping by binary logistic regression, analytical hierarchy process, and statistical index models and assessment of their performances. Nat. Hazards 69, 749–779. doi:10.1007/s11069-013-0728-5
Pourghasemi, H. R., Yansari, T., Panagos, P., and Pradhan, B. (2005). Analysis and evaluation of landslide susceptibility: A review on articlespublished during 2005–2016 (periods of 2005–2012 and 2013–2016). Arab. J. Geosci. 11, 193. doi:10.1007/s12517-018-3531-5
Pradhan, B., Chaudhari, A., Adinarayana, J., and Buchroithner, M. F. (2012). Soil erosion assessment and its correlation with landslide events using remote sensing data and GIS: A case study at penang Island, Malaysia. Environ. Monit. Assess. 184, 715–727. doi:10.1007/s10661-011-1996-8
Pradhan, B. (2010). Remote sensing and GIS-based landslide hazard analysis and cross-validation using multivariate logistic regression model on three test areas in Malaysia. Adv. Space Res. 45, 1244–1256. doi:10.1016/j.asr.2010.01.006
Qasim, M., Hubacek, K., Termansen, M., and Fleskens, L. (2013). Modelling land use change across elevation gradients in district Swat , Pakistan. Reg. Environ. Change 13, 567. doi:10.1007/s10113-012-0395-1
Quan, Q., Gao, S., Shang, Y., and Wang, B. (2021). Assessment of the sustainability of Gymnocypris eckloni habitat under river damming in the source region of the Yellow River. Sci. Total Environ. 778, 146312. doi:10.1016/j.scitotenv.2021.146312
Raghuvanshi, T. K. (2019). Governing factors influence on rock slope stability – statistical analysis for plane mode of failure. J. King Saud Univ. - Sci. 31, 1254–1263. doi:10.1016/j.jksus.2019.01.002
Rahman, G., Rahman, A. U., Bacha, A. S., Mahmood, S., Moazzam, M. F. U., and Lee, B. G. (2020). Assessment of landslide susceptibility using weight of evidence and frequency ratio model in shahpur valley, eastern Hindu Kush. Nat. Hazards Earth Syst. Sci., 1–19. doi:10.21203/rs.3.rs-288102/v1
Reichenbach, P., Rossi, M., Malamud, B. D., Mihir, M., and Guzzetti, F. (2018). A review of statistically-based landslide susceptibility models. Earth. Sci. Rev. 180, 60–91. doi:10.1016/j.earscirev.2018.03.001
Ren, Y., Jiang, H., Ji, N., and Yu, H. (2022). Tbsm: A traffic burst-sensitive model for short-term prediction under special events. Knowl. Based. Syst. 240, 108120. doi:10.1016/j.knosys.2022.108120
Sadiq Fareed, M. M., Raza, A., Zhao, N., Tariq, A., Younas, F., Ahmed, G., et al. (2022). Predicting divorce prospect using ensemble learning: Support vector machine, linear model, and neural network. Comput. Intell. Neurosci. 2022, 1–15. doi:10.1155/2022/3687598
Searle, M. P., Khan, M. A., Fraser, J. E., Gough, S. J., and Jan, M. Q. (1999). The tectonic evolution of the Kohistan‐Karakoram collision belt along the Karakoram Highway transect, north Pakistan. Tectonics 18, 929–949. doi:10.1029/1999tc900042
Segoni, S., Pappafico, G., Luti, T., and Catani, F. (2020). Landslide susceptibility assessment in complex geological settings: Sensitivity to geological information and insights on its parameterization. Landslides 17, 2443–2453. doi:10.1007/s10346-019-01340-2
Shah, S. H. I. A., Jianguo, Y., Jahangir, Z., Tariq, A., and Aslam, B. (2022). Integrated geophysical technique for groundwater salinity delineation, an approach to agriculture sustainability for Nankana Sahib Area, Pakistan. Geomat. Nat. Hazards Risk 13, 1043–1064. doi:10.1080/19475705.2022.2063077
Shah, S. H. I. A., Yan, J., Ullah, I., Aslam, B., Tariq, A., Zhang, L., et al. (2021). Classification of aquifer vulnerability by using the drastic index and geo-electrical techniques. WaterSwitzerl. 13, 2144. doi:10.3390/w13162144
Sharifi, A., Mahdipour, H., Moradi, E., and Tariq, A. (2022). Agricultural field extraction with deep learning algorithm and satellite imagery. J. Indian Soc. Remote Sens. 50, 417–423. doi:10.1007/s12524-021-01475-7
Silalahi, F. E. S., PamelaArifianti, Y., and Hidayat, F. (2019). Landslide susceptibility assessment using frequency ratio model in Bogor, West Java, Indonesia. Geosci. Lett. 6, 10. doi:10.1186/s40562-019-0140-4
Tahirkheli, R. A. K. (1979). Geology of kohistan and adjoining eurasian and indo-Pakistan continents, Pakistan. Geol. Bull. Univ. Peshawar 11, 1–30.
Tariq, A., Mumtaz, F., Zeng, X., Baloch, M. Y. J., and Moazzam, M. F. U. (2022a). Spatio-temporal variation of seasonal heat islands mapping of Pakistan during 2000–2019, using day-time and night-time land surface temperatures MODIS and meteorological stations data. Remote Sens. Appl. Soc. Environ. 27, 100779. doi:10.1016/j.rsase.2022.100779
Tariq, A., Riaz, I., Ahmad, Z., Yang, B., Amin, M., Kausar, R., et al. (2020). Land surface temperature relation with normalized satellite indices for the estimation of spatio-temporal trends in temperature among various land use land cover classes of an arid Potohar region using Landsat data. Environ. Earth Sci. 79, 40–15. doi:10.1007/s12665-019-8766-2
Tariq, A., and Shu, H. (2020). CA-Markov chain analysis of seasonal land surface temperature and land use landcover change using optical multi-temporal satellite data of Faisalabad, Pakistan. Remote Sens. (Basel). 12, 3402–3423. doi:10.3390/rs12203402
Tariq, A., Shu, H., Gagnon, A. S., Li, Q., Mumtaz, F., Hysa, A., et al. (2021a). Assessing burned areas in wildfires and prescribed fires with spectral indices and SAR images in the margalla hills of Pakistan. Forests 12, 1371. doi:10.3390/f12101371
Tariq, A., Shu, H., Siddiqui, S., Imran, M., and Farhan, M. (2021b). Monitoring land use and land cover changes using geospatial techniques, a case study of Fateh Jang, Attock, Pakistan. Geogr. Environ. Sustain. 14, 41–52. doi:10.24057/2071-9388-2020-117
Tariq, A., Siddiqui, S., Sharifi, A., Hassan, S., and Ahmad, I. (2022b). Impact of spatio - temporal land surface temperature on cropping pattern and land use and land cover changes using satellite imagery , Hafizabad District , Punjab , Province of Pakistan. Arab. J. Geosci. 15, 1045–1116. doi:10.1007/s12517-022-10238-8
Tian, H., Huang, N., Niu, Z., Qin, Y., Pei, J., and Wang, J. (2019). Mapping winter crops in China with multi-source satellite imagery and phenology-based algorithm. Remote Sens. (Basel). 11, 820–823. doi:10.3390/rs11070820
Tian, H., Pei, J., Huang, J., Li, X., Wang, J., Zhou, B., et al. (2020). Garlic and winter wheat identification based on active and passive satellite imagery and the Google Earth engine in northern China. Remote Sens. (Basel). 12, 3539–3617. doi:10.3390/rs12213539
Tian, H., Qin, Y., Niu, Z., Wang, L., and Ge, S. (2021a). Summer maize mapping by compositing time series sentinel-1A imagery based on crop growth cycles. J. Indian Soc. Remote Sens. 49, 2863–2874. doi:10.1007/s12524-021-01428-0
Tian, H., Wang, Y., Chen, T., Zhang, L., and Qin, Y. (2021b). Early-season mapping of winter crops using sentinel-2 optical imagery. Remote Sens. (Basel). 13, 3822–3911. doi:10.3390/rs13193822
Tosic, R., Dragicevic, S., Zorn, M., and Lovric, N. (2014). Landslide susceptibility zonation: A case study of the municipality of banja luka (Bosnia and Herzegovina). ACTA Geogr. Slov. Zb. 54, 190–202. doi:10.3986/ags54307
Ullah, I., Aslam, B., Shah, S. H. I. A., Tariq, A., Qin, S., Majeed, M., et al. (2022). An integrated approach of machine learning, remote sensing, and GIS data for the landslide susceptibility mapping. Land 11, 1265. doi:10.3390/land11081265
Vakhshoori, V., and Zare, M. (2016). Landslide susceptibility mapping by comparing weight of evidence, fuzzy logic, and frequency ratio methods. Geomat. Nat. Hazards Risk 7, 1731–1752. doi:10.1080/19475705.2016.1144655
Wahla, S. S., Kazmi, J. H., Sharifi, A., Shirazi, S. A., Tariq, A., and Joyell Smith, H. (2022). Assessing spatio-temporal mapping and monitoring of climatic variability using SPEI and RF machine learning models. Geocarto Int. 0, 1–20. doi:10.1080/10106049.2022.2093411
Wang, P., Wang, L., Leung, H., and Zhang, G. (2021a). Super-resolution mapping based on spatial–spectral correlation for spectral imagery. IEEE Trans. Geosci. Remote Sens. 59, 2256–2268. doi:10.1109/tgrs.2020.3004353
Wang, Q., Zhou, G., Song, R., Xie, Y., Luo, M., and Yue, T. (2022). Continuous space ant colony algorithm for automatic selection of orthophoto mosaic seamline network. ISPRS J. Photogramm. Remote Sens. 186, 201–217. doi:10.1016/j.isprsjprs.2022.02.011
Wang, S., Zhang, K., Chao, L., Li, D., Tian, X., Bao, H., et al. (2021b). Exploring the utility of radar and satellite-sensed precipitation and their dynamic bias correction for integrated prediction of flood and landslide hazards. J. Hydrol. X. 603, 126964. doi:10.1016/j.jhydrol.2021.126964
Waqas, H., Lu, L., Tariq, A., Li, Q., Baqa, M. F., Xing, J., et al. (2021). Flash flood susceptibility assessment and zonation using an integrating analytic hierarchy process and frequency ratio model for the chitral district, khyber pakhtunkhwa, 13. pakistan. doi:10.3390/w13121650WaterSwitzerl.
Wu, C. H., and Chen, S. C. (2009). Determining landslide susceptibility in Central Taiwan from rainfall and six site factors using the analytical hierarchy process method. Geomorphology 112, 190–204. doi:10.1016/j.geomorph.2009.06.002
Xie, W., Li, X., Jian, W., Yang, Y., Liu, H., Robledo, L. F., et al. (2021a). A novel hybrid method for landslide susceptibility mapping-based geodetector and machine learning cluster: A case of xiaojin county, China. ISPRS Int. J. Geoinf. 10, 93. doi:10.3390/ijgi10020093
Xie, W., Nie, W., Saffari, P., Robledo, L. F., Descote, P. Y., and Jian, W. (2021b). Landslide hazard assessment based on Bayesian optimization–support vector machine in Nanping City, China. Nat. Hazards 109, 931–948. doi:10.1007/s11069-021-04862-y
Xu, C., Shyu, J. B. H., and Xu, X. (2014). Landslides triggered by the 12 january 2010 port-au-prince, Haiti, <i>M</i><sub>w</sub> = 7.0 earthquake: Visual interpretation, inventory compiling, and spatial distribution statistical analysis. Nat. Hazards Earth Syst. Sci. 14, 1789–1818. doi:10.5194/nhess-14-1789-2014
Yin, L., Wang, L., Keim, B. D., Konsoer, K., and Zheng, W. (2022a). Wavelet analysis of dam injection and discharge in three gorges dam and reservoir with precipitation and river discharge. WaterSwitzerl. 14, 567. doi:10.3390/w14040567
Yin, L., Wang, L., Zheng, W., Ge, L., Tian, J., Liu, Y., et al. (2022b). Evaluation of empirical atmospheric models using swarm-C satellite data. Atmos. (Basel) 13, 294–315. doi:10.3390/atmos13020294
Yue, Z., Zhou, W., and Li, T. (2021). Impact of the Indian ocean dipole on evolution of the subsequent ENSO: Relative roles of dynamic and thermodynamic processes. J. Clim. 34, 3591–3607. doi:10.1175/JCLI-D-20-0487.1
Zamani, A., Sharifi, A., Felegari, S., Tariq, A., and Zhao, N. (2022). Agro climatic zoning of saffron culture in miyaneh city by using WLC method and remote sensing data. Agriculture 12, 118–215. doi:10.3390/agriculture12010118
Zhan, C., Dai, Z., Samper, J., Yin, S., Ershadnia, R., Zhang, X., et al. (2022). An integrated inversion framework for heterogeneous aquifer structure identification with single-sample generative adversarial network. J. Hydrol. X. 610, 127844. doi:10.1016/j.jhydrol.2022.127844
Zhang, K., Ali, A., Antonarakis, A., Moghaddam, M., Saatchi, S., Tabatabaeenejad, A., et al. (2019a). The sensitivity of north American terrestrial carbon fluxes to spatial and temporal variation in soil moisture: An analysis using radar-derived estimates of root-zone soil moisture. J. Geophys. Res. Biogeosci. 124, 3208–3231. doi:10.1029/2018JG004589
Zhang, K., Wang, S., Bao, H., and Zhao, X. (2019b). Characteristics and influencing factors of rainfall-induced landslide and debris flow hazards in Shaanxi Province, China. Nat. Hazards Earth Syst. Sci. 19, 93–105. doi:10.5194/nhess-19-93-2019
Zhang, X., Ma, F., Yin, S., Wallace, C. D., Soltanian, M. R., Dai, Z., et al. (2021). Application of upscaling methods for fluid flow and mass transport in multi-scale heterogeneous media: A critical review. Appl. Energy 303, 117603. doi:10.1016/j.apenergy.2021.117603
Zhang, Z., Luo, C., and Zhao, Z. (2020). Application of probabilistic method in maximum tsunami height prediction considering stochastic seabed topography. Nat. Hazards 104, 2511–2530. doi:10.1007/s11069-020-04283-3
Zhao, F., Zhang, S., Du, Q., Ding, J., Luan, G., and Xie, Z. (2021). Assessment of the sustainable development of rural minority settlements based on multidimensional data and geographical detector method: A case study in dehong, China. Socioecon. Plann. Sci. 78, 101066. doi:10.1016/j.seps.2021.101066
Zhou, G., Long, S., Xu, J., Zhou, X., Song, B., Deng, R., et al. (2021a). Comparison analysis of five waveform decomposition algorithms for the airborne LiDAR echo signal. IEEE J. Sel. Top. Appl. Earth Obs. Remote Sens. 14, 7869–7880. doi:10.1109/JSTARS.2021.3096197
Zhou, G., Zhang, R., and Huang, S. (2021b). Generalized buffering algorithm. IEEE Access 9, 27140–27157. doi:10.1109/ACCESS.2021.3057719
Zhou, W., Lv, Y., Lei, J., and Yu, L. (2021c). Global and local-contrast guides content-aware fusion for RGB-D saliency prediction. IEEE Trans. Syst. Man. Cybern. Syst. 51, 3641–3649. doi:10.1109/tsmc.2019.2957386
Zhu, B., Zhong, Q., Chen, Y., Liao, S., Li, Z., Shi, K., et al. (2022a). A novel reconstruction method for temperature distribution measurement based on ultrasonic tomography. IEEE Trans. Ultrason. Ferroelectr. Freq. Control 69, 2352–2370. doi:10.1109/TUFFC.2022.3177469
Zhu, Z., Wu, Y., and Liang, Z. (2022b). Mining-induced stress and ground pressure behavior characteristics in mining a thick coal seam with hard roofs. Front. Earth Sci. 10, 1–12. doi:10.3389/feart.2022.843191
Keywords: landslide susceptibility mapping, landslide causative factors, geospatial modeling, bivariate models, sub Himalayas
Citation: Islam F, Riaz S, Ghaffar B, Tariq A, Shah SU, Nawaz M, Hussain ML, Amin NU, Li Q, Lu L, Shah M and Aslam M (2022) Landslide susceptibility mapping (LSM) of Swat District, Hindu Kush Himalayan region of Pakistan, using GIS-based bivariate modeling. Front. Environ. Sci. 10:1027423. doi: 10.3389/fenvs.2022.1027423
Received: 25 August 2022; Accepted: 23 September 2022;
Published: 12 October 2022.
Edited by:
Zefa Yang, Central South University, ChinaReviewed by:
Quoc Bao Pham, University of Silesia in Katowice, PolandCopyright © 2022 Islam, Riaz, Ghaffar, Tariq, Shah, Nawaz, Hussain, Amin, Li, Lu, Shah and Aslam. This is an open-access article distributed under the terms of the Creative Commons Attribution License (CC BY). The use, distribution or reproduction in other forums is permitted, provided the original author(s) and the copyright owner(s) are credited and that the original publication in this journal is cited, in accordance with accepted academic practice. No use, distribution or reproduction is permitted which does not comply with these terms.
*Correspondence: Aqil Tariq, YXQyMTM5QG1zc3RhdGUuZWR1, YXFpbHRhcmlxQHdodS5lZHUuY24=; Linlin Lu, bHVsbEByYWRpLmFjLmNu
Disclaimer: All claims expressed in this article are solely those of the authors and do not necessarily represent those of their affiliated organizations, or those of the publisher, the editors and the reviewers. Any product that may be evaluated in this article or claim that may be made by its manufacturer is not guaranteed or endorsed by the publisher.
Research integrity at Frontiers
Learn more about the work of our research integrity team to safeguard the quality of each article we publish.