 Zhongna Yang1,2
 Yanlong He2
 Muhammad Aamir3*
 Iqbal Javed4Gucheng Li1*
 Qing Zhang1*Shengde Wang2Lijiang Zhou2Jun Qin5
- 1College of Economics and Management, Huazhong Agricultural University, Wuhan, China
- 2Department of Economics and Management, Tarim University, Alar, Xinjiang, China
- 3Department of Computer Science, Huanggang Normal University, Huanggang, China
- 4Department of Economics, University of Lahore, Sargodha, Pakistan
- 5School of Foreign Languages, Huazhong Agricultural University, Wuhan, China
Assessing climate-induced reductions in cotton yields is critical to developing weather insurance for sustainable agricultural development. Climatic factors such as frost, hail, and drought severely constrain the sustainable development of cotton production in Xinjiang. In this study, based on cotton production and meteorological data from 1988 to 2019 in Aksu, Xinjiang, the H-P filtering method, correlation test, and regression analysis were used to develop a weather index model of cotton yield reduction rate and key meteorological factors. The results showed that the trend yield separated by the H-P filtering method was more stable. The correlation analysis between cotton fertility and meteorological factors concluded that there was a strong positive correlation between precipitation and cotton yield, i.e., the more rainfall, the more unfavorable environment for cotton growth and development. The results of the empirical analysis to determine the net premium rate under different disaster registrations based on the logistic probability distribution model showed that the highest probability of meteorological disasters in the Aksu region was 22.36%, the premium rate was 1.79%, and the net premium was 34.01 RMB per mu. It is found that climate change is closely related to the environment, and human production activities are compatible with the carrying capacity of the environment, otherwise, climate change leads to frequent meteorological disasters, which is not conducive to the sustainable development of agricultural production. It is expected that these research results can provide a relevant basis for the implementation of cotton policy weather insurance in Aksu and other regions and promote the sustainable development of cotton production.
1 Introduction
Current topical issues include global warming, greenhouse gas emission reduction, and how to adapt to climate change (Martina, 2016). Agricultural production is extremely dependent on climatic conditions, and this vulnerability makes agriculture one of the most sensitive and significant sectors to climate change impacts (Lobell et al., 2011). Climate change, through variations in temperature and precipitation, causes changes in environmental elements for crop growth such as sunlight, moisture, and soil, which subsequently affects crop phenological periods, growth potential, cropping systems, pest control, farm management, and ultimately crop yield (Liu et al., 2013). Meanwhile, related studies have shown that the warming trend in northwest China is higher than the national average during climate change (Diarra et al., 2017). Therefore, climate warming may shorten cotton ferity, reduce seed cotton yield, and increase evapotranspiration intensity and irrigation water use, thus increasing the risk of sustainable cotton production in Xinjiang (Yang et al., 2014; Saseendran et al., 2016; Wang et al., 2018).
Cotton is one of the most labor-intensive cash crops in the world and is an important strategic material for the country’s livelihood. Since it joined the World Trade Organization, cotton imports have accounted for about a quarter of the world’s total imports (Liu, 2020; Mi and Cheng, 2020). In China, cotton is the second largest crop after grain, with an annual planted area of about 5.53 million ha, accounting for about 15% of the world’s planted area (Yu et al., 2015). Meanwhile, as an important textile raw material, cotton has provided a strong impetus for the development of the Chinese textile industry and has become a key factor for the green and sustainable development of the industry (Li et al., 2021). Xinjiang is the largest cotton-producing area in China. Xinjiang’s total cotton production, yield, planted area, and commodity sales have ranked first in the country for more than 20 consecutive years (Xinhua News Agency, 2021). Among them, in 2021, the total cotton production in Xinjiang reached 5.129 million tons, accounting for nearly 90% of the national cotton production (Xinjiang Uygur Autonomous Region Bureau of Statistics, 2022). However, cotton cultivation in Xinjiang is typical of oasis agriculture, prone to natural disasters, with a weak agricultural production base that is heavily influenced by climate change, a relatively fragile natural environment, and scarce water resources. Various disasters such as floods, droughts, high winds, sand, and dust have caused huge economic losses to cotton farmers and become a major factor limiting the green and sustainable development of cotton production in Xinjiang (Tao et al., 2022).
Agricultural insurance is an important measure to guarantee the security of cotton production and farmers’ income. Among them, cotton insurance supported by the Chinese government is an important way to ensure the security of cotton production (Stoeffler et al., 2016). Since 2007, the policy of cotton insurance implemented in Xinjiang has experienced problems such as moral hazard, adverse selection, high underwriting, and loss assessment costs (Xu, 2021), which affect the sustainable development of cotton insurance industry. However, weather index insurance refers to the study of the relationship between weather data and crop losses, and the design of insurance contracts relies on local weather and crop growth data, which can effectively spread agricultural risks and overcome the drawbacks of traditional agricultural insurance (McIntosh et al., 2013). After piloting in some countries and regions, it is now widely accepted by farmers and insurance companies (Xu, 2021).
The existing literature on weather index insurance has focused on the following aspects. Firstly, whether insurance premium pricing models are adopted for research on the practical experience of weather insurance in developing countries (Collier et al., 2009; Chen, 2011; Yin, 2014; Conradt et al., 2015; Ma, 2019). For example, early scholars mainly used the Pearson coefficient method, principal component analysis, entropy weighting method, multiple stepwise regression model, stepwise adjustment outpu, and detrending to construct weather indicator insurance models and determine insurance rates (Wu et al., 2010; Yang et al., 2015; Shao, 2016; Liang and Zhou, 2019; Yu, 2020; Yu and Wang, 2021). Secondly, most of the studies on the design of weather index insurance contracts have been conducted with food crops as the target. Examples, maize drought weather index insurance, medium rice high-temperature heat damage weather index insurance, millet comprehensive weather index insurance, and winter wheat drought weather index insurance (Qu et al., 2018; Liu et al., 2017; Wang et al., 2019; Cao et al., 2019). Thirdly, the literature on cotton weather index insurance and its rate setting is relatively limited, and only a few studies deal with cotton agricultural insurance to cope with climate change. For example, Wang et al. (2014) and Wu (2017) and Chao et al. (2017) proposed yield and cotton futures prices as the main components of agricultural insurance for income insurance price index to cope with climate change. In addition, Weber et al. (2015) designed different weather insurance products based on the put option of cumulative precipitation index, and weather insurance with meso-level index can significantly reduce the risk. Chu and Cao (2014) and Sun et al. (2016) proposed the impact of cotton precipitation index insurance and low-temperature index insurance on the sustainable development of cotton production in the northern Xinjiang Corps region.
In general, the current literature is relatively rich in discussing weather index insurance, but there are still the following shortcomings. First, Chinese agricultural production has obvious regional differences, and crops in different regions face the influence of different meteorological environmental factors, and the corresponding weather insurance index should be designed according to local conditions. Second, many weather factors affect crop growth. Most studies have selected the impact of specific weather factors on crop yield while ignoring the relationship between weather factors. There are limitations in the design of weather index insurance, resulting in insurance products that cannot effectively hedge against the risk of facing weather hazards. Third, previous studies may have measurement errors and did not consider the effects of different weather factors throughout the growth period of crops. Therefore, this study endeavors to collect available information on weather factors such as temperature, rainfall, sunshine, and crop yield from the Xinjiang Meteorological Bureau and the National Bureau of Statistics to better understand the vulnerability caused by weather factors and the design of agro-weather insurance for risk mitigation.
To construct a more comprehensive framework, this study proposes to achieve five key objectives: 1) To isolate meteorological yields and trend yields and determine yield reduction rates using the H-P filtering method. 2) To select key agro-weather insurance index factors based on the correlation test between yield reduction rate and each meteorological factor. 3) A regression model of cotton yield reduction rate and meteorological factors was established based on the relationship between cotton fertility and key meteorological factors. 4) Combining the distribution of yield reduction rate, determine the pure rate of insurance under different disaster registration. 5) Analyze the determinants affecting the design of weather index insurance. The results of this study, on the one hand, provide decision-makers with the design of effective weather insurance rate payout criteria to better protect farmers from weather shocks; on the other hand, provide a reference basis for the establishment of weather index insurance for other crops subsequently.
2 Materials and methods
2.1 Study area and sampling frame
Located in northwestern China (Figure 1), the Aksu region is the largest cotton-producing region and high-quality cotton production base in Xinjiang. 2021, the total cotton cultivation area in the Aksu region is 7.147 million mu, and cotton production accounts for about 80% of the total production in Xinjiang. The steady growth of cotton revenue plays a vital role in local economic development and national cotton production, on the one hand. On the other hand, meteorological conditions determine the growth and development of cotton to a large extent. Among them, the amount and spatial distribution of precipitation directly affect boll quality and ultimately cotton yield. Too much precipitation leads to late maturity and more rotten boll; while insufficient precipitation limits the elongation of cotton fiber, leading to early boll splitting and lower boll weight, resulting in reduced cotton production or even no harvest. In addition, temperature and sunshine duration affect the evaporation of water. For example, daily maximum temperatures above 34°C or daily average temperatures above 32°C may be detrimental to cotton growth. Therefore, in this paper, we will choose Xinjiang, China as the study area and use precipitation, temperature, and insolation as key meteorological indicators, thus providing a suitable case for sustainable cotton production.
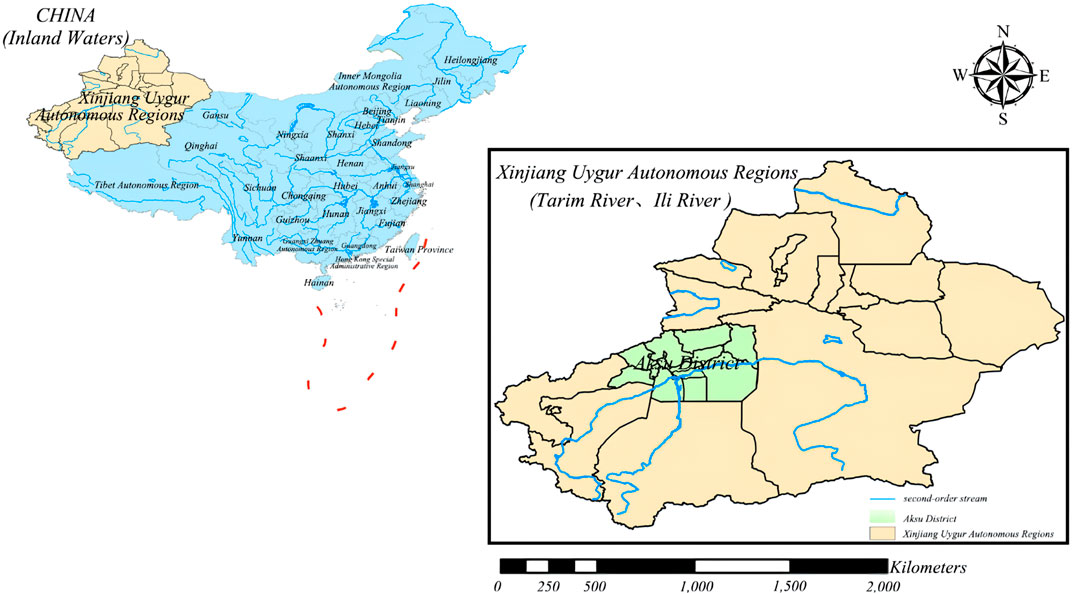
FIGURE 1. The geographical location of the study area.
From 1998 to 2019, cotton production and planting area in Xinjiang showed a significant upward trend, and the proportion of cotton planting area in the country rose from 22.40% in 1998 to 84.90% in 2019, with an average annual increase of 4.82 hm2 × 10,000 hm2, and in 2019, Xinjiang’s cotton planting area was 38,107,500 mu, up 2% from 2018, accounting for 76% of the national planting area (Figure 2). In the same year, Xinjiang’s cotton production continued to be the highest in the country, reaching 5.002 million tons, accounting for an increase of 1.1 percentage points year-on-year to 84.9% of the total national production.
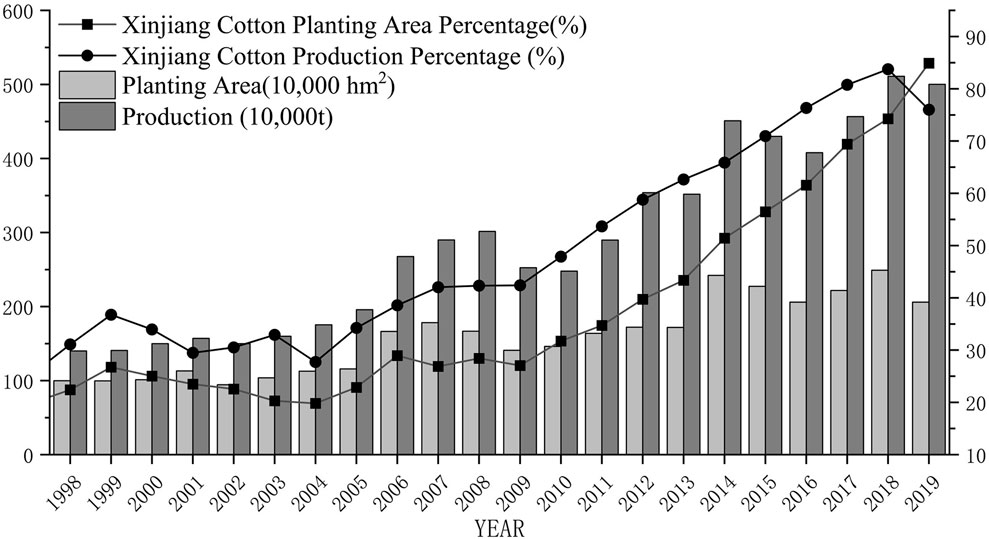
FIGURE 2. Cotton production and planting area in Xinjiang, 1998–2020.
2.2 Data collection
The data sources for this study consisted of two main sources: 1) the weather phenology data from the National Meteorological Science Data Center and the China Weather Network, including monthly sunshine hours, monthly average temperature, and monthly total precipitation in the Aksu region; and 2) cotton planting data, including cotton yields, from the statistical yearbook of the National Bureau of Statistics, with a sample interval of 1988–2019. The cotton growing period in Xinjiang is about 180 d. Sowing usually starts in early April and growth stops in late October, so based on the cotton fertility period the data collected in this study are from April to October (Gu, 2016). Cotton fertility and cotton yield have a direct impact, in general, cotton fertility refers to a year from April sowing to October harvest, the fertility period by the impact of climate change and lead to yield changes.
2.3 Variables definition and measurement
The objective of this study was to design a weather insurance index pricing model. By extending the traditional insurance model, the weather yield was separated by the H-P filtering method to calculate the yield reduction rate, and the key weather factors affecting cotton yield were further screened based on the correlation analysis method for the whole reproductive period of cotton production. Finally, the insurance rates were determined by empirical analysis, and the pure insurance rates of insurance products were calculated.
2.4 Separation of meteorological yields and reduction rate calculation
In 1980 Hodrick and Presccot proposed the H-P filter method, one of the main methods used to analyze long-term trends in time series, which has been widely used to separate long-term trends and volatility factors of economic variables. The method can fit well the trend term of output growth in weather index insurance design. The basic principle is to minimize the loss function in the following Eq. 1:
In the formula: the first square means the change in the fluctuation factor, and the second square means the change in the long-term trend component.
When designing weather index insurance, the actual crop yield is changing under the combined influence of various factors, and the yield change is not completely linear in time. The H-P filter method precisely separates the series with a certain trend from the time series of the actual crop yield, takes this part as the trend yield
According to Eq. 2, The difference between the actual yield
2.5 Correlation analysis
Correlation analysis is a method of statistical evaluation used to study the strength of a relationship between two, numerically measured, continuous variables. This particular type of analysis is useful in identifying possible connections among variables. If a correlation exists between two variables, it means that when there is a systematic change in one variable, there is also a systematic change in the other, or the variables alter together over a certain period (Kendall and Gibbons, 1990). In terms of the strength of the relationship, the value of the correlation coefficient varies between +1 and −1. A value of ±1 indicates a perfect degree of association between the two variables. As the absolute value of the correlation coefficient value goes towards 0, the relationship between the two variables is weak. The direction of the relationship is indicated by the sign of the coefficient, where a + sign indicates a positive relationship and a – sign indicates a negative relationship. Usually, in statistics, four types of correlations are measured: Pearson correlation, Kendall rank correction, Spearman correction, and the Point-Biserial correction (Draper and Smith, 1998). The following formula is used to calculate the Pearson correlation:
where r is the Pearson correlation coefficient; N represents several observations; and x, y represents two variables.
To select the suitable weather factor in this study, Pearson correlation will be used to test the degree of correlation between the dependent and independent variables. A high degree of autocorrelation between independent variables will affect the impact of independent variables on dependent variables.
2.6 Determining pure insurance rates
To determination pure insurance rates is a process of pricing insurance products based on the estimation of expected losses and the probability of loss occurrence of the insured (Zhang et al., 2015), therefore, insurance rates are mainly determined by a combination of the probability of disasters and the expected loss method of agricultural insurance. Combined with the data characteristics of this study, a parametric method is mainly used to fit the distribution of crop yield risk to calculate the probability of meteorological disaster occurrence. The commonly fitted distributions mainly include (Gallagher, 1987): Normal distribution, Lognormal distribution, Weibull distribution, Gamma distribution, and Logistic distribution, and the specific parameters and functions are shown in (Table 1).

TABLE 1. Common distribution function table.
2.6.1 Probability of disaster events
First, the model parameters were estimated by fitting the meteorological yield distribution model with the maximum likelihood estimation method to determine the fitting effect of each distribution probability density function on the histogram of yield reduction rate. Secondly, the Anderson-Darling (AD) test was applied to test the distribution of the sample, and the smaller the AD value, the better the distribution fit. Finally, the optimal distribution fitting model is determined, and the probability density function of the optimal fitting model is integrated to calculate the probability of occurrence of each level of disaster (Weber et al., 2015).
2.6.2 Insurance pure rate
The pure insurance rate is the expected value of agricultural insurance losses. The product of the yield reduction rate caused by each disaster class under different meteorological conditions and the probability of each meteorological disaster class is the basis for determining the pure insurance rate, and its expression is
In Eq. 6,
Based on the results of regression analysis, fitted distribution, and changes in meteorological indices, the magnitude of the yield reduction rate is determined, and the amount payable by the insurance is calculated.
3 Results and discussion
3.1 Meteorological yield separation
Figure 3 shows the trend of cotton yield changes in the Aksu region of Xinjiang from 1988 to 2019, and there is a clear trend effect of cotton yield with increasing years. Cotton yields increased from 630 kg/hm2 in 1988 to 1762 kg/hm2 in 2019, with an average annual growth rate of 46.4%. The substantial increase in yields reflects significant changes in variety renewal, planting techniques, and production inputs, which provide technical support for the sustainable development of cotton production.
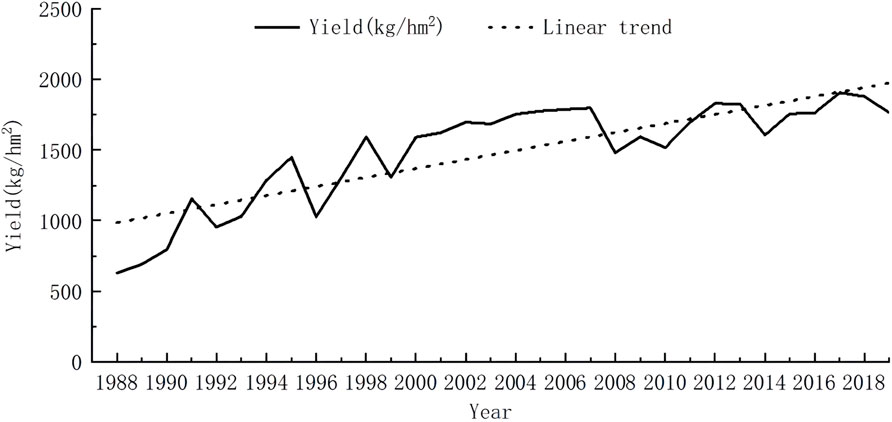
FIGURE 3. Changes in cotton yields in Aksu from 1988 to 2019.
Based on the data from China Statistical Yearbook, the yield per unit area of cotton (kg/hm2) was selected as the actual yield Z, the trend yield was separated by the H-P filtering method, and the results of the separation were shown in Figure 4. In Figure 4, the solid line shows the total yield before the trend yield Zt separation, which is volatile and the series is not smooth. The dashed line shows the trend yield after filtering the actual yield by the H-P filter method, which is smoother than the actual yield and shows an obvious upward trend in cotton yields with the development of the market and technology level before 2004. With the gradual stabilization of the market, a more stable trend between 2004 and 2008, the cotton market was more volatile in 2012, and the income from cotton cultivation was significantly affected by market fluctuations, and there was a slow upward trend in cotton yields after 2014, and the trend change in actual yields is more clearly reflected by the dashed line trend in Figure 4.
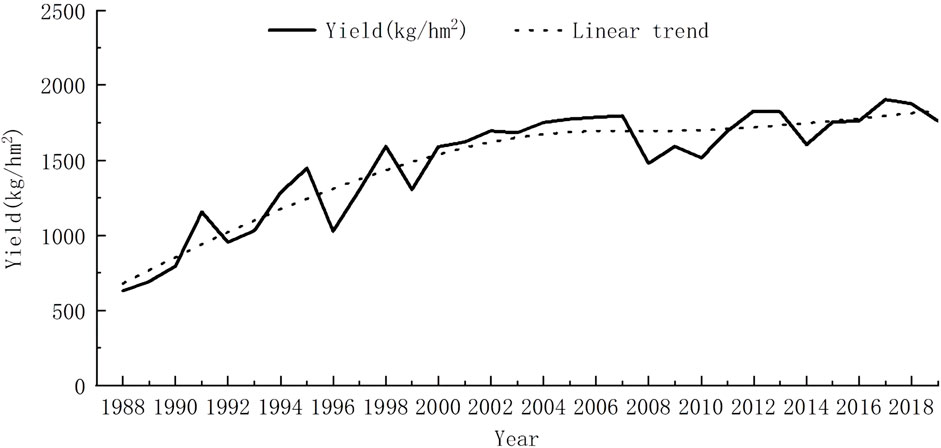
FIGURE 4. 1988–2019 Separation diagram of actual yield and trend yield.
Meteorological yield changes of cotton in the Aksu region from 1988 to 2019 (Figure 5). As can be seen from Figure 5, compared with the actual yield Z, after separating the trend yield Zt, the meteorological yield Zw series eliminates the trend effect and the series behaves smoothly relative to the total yield. According to Eq. 4, the relative meteorological yield can be calculated
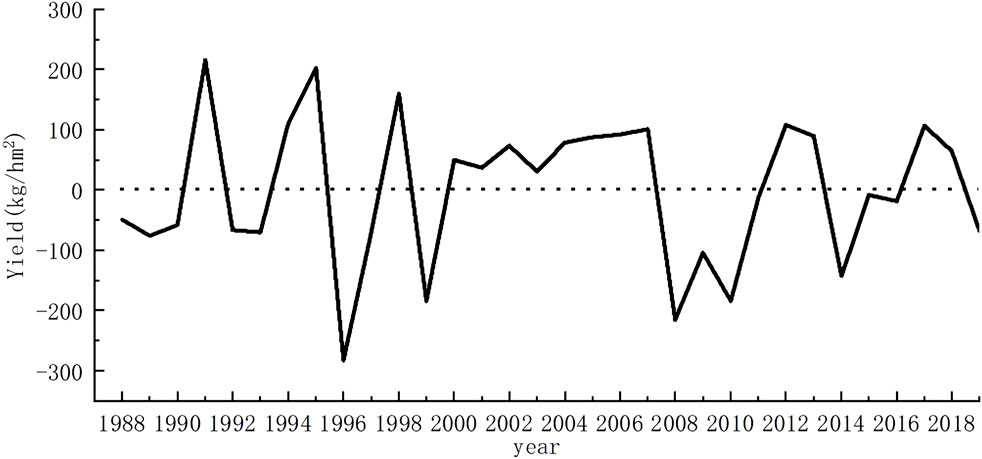
FIGURE 5. Time series of cotton meteorological yields in Aksu from 1988 to 2019.
Figure 6 shows the changes in the yield reduction rate of cotton in the Aksu region due to changes in meteorological conditions over the last 30 years. Overall, it can be seen that the fluctuation of meteorological yield is large, and the highest rate of cotton yield reduction in the Aksu region was 28% in 1996, with a total yield reduction of about 283 kg per hectare. By reviewing the information, we know that several cotton varieties were introduced from the Yellow River Basin in the Aksu region in that year, which caused a large yield reduction because they were not adapted to the local climate (Wang and Zhang, 2010). With the improvement of varieties and changes in planting techniques, the situation of yield reduction has improved. The most recent large yield reduction was in 2007 and 2008, according to the analysis and forecast of the production situation of grain and cotton in China by the Chinese Academy of Sciences in 2008, China’s agricultural meteorological conditions in 2007 were worse than normal and suffered the most severe drought in 10 years, which caused crop yield reduction in different degrees in some areas.
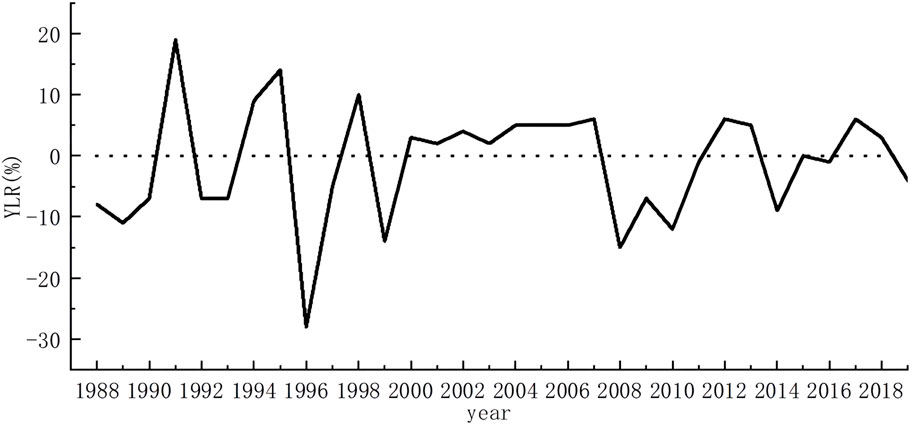
FIGURE 6. Changes in cotton yield reduction rate in the Aksu region from 1988 to 2019.
3.2 Correlation analysis
To accurately calculate the magnitude of the effect of meteorological factors on cotton yield, this study divided the entire cotton reproductive period into five stages, namely sowing emergence (T1), seedling stage (T2), bud stage (T3), boll stage (T4), and spat stage (T5), based on the results of previous studies, when the absolute value of yield reduction rate is lower than 5%, it can be considered that the occurrence of meteorological disasters has no significant effect on crop yield, and or caused by unstable factors other than meteorology; when the absolute value is higher than 5%, it is defined as crop yield reduction caused by meteorology (Shirsath et al., 2019). Further, the correlation between meteorological factors affecting cotton yield and cotton yield reduction rate at each stage was analyzed in Table 2.

TABLE 2. Correlation between YLR and meteorological factors throughout the growth period.
The results in Table 2 show that: 1) The variation of cotton yield reduction rate was strongly and positively correlated with the average monthly precipitation, and the more precipitation, the higher the yield reduction rate was. This is because excessive precipitation is detrimental to the growth of cotton. 2) There was a weak negative correlation between yield reduction rate and monthly average sunshine hours. The increase in cotton yield was strongly correlated with long monthly sunshine hours, which is consistent with previous studies (Abdukrim, 2007). 3) There was a weak positive correlation between increased temperature and cotton yield reduction. In other words, excessive temperately hinders the growth of cotton to some extent and thus affects the yield of cotton.
The correlations between yield reduction rate and meteorological factors (sunshine hours, precipitation, and temperature) at each fertility stage are shown in Table 3. Our results showed that: 1) Sunshine hours during the growing period were negatively correlated with yield reduction rate, and the correlation coefficients of each stage were less different, which implies that light helps to improve cotton yield. 2) Precipitation had a large correlation with yield reduction rate at different stages of cotton growth. Precipitation was only weakly negatively correlated with yield reduction at the seedling stage (T2), implying that an appropriate increase in precipitation during this period may help to increase cotton yield. Precipitation affected cotton yield for most of the period, with the highest correlation with yield reduction at the boll stage (T4), which was highly positively correlated, i.e., the more precipitation there was, the greater the yield reduction and the more serious the cotton loss. 3) Average temperature had the strongest correlation at the sowing stage (T1) and the weakest correlation with yield reduction in the rest of the growing season, with correlations not exceeding 0.1.
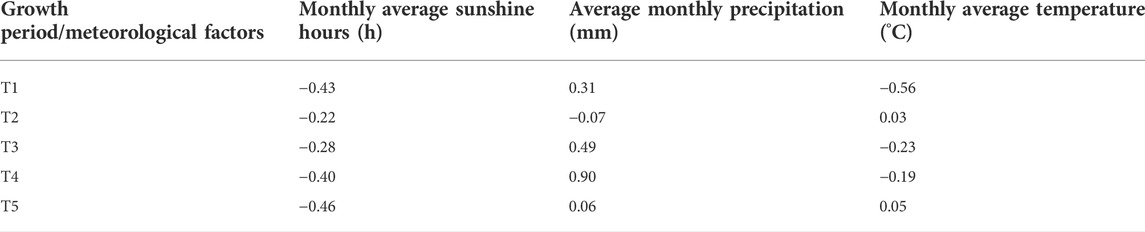
TABLE 3. Correlation between yield reduction rate and meteorological factors in each growing period.
From the point of view of natural conditions, cotton, as a warm and light-loving short-day crop, can be affected by natural disasters such as rain and flooding, excessive drought, and pest damage during the growing period (Xu, 2021). Drought during the cotton seedling stage (T1) affects seedling emergence, while excessive rainfall tends to cause soil consolidation, which is detrimental to plant root respiration. During the boll stage (T4), the rapid growth of cotton consumes a lot of water, and the high temperature during this time can easily cause water imbalance and metabolic disruption in the plant, resulting in boll loss. Into the flocculation maturity (T5), water needs gradually reduced, at this time needs to maintain clear weather to benefit the cotton flocculation, if met with continuous cloudy weather prone to rotten boll, resulting in yield reduction.
Combining the results of Tables 2, 3, and the above analysis, precipitation was selected as the main meteorological factor to construct the Weather Index model. For the cotton growing period, there is a strong positive correlation between the variation of cotton yield at the boll stage (T4) and the monthly average precipitation, implying that the more precipitation, the more unfavorable the growth of cotton. On the one hand, excessive precipitation affects the photosynthesis of the crop, which is unfavorable to the synthesis and accumulation of organic matter; on the other hand, excessive precipitation leads to a large loss of sediment from the soil, which destroys the soil structure and fertility and leads to the death of the cotton root system, eventually causing a reduction in cotton yield.
3.3 Regression analysis of yield reduction rate and precipitation
By conducting a regression analysis of the meteorological factors rainfall and yield reduction rate, we further tested whether the selected meteorological factors could accurately reflect the yield reduction of cotton and the rationality of the selected meteorological factors, and the regression analysis is shown in the following figure.
As can be seen from Figure 7, the regression equation is Y = 0.0038X+0.0436, and the yield reduction rate is positively correlated with the meteorological factor precipitation, with a value of 0.8199, indicating that the equation fits well. It reflects that if the current period without precipitation, cotton also has a certain probability of yield reduction, and the yield reduction rate caused by factors other than meteorological factors is about 4.36%.
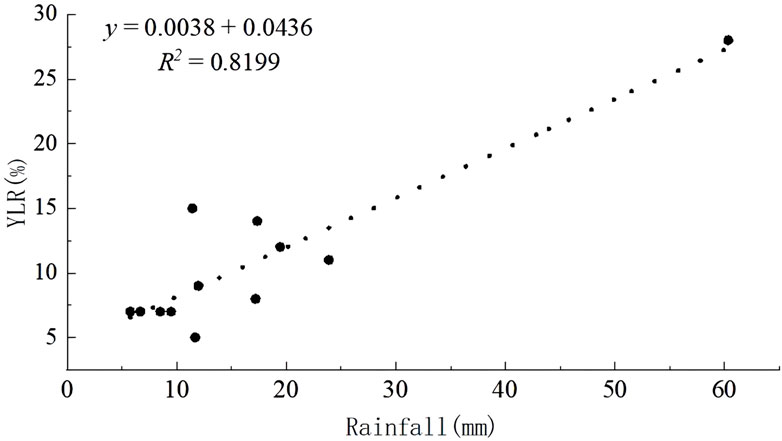
FIGURE 7. Regression graph of yield reduction rate and Precipitation.
3.4 Fitting the distribution of yield reduction rates and determining insurance premium rates
3.4.1 Distribution fitting of yield reduction rate
To determine the insurance rates using the yield risk distribution model, firstly, the distribution of crop yield reduction is fitted to find the most suitable probability distribution. Secondly, considering the distribution of the data, Normal, Lognormal, Weibull, Gamma, and Logistic distributions were selected for the distribution fitting. The parameter estimation results of the distribution fitting are shown in Table 4 below.
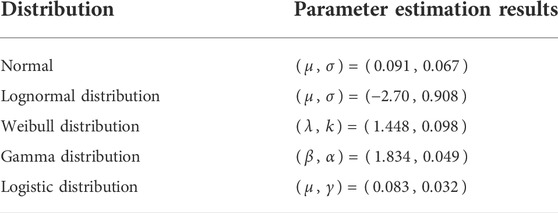
TABLE 4. Parameter estimation results of the distribution model.
Thirdly, based on determining the specific parameters of the five models, the probability density and frequency distribution plots corresponding to the five distribution functions were constructed, and finally, the best single yield distribution model was determined by comparing the fitting effect of the histograms as well as visual judgment. The probability density plots between functions and the fitting effects are shown in Figure 8.
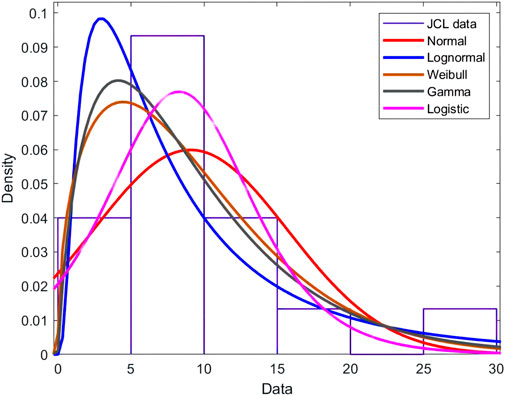
FIGURE 8. Fitting graph of the probability distribution of yield reduction rate.
The distribution functions with large deviations from the histogram fit, such as the Lognormal distributions, Weibull distributions, and Gamma distributions can be preliminarily excluded by observation in Figure 8, and according to the remaining two similar distributions then excluded by the AD test (Table 5) to finally determine the optimal distribution fit model.
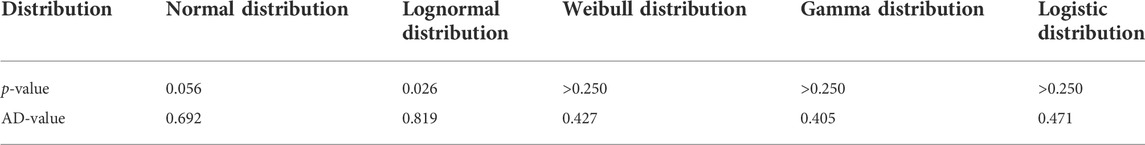
TABLE 5. Comparison of fit of different models.
The larger the p-value, and the smaller the AD-value, the better the fitting effect of the distribution model. According to this principle, it was determined that the Logistic distribution model with an AD value of 0.471 and a p-value greater than 0.25 fitted the sample data best. The probability density plot (left) and cumulative distribution plot (right) of the fitted distributions are shown in Figure 9 below.
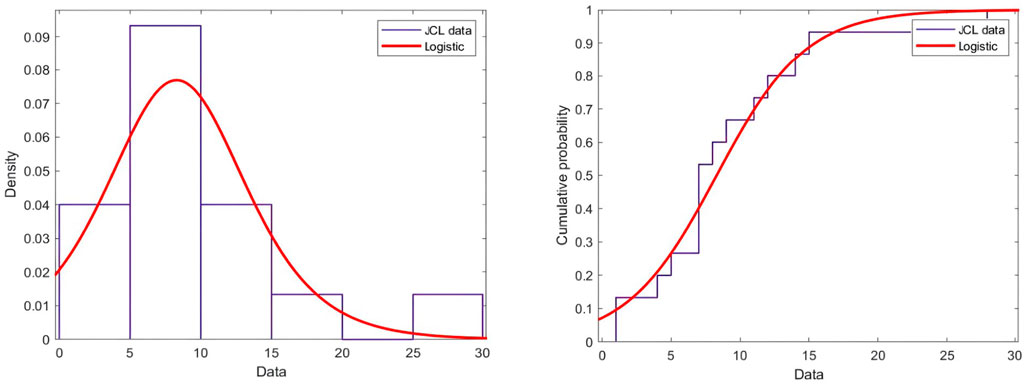
FIGURE 9. Probability density plot and cumulative distribution plot of the logistic distribution.
3.4.2 Determination of pure premium rate for cotton precipitation index insurance
The product of the probability of a meteorological disaster and the corresponding crop yield reduction rate is used as the basis for determining the pure premium. If the yield reduction rate caused by the meteorological disaster is lower than the deductible, no compensation will be paid, and if it is equal to or higher than the deductible, the compensation work will be initiated according to the expected value (insurance amount) and the agreed yield reduction rate (Black et al., 2015). The yield reduction rate corresponds to the deductible, and the precipitation index corresponds to the payout trigger value, i.e., after the precipitation disaster, the pure insurance rate under different payout trigger conditions is calculated according to the different payout trigger values at all levels.
3.4.2.1 Determination of deductible amount
From the regression analysis of yield reduction rate and precipitation index, it is known that when the precipitation is 0 mm, the yield reduction rate is 4.36%. At this point, by doing the integration of logistic probability density function, the probability of occurrence of precipitation disaster with yield reduction between (0, 4.36%) is calculated as 15.64%. Thus, the yield reduction rate of 4.36% was determined as the classification level of the weather hazard deductible.
3.4.2.2 Determining the precipitation index disaster level
In reality, the precipitation index is a positive number greater than 0. Based on the precipitation index, we determine that for every 3 units of yield reduction rate, the meteorological disaster level rises one level, combined with the historical maximum yield reduction rate in the Aksu area, the precipitation index disaster level in the Aksu area is divided into 9 levels, and the probability of precipitation disaster when the yield reduction rate of 28% falls within the interval of (27%, 30%) is only 0.19%.
3.4.2.3 Determining the pure premium rate
According to Eq. 6, the pure premium rate = yields reduction rate
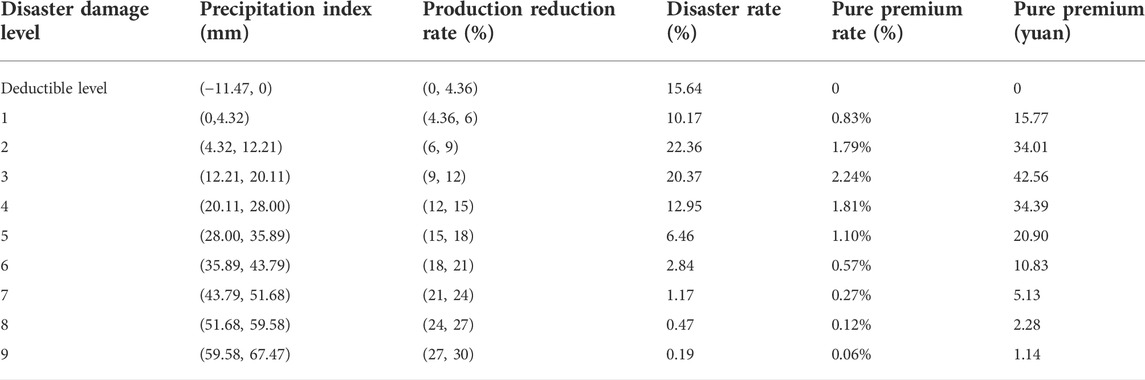
TABLE 6. Net premium rates under different disaster levels.
4 Conclusion, policy implication, and future research
4.1 Conclusion
Weather index insurance covers a weather risk that is usually highly correlated with losses in agricultural production. As a proxy for economic losses, weather index insurance is becoming increasingly popular in low-income agricultural countries (Adger et al., 2007).
In this paper, a weather index insurance model was established based on precipitation data from 1988 to 2019 in the Aksu region to analyze cotton production. Through the establishment of the model, the trend yield and meteorological yield series were separated by the H-P filtering method, the correlation between relative meteorological yield and weather index in each period was simulated by using regression analysis, and five probability distributions were fitted for the actual occurrence of yield reduction rate, and the pure premium rate and pure premium amount under different disaster levels were calculated by combining with the expected loss method in insurance actuarial. The results of the study are important for cotton farmers in similar areas to carry out production activities within the environmental carrying capacity in order to cope with climate change and promote environmental sustainability.
By analyzing the relationship between precipitation data and cotton yield in each period, this paper examines the degree of influence of precipitation on cotton cultivation, proves that precipitation weather index insurance can effectively hedge the weather risk to cotton cultivation, provides a basis for the establishment of future disaster compensation mechanism, and is of significant importance to protect farmers’ economic income, promotes the sustainable development of regional agricultural production and the implementation of rural revitalization strategy, and also provides a reference basis for the establishment of weather index insurance for other crops in the future.
4.2 Policy recommendations
4.2.1 Providing government subsidies and strengthening infrastructure investment
Weather insurance, as a new type of agricultural insurance, requires financial and material resources to promote, while the high risk and slow return drawbacks of agricultural insurance itself require government support (Xie and Lin, 2004). 1) Incorporate weather index insurance into the scope of policy cotton insurance, and set reasonable premium subsidies according to local financial levels and cotton production status. 2) The government should increase the construction of weather data collection infrastructure and a sufficient number of weather stations and weather databases that meet the standards. Weather index insurance claims are based on the weather information provided by local weather stations. A standard weather observation station can cover 20 square kilometers, according to this standard, there is a large gap between the number of existing stations and the actual demand in Xinjiang. 3) The meteorological department uses new technologies such as satellites and Doppler weather radar to improve the accuracy of meteorological forecasting, provide fast and comprehensive meteorological information to the relevant demand parties from all walks of life, establish a meteorological and insurance information sharing platform, carry out big data analysis, and improve the meteorological disaster warning system for agricultural insurance (Dong et al., 2020).
4.2.2 Strengthening insurance company publicity and innovative business practices
Farmers’ awareness of weather index insurance is the key to taking out insurance. Publicize the content of weather index insurance through cooperatives or agricultural companies to increase farmers’ awareness of weather insurance. Insurance companies use TV, radio, Internet, and other mass communication media to promote weather index insurance, so that farmers understand the content of weather index insurance subject matter, claims, preferential policies, business processes, and other related matters; use rural grassroots organizations to build a platform for promoting weather index insurance products, and play the role of grassroots organizations in pre-promotion training, information dissemination and insurance processing (Giné. and Vickery, 2007).
On the one hand, insurance companies strengthen cooperation with local rural financial institutions in their operations, and learn from the experience of bundling weather index insurance and loans in developing countries such as India to expand the scale and coverage of weather index insurance sales (Goodwin et al., 2004); on the other hand, using the outlets of local credit institutions for product promotion, sales and claims can effectively reduce operating costs, improve claims processing efficiency, and In addition, it can increase the business income of rural financial institutions and improve the rural credit environment. With this model of interaction between banks and insurance companies, the sustainable development of weather index insurance and agriculture can be effectively promoted (Besley, 1995).
4.3 Limitations of the study and future research
This study provides strong evidence for the sustainability of cotton production in Xinjiang. However, some limitations are noteworthy. First, the results of the empirical analysis show that the incidence of extreme disasters in the study area is less than 1%, and relevant statistics are scarce. How to use this part of tail data in the model will be one of the focuses of future research. Secondly, how constructing a weather index insurance risk transfer model based on different cotton areas and weather hazard levels in Xinjiang and combining the trigger values of the weather index will be the direction of future research.
Data availability statement
The original contributions presented in the study are included in the article/supplementary material, further inquiries can be directed to the corresponding authors.
Author contributions
Conceptualization: YH and QZ. Data curation: ZY and YL. Formal analysis: IJ, SW, MA, and ZY. Funding acquisition: ZY and GL. Investigation: ZY and YH. Methodology: YH and LZ. Project administration: GL. Resources: YH and QZ. Supervision: ZY. Validation: GL, IJ, ZY, and JQ. Visualization: MA, GL, JQ, and ZY. Writing—original draft: ZY. Writing—review and editing: MA, QZ, GL, ZY, and JQ.
Funding
This work was supported by the National Social Science Foundation of China (Project No. 18ZDA072; 19XJY009); the Department of Higher Education, Ministry of Education, Collaborative Education Program (Project No. 202002161032); and Ministry of Education Executive Committee Project (Project No. NJX22141).
Acknowledgments
The authors would like to thank Huazhong Agricultural University for their support and concern in conducting this research. Furthermore, we would like to thank our colleagues at Tarim university for their support in data collection, field visits, and valuable thoughts in preparing this manuscript. And finally, the authors would like to thank the reviewers for their insightful comments.
Conflict of interest
The authors declare that the research was conducted in the absence of any commercial or financial relationships that could be construed as a potential conflict of interest.
Publisher’s note
All claims expressed in this article are solely those of the authors and do not necessarily represent those of their affiliated organizations, or those of the publisher, the editors and the reviewers. Any product that may be evaluated in this article, or claim that may be made by its manufacturer, is not guaranteed or endorsed by the publisher.
References
Abdukrim, A. (2007). Analysis of climate factors impacting cotton output in Xinjiang. Desert and oasis meteorology, 29–34. doi:10.3969/j.issn.1002-0799.2007.06.008
Adger, W. N., Agrawala, S., Mirza, M. M. Q., Conde, C., O’Brien, K., Pulhin, J., et al. (2007). “Assessment of adaptation practices, options, constraints, and capacity,” in Climate change 2007:impacts, adaptation, and vulnerability. Contribution of working group II to the fourth assessment report of the intergovernmental panel on climate change. Editors M. L. Parry, O. F. Canziani, J. P. Palutikof, P. J. van der Linden, and C. E. Hanson (Cambridge, UK: Cambridge University Press), 717–743. doi:10.2134/jeq2008.0015br
Besley, T. (1995). Nonmarket institutions for credit and risk sharing in low-income countries. J. Econ. Perspect. 9 (3), 115–127. doi:10.1257/jep.9.3.115
Black, E., Tarnavsky, E., Greatrex, H., Maidment, R., Mookerjee, A., Quaife, T., et al. (2015). “Exploiting satellite-based rainfall for weather index insurance: The challenges of spatial and temporal aggregation,” in 1st International Electronic Conference on Remote Sensing. doi:10.3390/ECRS-1-F002
Cao, W., Cheng, L., Yang, T. M., and Xu, Y. (2019). Study on weather index insurance of drought damage at a jointing-heading stage of winter wheat in Henan Province. Meteorology 45 (02), 274–281. doi:10.7519/j.issn.1000-0526.2019.02.012
Chao, N. N., Yang, B. H., and Luo, S. F. (2017). A study on estimation of premium for cotton revenue insurance-based on clayton copula function. Stat. Res. 34 (08), 92–99. doi:10.19343/j.cnki.11-1302/c.2017.08.009
Chen, X. M. (2011). Research on the application of weather index insurance in China. Finance Econ. (09), 90–92. doi:10.19622/j.cnki.cn361005/f.2011.09.027
Chu, S. J., and Cao, J. (2014). The designing for weather index insurance based on copula method: Taking nantong cotton precipitation index insurance as an example. EcologicalEconomics 30 (10), 34–37. doi:10.3969/j.issn.16714407.2014.10.008
Collier, B., Skees, J., and Barnett, B. (2009). Weather index insurance and climate change: Opportunities and challenges in lower income countries. Geneva Pap. Risk insur. Issues Pract. 34, 401–424. doi:10.1057/gpp.2009.11
Conradt, S., Finger, R., and Spörri, M. (2015). Flexible weather index-based insurance design. Clim. Risk Manag. 10, 106–117. doi:10.1016/j.crm.2015.06.003
Diarra, A., Barbier, B., Zongo, B., and Yacouba, H. (2017). Impact of climate change on cotton production in Burkina Faso. Afr. J. Agric. Res. 12 (7), 494–501. doi:10.5897/AJAR2015.10763
Dong, J. M., Zhang, Y. Y., Chen, J. W., Hao, L., and Shi, D. W. (2020). Study on the meteorological insurance index of rice insurance: A case study of lianyungang city. Hubei Agric. Sci. 59 (07), 126–130+135. doi:10.14088/j.cnki.issn0439-8114.2020.07.026
Draper, N. R., and Smith, H. (1998). Applied regression analysis. 3th Edition. New York: Wiley. doi:10.1002/9781118625590
Gallagher, P. (1987). U.S. Soybean yields: Estimation and forecasting with nonsymmetric disturbances. Am. J. Agric. Econ. 69 (4), 796–803. doi:10.2307/1242190
Giné, X., and Vickery, T. J. (2007). Statistical analysis of rainfall insurance payouts in southern India. Am. J. Agric. Econ. 89 (5), 1248–1254. doi:10.1111/j.1467-8276.2007.01092.x
Goodwin, B. K., Vandeveer, M., and Deal, J. (2004). An empirical analysis of acreage effects of participation in the federal crop insurance Program. Am. J. Agric. Econ. 86, 1058–1077. doi:10.1111/j.0002-9092.2004.00653.x
Gu, Y. W. (2016). Analysis of climatic conditions for cotton growth in Xinjiang[J]. Mod. Agric. Sci. Technol. (02), 255. doi:10.3969/j.issn.1007-5739.2016.02.151
Kendall, M., and Gibbons, J. D. (1990). Rank correlation methods. 5th ed. London: Oxford University Press. doi:10.2307/2290477
Li, N., Li, Y., Biswas, A., Wang, J., Fan, X., Chen, J., et al. (2021). Impact of climate change and crop management on cotton phenology based on statistical analysis in the main cotton-planting areas of China. J. Clean. Prod. 298 (3), 126750–750. doi:10.1016/j.jclepro.2021.126750
Liang, L. C., and Zhou, Y. (2019). The ratemaking of temperature index insurance: A case of grain crops. Statistics Inf. Forum 34 (08), 57–65.
Liu, K. W., Liu, K. Q., Deng, A. J., Yang, T., Su, R. R., Xi, W., et al. (2017). Weather index insurance design of middle-season rice heat damage based on regional difference of flowering stage. China Agric. Meteorol. 38 (10), 679–688. Available at https://kns.cnki.net/kcms/detail/detail.aspx?dbcode=CJFD&dbname=CJFDLAST2017.
Liu, S. B., Yi, L., and He, C. S. (2013). Spectral analysis and estimations of soil salt and organic matter contents. Soil Sci. 178, 138–146. doi:10.1097/SS.0b013e318295ba8f
Liu, Z. Y. (2020). Comparison of international competitiveness of large multinational agricultural enterprises. J. Theory (03), 49–57. doi:10.14110/j.cnki.cn-37-1059/d.2020.03.006
Lobell, D. B., Schlenker, W., and Costa-Roberts, J. (2011). Climate trends and global crop production since 1980. Science 333 (6042), 616–620. doi:10.1126/science.1204531
Ma, G. H. (2019). Foreign agricultural weather index insurance development practice and implications for China. WorldAgriculture 06. doi:10.13856/j.cn11-1097/s.2019.06.009
Martina, R. (2016). Weather risk management in agriculture. Acta 64 (4), 1303–1309. doi:10.11118/actaun201664041303
McIntosh, C., Sarris, A., and Papadopoulos, F. (2013). Productivity, credit, risk, and the demand for weather index insurance in smallholder agriculture in Ethiopia. Agric. Econ. 44 (4-5), 399–417. doi:10.1111/agec.12024
Mi, H. L., and Cheng, W. M. (2020). Study on spatial and temporal change of cotton production in Xinjiang from the perspective of utilization effect of cultivated land. China Agric. Resour. Zoning 41 (10), 221–227. doi:10.7621/cjarrp.1005-9121.20201027
Qu, S. M., Wang, D. N., Guo, C. M., Yang, X., Wang, M. Y., and Qiu, M. J. (2018). Insurance product design based on maize drought weather index: A case study in jilin province. J. Meteorology Environ. 34 (02), 92–99. doi:10.3969/j.issn.1673-503X.2018.02.012
Saseendran, S. A., Fisher, D., Reddy, K., Pettigrew, W., Sui, R., and Ahuja, L. (2016). Vulnerabilities and adapting irrigated and rainfed cotton to climate change in the lower Mississippi Delta region. Climate 4 (55), 55–20. doi:10.3390/cli4040055
Shao, J. (2016). Exploring the method of weather index insurance rate determination-to take rice drought index insurance as an example. Shanghai Insur. (04), 36–41. Available at: https://kns.cnki.net/kcms/detail/detail.aspx?dbcode=CJFD&dbname=CJFDLAST2016&filename=SHBX201604011.
Shirsath, P., Vyas, S., Aggarwal, P., and Rao, K. N. (2019). Designing weather index insurance of crops for the increased satisfaction of farmers, industry, and the government. Clim. Risk Manag. 25, 100189. doi:10.1016/j.crm.2019.100189
Stoeffler, Q., Wouter, G., Catherine, G., and Michael, C. (2016). Indirect protection: The impact of cotton insurance on farmers' income portfolio in Burkina Faso. Agric. Appl. Econ. Assoc. doi:10.22004/ag.econ.235980
Sun, X. Y., Wu, K. Y., and Zhang, Y. Q. (2016). Traditional agricultural insurance and weather index insurance demand: Substitution or complementarity? -Taking cotton agricultural insurance in Xinjiang as an example. J. Nanjing Agric. Univ. Soc. Sci. Ed. 16 (05), 116–126+157. https://kns.cnki.net/kcms/detail/detail.aspx?dbcode=CJFD&dbname=CJFDLAST2016.
Tao, Z., Xin, Y. M., Dong, Y. W., and Jin, P. W. (2022). Natural disaster insurance in China: Model reference, development challenges, and suggestions. Int. J. Nat. Resour. Ecol. Manag. 7 (2), 93–98. doi:10.11648/j.ijnrem.0702.14
Wang, K., Zhang, Q., Xiao, Y. G., Wang, B. W., Zhao, S. J., and Zhao, J. Y. (2014). Feasibility of agricultural product price index insurance. Insur. Res. (01), 40–45. doi:10.13497/j.cnki.is.t01.007
Wang, K., and Zhang, X. (2010). Influence of flexible crop yield risk distribution on crop insurance premium rate: A case study on cotton insurance in three counties of Xinjiang province. J. China Agric. Univ. 15 (02), 114–120.
Wang, X. W., Du, M. Z., Wang, L., Li, M. X., Xu, Y. Y., Liu, X. Y., et al. (2018). Design of the continuous rainfall days index insurance of peanuts in Henan Province. J. Ecol. 37 (11), 3390–3395. doi:10.13292/j.1000-4890.201811.039
Wang, Y. Q., Zhao, S. J., and Nie, Q. (2019). A study on synthetic weather index insurance for millet in qinxian county, shanxi province. Insur. Res. 04, 15–26. doi:10.13497/j.cnki.is.2019.04.002
Weber, R., Fecke, W., Fecke, W., and Musshoff, O. (2015). Meso-level weather index insurance. Agric. Finance Rev. 75 (1), 31–46. doi:10.1108/AFR-12-2014-0045
Wu, L. H., Lou, W. P., Yao, Y. P., Mao, Y. D., and Su, G. L. (2010). Design of products for rice agro-meteorological index insurance: A case in zhejiang province. China Agric. Sci. 43 (23), 4942–4950. doi:10.3864/j.issn.0578-1752.2010.23.021
Wu, Y. H. (2017). Research on the pricing of cash crop income insurance in China-A case study of Aksu cotton. Financial Theory Pract. (01), 102–106. doi:10.3969/j.issn.1003-4625.2017.01.018
Xie, J. Z., and Lin, C. C. (2004). On accelerating technological innovation of agricultural insurance operation in China. Insur. Res. 2004 (05), 42–44+34.
Xinhua News Agency (2021). Xinhua news agency. Available at: https://m.gmw.cn/baijia/2021-12/15/1302722428.html.
Xinjiang Uygur Autonomous Region Bureau of Statistics (2022). Xinjiang Uygur autonomous region Bureau of statistics. Available at: http://tjj.xinjiang.gov.cn/.
Xu, L. (2021). Research on the design of cotton weather index insurance in the South Xinjiang region. Thesis of Xinjiang University of Finance and Economics. Available at: https://kns.cnki.net/kcms/detail/detail.aspx?dbcode=CMFD&dbname=CMFD202201&filename=1021729218.
Yang, T. M., Sun, X. B., Liu, B. C., and Xun, S. P. (2015). Design of products for rice agro-meteorological index insurance: A case in zhejiang province. China Agric. Meteorol. 36 (02), 220–226.
Yang, Y., Han, S., Macadam, I., and Liu, D. L. (2014). Prediction of cotton yield and water demand under climate change and future adaptation measures. Agric. Water Manag. 144, 42–53. doi:10.1016/j.agwat.2014.06.001
Yin, D. (2014). Study on weather index agricultural insurance and its technical issues. Mod. Agric. Sci. Technol. 2014 (06), 330–332+335. Available at: https://kns.cnki.net/kcms/detail/detail.aspx?dbcode=CJFD&dbname=CJFD2014.
Yu, S. X., Zhang, L., and Feng, W. J. (2015). Easy and enjoyable cotton cultivation: Developments in China's cotton production. Cotton Sci. 27, 283–290. doi:10.11963/issn.1002-7807.201503013
Yu, Y., and Wang, J. H. (2021). The construction of multi-level agricultural insurance product system from a provincial perspective: The case of hubei province. China Insur. (02), 51–54. doi:10.3969/j.issn.1001-4489.2021.02.012
Yu, Y., Xu, J., and Qin, W. (2020). Letter regarding "Clinical outcomes comparing arthroscopic vs open ankle arthrodesis". Foot Ankle Surg. 26 (07), 117–120. doi:10.1016/j.fas.2019.07.010
Keywords: climate change, precipiation, cotton, weather index insurance, environmental sustain ability, China
Citation: Yang Z, He Y, Aamir M, Javed I, Li G, Zhang Q, Wang S, Zhou L and Qin J (2022) Weather index insurance for transition to sustainable cotton production under climate change in Xinjiang, China. Front. Environ. Sci. 10:1027260. doi: 10.3389/fenvs.2022.1027260
Received: 24 August 2022; Accepted: 26 September 2022;
Published: 14 October 2022.
Edited by:
Zeeshan Fareed, Huzhou University, ChinaCopyright © 2022 Yang, He, Aamir, Javed, Li, Zhang, Wang, Zhou and Qin. This is an open-access article distributed under the terms of the Creative Commons Attribution License (CC BY). The use, distribution or reproduction in other forums is permitted, provided the original author(s) and the copyright owner(s) are credited and that the original publication in this journal is cited, in accordance with accepted academic practice. No use, distribution or reproduction is permitted which does not comply with these terms.
*Correspondence: Muhammad Aamir, YWFtaXJzaGFpa2g4NkBob3RtYWlsLmNvbQ==; Gucheng Li, bGdjYWJjQG1haWwuaHphdS5lZHUuY24=; Qing Zhang, emhhbmdxaW5nMTk4M0B3ZWJtYWlsLmh6YXUuZWR1LmNu