 Tong Lin
 Zhulu Lin
 Siew Hoon Lim3
 Xuefeng Chu
- 1Environmental and Conservation Sciences Program, North Dakota State University, Fargo, ND, United States
- 2Agricultural and Biosystems Engineering Department, North Dakota State University, Fargo, ND, United States
- 3Agribusiness and Applied Economics Department, North Dakota State University, Fargo, ND, United States
- 4Civil, Construction and Environmental Engineering Department, North Dakota State University, Fargo, ND, United States
Agent-based modeling (ABM) has been employed to understand and capture the complexity of the coupled human-nature processes in water resource systems. One of the challenges is to model human decisions in the coupled human and natural systems. Hydraulic fracturing water uses were distributed through a depot-based water allocation system in the Bakken region of western North Dakota, United States. In this study, a spatially explicit ABM was developed to simulate this unique water allocation system. In the ABM, institution theory was used to model the State’s regulatory policies and procedures, while evolutionary programming was employed to allow the water-depot owners (or agents) to select appropriate strategies when applying for water permits. Cognitive maps simulated the water-depot agents’ ability and willingness to compete for more water sales. All agents had their influence boundaries that restricted their competitive behavior toward their neighbors, but not for non-neighboring agents. The decision-making process was constructed and parameterized with both quantitative and qualitative information. The ABM was calibrated against real-world water-use data, and the calibration results showed that the spatial ABM performed well in simulating the total number of water depots as well as the locations and water uses of water depots at the county level. By linking institution theory, evolutionary programming, and cognitive maps, our study exhibited a new exploration of modeling the highly complex dynamics of the decision-making process involved in coupled human-nature water resource systems.
1 Introduction
Agent-based models (ABMs, Macal and North, 2010) have been extensively used to simulate human decisions when modeling complex coupled human and natural systems (Monticino et al., 2007; An, 2012; An et al., 2014) because ABMs can describe the feedback between human and natural systems and incorporate the effects of institutional and physical constraints at various levels (Railsback and Grimm, 2012; Filatova et al., 2013). The ability to describe complex system dynamics at different spatial scales makes ABMs an ideal candidate for socio-hydrological issues such as managing sustainable water resources. Its applications in water resources management have increasingly received much attention in the recent decades (Xiao et al., 2018). Berglund (2015) provided a review of more than 30 ABM studies of water resource management in the last 20 years. The issues ranged from municipal water supply and demand to water infrastructure systems, and from water allocation to river basin management. Other examples of applying ABMs in water resources management can be found in Chu et al. (2009), Galán et al. (2009), Kandiah et al. (2016), and Tourigny and Filion (2019) on municipal water supply and demand, Kotz and Hiessl (2005), Montalto et al. (2013), and Liu et al. (2016) on water infrastructure systems, Akhbari and Grigg (2013), Zhao et al. (2013), Hu and Beattie (2019), and Lin et al. (2020) on water allocation systems, and Becu et al. (2003), Yang et al. (2009; 2012), Ding et al. (2016), and Tesfatsion et al. (2017) on river basin systems management.
The human decision or behavior models used in ABMs range from highly empirically-based ones (e.g., derived through trend extrapolation, regression analysis, expert knowledge-based systems) to more mechanistic or processes-based ones (e.g., econometric models, psychosocial models). Among the ABM applications in water resource management, the microeconomic model or its modifications are frequently used to simulate water user agents’ behaviors, which allows agents to maximize their benefit (e.g., Yang et al., 2012; Lin et al., 2020). These microeconomic models are characterized by computing a utility value for available options and then choosing the one with the maximum or satisfactory value. The agents are assumed to make rational choices. However, it is believed that in the real world, such choices or decisions are usually affected, or bounded by imperfect knowledge and information or limited abilities to make use of such resources (Simon, 1997; Manson, 2006).
It is clear that all approaches for modeling human decisions have their strengths and weaknesses and should be employed to best suit for the corresponding contexts (e.g., objectives, budget, and time limitations) and complement each other. In this study, our objective was to develop a spatially explicit ABM to simulate the water depot-based water distribution system for hydraulic fracturing (HF) in the Bakken region of western North Dakota, USA, by integrating institution theory, evolutionary programming, and cognitive maps to model the behaviors of the regulator and water user (i.e., water depots) agents and their interactions. Historical water permit and water use data as well as the information extracted from interviews with experts, state agencies, and water depot owners/operators were used to construct and parameterize the agents’ decision-making processes. By linking institution theory, evolutionary programming, and cognitive maps through parameterization with qualitative and quantitative information, our study exhibited a new exploration of modeling the highly complex dynamics of the decision-making process involved in any coupled human-nature water resource systems.
2 Study area and data
2.1 Study area
The study area includes 16 counties in western North Dakota, USA underlain by the Bakken and the underlying Three Forks Formations. The extent of the Bakken Formation in the U.S. (46.5°N-49.0°N, 99.5°W-107.2°W) is shown in Figure 1. Oil was initially discovered in the Bakken in 1951, but was not commercialized on a large scale until the last 20 years. The advent of modern horizontal drilling and hydraulic fracturing helps make Bakken oil production economic. The U.S. Geological Survey has estimated that the Bakken Shale Formation could yield 1,200 Mm3 (7.3 billion barrels) of recoverable oil reserves in the region (Pollastro et al., 2008; Gaswirth et al., 2013). Oil production in the Bakken is primarily concentrated in a core area of four western North Dakota counties (i.e., Dunn, McKenzie, Mountrail, and Williams) with more than 85% of the horizontal wells (>10,000) drilled in this area (Lin et al., 2018, see the hatched area in Figure 1).
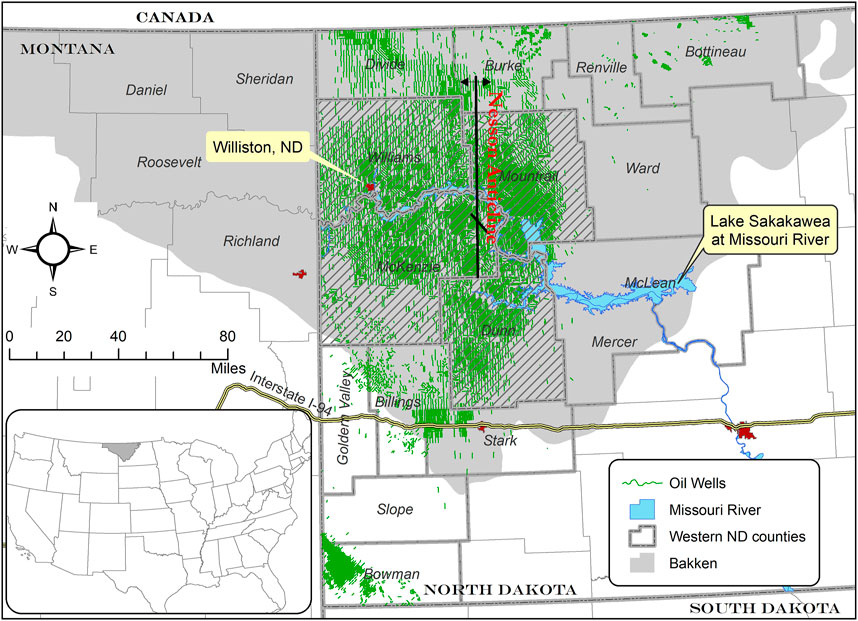
FIGURE 1. Bakken Formation and western North Dakota with horizontal oil wells.
2.2 Water depots
Water used for hydraulic fracturing and other oil production-related activities is almost exclusively supplied by hundreds of water depots that sell water to oil companies for hydraulic fracturing and occasionally to agricultural service companies. The water depots are owned by individuals or institutions that have state-issued water permits to access and supply water. Recognizing that the permanent water permit granting process takes months or years to complete and industrial water uses are ranked lower (second to last) in the order of water use priority, energy companies have to transport hydraulic fracturing operation-related water from water depots to their oil and gas wells using trucks in western North Dakota (Kusnetz, 2012).
The water depot shapefile and the permitted water use data were obtained from the North Dakota Office of State Engineer (OSE). The water use database contains annual water uses for all water permits issued by the OSE, water use types, locations of the point of diversion, as well as water sources (i.e., aquifers for groundwater and river basins for surface water). The water depot shapefile was merged with the North Dakota water use database through the unique water permit numbers to estimate annual water volumes sold by the water depots. Between 1980 and 2007, the State issued just 10 water permits for water depots. From 2007 to 2014, the number of water depots increased from 16 to 588. As shown in Figure 2, most water depots are located in the oil production counties in western North Dakota.
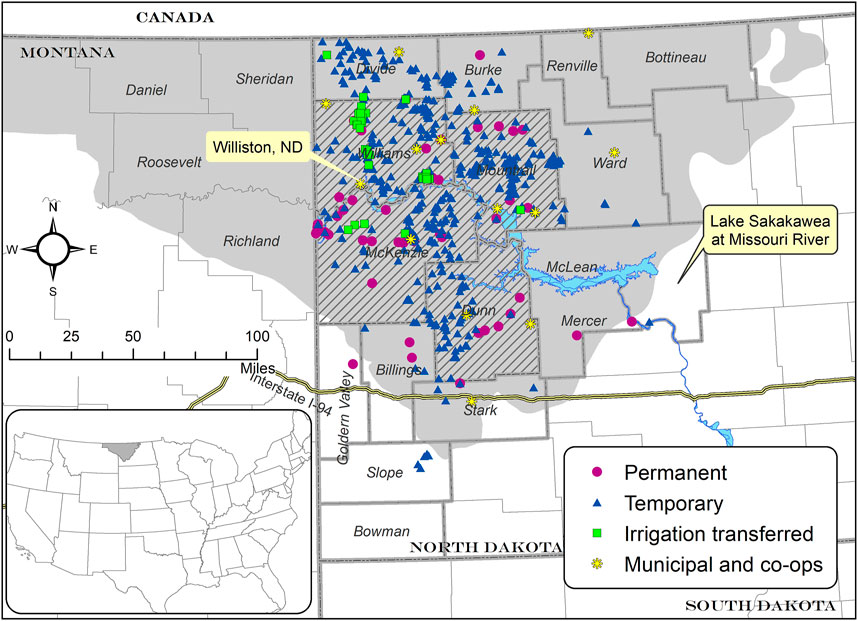
FIGURE 2. Water depots in Western North Dakota (2014).
Based on the major characteristics of the water depots, we categorized them into four types–permanent, temporary, irrigation transferred, and municipal/co-ops. The permanent water depots are those owned by individuals who have successfully obtained permanent (or perfected) water permits to sell water to the oil industry. These individuals have normally been in the water business for some time. The temporary water depots are those owned by individuals who have obtained temporary water permits to sell water to the oil industry. A temporary water permit only allows the permit holder to use a certain amount of water for no more than 1 year, without granting the permit holder a water right. North Dakota OSE started to issue considerably more temporary water permits beginning in 2012. An individual may own both permanent and temporary water depots.
The irrigation transferred water depots are owned by the farmers who have permanent water permits for irrigation. During 2008–2014, an emergency measure called the “In Lieu of Irrigation” program was undertaken by OSE to allow the temporary (1 year and renewable) use of water permits for irrigation for oilfield water use. In other words, if irrigation permit holders (usually farmers) forgo part of their permanent water permits in a calendar year (usually after a wetter than normal winter), they may apply for a temporary water permit yearly to sell the forgone portion of the water to the oil industry. The existence and emergence of this type of water depots are highly dynamic and dependent upon weather conditions. At the height of the Bakken oil boom, this program accounted for about one-fourth of the total water delivered by water depots. The program was discontinued in 2015. Several local towns also built water depots to sell excess municipal water to increase their revenue (Kusnetz, 2012). Furthermore, the Western Area Water Supply (WAWS) project authorized by the North Dakota legislature, now serves communities and industries in the northwest region of the state, and also plans to sell 20% of its water to the oil industry. In 2014, approximately 20% of the total water depot use was supplied from the Missouri River through the WAWS project (Lin et al., 2018). The water depots that sell excess municipal water and the water from the WAWS project are called the municipal and co-ops water depots in this study.
2.3 Water sources
The four types of water depots withdraw freshwater from four major sources in the region: 1) Lake Sakakawea and the Missouri River, 2) surface water from other streams and lakes, 3) Fox Hills-Hell Creek aquifer, a bedrock aquifer covering almost the entire region, and 4) other groundwater from the shallow glaciofluvial aquifers in the region. The surface water and the shallow groundwater have been fully or nearly fully appropriated. The water availability from these sources is also dependent on climate conditions. Water diversion from Lake Sakakawea or the Missouri River requires permits from the U.S. Army Corps of Engineers. The Missouri River accounts for 96% of the State’s surface streamflow and is the only large source of unallocated water in the State and particularly in the water-limited Bakken region. In May 2010, the U.S. Army Corps of Engineers placed restrictions on access to the Missouri River from Lake Sakakawea, which comprises most of the length of the Missouri River in the Bakken region. The surplus water restrictions have been relaxed somewhat and, in December 2010, 123 Mm3 (32.5 billion gallons) of annual surplus water from Lake Sakakawea was made available for temporary permits (Horner et al., 2016).
When aquifers become fully appropriated, the OSE has been authorized by the legislature to put entire aquifers or portions of aquifers on the deferred status with no further allocations. Under the prior appropriation system, if harmful conditions become apparent, water uses are retired in the order of beneficial use date, within the area of effect. For example, the Fox Hill-Hell Creek aquifer is restricted from substantial oil development use and should not be further depleted by oil development as long as the current restrictive policy remains in place. As early as 1984 a state policy known as the “Lindvig Memorandum” was adopted allowing for use of the Fox Hill-Hell Creek water for the oil industry only in highly restricted conditions (Schuh, 2010; Fischer, 2013). A more restrictive policy for industrial use of the Fox Hill-Hell Creek aquifer water was formalized in 2013. If this restrictive policy is lifted or a severe drought further limits water supply from other water sources, the aquifer may be affected by oil development.
Before 2012, the Bakken shale oil production used more groundwater than surface water, while after 2012, the trend was reversed with about two-thirds of HF water coming from the surface water. The main reason for this shift is that the OSE started to issue considerably more temporary water permits beginning in 2012 and the sources of water for these temporary water permits were primarily surface water, including Lake Sakakawea and the Missouri River. The spatial extents of surface water and groundwater sources were obtained from North Dakota State Water Commission.
2.4 Other data
The HF water use data for individual Bakken horizontal oil wells were provided by the North Dakota Department of Mineral Resources Oil and Gas Division. Observations of streamflow and groundwater levels were retrieved from the USGS National Water Information System (https://waterdata.usgs.gov/nd/nwis/rt) and the North Dakota Department of Water Resources (https://www.swc.nd.gov/info_edu/map_data_resources/), respectively. The precipitation data in western North Dakota were used for decisions on water allocations between irrigation industrial use. Annual county-level precipitation data were retrieved from the PRISM Spatial Climate Datasets (http://prism.oregonstate.edu/) for the 16 western North Dakota counties.
It requires about 1,340 one-way truck trips to transport HF water for one unconventional oil or gas well with a truckload of about 20 tons (Hart et al., 2013). It is important to consider if roads and bridges are accessible for such heavy truck loads. For example, a temporary water depot is likely to be built on an existing road network while a permanent water depot owner may need to build an access road to the water depot as part of the investment. The road and bridge data for western North Dakota were obtained from the North Dakota Department of Transportation. The centerlines of the roads were mapped with GPS equipment. The transportation network data were also used to calculate the travel distance between a water depot and a Bakken oil well. The populations of the cities in the 16 western North Dakota counties were obtained from the United States Census Bureau.
To understand the water depot operations, we conducted two rounds of interviews with the field experts and water depot owners in the summers of 2015 and 2016. Besides these formal interviews, we also visited the Water Appropriations Division of the North Dakota State Water Commission several times during 2015–2016 and five private and cooperated water depots in western North Dakota in June 2015 for data collection.
The first round of interviews was conducted on July 27–29, 2015, when we attended the Bakken Conference and Expo in Grand Forks, North Dakota. We interviewed five experts from water solution companies and research institutions. The interview questions and answers are summarized in Supplementary Tables S1, S2. The second round of interviews was designed to gain a better understanding of the decision-making processes and business behaviors of various types of water depots. In July 2016, we interviewed eight water depot owners and operators through phone calls or in-person interviews. Among these eight water depots, two were permanent water depots, three were temporary water depots, one was an irrigation transferred water depot, and two were municipal/co-op water depots. One of the water depot owners we interviewed had more than one water depot. The 2016 interview questions and answers are summarized in Supplementary Tables S3–S5.
3 Agent-based model description
Following the ODD + D protocol (Müler et al., 2013), the agent-based model for the water depots that distribute freshwater for hydraulic fracturing in the Bakken shale is described as follows, including an overview, design concepts, and details of the agent-based model that includes human decision-making processes.
3.1 Overview
3.1.1 Purpose
The purpose of the model is to simulate the depot-based water distribution system that distributes freshwater for hydraulic fracturing in the Bakken region of western North Dakota. The model is designed for the regulators to make scientifically defensible policies to manage regional surface-water and groundwater resources for long-term sustainable use.
3.1.2 Entities, state variables and scales
The modeled entities consist of four types of water-depot agents and one regulator agent. The four types of water-depot agents include 1) the water depots with conditional or perfected industrial water permits (denoted as permanent agents), 2) the water depots with temporary industrial water permits (denoted as temporary agents), 3) the water depots with a portion of their permanent irrigation water permits temporarily transferred to industrial water use (denoted as irrigation transferred agents), and 4) the water depots owned by local towns or through the WAWS project (denoted as municipal/co-ops agents). The regulator agent is the state water management agency or North Dakota Office of the State Engineer.
The state variables that represent the attributes of the water-depot agents include location, water permit type, approved water use, water source, water quality, capital investment, operation fees, water price, water use, profit, passion, effort, network, and operation history. The primary exogenous driver for the model is the water demand for hydraulic fracturing. The simulation area covers the 16 western counties in North Dakota where hydraulic fracturing is occurring. All the water-depot agents are in discrete units, with the longitude and latitude being used to represent their locations. The simulation period is 2007–2014 with a yearly simulation time step.
3.1.3 Process overview and scheduling
The objective of the agent-based model is to maintain the balance between water supply and demand for hydraulic fracturing in the Bakken region of western North Dakota. The model is initialized with the area’s spatial data (e.g., county boundary, streams/rivers, aquifers, roads, and bridges), as well as the water depot locations in 2007. At each simulation time step, the county-level HF water demands are calculated against the industrial water supplies. The HF water demand in each county is the sum of the HF water use for all horizontal wells located in that county, while the industrial water supply is the total amount of water sold by all water depots located in that county. If the annual HF water demand is greater than the current year’s water supply, the permit application, regulation, and competition submodels will be called to generate more water-depot agents. Otherwise, the model will go on to the next year (Figure 3).
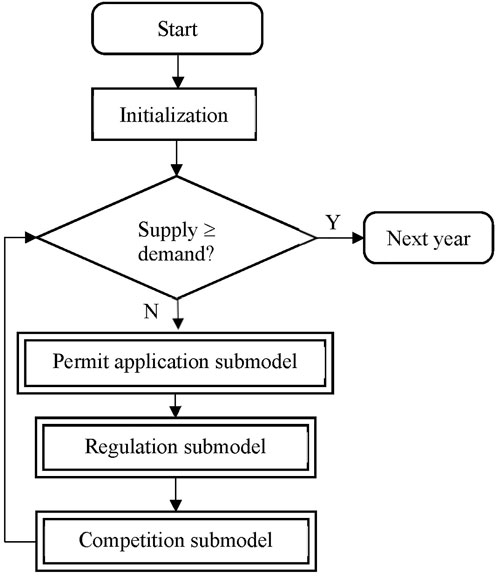
FIGURE 3. Process overview and scheduling of the agent-based model.
3.2 Design Concepts
3.2.1 Theoretical background
Water rights and permits in North Dakota are regulated by the OSE (Schuh, 2010), and the water distribution system in western North Dakota may be considered an administered market system. Based on our interviews with the state agency and the water depot owners, the regulation of water permits from the State significantly affects the water-depot agents’ behavior. In the regulation submodel, institution theory is used to model the regulator agent and its interactions with water-depot agents (An, 2012).
We followed Manson et al. (2005) to use evolutionary programming and genetic algorithms to model the water-depot agents’ behavior of selecting a suitable location to build the water depots as implemented in the permit application submodel. In Manson et al. (2005), evolutionary programming and genetic algorithms were applied to simulate household agents’ behavior of searching for a suitable location for activities such as clearing forests and planting crops (Manson and Evans, 2007).
The cognitive map is a descriptive decision theory that describes how people make decisions. The method involves the individual’s intention, experience, memory, learning ability, beliefs, knowledge, and relationship with neighbors to reach conclusions about issues of interest (Kolkman, 2005). Our interviews with the water depot owners showed that their intention, relationship, and knowledge affected their decision-making process. Therefore, we applied the cognitive map in the competition submodel to simulate the water-depot agents’ ability and the level of desire to compete for more water sales for hydraulic fracturing.
3.2.2 Individual decision-making
Each water-depot agent needs to make two decisions. One is to find a suitable location to build a water depot with a limited budget and unknown water demand in the area, and the other is to adopt certain strategies (e.g., setting water prices) to improve water sales. To find a suitable location, the water-depot agents use the symbolic regression of multicriteria evaluation to assess the suitability (
where
Water price and network are major concepts related to the water-depot agents’ decision-making regarding water sales. To develop the optimal strategies to improve their water sales, the water-depot agents compare their water sales with their neighbors’ within their cognitive boundaries, then either learn from their past performance or learn from their neighbors by adjusting water prices and developing additional network links. Except for the temporary water-depot agents, all other water-depot agents are assigned with memory attributes. The agent’s competition decision-making is influenced by the memory of past water prices, HF water demands, and water sales. The water-depot agents may have different levels of memory strength, i.e., they weigh their experiences in the past more or less differently. The regulator agent also affects the water-depot agents’ behavior.
3.2.3 Learning
The permanent and irrigation transferred agents have learning abilities since these two types of agents run their business for more than 1 year and have more flexibility in adjusting their strategies. A permanent agent or an irrigation transferred agent changes its competition behavior by learning from its neighbors and its own experience in the past. All water-depot agents are capable of exchanging water price information within their cognitive boundaries but no collective learning is implemented in the model. The details are implemented in the competition submodel.
3.2.4 Individual sensing
All water-depot agents know about the county-level HF water demand, historical water permits issued for the water source of interest, other available water sources, approved water amounts, water depot locations, land use, water uses, water price, operation time, budget, distance to road, oil wells, and network links. The irrigation transferred agents also know about precipitation and the approved water amount of the irrigation water permits. In addition, the municipal/co-op agents know about the city’s population and the approved water amount of the municipal water permits. The regulator agent has access to the observations of streamflows, groundwater levels, and precipitations in the region. It also knows the information on all industrial water permit applications, including permit types, permit application and approval dates, approved amount, duration, and water uses.
The regulator agent’s sensing process is modeled without errors, and the spatial scale of its sensing is global. The water-depot agents are also assumed to receive water price information from other agents without errors, and the spatial scale of their sensing is local. The agents are assumed to simply know the values of the relevant variables and the costs for cognition or gathering information are not explicitly included.
3.2.5 Individual prediction
The permanent and the temporary agents use historical water permit data associated with a certain water source to decide how much water to apply in their water permit application for a new water depot. This prediction process is simulated with no error, and there are no internal models used by the agents to estimate future conditions.
3.2.6 Interaction
Two types of interactions are modeled, one being the interactions between the regulator agent and the water-depot agents, and the other being the interactions among the water-depot agents. All water-depot agents have to follow the OSE’s regulations, so the interactions between the regulator and the water-depot agents are direct. Their interactions are also water source-specific because some water sources (e.g., the Fox Hill-Hell Creek aquifers) are regulated more strictly than others. The regulator agent also curtails water use during drought, which may affect the water extraction decisions for individual water-depot agents, who implement the regulator agent’s decisions without error.
The interactions between the water-depot agents are indirect because the HF water demands fulfilled by one agent are no longer available for the other agents. Since a water-depot agent only competes with the other agents within its cognitive boundary, so this type of interaction depends on the locations of the water-depot agents. The communications between the water-depot agents mainly include exchanging water price information.
3.2.7 Collectives
The individual water-depot agents are categorized into four groups based on the types of water permits: 1) permanent agents, 2) temporary agents, 3) irrigation transferred agents, and 4) municipal/co-op agents.
3.2.8 Heterogeneity
Each water-depot agent is unique in terms of the combination of state variables such as location, water permit type, approved water amount, water source, operation time, initial investment, operation fee, profit, water price, water use, passion, effort, and network. The agents’ decision-making processes are also different for the four different types of agents. First, the depot location selection process is different. The permanent and temporary agents use evolutionary programming and genetic algorithms to select a suitable location within a county, while the locations of the irrigation transferred and municipal/co-op agents are determined by the existing permit locations. Second, the process of determining how much to apply for during permit application is different. The irrigation transferred and municipal agents estimate how much water is to be transferred from their original respective water permits based on precipitation or population, while the permanent and temporary agents estimate the water amount based on the historically approved water permits for a certain water source. Third, the competition behaviors of the four types of water-depot agents are different. The permanent and irrigation transferred agents are assigned with learning abilities so that they can adjust water prices or expand the network by learning from their neighbors and their own experience. The permanent, irrigation transferred, and municipal/co-op agents can set annual water sale objectives at the beginning of each year and review their objectives at the end of that year. The temporary agents do not change their water prices and do not set annual water sale objectives.
3.2.9 Stochasticity
All new permanent and temporary agents are assigned with an initial location randomly generated by assuming that they may be uniformly distributed within the 16 counties in western North Dakota. For each new permanent or temporary agent, the applied water amount is randomly generated based on the past water permits issued for the same water source. To simplify the actual water permit approval process, a random value generated between 0 and one is compared with the difficulty level assigned to the water source.
The permanent or irrigation transferred agents set up the initial water prices randomly within a range of $0.20-$1.00/barrel (1 barrel of water ≈120 L). Their passion attributes are randomly set to be “high”, “medium”, or “low”. Correspondingly, they set up their water sale objectives with the return on investment ratio being randomly generated within 20–100%. Three different investment levels ($50,000–$250,000, $250,000-$1,000,000, and $1,000,000 -$2,000,000) are randomly generated for the permanent and irrigation transferred water depots. The municipal/co-op agents set up their water sale objectives with an expected water use ratio randomly generated from 0 to 5%. The effort values corresponding to the three different passion attributes are randomly generated with ranges of 0–40, 40–70, and 70–100%, respectively. The temporary agents set up their water prices and the effort values depending upon how they perceive the competition level within the cognitive boundary. If the competition level is perceived to be high, the water prices are randomly generated between $0.20-$0.60/barrel and the effort values are randomly generated between 50–100%. If the competition is perceived to be low, the water prices are randomly generated within a range of $0.60-$1.00/barrel, and the effort values are randomly generated between 0–50%. The water-depot agents are randomly selected to process in order, and the nearby oil wells are also randomly selected for the water-depot agents to sell water to. The details are provided in the three submodels (see Supplemental Materials).
3.2.10 Observation
Water depot locations, water sources, points of diversion, water uses, and the number of water depots are collected at the end of each simulation year for model calibration and sensitivity analysis. The key outputs of the agent-based model include the spatial locations, points of diversion, water-depot types, and water uses of individual water-depot agents whose water use is greater than 0. The water uses are also aggregated at the county and water source levels.
3.3 Details
3.3.1 Implementation details
The model is implemented using C# and ArcObject SDK 10.2 (ESRI, Redlands, California). The development platform is Visual Studio 2012 (Microsoft, Redmond, Washington). The desktop version of the model can be made available upon request, but the executable must be run in the environment of ArcMap 10.2 (ESRI, Redlands, California) or a higher version.
3.3.2 Initialization
The model is initialized in 2007 with the spatial data of water sources, oil wells, county-level precipitation, and roads in the 16 counties in western North Dakota. The 16 water depots that existed in 2007 are populated with attributes including locations, water sources, permit types, approved water amounts, and water uses. The water price and network link attributes are also initialized for any new water-depot agents. The initialization is the same for different simulation scenarios.
3.3.3 Input data
The spatial extent of the 16 western North Dakota counties, as well as the oil wells drilled during 2007–2014, populations, county-level precipitation, roads, and water sources in the region, are provided as GIS layers. Irrigation and municipal permits are provided as Excel files. All the input data and their explanations are listed in Table 1.
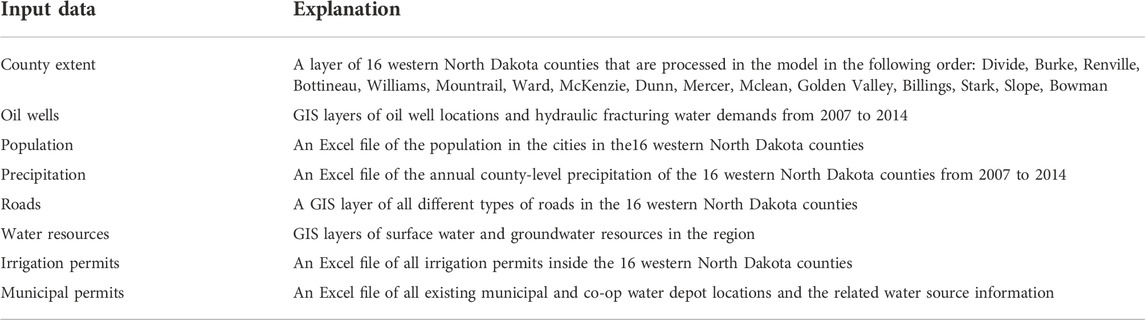
TABLE 1. Input data for the agent-based model.
3.3.4 Submodels
The agent-based model consists of three submodels: permit application, regulation, and competition. The permit application submodel describes a water-depot agent’s water permit application process. It uses evolutionary programming and genetic algorithms to simulate the agent’s decision-making process in determining water-depot location, water source, and applied water amount. The competition submodel applies the cognitive maps to simulate the water-depot agents’ behavior in the water market competition by learning from their neighbors and their own experiences.
The regulation submodel implements the institution theory to simulate the regulator agent’s interactions with four types of water-depot agents. The regulator agent affects the water-depot agents’ states and behaviors in three areas. First, the regulator agent regularly checks the water-depot agents’ water uses and may cancel a water-depot agent’s conditional water permit if its cumulative water use remains zero after holding a water permit for 3 years. Second, the regulator agent sets the accessibility and the difficulty level of applying for a permit to withdraw water from a certain water source. The water sources in the region are categorized into four types based on accessibility and difficulty, i.e., the Fox-Hills-Hell Creek aquifer, other groundwater, Lake Sakakawea and the Missouri River, and other surface water. The approval rate of a new water permit application is determined by two parameters: accessibility and difficulty. Third, the regulator agent holds a certain number of water permits in abeyance based on the permits’ priority dates during dry years when precipitation is below a 30-year normal.
In the permit application submodel, the HF water use data for individual oil wells are used to calculate the county-level HF water demand at a given time step. Historical water permit data are used to determine the applied water amount in a new water permit application by a water-depot agent. Various GIS spatial data such as roads, water sources, and oil well locations are used in location selection for a new water depot. In the competition submodel, the data from the interviews with water depot owners are used to determine the goals, water price ranges, and other concepts related to the water-depot agents’ competition behaviors. Other GIS data including road conditions, oil well locations, and water source locations are also used in formulating the water-depot agents’ competition behaviors.
In the regulation submodel, streamflows and groundwater levels are used to determine the difficulty level of applying for permits to withdraw water from a certain water source. Historical water permit data are used to determine the approved water amount for a permit application. The county-level precipitation data are used to determine whether it is necessary to hold certain industrial water permits in abeyance. Table 2 lists the model parameters and their default values or ranges. The implementation details of the three submodels are provided in the Supplemental Materials.
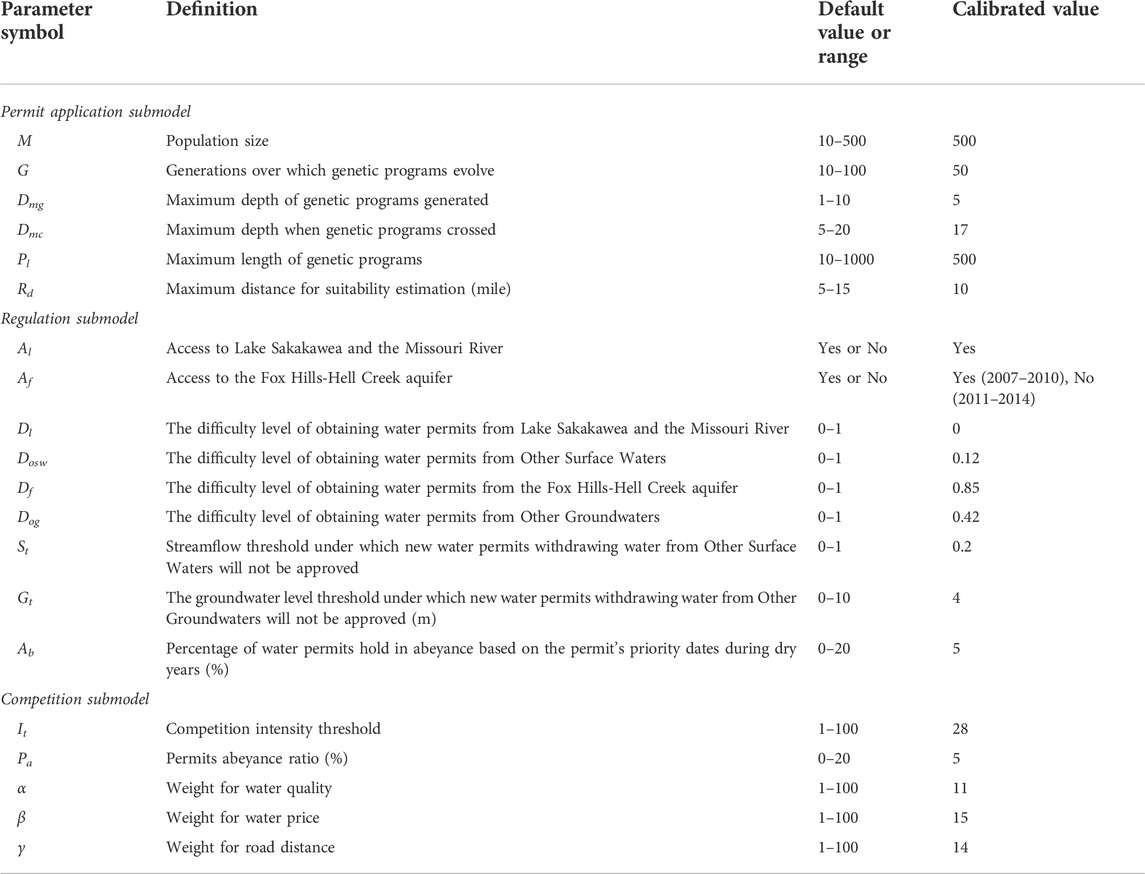
TABLE 2. Parameters of the agent-based model.
3.4 Model calibration and sensitivity analysis
The agent-based model described above was manually calibrated against the physical locations of individual water depots, the numbers of different types of water depots, and historical water uses by water depots (see Table 2 for the calibrated values of parameters). The study area was divided into 1094 cells of 8 × 8 km (5 × 5 miles). Each cell may have zero, one, or multiple water depots. We used Cohen’s Kappa coefficient (κ) to measure the agreement between the actual and the model-simulated numbers of water depots in individual cells. Cohen’s Kappa coefficient (Cohen, 1960) is calculated using the formula (Ahmed et al., 2013):
where
We applied the One-At-A-Time method to analyze the sensitivity of the model parameters in terms of water depot locations and water uses. When testing the model parameters’ sensitivity in terms of water depot locations, we used Cohen’s Kappa coefficient to measure the agreement between the actual and model-simulated locations of all types of water depots. When testing the model parameter sensitivity in terms of water depot water uses, we used the coefficient of determination (R2) to measure the agreement between the recorded and simulated water uses from the four different types of water depots.
We used the sensitivity index (SI) to calculate the differences of κ or R2 when varying one input parameter from its minimum value to its maximum value. The sensitivity index is given by:
where Dmax and Dmin represent the minimum and maximum output values such as κ and R2 resulting from varying the parameter over its entire range listed in Table 2. A higher SI value means a more sensitive parameter.
4 Results
4.1 Water-depot location comparisons
Figure 4 shows the spatial distributions of the actual and model-simulated locations of all water depots. It appears that the model was able to place most of the model-simulated water depots in the vicinity of the actual water depot locations, especially in the center of the Bakken oil development such as in Williams, Mountrail, McKenzie, and Dunn counties. But in the outskirt of the region such as in Slope and Ward counties, the model prediction was less accurate. For instance, there were five temporary water depots in Slope County (south of the region), but the model did not place any simulated water depots inside this county. Similarly, the model did not simulate any water depots in Ward County (east of the region).
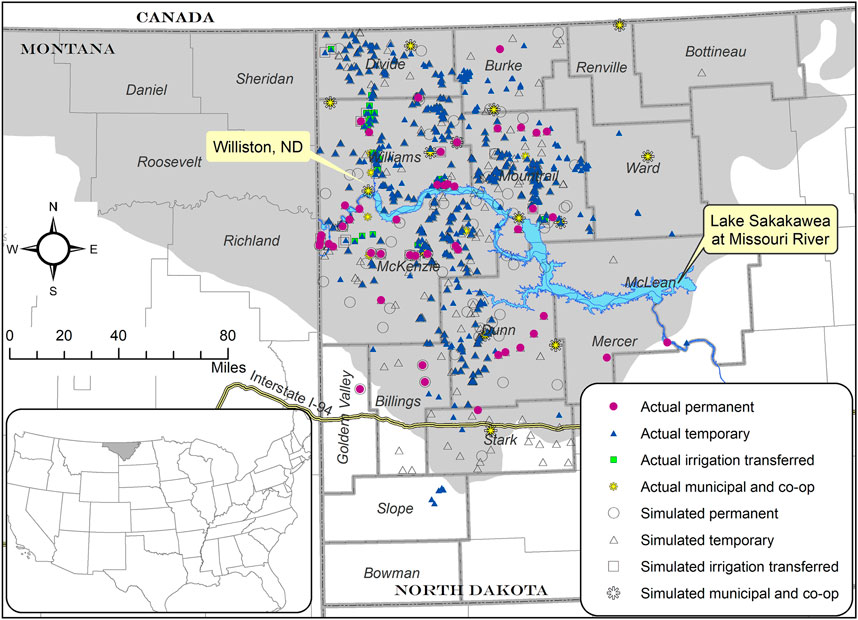
FIGURE 4. Comparison of the actual and the model-simulated locations of all water depots.
Table 3 shows the comparisons of the cells with different numbers of actual and model-simulated water depots inside them. It shows that about 73% of the cells with more than one water depot were simulated correctly, and about 66% of the cells with no water depot were simulated correctly. However, only about 28% of the cells with one water depot were correctly simulated by the model. Overall, about 62% of the cells were stimulated correctly with κ = 0.402.

TABLE 3. The cells with different numbers of the actual and model-simulated water depots (κ = 0.402).
We also compared the spatial distributions of the actual and model-simulated locations for the four different types of water depots (see Supplementary Figures S18–S21). The model was able to place most of the permanent water depots in the vicinity of the actual water depot locations. But it was less successful in Mercer County (east of the region) where two permanent water depots existed while the model did not simulate any water depots inside this county. The reason that more than a dozen of the model-simulated locations coincided with the actual locations of the permanent water depots was that these water-depot agents existed for the entire simulation period (2007–2014) and the model used the actual water depot locations specified in the initial year (i.e., 2007). The model was also able to place most of the temporary water depots in the vicinity of their actual locations, especially in the four counties with the most oil wells (Williams, Mountrail, McKenzie, and Dunn). But in the outskirt of the region such as in Slope, Ward, and Stark counties, the model prediction was less precise.
Most actual irrigation transferred water depots were located in the north-central area of Williams county where the Little Muddy River and the Yellowstone Buried Channel aquifer are (Lin et al., 2018). But the model-simulated water depots were spread out across Williams, Mountrail, and McKenzie counties. As for the locations of the municipal/co-op water depots, most model-simulated and actual water depots coincided. This was because the model used the existing municipal permits and their locations to determine the municipal water depots and the permit application submodel used the original eight co-op water depot locations as the locations for the simulated co-op water depots generated for 2011. Table 4 lists the percentages of cells that were simulated with correct numbers of water depots and the Cohen’s Kappa coefficients for the four different types of water depots.
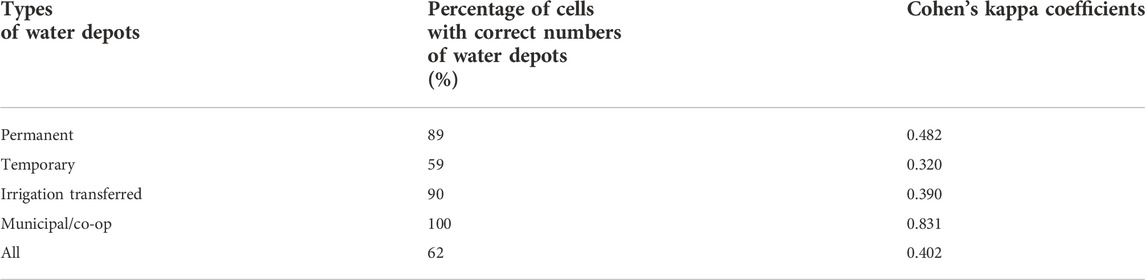
TABLE 4. Percentages of cells that were simulated with correct numbers of water depots and the Cohen’s Kappa coefficients for the four different types of water depots.
4.2 Water-depot number comparisons
Figure 5 shows the comparisons of the actual and model-simulated numbers of different types of water depots from 2008 to 2014. It shows that the model did well in simulating the numbers of permanent and temporary water depots. The model did a fair job in simulating the number of irrigation transferred water depots, overpredicting the numbers before 2013 but underpredicting the number in 2014. For the municipal/co-op water depots, the model underpredicted the numbers for the entire simulation period. Overall, the model did very well in simulating the total numbers of all water depots.
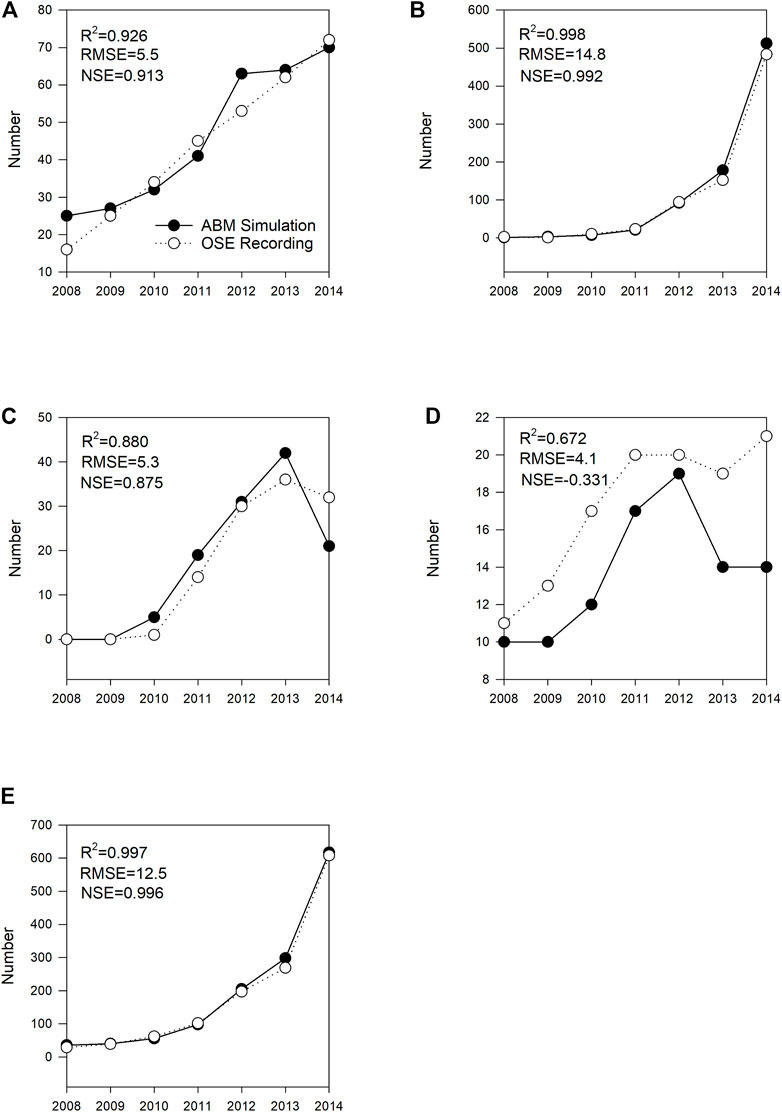
FIGURE 5. Graphical comparisons of the actual and model-simulated numbers of (A) permanent, (B) temporary, (C) irrigation transferred, (D) municipal/co-op, and (E) all types of water depots. Notes: ABM–agent-based model, OSE–Office of the State Engineer, RMSE–Root Mean Square Error, NSE–Nash-Sutcliffe Efficiency.
Figure 6 shows the comparisons of the numbers of the model-simulated and actual water depots in the four counties in the center of the region and the 12 other counties. It appears that the model was able to simulate the actual numbers of water depots at the county level reasonably well.
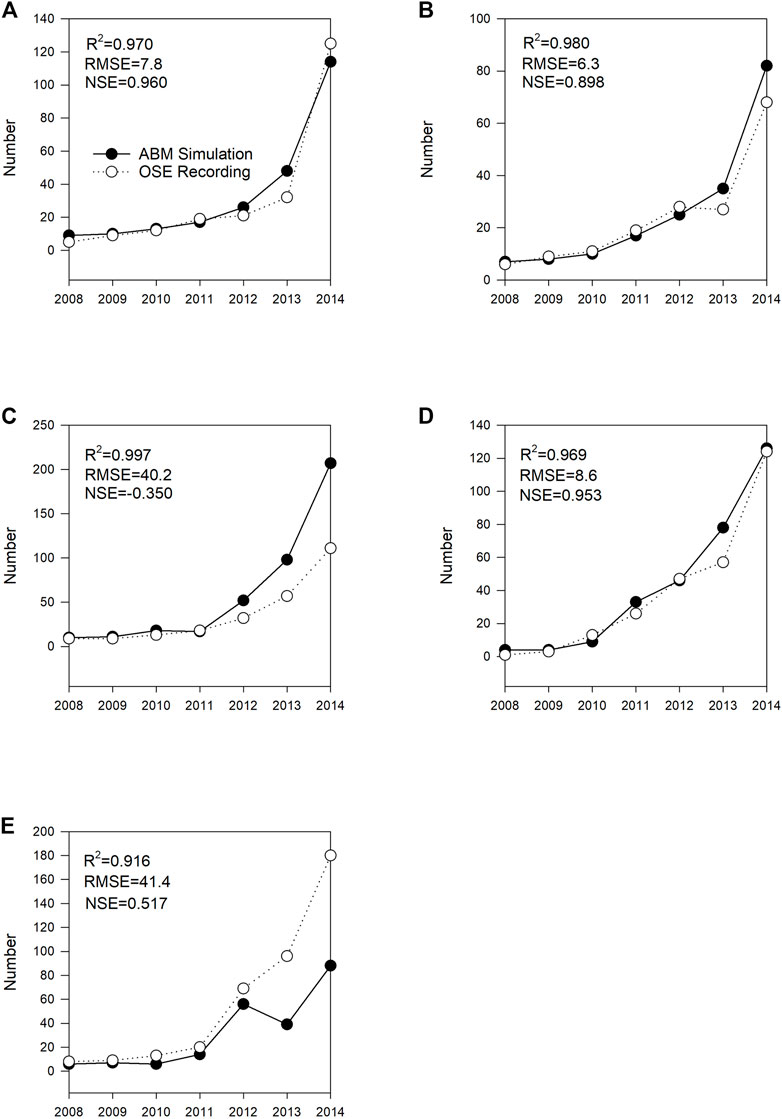
FIGURE 6. Graphical comparisons of the actual and model-simulated numbers of water depots in (A) Mountrail, (B) Dunn, (C) McKenzie, (D) Williams, and (E) other counties in western North Dakota. Notes: ABM–agent-based model, OSE–Office of the State Engineer, RMSE–Root Mean Square Error, NSE–Nash-Sutcliffe Efficiency.
4.3 Water-depot water use comparison
Figure 7 shows the comparisons of the recorded and model-simulated water uses for the four different types of water depots during 2008–2014. In general, the model did well in simulating the total water use of the four different types of water depots. A close inspection shows that the model slightly underpredicted the water use for the permanent and municipal/co-cop water depots while it overpredicted the water uses for the temporary and irrigation transferred water depots.
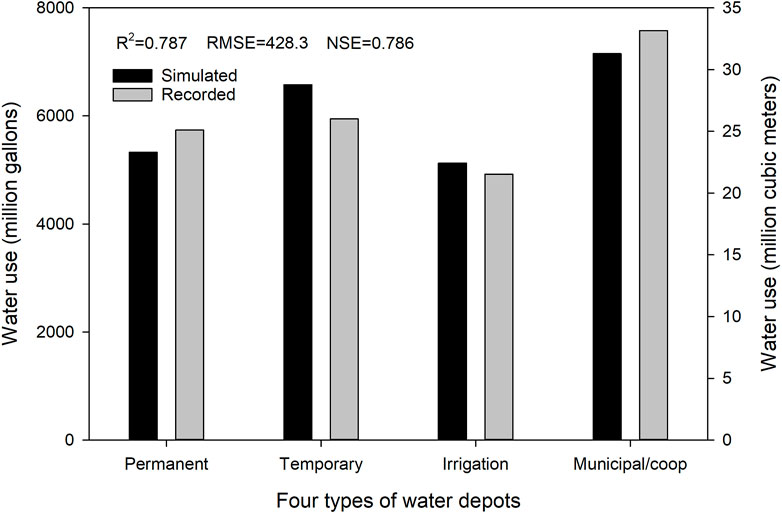
FIGURE 7. Graphical comparison of the recorded and model-simulated water uses of the four different types of water depots in 2008–2014. Notes: RMSE–Root Mean Square Error, NSE–Nash-Sutcliffe Efficiency.
Figure 8 shows the comparisons of the water uses of the actual and model-simulated water depots located in the four core counties and the 12 other counties. It appears that the model slightly overpredicted the water use in all four core counties but underpredicted the water use in the remaining 12 counties.
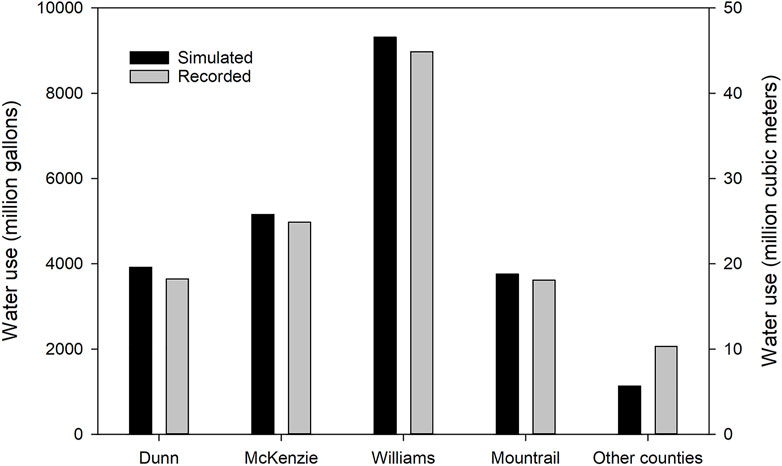
FIGURE 8. Graphical comparisons of water use for the actual and model-simulated water depots in the four core counties and the other counties in western North Dakota.
Figure 9 shows the comparisons of the recorded and simulated annual water uses from surface water and groundwater sources in 2008–2014. Overall, the model did well in simulating the water uses from the two different water sources. A closer inspection shows that the model overpredicted the water uses from the surface water sources in 2008–2010, 2012, and 2013, while underpredicting the water uses in 2011 and 2014. Unsurprisingly, the trend reversed for the groundwater sources.
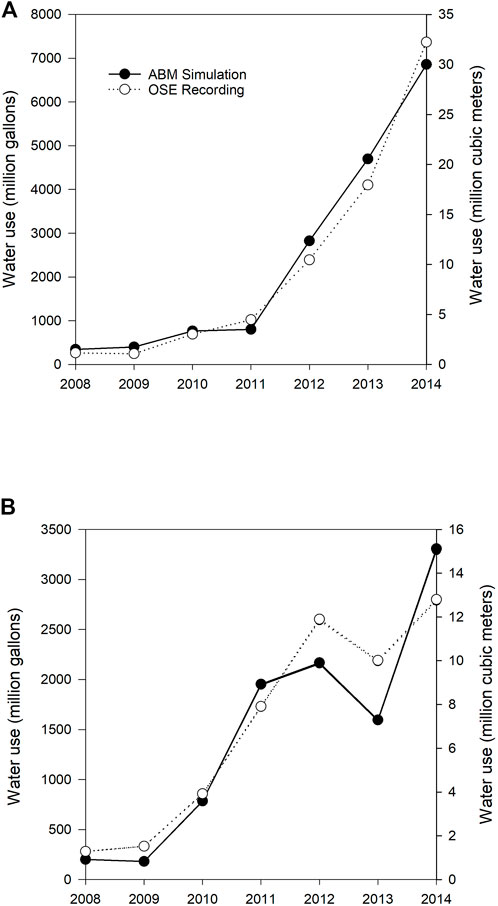
FIGURE 9. Graphical comparisons of the recorded and model-simulated water uses of (A) surface water source and (B) groundwater source.
4.4 Sensitivity analysis
Table 5 summarizes the results of the sensitivity analysis for the model parameters in the permit application, regulation, and competition submodels of the agent-based model for hydraulic fracturing in terms of water-depot locations (measured by κ) and water-depot water use (measured by R2). More details can be found in Supplementary Figures 22–27. As expected, none of the parameters in the competition submodel are sensitive to simulating the locations of water depots because the competition submodel is simulating the water-depot agents’ behavior of selling water to oil wells after their locations are already set. On the other hand, almost all the parameters in the three submodels are sensitive in terms of simulating the water uses even though the permit application and the regulation submodels mainly simulate the locations and the approved water permits (not the actual water uses) of water depots. This is because water depot locations affect the actual water uses. It should be noted that Al and Af are not included in the sensitivity analysis because they take binary values (Yes or No).
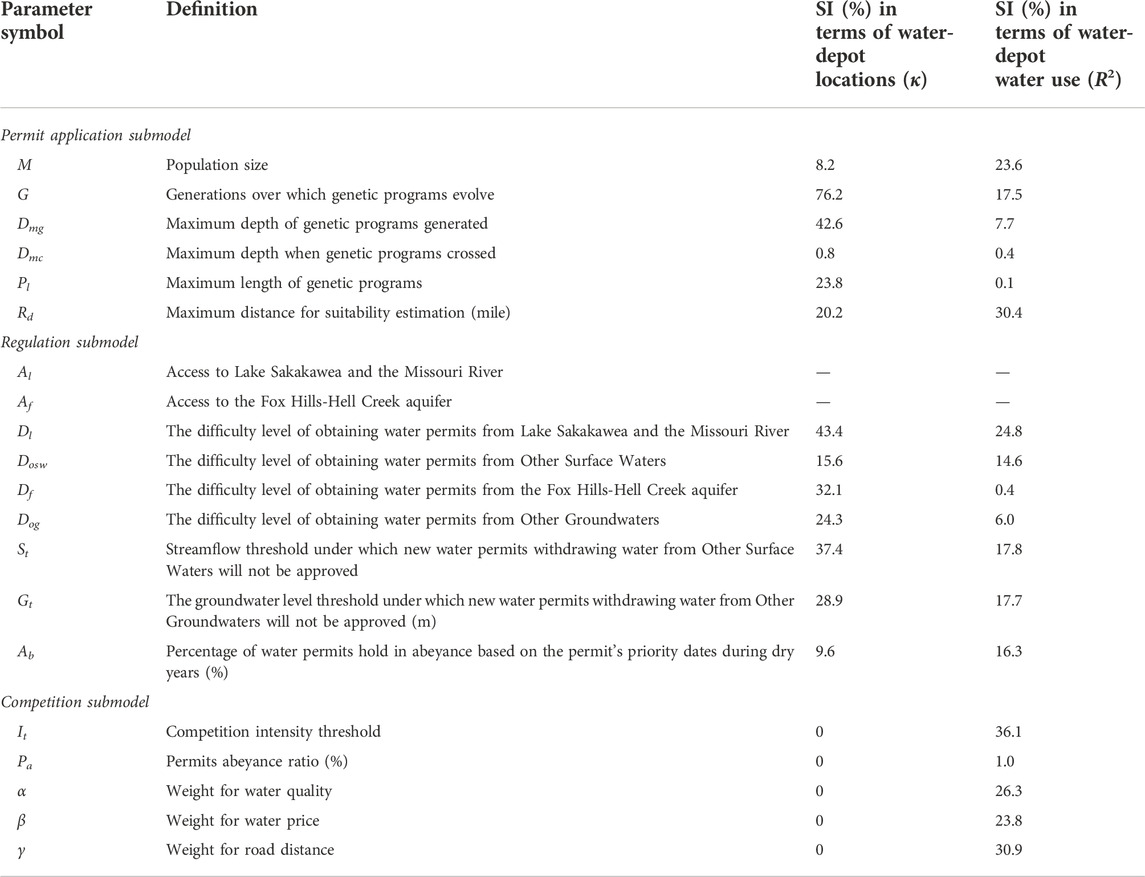
TABLE 5. Sensitivity Index (SI) values of the parameters in the three submodels of the agent-based model.
In terms of simulating water depot locations, G (Generations over which genetic programs evolve) is the most sensitive parameter in the permit application submodel (SI = 76.2%), whereas the maximum depth when genetic programs cross (Dmc) is the least sensitive parameter (SI = 0.8%). Among the four parameters in the regulation submodel that govern the difficulty levels of obtaining water permits from the four different water sources, the difficulty level of obtaining water permits from Lake Sakakawea and the Missouri River (Dl) is the most sensitive parameter in terms of simulating spatial locations of water depots (SI = 43.4%) and the difficulty level of obtaining water permits from other surface water (Dosw) is the least sensitive one (SI = 15.6%). The streamflow threshold under which the new water permits withdrawing water from other surface water will not be approved (St) is slightly more sensitive (SI = 37.4%) than the water level threshold, under which the new water permits withdrawing water from other groundwaters will not be approved (Gt) (SI = 28.9%).
In terms of simulating water depot water uses, the maximum distance for suitability estimation (Rd) is the most sensitive parameter in the permit application submodel (SI = 30.4%), whereas the maximum depth when genetic programs cross (Dmc) (SI = 0.4%) and the maximum genetic program length (PL) (SI = 0.1%) are not sensitive. Among the four parameters in the regulation submodel that govern the difficulty levels of obtaining water permits from the four different water sources, the difficulty level of obtaining water permits from Lake Sakakawea and the Missouri River (Dl) is the most sensitive parameter (SI = 24.8%) and the difficulty level of obtaining water permits from the Fox Hills-Hell Creek aquifer (Df) is the least sensitive one (SI = 0.4%). The streamflow threshold under which the new water permits withdrawing water from other surface water will not be approved (St) is as sensitive (SI = 17.8%) as the water level threshold under which the new water permits withdrawing water from other groundwaters will not be approved (Gt) (SI = 17.7%).
5 Discussion
Positing the Bakken region in western North Dakota as a coupled human and natural system, we developed a spatially explicit ABM to simulate the unique water depot water distribution system for hydraulic fracturing and other oil development activities. While water rights and permits are regulated by the State, nearly 600 water depots (in 2014) are in a “free” market to sell water to the oil industry for profit. Out of these water depots, most of them are owned by individuals while about two dozens are owned by cities or cooperatives. While some water depot owners have perfected (permanent) or 3-year conditional water rights to sell water for industrial use, the majority have temporary water permits that may be renewable every 12 months. The different statuses of the water permit holders also render the water depot owners with different opportunities in terms of investment and marketing strategies. In addition, the water depots withdraw water from different water sources that may have different levels of restrictions and regulations imposed by the state or federal agencies for different reasons. This may add another layer of uncertainty to the water depot owners when they make decisions. All these factors have posed great challenges in modeling the decision-making processes by the individual water depot owners and the state regulatory agency in the coupled human-nature water resources system.
Through the combined use of quantitative (historical recordings) and qualitative (personal interviews) data and building linkages among three behavior models (i.e., institutional theory, evolutionary programming, and cognitive maps), we developed an ABM to simulate the dynamics of the water depot locations, numbers, and water uses with reasonable success. The model particularly performed better in the four-county core area than the rest of the Bakken region. Although the water distribution system in the Bakken region of western North Dakota has its distinctive features, our research made significant progress in modeling the highly complex decision-making processes involved in the coupled human-natural systems. Our main contributions are reflected in three areas. First, we integrated the institutional theory, evolutionary programming, and cognitive maps to model the behaviors of the regulator and water-depot agents and their interactions in the coupled human and natural systems. Second, we combined the uses of qualitative and quantitative data for behavior model construction and parametrization. Specifically, we used the information gained through personal interviews to construct the behavior models for the four different types of water depot agents, and then used the historical data of water permits, water uses, streamflow, and groundwater level to parameterize these models. Third, we developed a spatially explicit ABM by incorporating more than a dozen layers of spatial features in the ArcObjects SDK environment.
The ABM presented in this paper is also considerably different from that in Lin et al. (2020), which is mainly reflected in the following four aspects: First, each agent in Lin et al. (2020) represented a group of water depots rather than an individual water depot, which inevitably generalized in specifying rules for agents’ behavior and discounted the spatial heterogeneity presented in almost all water resources management problems. In this study, each water-depot agent is unique in terms of the combination of state variables such as location, water permit type, approved water amount, water source, operation time, initial investment, profit, water price, water use, passion, effort, and network. Second, Lin et al. (2020) used a microeconomic framework of the constrained optimization problem to simulate the agents’ behaviors. All water-depot agents are assumed to make rational choices, making decisions to maximize the benefit of selling water to oil companies in the Bakken region, which is further assumed to take the form of a quadratic concave equation by assuming risk-averse behaviors for all agents (Johnson and Busemeyer, 2010). In this paper, three behavior models are linked together to simulate the decision-making processes of the regulator and water-depot agents and their interactions.
Third, Lin et al. (2020) did not explicitly account for the impact of climate conditions on a water-depot agent’s decision-making process. In the current model, when irrigation permit owners decide whether to transfer a portion of their irrigation permits for HF water use, they first compare the predicted precipitation in the current year with the regional 30-year normal. If the predicted county-level precipitation is greater than the 30-year normal, the irrigation permit owners will transfer part of their irrigation permits for industrial water use for 1 year. Otherwise, no transfer will occur. Also, the interactions between the regulator agent and the existing water-depot agents are dependent on climate conditions. During dry years, specifically, when the annual precipitation in the previous year is below the 30-year normal, the regulator agent will rank all existing water permits by their priority dates, and hold a certain percentage of recently issued permits into abeyance until next year. Fourth, the ABM in Lin et al. (2020) was implemented in MATLAB (Mathworks, Boston, MA) without spatial consideration, while this ABM was implemented in ArcObjects SDK (ESRI, Redlands, California) with explicit spatial references.
However, our model is without limitations. First, the water permit approval process for a conditional water permit application is simplified in the ABM. The actual conditional water permit application process can be complicated and may take several years to complete. For some nearly fully appropriated water sources, a hydrological model may be developed to evaluate the impacts of the new application. The actual process is outlined on the OSE’s website (https://www.swc.nd.gov/pdfs/water_permitting_process_chart.pdf). But, the process was simplified in our model by using a parameter to represent the difficulty level. Second, the simulation of the co-op water depot agents’ behaviors was also simplified. Nine co-op water-depot agents were generated in 2011 because the 2011 North Dakota state legislature authorized the construction of the WAWS project to serve the oil industry (Lin et al., 2018). The locations of these nine co-op water depot agents were assigned to the original WAWS project construction locations. All these nine co-op agents withdrew water from Lake Sakakawea and the Missouri River and did not adjust their water prices since the price was fixed by the State at $0.84/barrel (1 barrel of water ≈120 L). So the behaviors of the co-op water-depot agents were not explicitly modeled using evolutionary programming and cognitive maps.
Nevertheless, the ABM may be integrated with hydrological models to study the impacts of hydraulic fracturing activities on surface water and groundwater systems in western North Dakota. Lin et al. (2018) identified that the streamflow of the Little Muddy River was most affected by the Bakken oil development activities during 2008–2014. A Soil Water Assessment Tool model was developed for the Little Muddy River watershed and a MODFLOW model was developed for the Fox Hills-Hell Creek aquifer, which was the most vulnerable groundwater system in the region (Lin, 2022). In future study, the two hydrological models can be integrated with the ABM as a policy-making tool for managing these two water resources for sustainable uses.
Data availability statement
The datasets presented in this study can be found in online repositories. The names of the repository/repositories and accession number(s) can be found below: https://github.com/TomLin8064/ABM.
Ethics statement
The studies involving human participants were reviewed and approved by North Dakota State University Institutional Review Board. The patients/participants provided their written informed consent to participate in this study.
Author contributions
Z Lin and SH Lim acquired the funding for the research. Z Lin, SH Lim, and T Lin contributed to the conceptualization of the agent-based model. T Lin conducted interviews, processed data, and developed the computer codes of the agent-based model under the supervision of Z Lin, SH Lim, X Jia, and X Chu. All authors contributed to the writing of the manuscript.
Funding
This work was supported by the National Science Foundation [Award No.: ICER-1413954] and North Dakota Water Resources Research Institute.
Acknowledgments
Oil and gas well data were obtained from North Dakota Industrial Commission Oil and Gas Division and water use data were obtained from North Dakota State Water Commission. The authors would like to thank Michael Borders for his help in conducting interviews with water depot owners and field experts as well as the staff of North Dakota State Water Commission. ZL is an adjunct professor in the Department of Earth Systems Science and Policy at the University of North Dakota.
Conflict of interest
The authors declare that the research was conducted in the absence of any commercial or financial relationships that could be construed as a potential conflict of interest.
Publisher’s note
All claims expressed in this article are solely those of the authors and do not necessarily represent those of their affiliated organizations, or those of the publisher, the editors and the reviewers. Any product that may be evaluated in this article, or claim that may be made by its manufacturer, is not guaranteed or endorsed by the publisher.
Supplementary material
The Supplementary Material for this article can be found online at: https://www.frontiersin.org/articles/10.3389/fenvs.2022.1025559/full#supplementary-material
References
Ahmed, B., Ahmed, R., and Zhu, X. (2013). Evaluation of model validation techniques in land cover dynamics. ISPRS Int. J. Geoinf. 2, 577–597. doi:10.3390/ijgi2030577
Akhbari, M., and Grigg, N. S. (2013). A framework for an agent-based model to manage water resources conflicts. Water Resour. manage. 27, 4039–4052. doi:10.1007/s11269-013-0394-0
An, L. (2012). Modeling human decisions in coupled human and natural systems: Review of agent-based models. Ecol. Model. 229, 25–36. doi:10.1016/j.ecolmodel.2011.07.010
An, L., Zvoleff, A., Liu, J., and Axinn, W. (2014). Agent-based modeling in coupled human and natural systems (CHANS): Lessons from a comparative analysis. Ann. Assoc. Am. Geogr. 104 (4), 723–745. doi:10.1080/00045608.2014.910085
Becu, N., Perez, P., Walker, A., Barreteau, O., and Le Page, C. (2003). Agent based simulation of a small catchment water management in northern Thailand: Description of the CATCHSCAPE model. Ecol. Modell. 170, 319–331. doi:10.1016/s0304-3800(03)00236-9
Berglund, E. Z. (2015). Using agent-based modeling for water resources planning and management. J. Water Resour. Plann. Manage. 141 (11), 04015025. doi:10.1061/(ASCE)WR.1943-5452.0000544
Chu, J., Wang, C., Chen, J., and Wang, H. (2009). Agent-based residential water use behavior simulation and policy implications: A case-study in beijing city. Water Resour. manage. 23, 3267–3295. doi:10.1007/s11269-009-9433-2
Cohen, J. (1960). A coefficient of agreement for nominal scales. Educ. Psychol. Meas. 20 (1), 37–46. doi:10.1177/001316446002000104
Ding, N., Erfani, R., Mokhtar, H., and Erfani, T. (2016). Agent based modelling for water resource allocation in the transboundary Nile River. Water 8 (4), 139. doi:10.3390/w8040139
Filatova, T., Verburg, P. H., Parker, D. C., and Stannard, C. A. (2013). Spatial agent-based models for socio-ecological systems: Challenges and prospects. Environ. Model. Softw. 45, 1–7. doi:10.1016/j.envsoft.2013.03.017
Fischer, K. (2013). Groundwater flow model inversion to assess water availability in the Fox Hills- Hell Creek aquifer. Bismarck, North Dakota: North Dakota State Water Commission.
Galán, J. M., López-Paredes, A., and Del Olmo, R. (2009). An agent-based model for domestic water management in Valladolid metropolitan area. Water Resour. Res. 45, W05401. doi:10.1029/2007wr006536
Gaswirth, S. B., Marra, K. R., Cook, T. A., Charpentier, R. R., Gautier, D. L., Higley, D. K., et al. (2013). Assessment of undiscovered oil resources in the bakken and three Forks formations, williston province, Montana, North Dakota, and south Dakota. USGS Fact Sheet 2013-3013, 4p, http://pubs.usgs.gov/fs/2013/3013/.
Hart, M. V., Adams, T., and Schwartz, A. (2013).Transportation impacts of frac sand mining in the MAFC region: Chippewa county case study, white paper series: 2013. Madison, WI, USA: University of Wisconsin-Madison. National center for freight and infrastructure research and education.
Horner, R. M., Harto, C. B., Jackson, R. B., Lowry, E. R., Brandt, A. R., Yeskoo, T. W., et al. (2016). Water use and management in the bakken shale oil play in NorthNorth Dakota. Environ. Sci. Technol. 50, 3275–3282. doi:10.1021/acs.est.5b04079
Hu, Y., and Beattie, S. (2019). Role of heterogeneous behavioral factors in an agent-based model of crop choice and groundwater irrigation. J. Water Resour. Plann. Manage. 145 (2), 04018100. doi:10.1061/(asce)wr.1943-5452.0001033
Johnson, J. G., and Busemeyer, J. R. (2010). Decision making under risk and uncertainty. WIREs Cogn. Sci. 1, 736–749. doi:10.1002/wcs.76
Kandiah, V. K., Berglund, E. Z., and Binder, A. R. (2016). Cellular automata modeling framework for urban water reuse planning and management. J. Water Resour. Plann. Manage. 142 (12), 04016054. doi:10.1061/(asce)wr.1943-5452.0000696
Kolkman, M. J., Kok, M., and Van Der Veen, A. (2005). Mental model mapping as a new tool to analyse the use of information in decision-making in integrated water management. Phys. Chem. Earth, Parts A/B/C 30 (4-5), 317–332. doi:10.1016/j.pce.2005.01.002
Kotz, C., and Hiessl, H. (2005). Analysis of system innovation in urban water infrastructure systems: An agent-based modelling approach. Water Supply 5 (2), 135–144. doi:10.2166/ws.2005.0030
Kusnetz, N. (2012). The Bakken oil play spurs a booming business in water. High Country News. (Accessed June 2022) http://www.hcn.org/issues/44.13/the-bakken-oil-play-spurs-a-booming-business-in-water.
Lin, T., and Fargo, Ph.D. Dissertation. (2022). “An agent-based model for the water allocation and management of hydraulic fracturing,” in North Dakota: Environmental and conservation sciences graduate program (Fargo, ND, USA: North Dakota State University).
Lin, Z., Lim, S., Lin, T., and Borders, M. (2020). Using agent-based modeling for water resources management in the Bakken region. J. Water Resour. Plan. Manag. 146 (1), 05019020. doi:10.1061/(asce)wr.1943-5452.0001147
Lin, Z., Lin, T., Lim, S. H., Hove, M. H., and Schuh, W. M. (2018). Impacts of Bakken shale oil development on regional water uses and supply. J. Am. Water Resour. Assoc. 54 (1), 225–239. doi:10.1111/1752-1688.12605
Liu, Y., Sun, F., Zeng, S., Lauzon, K., and Dong, X. (2016). Integrated model driven by agent-based water end-use forecasting to evaluate the performance of water and wastewater pipeline systems. J. Water Resour. Plann. Manage. 142 (10), 04016035. doi:10.1061/(asce)wr.1943-5452.0000672
Macal, C. M., and North, M. J. (2010). Tutorial on agent-based modelling and simulation. J. Simul. 4 (3), 151–162. doi:10.1057/jos.2010.3
Manson, S. M. (2005). Agent-based modeling and genetic programming for modeling land change in the Southern Yucatán Peninsular Region of Mexico. Agric. Ecosyst. Environ. 111 (1-4), 47–62. doi:10.1016/j.agee.2005.04.024
Manson, S. M. (2006). Bounded rationality in agent-based models: Experiments with evolutionary programs. Int. J. Geogr. Inf. Sci. 20 (9), 991–1012. doi:10.1080/13658810600830566
Manson, S. M., and Evans, T. (2007). Agent-based modeling of deforestation in southern Yucatan, Mexico, and reforestation in the Midwest United States. Proc. Natl. Acad. Sci. U. S. A. 104 (52), 20678–20683. doi:10.1073/pnas.0705802104
Montalto, F. A., Bartrand, T. A., Waldman, A. M., Travaline, K. A., Loomis, C. H., McAfee, C., et al. (2013). Decentralised green infrastructure: The importance of stakeholder behaviour in determining spatial and temporal outcomes. Struct. Infrastructure Eng. 9 (12), 1187–1205. doi:10.1080/15732479.2012.671834
Monticino, M., Acevedo, M., Callicott, B., Cogdill, T., and Lindquiest, C. (2007). Coupled human and natural systems: A multi-agent-based approach. Environ. Model. Softw. 22, 656–663. doi:10.1016/j.envsoft.2005.12.017
Müller, B., Bohn, F., Dreßler, G., Groeneveld, J., Klassert, C., Martin, R., et al. (2013). Describing human decisions in agent-based models–ODD+ D, an extension of the ODD protocol. Environ. Model. Softw. 48, 37–48. doi:10.1016/j.envsoft.2013.06.003
Pollastro, R. M., Cook, T. A., Roberts, L. N. R., Schenk, C. J., Lewan, M. D., Anna, L. O., et al. (2008). Assessment of undiscovered oil resources in the devonian-mississippian Bakken Formation, williston basin province, Montana and NorthNorth Dakota, 2008, U.S. Geol. Surv. Fact. Sheet 2008-3021, 2.
Railsback, S. F., and Grimm, V. (2012). Agent-based and individual-based modeling: A practical introduction. Princeton, NJ, USA: Princeton University Press.
Schuh, W. M. (2010). Water appropriation requirements, current water use, & water availability for energy industries in NorthNorth Dakota: A 2010 summary. North Dakota: North Dakota State Water Commission, Bismarck.
Simon, H. A. (1997). Models of bounded rationality: Empirically grounded economic reason. Cambridge, MA, USA: MIT press. Vol. 3.
Tesfatsion, L., Rehmann, C. R., Cardoso, D. S., Jie, Y., and Gutowski, W. J. (2017). An agent-based platform for the study of watersheds as coupled natural and human systems. Environ. Model. Softw. 89, 40–60. doi:10.1016/j.envsoft.2016.11.021
Tourigny, A., and Filion, Y. (2019). Sensitivity analysis of an agent-based model used to simulate the spread of low-flow fixtures for residential water conservation and evaluate energy savings in a Canadian water distribution system. J. Water Resour. Plann. Manage. 145 (1), 04018086. doi:10.1061/(asce)wr.1943-5452.0001015
Xiao, Y. L. F., and Hipel, K. W. (2018). Agent-based modeling approach to investigating the impact of water demand management. J. Water Resour. Plann. Manage. 144 (3), 04018006. doi:10.1061/(asce)wr.1943-5452.0000907
Yang, Y. C. E., Cai, X., and Stipanović, D. M. (2009). A decentralized optimization algorithm for multiagent system–based watershed management. Water Resour. Res. 45 (8). doi:10.1029/2008wr007634
Yang, Y. E., Zhao, J., and Cai, X. (2012). Decentralized optimization method for water allocation management in the yellow river basin. J. Water Resour. Plann. Manage. 138 (4), 313–325. doi:10.1061/(asce)wr.1943-5452.0000199
Keywords: agent-based model, Bakken shale, cognitive maps, coupled human-natural system, evolutionary programming, hydraulic fracturing, institution theory, water distribution
Citation: Lin T, Lin Z, Lim SH, Jia X and Chu X (2022) A spatial agent-based model for hydraulic fracturing water distribution. Front. Environ. Sci. 10:1025559. doi: 10.3389/fenvs.2022.1025559
Received: 23 August 2022; Accepted: 14 November 2022;
Published: 25 November 2022.
Edited by:
Xudong Zhou, The University of Tokyo, JapanReviewed by:
Zhoujie Wang, China University of Petroleum, Huadong, ChinaYing Ouyang, Forest Service, United States Department of Agriculture (USDA), United States
Jie Chi, Shengli College, China University of Petroleum (Huadong), China
Copyright © 2022 Lin, Lin, Lim, Jia and Chu. This is an open-access article distributed under the terms of the Creative Commons Attribution License (CC BY). The use, distribution or reproduction in other forums is permitted, provided the original author(s) and the copyright owner(s) are credited and that the original publication in this journal is cited, in accordance with accepted academic practice. No use, distribution or reproduction is permitted which does not comply with these terms.
*Correspondence: Zhulu Lin, emh1bHUubGluQG5kc3UuZWR1