- 1School of Water Resources and Electric Power, Qinghai University, Xining, China
- 2Laboratory of Ecological Protection and High-Quality Development in the Upper Yellow River, Xining, China
- 3Key Laboratory of Water Ecology Remediation and Protection at Headwater Regions of Big Rivers, Ministry of Water Resources, Xining, China
- 4School of Environment and Civil Engineering, Dongguan University of Technology, Dongguan, China
- 5Center for Hydrosphere Science, Key Laboratory of Engineering Software, Dongguan University of Technology, Dongguan, China
- 6TUM School of Engineering and Design, Technical University of Munich, Garching, Germany
In this paper, the coupled weakly compressible (WC) and total Lagrangian (TL) smoothed particle hydrodynamics (SPH) model based on the open-source multi-physics and multi-resolution SPHinXsys library is used to simulate the structural deformation and failure problem in fluid-structure interaction (FSI). Aiming at the problem that the original TLSPH method could not simulate the cracks and their propagation, the fracture model based on TLSPH is established, and then verified by fast-loading and slow-loading cases respectively. With the fracture model in hand, the TLSPH method is coupled with the WCSPH method to simulate the breaking dam flow impacting on an elastic/elastoplastic baffle. The comparison with the literature data shows that the present coupled WC-TLSPH model can accurately simulate the FSI problem where figurative fracture process is involved, indicating the compromising potential of the established model to simulate the elastoplastic structural failure in scientific and industrial applications.
Introduction
Fluid-structure interaction (FSI) is a common phenomenon in various engineering problems which characterized by dramatic change of the flow domain size and shape with the movement or deformation of the structure, leading to its numerical solution is relatively complicated, and of great significance to ensure the safe and stable operation of the structure. Therefore, one of the primary aims of solving FSI problem is to accurately simulate the changing state of structure, and even its failure accurately.
The computational mechanics is considered to be the main approach for solving FSI problems because of its flexibility, and it has made great progress in the past few decades. From a solution point of view, there are generally two main solutions, i.e., a direct solution and an indirect solution (Salehizadeh and Shafiei, 2022). The direct solution refers to solving both fluid and structure dynamics synchronously, while the indirect solution refers to calculating the stress on the structure by solving the fluid dynamics firstly, and then imposing the stress as the boundary condition to solve the deformation of the structure. In terms of specific methods, several grid-based analytical/computational methods, e.g. finite difference method (FDM) (Sugiyama et al., 2011), finite element method (FEM) (Mitra andSinhamahapatra, 2008) and finite volume method (FVM) (Lv et al., 2007), have been applied and achieved certain degree of success. However, in violent FSI contact problems, the grid-based methods encounter serious mesh distortion and mesh redrawing problems. To address these issues, the Arbitrary Lagrangian Eulerian (ALE) (Sarrate et al., 2001) is proposed by modelling the structure with the fully Lagrangian formula, whereas a particular modification is required for the precision definition of interface and free surfaces (Salehizadeh and Shafiei, 2022).
With the development of meshless methods in the last decades, alternative solutions have been merged for solving FSI problems. Smoothed particle hydrodynamics (SPH) is a representative meshless method, originally proposed by Lucy, Gingold and Monaghan (Monaghan, 1992) and applied to astrophysics applications. It is a truly meshless, Lagrangian particle method in which the computational domain is discretized into a series of material points carry the field variables such as density, stress tensor and velocity, etc. Thanks to its pure Lagrangian property, it has unique advantages in dealing with large deformations, free surfaces and interfaces, and has been applied to in a wide range of fluid and solid computational problems (Bui et al., 2008; Shi et al., 2017; Shi et al., 2019; Gabreil et al., 2022; Gu et al., 2022; Zhang et al., 2022). Zheng et al. (2022) used the SPH method to model the FSI problem of icebreaker sailing in the ice river, where the updated Lagrangian SPH (ULSPH) formulation is used to solve the solid mechanics formulation. However, the using of ULSPH method in which the current configuration is used as the reference will lead to the problem of tensile instability hindering its application to a large extent because it leads to particle sticking and unphysical fracture. Although the application of kernel function reconstruction (Johnson and Beissel, 1996), artificial stress (Gray et al., 2001), generalized transport-velocity formulation (Zhang et al., 2017b) and other methods can solve the problem of tensile instability to a certain degree, these methods introduce additional model parameters, and the choice of these parameters has side effect on the simulation results. According to Belytschko et al. (2000), the use of Euler kernel in ULSPH is the main reason for tensile instability. To fundamentally solve the problem of tensile instability, it is necessary to avoid the use of Euler kernel, viz. the total Lagrangian SPH (TLSPH) which applies the Lagrangian kernel and being entirely free of tensile instability. The so-called Lagrangian kernel is to perform particle pairing and calculate the kernel function gradient according to the initial configuration only once before the calculation starts, which means that TLSPH is not suitable for the solution of fluid dynamics where the deformation of particles in the flow process is relatively large. Therefore, by the coupling of weakly compressible SPH (WCSPH) and TLSPH, respectively solving fluid dynamics and solid mechanics, the solution of FSI problems can be well realized.
In terms of the coupling of WCSPH and TLSPH, some scholars have carried out a series of research and achieved certain achievements (He et al., 2017; Zhan et al., 2019; Zhang et al., 2021a). However, in the research of FSI problems where the fracture and failure of materials are involved, the original TLSPH method cannot handle the cracking and fragmentation problems (Islam and Peng, 2019). In order to study the failure of structures in FSI and further expand the application of the TLSPH, the fracture model coupled with TLSPH is established based on the SPHinXsys (https://www.sphinxsys.org) in this paper. SPHinXsys is an open-source multi-physics and multi-resolution library acronym from Smoothed Particle Hydrodynamics for industrial complex systems. It provides open-source C++ APIs for physical accurate simulation and aims to model and to optimize coupled industrial dynamic systems including fluid, solid, multi-body dynamics (Zhang et al., 2021b). In addition, SPHinXsys shows impressive computational performance thanks to implementing shared-memory parallel programming on multi-core processors by applying Threading Building Blocks (TBB) library developed by Intel (Zhang et al., 2021c).
This paper is structured as follows. The theory and fundamentals of WCSPH, TLSPH and WC-TLSPH are briefly summarized in Section 2. The fracture model for TLSPH is introduced in Section 3. The fast-loading fracture case of crack propagation in notched beam and the slow-loading fracture case of three-point bending of ice beam based on TLSPH, as well as the further model validations of breaking dam on elastic and elastoplastic baffles are investigated in Section 4 and finally the conclusions and future works are noted in Section 5.
Theory of WC-TLSPH
Scheme of WCSPH
The Navier-Stokes equations (N-S equations) for fluid dynamics in the Lagrangian framework can be written as
where
where
According to the discrete formula of the SPH method, the WCSPH method based on Riemann solver is applied in SPHinXsys to achieve stabilized simulations. Following Zhang et al. (2017a), one-dimensional Riemann problem is constructed along the interacting line of particle i and j, then discretization of the N-S equation can be rewritten as
where
where the subscprpts L and R represent the left and right states in Riemann problems and the initial L and R states are on particle i and j resprectively, i.e.,
Scheme of TLSPH
For the solid mechanics, we follow the Lagrangian framework where all the conservation equations are expressed in terms of the initial coordinates
where
where the superscripts 0 indicates the values expressed in the initial configuration,
Another important stress tensor
Then, the first Piola-Kirchhoff stress tensor
For the discretization of Eq. 6, a kernel correction matrix
where
represents the gradient of the kernel function at the initial reference configuration. It is worth noting that the correction matrix is calculated in the initial configuration and therefore is calculated only once at the beginning of the simulation. Then, the mass and momentum conservation equations can be discretized as
where the average first Piola-Kirchhoff stress between particles is defined as
and the first Piola-Kirchhoff stress tensor is calculated from the constitutive law with the deformation tensor
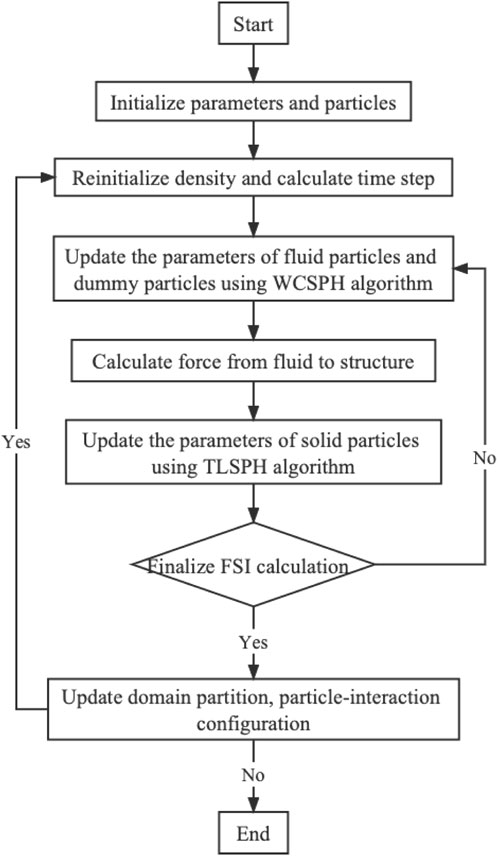
Coupling scheme of WC-TLSPH
In the FSI framework, the force of the solid structure on the fluid needs to be considered, so the governing equations of fluid dynamics are expressed as
where
also
In FSI, the surrounding solid structure is behaving as a moving boundary of the fluid, while no-slip boundary condition is imposed at the fluid-structure interface (Zhang et al., 2021a). The solid forces
where the imaginary particle density
where
In order to ensure momentum conservation and force-calculation matching of FSI, a single time step
is commonly used, where
Fracture model for TLSPH
As discussed in the previous part, the TLSPH method applies the initial reference configuration for constructing particle configuration, including particle neighbor search and calculation of kernel function and its gradient, and keep it unaltered during the simulation. Therefore, additional treatment is necessary when applying TLSPH to resolve the fracture problem in solid mechanics.
Considering that the particle interaction in the SPH method is determined by the kernel function, the strength of the particle interaction can be adjusted by introducing a damage factor to the kernel function. Then, the material fracture can be resolved by adopting the damage factor according to fracture rule as pointed out by Islam and Peng (2019). The specific calculation process can be achieved through the following steps: firstly, establishing a virtual chain between the interacting particles. Here, the function of the virtual chain is to store the strength of particle interaction without providing any additional stiffness. Secondly, introducing the particle damage factor
where
where
Model validation and application
In this section, the adopted fractural model for the TLSPH method is first validated by two benchmark tests, viz. crack propagation in notched beam and three-point bending of ice beam. Then, a test of dam break flow impacting on a structure with and without fractural model is investigated to study the accuracy, robustness and versatility of the proposed coupled WC-TLSPH method.
Fast-loading case crack propagation in notched beam
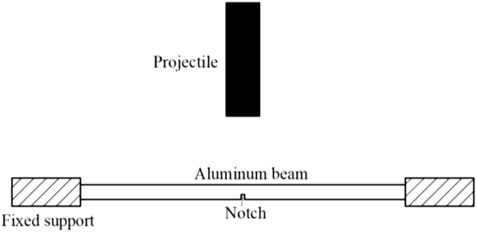
The fast-loading fracture case is firstly verified by considering a projectile impacting aluminum beam, as shown in Figure 2, where experimental data of Chen and Yu (2004) and numerical results of Islam and Peng (2019) are available for quantitative comparison. Following Chen and Yu (2004), the size of the aluminum beam is 142.24 × 6.35 mm and the I-type notch or II-type notch (the I-type notch is of 2.12 mm high and 0.8 mm wide, and the II-type notch is of 2.12 mm high and 1.5 mm wide) is preset in the middle and with fixed constraints being imposed on both ends.
The material properties of the aluminum beam are given in Table 1. The aluminum beam was impacted with a projectile to study the deformation and fracture phenomena of the aluminum beam. Note that the size of the projectile is of 50.00 × 14.74 mm.
Also, the simulation scheme sets four working conditions according to the literature and the detailed parameters are shown in Table 2.
To discretize the system, the particle spacing is set to 0.423 mm and the total number of particles is 12,906 including 8,894 particles for aluminum beam and 4,012 particles for projectile. The von Mises criterion is selected for the yield criterion, defined as
The simulation results are shown in Figure 3. The first column is the experimental results of Chen and Yu (2004), the second is the simulation results of Islam and Peng (2019) and the third is the present simulation. Under the four different initial impact velocities, the present model can better reflect the bending and fracture of the aluminum beam in comparison with those of Islam and Peng (2019). From the perspective of plastic strain distribution, the present results and those of Islam and Peng’s (2019) show the same law. However, there are discrepancies can be noted, e.g. the present results show the plastic strain at middle part of the aluminum beam is slightly smaller than the results of Islam and Peng (2019) when the aluminum beam is not broken, but significantly larger than the results of Islam and Peng (2019) after the aluminum beam breaks. The reason for this phenomenon may be due to that the choice of different material constitutive model in the simulation.
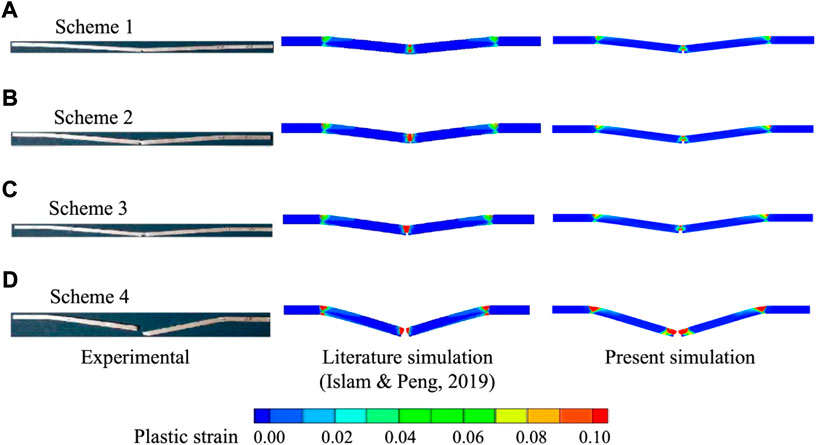
FIGURE 3. Comparison of present simulation (third column) with the experimental (first column) (Chen and Yu, 2004) and simulation (second column) (Islam and Peng, 2019) results of (A) Scheme 1, (B) Scheme 2, (C) Scheme 3 and (D) Scheme 4.
In Figure 4, the present results are compared with the experimental observation of the deflection in Y-axis of the aluminum beam in Schemes 1-3. It can be seen from the results that the present results have a good agreement with the experimental results under different initial impact velocities. Quantitatively, the relative errors in the 3 schemes of present simulation are 11.99, 12.41 and 5.40%, respectively.
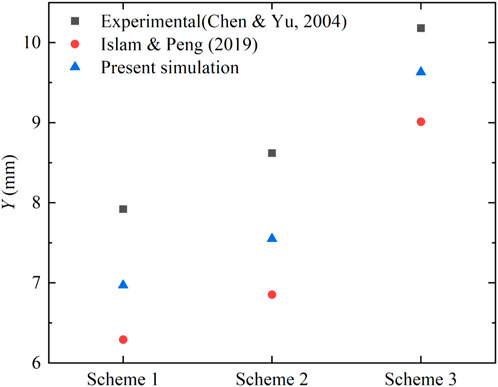
FIGURE 4. Comparison of deflection of present simulation with the experimental (Chen and Yu, 2004) and simulation (Islam and Peng, 2019) results.
Slow-loading case three-point bending of ice beam
The slow-loading fracture case is verified by considering a three-point bending an ice beam, which is also studied by Lu (2017). The initial configuration is shown in Figure 5 where the size of the simply supported ice beam is 650 mm × 70 mm and the distance between the fixed ends on both sides 600 mm. Also, the loading speed of the point pressure is 0.763 mm/s.
To discretize the system as show in Figure 6, the particle spacing is set to
Figure 7 shows the present results of the crack and its propagation during the loading process with the particles colored by the plastic strain contour. At t = 2.75 s, obvious cracks can be observed. At the same time, pronounced strain aera appear at the support of the beam and the compression and tension areas of the loader. As the loading process continues, the cracks gradually expand meanwhile the range of strain aera also increases slightly. When the time reaches t = 6.05 s, the crack expands to a certain extent and an obvious fracture surface appears, noting the increase of strain at the fracture. The present results herein show the same trend as those of Zhang et al. (2019), including the fracture degree and fracture location of the ice beam at each frame. However, detailed comparison is not conducted in this paper due to the slight differences in the model parameters.
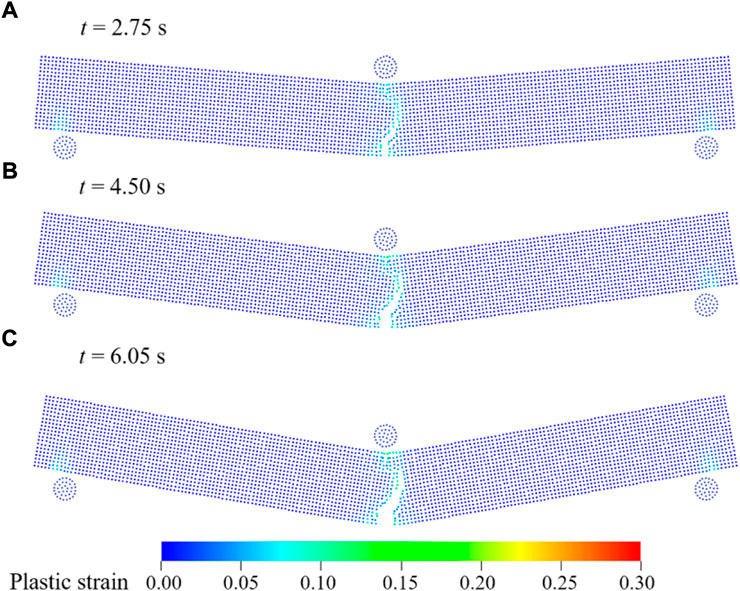
FIGURE 7. Snapshots of the ice beam in three-point bending experiment by SPH at (A) t = 2.75s, (B) t = 4.50s and (C) t = 6.05s.
In order to verify the accuracy of the present results under slow-loading, the deflection at the midpoint of the ice beam is compared with the experimental data in the literature (Lu, 2017) in Figure 8 where the deflection is represented by Y. The simulation results tend to be consistent with the experimental results. Before fracture, the deflection increases linearly with time. At t = 0.49 s, the ice beam breaks and the deflection increases significantly. However, the simulation results show a slightly larger deflection than the experimental data, and meanwhile fracture is also advanced probably because the maximum plastic strain
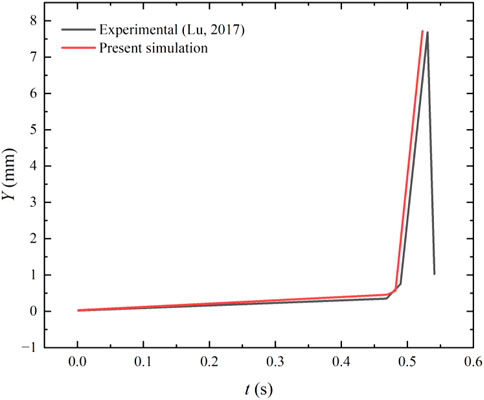
FIGURE 8. Comparison of deflection of present simulation with the experimental (Lu, 2017) results.
FSI case breaking dam on an elastic/elastoplastic baffle
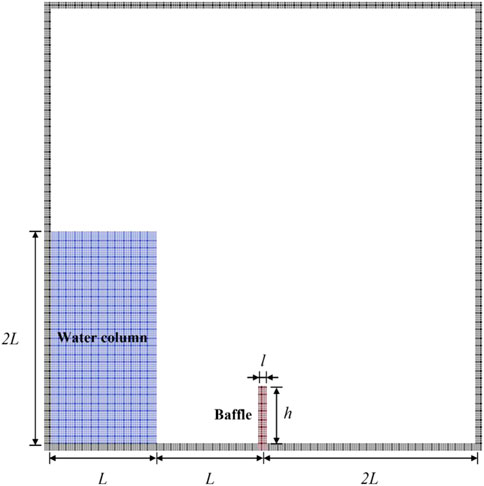
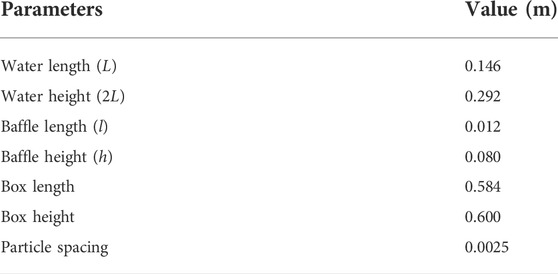
In this section, the case of breaking dam impacting on an elastic/elastoplastic baffle, in which a column of water collapses and influences on an elastic or elastoplastic baffle, is established to study the difference and response of elastic and elastoplastic materials under the impacting load of water flow. As shown in Figure 9, a column of water confined at the left end of the container is initially in hydrostatic equilibrium state and an elastic/elastoplastic baffle is attached to the bottom of the tank with one end free. The parameters of this test case are listed in Table 3.
The initial density of water and the baffle are set to 1,000 kg/m3 and 2,500 kg/m3, respectively. Other parameters for the baffle are Young’s modulus E = 1.0 MPa and Poisson ratio
The free-surface profile with pressure contour and the deformed configuration of the elastic baffle are shown in Figure 10A, corresponding to the flow state at t = 0.1s, t = 0.2s, t = 0.4s, t = 0.6s, t = 0.8s and t = 1.0s, respectively. Also, the figure shows a partial enlarged view of the distributions of stress component on the y-axis
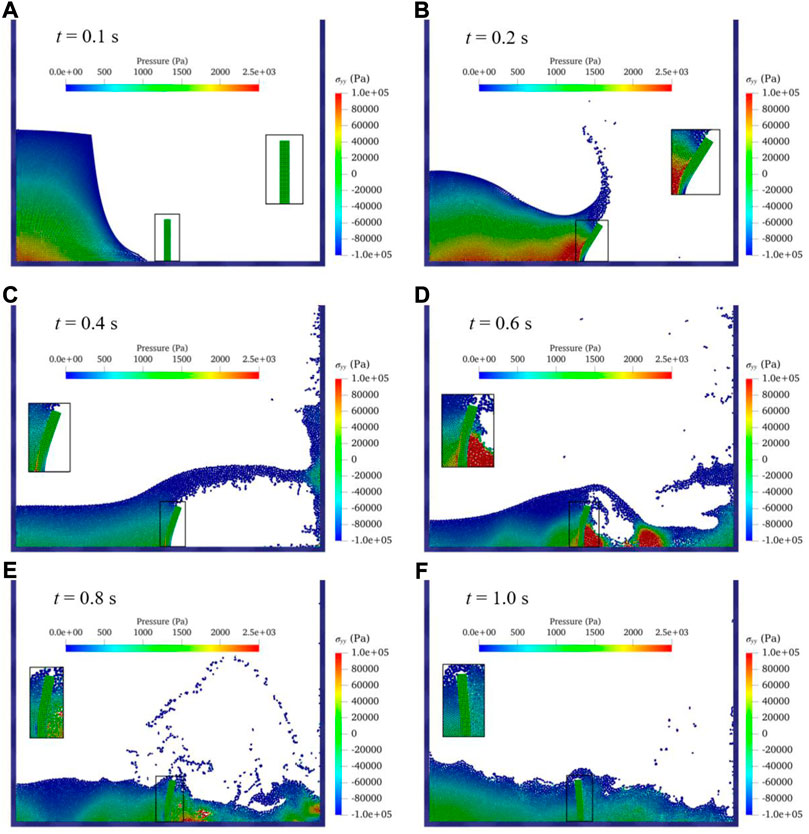
FIGURE 10. Contours of water pressure, surface profile and
Figure11 shows the time history of horizontal displacement of the upper left corner of the elastic baffle where horizontal displacement is represented by sx. Several simulation results of PFEM (Idelsohn et al., 2008), FEM (Walhorn et al., 2005), SPH (Rafiee and Thiagarajan, 2009) and incompressible SPH (ISPH) -TLSPH (Salehizadeh and Shafiei, 2022) from literature are also given for comparison. It can be seen from the figure that the maximum displacement time of the elastic baffle in this paper is similar to the simulation results in the literatures, and the amplitude and frequency of the elastic baffle oscillation show basically the same trend as those in the literature and the present results is within the range of the above literature results. In addition, it can be seen that the simulation in this paper can better reflect the motion details of the elastic baffle.
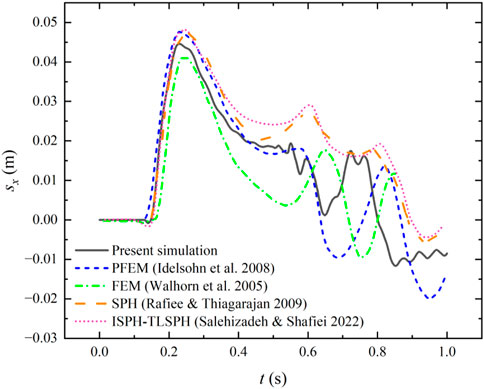
FIGURE 11. The time history of horizontal displacement of the upper left corner of the elastic baffle.
Through the above analysis, the present WC-TLSPH has good accuracy in FSI simulation, and the fracture model based on TLSPH can simulate the fracture process of the material well. Therefore, it can also corroborate the WC-TLSPH model coupled with fracture model to simulate the failure process of the structure in the FSI.
Figure 12 shows the free-surface profile with water pressure contour and the deformation of the elastoplastic baffle, (a)-(f) corresponding to the flow state at t = 0.1s, t = 0.2s, t = 0.4s, t = 0.6s, t = 0.8s and t = 1.0s respectively. The figure also shows a partial enlarged view of the distributions of stress
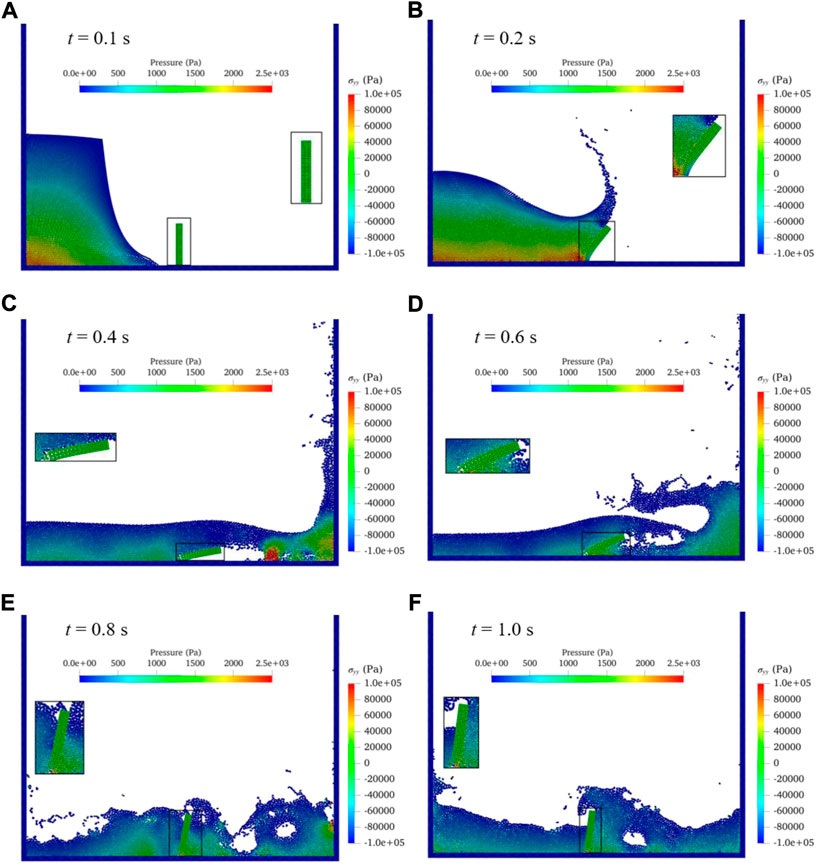
FIGURE 12. Contours of water pressure, surface profile and
Figure13 shows the time history of horizontal displacement of the upper left corner of the elastic baffle and elastoplastic baffle. It can be seen that before t = 0.18 s, i.e., before the elastoplastic baffle reaches the plastic state, the displacement of the baffle in the two cases shows the same tendency, and then is significantly larger than that of the elastic baffle, although there is a lack of experimental data verification, from a qualitative point of view this is also in line with the common sense. In addition, compared with the displacement change of the elastic baffle, another significant difference in the displacement of the elastoplastic baffle is the lack of reciprocating motion in the displacement due to the lack of rebound effect.
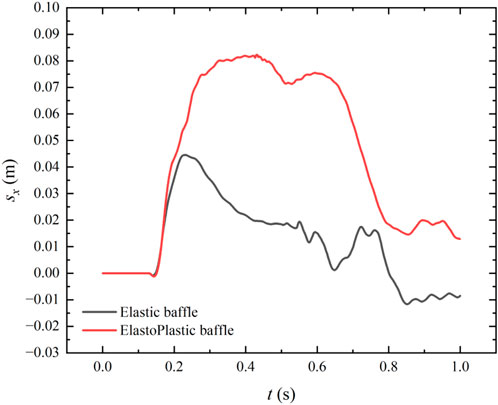
FIGURE 13. The time history of horizontal displacement of the upper left corner of the elastic/elastoplastic baffle.
Through the above comparative analysis, the method used in this paper can accurately simulate the deformation and failure process of the structure in FSI. Although the verification of experimental data is lacking in this process, combined with previous research experience, the simulation results of the flow process and pressure distribution of the water flow, as well as the stress distribution and movement trend of the baffle plate have good accuracy.
Conclusion
Based on the WC-TLSPH model in the SPHinXsys library, a fracture model is established to simulate the failure process of the structure in FSI. The fluid phase was simulated by the WCSPH method, the solid phase was simulated by the TLSPH method to reduce the influence of tensile instability, the fracture of the material was achieved by introducing a damage factor for kernel function correction. By comparing the numerical results of the fast-loading case of crack propagation in notched beam and the slow-loading case of three-point bending of ice beam with the experimental data in the literature, the accuracy of the simulation results of the fracture model in different working conditions is verified respectively. The comparison with literature data demonstrates the accuracy and robustness of the WC-TLSPH model in FSI simulations. The above model verification can also corroborate the simulation results of the breaking dam on an elastoplastic baffle to a certain extent. The results show that the method of introducing the damage factor to modify kernel function can well realize the fracture model based on TLSPH, which solves the problem that TLSPH cannot simulate the fracture process naturally. The coupling of the WC-TLSPH model and the fracture model can simulate the fracture process of the structure in the case of FSI well and provide a certain reference for practical engineering applications.
This might be the first time that SPHinXsys is used for fracture of solid structures and there is no quantitative data of physical experiment for a comparison, so the depth of study is still relatively shallow. In the manuscript we tried to provide a few quantitative validations, but it seems quite insufficient. A series of more challenging benchmark tests are being carried out now and will be presented in future work.
Data availability statement
The raw data supporting the conclusions of this article will be made available by the authors, without undue reservation.
Author contributions
HW: methodology, simulation, visualization, validation, analysis, and writing—original draft. SG: supervision, conceptualization, management, and writing—review and editing. LT: investigation and writing—review and editing. JL: investigation and writing—review and editing. CC: investigation and writing—review and editing. CZ: supervision, conceptualization, management, and writing—review and editing. All authors contributed to the article and approved the submitted version.
Funding
This research work is supported by the National Natural Science Foundation of China (no. 51869025), Youth Scientific Research Fund Project of Qinghai University (no. 2022-QGY-9) and Guangdong Basic and Applied Basic Research Foundation (no. 2021A1515110768).
Acknowledgments
Author HW acknowledges the support of Professor Songdong Shao at Dongguan University of Technology and all the developers of SPHinXsys. We all acknowledge the Frontier Editorial Team for their professional handling of the manuscript and dedicated referees who provided very constructive and insightful comments to significantly improve the quality of the work.
Conflict of interest
The authors declare that the research was conducted in the absence of any commercial or financial relationships that could be construed as a potential conflict of interest.
Publisher’s note
All claims expressed in this article are solely those of the authors and do not necessarily represent those of their affiliated organizations, or those of the publisher, the editors and the reviewers. Any product that may be evaluated in this article, or claim that may be made by its manufacturer, is not guaranteed or endorsed by the publisher.
References
Belytschko, T., Guo, Y., Kam Liu, W., and Ping Xiao, S. (2000). A unified stability analysis of meshless particle methods. Int. J. Numer. Methods Eng. 48 (9), 1359–1400. doi:10.1002/1097-0207(20000730)48:9<1359::AID-NME829>3.0.CO;2-U
Bui, H. H., Fukagawa, R., Sako, K., and Ohno, S. (2008). Lagrangian meshfree particles method (SPH) for large deformation and failure flows of geomaterial using elastic–plastic soil constitutive model. Int. J. Numer. Anal. Methods Geomech. 32 (12), 1537–1570. doi:10.1002/nag.688
Chen, F., and Yu, T. (2004). An experimental study of pre-notched clamped beams under impact loading. Int. J. solids Struct. 41 (24-25), 6699–6724. doi:10.1016/j.ijsolstr.2004.05.036
Gabreil, E., Wu, H., Chen, C., Li, J., Rubinato, M., Zheng, X., et al. (2022). Three-dimensional smoothed particle hydrodynamics modeling of near-shore current flows over rough topographic surface. Front. Mar. Sci. 9, 935098. doi:10.3389/fmars.2022.935098
Gray, J. P., Monaghan, J. J., and Swift, R. P. (2001). SPH elastic dynamics. Comput. Methods Appl. Mech. Eng. 190 (49), 6641–6662. doi:10.1016/S0045-7825(01)00254-7
Gu, S., Zheng, W., Wu, H., Chen, C., and Shao, S. (2022). DualSPHysics simulations of spillway hydraulics: A comparison between single- and two-phase modelling approaches. J. Hydraulic Res. 60 (5), 835–852. doi:10.1080/00221686.2022.2064343
He, J., Tofighi, N., Yildiz, M., Lei, J., and Suleman, A. (2017). A coupled WC-TL SPH method for simulation of hydroelastic problems. Int. J. Comput. Fluid Dyn. 31 (3), 174–187. doi:10.1080/10618562.2017.1324149
Idelsohn, S. R., Marti, J., Limache, A., and Oñate, E. (2008). Unified Lagrangian formulation for elastic solids and incompressible fluids: Application to fluid–structure interaction problems via the PFEM. Comput. Methods Appl. Mech. Eng. 197 (19-20), 1762–1776. doi:10.1016/j.cma.2007.06.004
Islam, M. R. I., and Peng, C. (2019). A Total Lagrangian SPH method for modelling damage and failure in solids. Int. J. Mech. Sci. 157-158, 498–511. doi:10.1016/j.ijmecsci.2019.05.003
Johnson, G. R., and Beissel, S. R. (1996). Normalized smoothing functions for SPH impact computations. Int. J. Numer. Methods Eng. 39, 27252–27419. doi:10.1002/(SICI)1097-0207(19960830)39:16<2725::AID-NME973>3.0
Lu, W. (2017). The Study of the numerical simulation Method of peridynamic Based on the bending Fracture of sea ice master. China: Harbin Engineering University. Thesis.
Lv, X., Zhao, Y., Huang, X. Y., Xia, G. H., and Su, X. H. (2007). A matrix-free implicit unstructured multigrid finite volume method for simulating structural dynamics and fluid–structure interaction. J. Comput. Phys. 225 (1), 120–144. doi:10.1016/j.jcp.2006.11.023
Mitra, S., and Sinhamahapatra, K. P. (2008). 2D simulation of fluid-structure interaction using finite element method. Finite Elem. Analysis Des. 45 (1), 52–59. doi:10.1016/j.finel.2008.07.006
Monaghan, J. J. (1992). Smoothed particle hydrodynamics. Annu. Rev. Astron. Astrophys. 30, 543–574. doi:10.1146/annurev.aa.30.090192.002551
Morris, J. P., Fox, P. J., and Zhu, Y. (1997). Modeling low Reynolds number incompressible flows using SPH. J. Comput. Phys. 136 (1), 214–226. doi:10.1006/jcph.1997.5776
Rafiee, A., and Thiagarajan, K. P. (2009). An SPH projection method for simulating fluid-hypoelastic structure interaction. Comput. Methods Appl. Mech. Eng. 198 (33-36), 2785–2795. doi:10.1016/j.cma.2009.04.001
Salehizadeh, A. M., and Shafiei, A. R. (2022). A coupled ISPH-TLSPH method for simulating fluid-elastic structure interaction problems. J. Mar. Sci. Appl. 21 (1), 15–36. doi:10.1007/s11804-022-00260-3
Sarrate, J., Huerta, A., and Donea, J. (2001). Arbitrary Lagrangian–Eulerian formulation for fluid–rigid body interaction. Comput. Methods Appl. Mech. Eng. 190 (24), 3171–3188. doi:10.1016/S0045-7825(00)00387-X
Shi, H., Si, P., Dong, P., and Yu, X. (2019). A two-phase SPH model for massive sediment motion in free surface flows. Adv. Water Resour. 129, 80–98. doi:10.1016/j.advwatres.2019.05.006
Shi, H., Yu, X., and Dalrymple, R. A. (2017). Development of a two-phase SPH model for sediment laden flows. Comput. Phys. Commun. 221, 259–272. doi:10.1016/j.cpc.2017.08.024
Simo, J. C., and Hughes, T. J. (2006). Computational inelasticity, New York: Springer Science & Business Media.
Sugiyama, K., Ii, S., Takeuchi, S., Takagi, S., and Matsumoto, Y. (2011). A full Eulerian finite difference approach for solving fluid-structure coupling problems. J. Comput. Phys. 230 (3), 596–627. doi:10.1016/j.jcp.2010.09.032
Walhorn, E., Kölke, A., Hübner, B., and Dinkler, D. (2005). Fluid–structure coupling within a monolithic model involving free surface flows. Comput. Struct. 83 (25-26), 2100–2111. doi:10.1016/j.compstruc.2005.03.010
Zhan, L., Peng, C., Zhang, B., and Wu, W. (2019). A stabilized TL–WC SPH approach with GPU acceleration for three-dimensional fluid–structure interaction. J. Fluids Struct. 86, 329–353. doi:10.1016/j.jfluidstructs.2019.02.002
Zhang, C., Hu, X., and Adams, N. A. (2017a). A weakly compressible SPH method based on a low-dissipation Riemann solver. J. Comput. Phys. 335, 605–620. doi:10.1016/j.jcp.2017.01.027
Zhang, C., Hu, X. Y., and Adams, N. A. (2017b). A generalized transport-velocity formulation for smoothed particle hydrodynamics. J. Comput. Phys. 337, 216–232. doi:10.1016/j.jcp.2017.02.016
Zhang, C., Rezavand, M., and Hu, X. (2021a). A multi-resolution SPH method for fluid-structure interactions. J. Comput. Phys. 429, 110028. doi:10.1016/j.jcp.2020.110028
Zhang, C., Rezavand, M., Zhu, Y., Yu, Y., Wu, D., Zhang, W., et al. (2021b). SPHinXsys: An open-source multi-physics and multi-resolution library based on smoothed particle hydrodynamics. Comput. Phys. Commun. 267, 108066. doi:10.1016/j.cpc.2021.108066
Zhang, C., Wei, Y., Dias, F., and Hu, X. (2021c). An efficient fully Lagrangian solver for modeling wave interaction with oscillating wave surge converter. Ocean. Eng. 236, 109540. doi:10.1016/j.oceaneng.2021.109540
Zhang, C., Zhu, Y., Wu, D., and Hu, X. (2022). Review on smoothed particle hydrodynamics: Methodology development and recent achievement. arXiv preprint arXiv:2205.03074.
Zhang, N., Zheng, X., Ma, Q., and Hu, Z. (2019). A numerical study on ice failure process and ice-ship interactions by Smoothed Particle Hydrodynamics. Int. J. Nav. Archit. Ocean Eng. 11 (2), 796–808. doi:10.1016/j.ijnaoe.2019.02.008
Appendix: Convergence analysis
This appendix checks the convergence of WC-TLSPH computation in spatial domain using three different particle sizes, i.e.,

FIGURE A1. Contours of water pressure, surface profile and
Figure A2 reveal a good overlapping behavior of horizontal displacement of the upper left corner of the elastoplastic baffle for the three different particle spacings, indicating the convergence of numerical results.
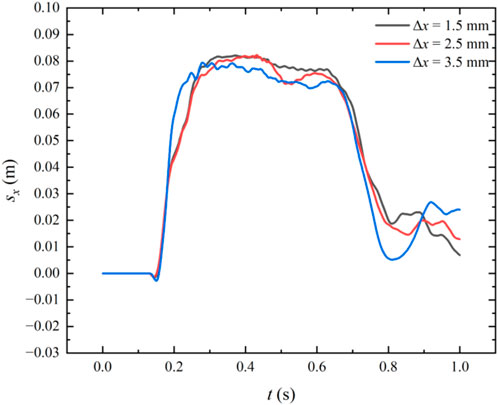
FIGURE A2. The time history of horizontal displacement of the upper left corner of the elastoplastic baffle.
Keywords: structural deformation, structural failure, fluid-structure interaction, WC-TLSPH, fracture model, SPHinXsys
Citation: Wu H, Gu S, Tian L, Li J, Chen C and Zhang C (2022) Modeling structural deformation and failure in fluid-structure interaction with WC-TLSPH. Front. Environ. Sci. 10:1024488. doi: 10.3389/fenvs.2022.1024488
Received: 21 August 2022; Accepted: 05 September 2022;
Published: 27 September 2022.
Edited by:
Biyun Guo, Zhejiang Ocean University, ChinaReviewed by:
Huabin Shi, University of Macau, ChinaNingbo Zhang, City University of London, United Kingdom
Copyright © 2022 Wu, Gu, Tian, Li, Chen and Zhang. This is an open-access article distributed under the terms of the Creative Commons Attribution License (CC BY). The use, distribution or reproduction in other forums is permitted, provided the original author(s) and the copyright owner(s) are credited and that the original publication in this journal is cited, in accordance with accepted academic practice. No use, distribution or reproduction is permitted which does not comply with these terms.
*Correspondence: Shenglong Gu, c2wuZ3VAcWh1LmVkdS5jbg==; Jiaye Li, bGlqaWF5ZUBkZ3V0LmVkdS5jbg==
 Haitao Wu
 Shenglong Gu
 Lirong Tian1,2,3
 Jiaye Li
 Chen Chen
 Chi Zhang