 Xinran Li
 Chengkun Liu
 Zhe Zhang
- 1School of Business, Macau University of Science and Technology, Taipai, Macao SAR, China
- 2School of Business, Qingdao University, Qingdao, China
With increasing participation in the global value chain (GVC), China’s economy has gradually entered the middle and late stages of industrialization and vigorous urbanization. However, the accompanying problems, such as low-quality economic growth, excessive consumption of resources, scarce energy supply and environmental pollution, have also become major issues that social development must be solved. Therefore, based on estimating the comprehensive index of regional eco-efficiency, it is of great practical significance to clarify the impacts of GVC embeddedness and government environmental protection systems on regional eco-efficiency. From the perspective of spatial spillover, this study explored the spatial dependence of eco-efficiency between regions and deeply analyzed the spatial spillover effect of regional GVC embeddedness to provide feasible solutions for China to actively achieve the goals of “carbon peak” and “carbon neutrality.” It was found that the deepening of GVC embeddedness can play a certain positive role in regional eco-efficiency; a region can not only improve its own eco-efficiency through traditional methods such as import and export, but also drive the improvement of eco-efficiency in other regions through spatial spillover. Our results can be used to manage resources in neighboring Asian countries and other developing regions globally.
1 Introduction
With the rapid decrease in trade costs and fast development of information and communication technology, there has been a wide division of production links and spatial integration in international production and people’s lives. Since the mid-1990s, an important feature of economic globalization has been the formation and expansion of the global value chain (GVC), which is formed through continuous global production, global investment, global trade, and global resource allocation led by multinational corporations. Production enterprises coordinate each link and stage of production to different countries and regions according to different advantages of the production factors in each region, forming the globalization of production, trade, and finance. GCV not only provides the participating developing countries with the opportunity to learn international advanced technology, provide management experience, and improve their own technology and production efficiency (Hummels et al., 2001), but it also generates extra environmental costs regarding uncertainty and the transfer of polluting industries (Wang et al., 2022). As per the data released by the National Bureau of Statistics of China, China’s GDP exceeded CNY100 trillion in 2020, with a yearly increase of 2.3%. Calculated using the average exchange rate of CNY throughout the year, China’s total economic volume was ∼14.7 trillion US dollars in 2020, accounting for 17% of the global economy and ranking second globally. Accompanying economic development, China’s total energy consumption increased yearly during 2007 and 2019, with an energy structure dominated by coal, according to the National Economic and Social Development Statistical Bulletin released by the National Bureau of Statistics of China. Because the growth rate of resource consumption is higher than the economic growth rate, China, as the world’s largest emission entity, must reconsider the link between resource utilization and economic prosperity to alleviate the increasingly intensifying contradiction between economic growth and the environment and achieve the long-term climate goals of carbon neutrality and carbon peak. How to rapidly promote existing mature low-carbon solutions while improving research into new methods and technologies; and actively improve energy input-output efficiency and resources utilization efficiency, that is, improving the national eco-efficiency, are the key issues of China’s current development. Furthermore, as the GVC continues to expand due to the aggravation of global environmental problems, such as global warming and air pollution, developed countries have eliminated the highly polluting processing steps from their GVC and rely more on their technological advantages to control technical standards. Further, they have established a wide variety of technical trade barriers in environmental protection-related fields to strengthen the protection of their own domestic markets. If the transformation of the economic endogenous power mechanism cannot be realized through independent innovation, China will be locked into the original resource-dependent economic growth mode and eventually fall into the “middle-income trap”. Therefore, studying the impact of GVC embeddedness on China’s overall eco-efficiency will positively impact the coordinated economic and ecological development and ecological civilization construction of China and other Asian developing countries.
However, few studies on the spatial spillover effect of GVC embeddedness on eco-efficiency have been conducted. Additionally, spatial spillover is gradually becoming an important perspective to explore the interaction and correlation of economic activities between regions. Therefore, this study investigated the relationship between GVC embeddedness and regional eco-efficiency from the perspective of spatial econometrics.
2 Literature review
2.1 Connotation and measurement of eco-efficiency
Eco-efficiency, as an effective measurement and management method for the sustainable development of the economic and resource environments, can comprehensively reflect the coordinated development level of the economy-resource-environment compound system. The term “eco-efficiency” first appeared in ecology and was first proposed by Lindeman (1941), who defined it as the utilization and transformation efficiency of the energy contained in solar energy or previous trophic organisms by each trophic organism in an ecosystem, which is expressed by the ratio between different points on the energy streamline. The theoretical basis of eco-efficiency is derived from ecological economics. In the 1990s, “eco-efficiency” was introduced into the field of sustainable development. (Schaltegger and Figge, 2000) used the term “eco-efficiency” for the first time in the field of human business and defined it as the ratio of the added value to the increased environmental impact. Industrial circles views eco-efficiency as a process in which resource utilization, industrial investment, and technological development are all directed toward maximizing industrial added value and minimizing resource consumption and waste pollution. The World Business Council for Sustainable Development (WBCSD) indicated in “Changing Course: A Global Business Perspective on Development and the Environment” that eco-efficiency requires the provision of goods (services) that are competitively priced, meet human needs, and improve the quality of life; the ecological impact and resource intensity of the products (services) in the entire life cycle can be gradually reduced, and their impacts on the ecological environment and resource consumption are within the scope of the earth’s carrying capacity, so as to achieve the environmental, economic, and societal development goals. Overall, eco-efficiency is defined as “minimizing the environmental impact and maximizing the value of products and services”. In 1998, the World Organization for Economic Cooperation and Development (OECD) applied eco-efficiency to governments, industrial enterprises, and other organizations; extended the connotation of eco-efficiency; and believed that eco-efficiency is the efficiency of using ecological resources to meet human needs and is expressed as the ratio of output to input and reflects the typical input-output process. High eco-efficiency means that more value can be obtained with less resource and environmental consumption; input elements, such as production investment and resource input, are all directed towards maximizing industrial added value and minimizing resource consumption and adverse environmental impacts. This view shows that eco-efficiency is a measure of the input-output relationship, in which output refers to the value of products and services provided by an enterprise or economy, and input refers to the resources and energy consumed by the enterprise or economy and the environmental burden they cause. The European Environment Agency (2000, EEA) adopted “eco-efficiency” to measure the status of sustainable development in the “Environmental Signals” report and believed that eco-efficiency stemmed from the decoupling of resource utilization and pollution emissions with economic growth. Thus, eco-efficiency is defined as obtaining more social welfare from fewer natural resources. Eco-efficiency is the unity of economic efficiency and environmental benefits.
There are many evaluation methods for eco-efficiency, including the formula (Schaltegger and Figge, 2000; WBCSD, 2007), index (Dahlström and Ekins, 2005), ecological footprint (Hukkinen, 2001; Gössling and Hall, 2006; Patterson et al., 2007), and data envelopment (Tone, 2001, 2004; Yang and Pollitt, 2010) methods. At present, international authoritative institutions, organizations, experts, and scholars generally design evaluation methods based on the connotation of eco-efficiency.
2.2 Connotation and research field of global value chain
GVC refers to the segmentation and distribution of production processes in different countries, with businesses focusing on specific segments and not producing the entire product (Gereffi, 1999). GVC embodies all activities carried out by companies and workers to take a product from conception to end-use and after-sale, including research and development (R&D), design, production, marketing, distribution, and support to the end consumers. The measurement method of GVC embeddedness developed by Upward et al. (2013) and Kee and Tang (2016) is one of the most widely used methods in the current GVC field. This method mainly screens and judges various raw materials and intermediate products in trade as per detailed customs information and quantifies the GVC through trade added value. Numerous existing studies have conducted in-depth research on GVC from different perspectives and scenarios. The six main analysis dimensions of current GVC are: input-output structure, geographic scope (Keller, 2002), governance structure (McWilliam et al., 2020), leading companies and industry organizations (Feng et al., 2016), upgrading (Humphrey and Schmitz, 2000), local institutional background (Stringer et al., 2016), and industry stakeholders (Soundararajan and Brown, 2016). Specifically, these studies mainly investigated growth and convergence issues between countries or regions, the spatial spillover effects of GVC embeddedness on regional productivity (Baldwin and Yan, 2016), and the employment situation of workers in the context of the GVC (Wang et al., 2021a; Wang, et al., 2022).
2.3 Empirical analysis of GVC environmental eco-efficiency
Given that GVC closely links the world’s resources, it will also profoundly affect the environment of emerging countries. Long term research on GVC and environmental sustainability has mainly followed different directions. Some scholars started from the diversified forms of eco-industrial networks and studied how to optimize the environmental value chain to achieve environmental sustainable development (Zhu and Cote, 2004; Veal and Mouzas, 2010). Some scholars revealed the relationship between the corporate environmental sustainability of emerging markets and GVC (Sun et al., 2019) and described corporate sustainable governance issues (Sarkis, 2003). Additionally, some scholars studied the transfer of carbon emissions in international trade (Wang et al., 2019, 2020) and explored the impact mechanism of GVC embeddedness from a macro perspective. Generally, the degree of GVC embeddedness mainly influences the environment in two ways: structurally (González-Torres et al., 2020) and technologically (Whitfield et al., 2020; Wang et al., 2021b). On the one hand, being embedded in GVC will exacerbate environmental pollution. Specifically, it will hinder the adjustment of industrial structure through the low-end lock-in effect and inhibit technological progress through the technology capture and absorbability threshold effects. The lag in industrial structure adjustment and the lack of high-end technology will lead to low production efficiency and further the continuous deterioration of environmental conditions. On the other hand, GVC embeddedness may also drive technological reform and development in other regions through involuntary diffusion, learning, and imitation effects (Evenson and Westphal, 1995), factor flow effects, etc., when local regions technologically progress through import and export and further stimulate energy conservation and emission reduction. In the context of the global production network, the division of labor within products and the decomposition of the GVC can not only promote the upgrading of the industrial structure and increase in value chain links in the embedded countries and regions, but also lead to technological progress.
3 Model setting and sample selection
3.1 Spatial econometric model settings
3.1.1 Benchmark model settings for GVC embeddedness and eco-efficiency
Spatial econometric models are effective tools for studying spatial spillovers. Four commonly used spatial econometric models are the spatial autoregressive model (SAR), spatial error model (SEM), spatial Durbin model (SDM), and spatial autocorrelation model (SAC) (Anselin, 1988; LeSage and Pace, 2008). LeSage and Pace (2008) compared the abovementioned four models, assuming that the original data satisfies the data generation process of SAR, SEM, SDM, and SAC, respectively. By analyzing the estimation results caused by possible model mis-design, they found that the SDM model is the only model that can obtain unbiased estimation. Meanwhile, considering that the SDM can help resolve potential unobserved heterogeneity effectively reduce the estimation bias caused by missing variables, to control the heterogeneity of each region and accurately estimate the relationship between GVC embeddedness and eco-efficiency and avoid the endogeneity problem caused by missing variables, this study constructed a space and time-fixed panel model to test the correlation between industrial structure diversification and regional economic resilience. The benchmark model for regression estimation is:
where EEit refers to the eco-efficiency of region i in period t; WNEEit refers to the spatial lag term of the explained variable; GVCit denotes the degree of regional GVC embeddedness; WNGVCit denotes the spatial lag term of the degree of regional GVC embeddedness; τi and vt represent the space-fixed and time-fixed effects, respectively; and Xit denotes the relevant control variable. There may be endogeneity problems because the spatial econometric model estimates the spatial correlation from the entire region. Thus, the spatial panel maximum likelihood method was used to estimate the above models. Meanwhile, based on the results of the Hausman test, the relevant models in this study were all fixed-effect models. Because the spatial autocorrelation term is introduced into the spatial econometric model, coefficients of the explanatory variables must be estimated and the estimated results of the spatial correlation terms must be comprehensively considered (LeSage and Pace, 2008). By using a spatial econometric model, we can decompose the total effects (TE) into the direct effect (DE) due to spatial dependency, i.e. the regional spillover effect, and the indirect effect (IE), i.e. spatial spillover effect, to explore the impacts of adjacent regions. The model of the above Eq. 1 can be rewritten as:
The partial derivatives matrix of the expected value of the explained variable EE to the explanatory variable GVC is:
where
3.1.2 Spatial weight matrix setting
The spatial weight matrix not only defines how regions are related, but also reflects the degree of correlation. In spatial econometric estimation, the correct choice of spatial weight matrix is crucial to the analysis of spatial econometrics. The spatial adjacency matrix, W1, and the economic distance matrix, W2, were used in this study. The specific settings of the three matrices are as follows: (1) in the spatial adjacency matrix, 1 indicates that two places are adjacent and 0 indicates they are not, and its diagonal element is 0; (2) the regional GDP level was considered to construct the economic distance matrix because there is no unified form of it (Lu, 2017); (3) the off-diagonal element of the inverse geographic distance matrix is the inverse of the square of the distance between the two places, and the diagonal element is 0.
3.2 Sample selection
Considering the changes in the statistical caliber of China’s industrial enterprise database since 2007 and the availability of data, this study used the panel data of 30 provinces in China (excluding Tibet and China’s Hong Kong, Macao, and Taiwan regions with considerable data missing) from 2000 to 2006 for empirical analysis to test the impact of regional GVC participation on regional ecological efficiency. Data was obtained from the China Customs Database, the China Industrial Enterprise Database, the China Statistical Yearbook, the China Population and Employment Statistical Yearbook, the China Environment Yearbook, provincial statistical yearbooks and bulletins, and the electronic maps provided by the China National Geographic Information Statistics website with the following (Map Review (Inspection) Number.: GS (2019) 1822).
4 Variable description
4.1 Explained variable
This study used the Super-SBM model proposed by Tone (2001), based on the modified slack variable and considered the undesirable output. The obtained value of decision-making unit can be greater than 1, which can sort multiple efficient decision-making units. The calculation formula is:
where ρ refers to the eco-efficiency value of each province, m denotes the resource input, r1 denotes the desirable output, r2 denotes the undesirable output, x is an element in the resource input matrix, y1 is an element in the desirable output matrix, y2 is an element in the desirable output matrix, and n represents the number of decision-making units. Based on Eq. 4, the eco-efficiencies of China’s 30 provinces (the division of eastern, central, western, and northeastern regions is based on the method issued by the National Bureau of Statistics of China on 13 June 2011 and the implementation scope of China’s relevant national revitalization strategies) from 2000 to 2006 were obtained, and their basic statistical descriptions are shown in Table 1.

TABLE 1. Statistical descriptions of eco-efficiency in each region of China from 2000 to 2006.
Table 1 shows that during the sample period, the average level of eco-efficiency in the eastern region was generally higher than those of the other three regions. Beijing, Guangdong, and Shanghai, as the first echelon in the eastern region, all had an eco-efficiency >0.89; they not only had higher average levels of eco-efficiency, but also lower standard deviations than other provinces and cities in the eastern region, indicating that the eco-efficiency levels of Beijing, Guangdong, and Shanghai had been maintained at a relatively high level with small fluctuations. Hainan and Hebei had the lowest average levels of eco-efficiency in the eastern region, which, for Hainan Province, may be because the production mode is still relatively primitive without significant improvement over the years. Whereas, in Hebei Province, industrial pollution and the siphon effects of adjacent Tianjin and Beijing cities make it difficult to attract high-end talents and sufficient funds. In the central region, Anhui and Hubei had the highest ecological efficiencies (>0.56); however, unlike the three first-tier areas in the eastern region, the eco-efficiencies of Anhui and Hubei fluctuated greatly. The differences in the average eco-efficiency levels of provinces and municipalities in the western and northeastern regions were lower than those in the eastern and central regions. Ningxia had the highest average eco-efficiency in the western region, followed by Qinghai, and Heilongjiang Province had the highest average eco-efficiency in the northeastern region.
4.2 Level of regional GVC embeddedness
Different from the previous method of assessing the domestic added value of export products through input-output (I/O) tables and customs records (Hummels et al., 2001), this study constructed the regional GVC embeddedness level based on the ideas of previous studies (Upward et al., 2013; Kee and Tang, 2016; Wang et al., 2022) by using the micro-level data from China Customs’ monthly transaction level database of all commodities and China’s industrial enterprise database that covers all large-scale manufacturing annual census data in China. The specific steps are as follows. First, the micro-database was matched with reference to Upward et al. (2013). Second, the domestic destination or source of goods corresponding to each import and export trade record in the customs database were identified, and the destination or source of goods were identified according to the province to which the production enterprise belongs as per the China Customs Declaration Rules. Meanwhile, entrusting enterprises were identified based on the import location of consumption or export location of production. If there were missing records, enterprises were further identified based on information such as the corporate address, zip code, and telephone number. Third, processing trade and general trade was distinguished with reference to Upward et al. (2013). For processing trade, all imported products are intermediate products because they must be reused to produce export products. For general trade, the imported intermediate goods were identified by mapping the United Nations General Economic Classification Standard (BEC4) to the HS-6 code of China Customs database. Owing to the presence of intermediary trade agents, there may be excessive import (high import of intermediate products) or export (low import of intermediate products) in each province (Kee and Tang, 2016). Therefore, after the identification of imported intermediate products, the actual import and export activities of each province were further identified. Intermediate traders were divided by referring to the method of (Zimmerman et al., 2011). The ratios of the import value of all intermediate products to the total import of intermediate products and the ratio of the export value of all intermediate products to the total export under different trade modes in period t were adopted to replace the proportion of intermediate products imported through intermediate trade agents in each region in the total import of intermediate products in each region and the proportion of products exported through intermediate trade agents, respectively. After comprehensively considering processing trade, general trade, intermediate trade agents, and other issues, the final regional GVC embeddedness index was constructed as follows:
where the subscripts p and o are processing trade and general trade, respectively.
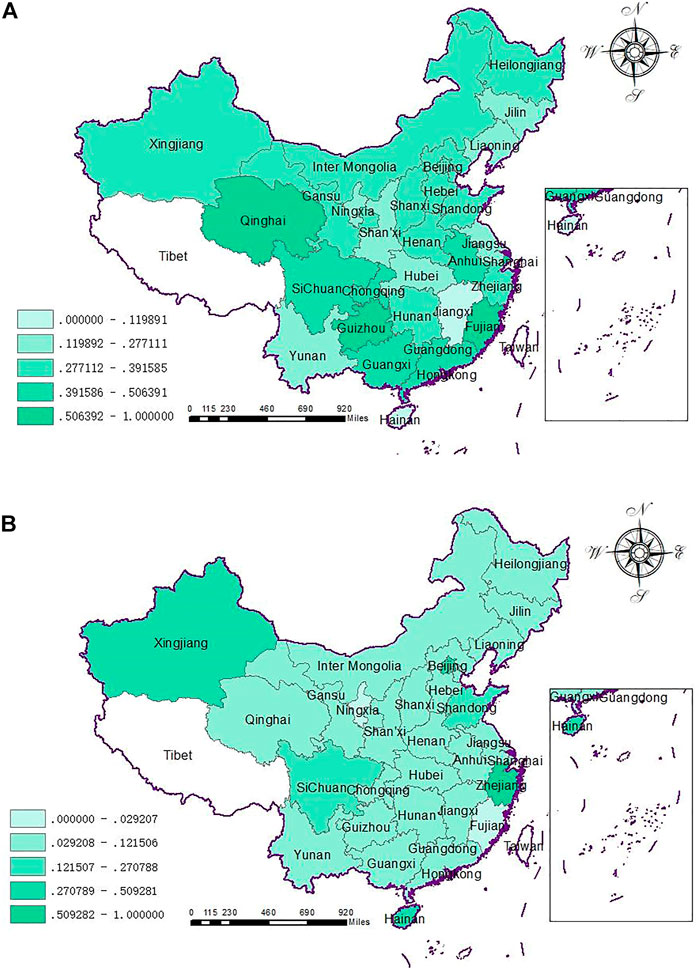
FIGURE 1. Degrees of regional GVC embeddedness in China in (A) 2000 and (B) 2006.
Figure 1 shows that the levels of GVC embeddedness of every province and area in China changed substantially between 2000 and 2006. Zhejiang Province had the highest level of GVC embeddedness in the eastern region in 2000. Meanwhile, in 2006, Fujian Province and Guangdong Province showed relatively large improvements from 2000. In the central region, only Anhui had a significant improvement. In the western region, the levels of GVC embeddedness of Qinghai, Guizhou, and Sichuan improved substantially.
4.3 Total number of regional environmental protection agencies
China’s current environmental protection system agencies can be divided into national, provincial, prefecture-level, city-level, and county-level according to their administrative levels. From the perspective of function, the environmental protection system is mainly composed of the environmental protection bureau, supervision office, monitoring station, scientific research institute, publicity and education center, and information center. The functions of each institution are diversified, and each institution complements each other. The total number of institutions in the environmental protection system can reflect the importance and supervision of environmental protection in a region to a certain extent. Therefore, this study selected the ratio of the total year-end number of environmental protection system institutions in each region to the regional administrative area as one of the explanatory variables.
4.4 Other involved variables
In addition to the above-mentioned explanatory variables, by referring to the existing research results, this study also selected the following relevant control variables to avoid endogeneity bias: industrial structure (ST): the ratio of the GDP of the secondary industry to the tertiary industry; urbanization level (UR): the proportion of non-agricultural population to the total population; human capital (HC): the natural logarithm of the average years of education in the region; science and technology innovation level (TC): the natural logarithm of the number of patent applications granted; and economic density (ECD): the natural logarithm of GDP per square kilometer. The statistical descriptions of relevant variables are presented in Table 2.
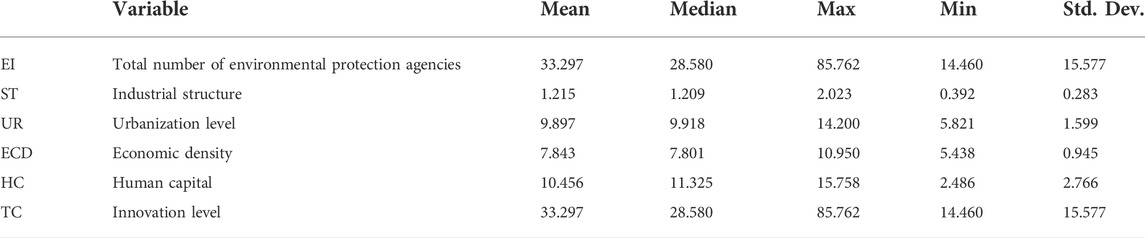
TABLE 2. Statistical descriptions of variables.
5 Empirical analysis results
5.1 Results of the Moran’s I test
5.1.1 Global Moran’s I
Before performing spatial regression estimation, it is necessary to test the spatial autocorrelation of regional eco-efficiency in China. If there is spatial autocorrelation, the spatial econometric model can be used, and Moran’s I index is used for test. If the value of this index is 0, it means there is no spatial autocorrelation; if it is >0, it means there is positive spatial autocorrelation; if it is <0, it means there is negative spatial autocorrelation. The closer the index value to 1, the stronger the spatial autocorrelation. The values of Moran’s I index of regional eco-efficiency in China from 2000 to 2006 are presented in Table 3. It can be seen that the eco-efficiency index is significant at the <10% significance level, indicating that there is significant spatial correlation among the eco-efficiency of each area in China. Therefore, the spatial econometric model can be used for estimation.
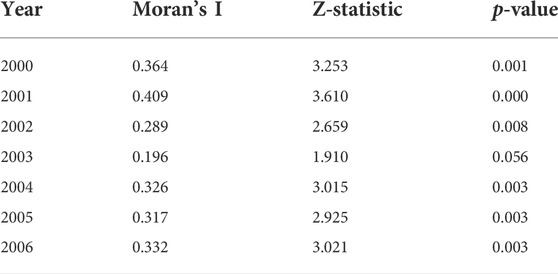
TABLE 3. Moran’s I results of regional eco-efficiency in China (2000–2006).
5.1.2 Local Moran’s I
In order to better explore and analyze the variation of spatial heterogeneity and agglomeration characteristics of individuals in different regions on the basis of global Moran’s I, the Moran scatter plots of ecological efficiency in 2000 and 2006 were further drawn, as shown in Figure 2 below. Regional individuals fall into different Quadrants of Moran scatter plot, which reflects their different agglomeration characteristics. If a region falls in the Quadrant I, then it means that its own eco-efficiency is high, and the surrounding eco-efficiency is also high, that is, high-high agglomeration (H-H). In the Quadrant II, the eco-efficiency of the area is low, while the surrounding eco-efficiency is high, that is, low-high agglomeration (L-H). The Quadrant III indicates low-low agglomeration (L-L), which means that the eco-efficiency of this area is low, and the surrounding level is also low. Finally, the Quadrant IV, contrary to the Quadrant II, reflects the characteristics of high-low agglomeration (H-L), that is, its own eco-efficiency is high, while the surrounding eco-efficiency is low. By comparing the Moran scatter diagram in 2000 and 2006, we can find that most of the region mainly falls in Quadrant I and III with a stable number of members. Furthermore, the number of provinces and cities that fall in Quadrant III (L-L) is significantly higher than that in Quadrant I (H-H), suggesting that the eco-efficiency has both the spatial correlation and spatial heterogeneity. The members in Quadrant I are quite stable from 2000 to 2006, which basically includes the economically developed regions along the eastern coast. These regions are more economically active, have more abundant capital and talents than other regions, and are more likely to update production technology, so as to improve their eco-efficiency. In 2000, only Inner Mongolia (IM) and Jilin (JL) were in Quadrant II, and in 2006, Liaoning (LN) was included. This indicates that there is still a certain gap between the eco-efficiency level of Northeast China and the surrounding areas during the sample period, and the distance of developing level is expanding. In particular, Liaoning Province fell from the H-H cluster to the L-L cluster. As the cradle of new China’s industry and an important industrial and agricultural base, the three northeastern provinces (Heilongjiang, Jilin and Liaoning) with abundant natural resources had an early economic start. In the 1930s, they made significant contributions to China’s development and embarked on a development path dominated by heavy industry, once accounting for 98% of China’s heavy industry. However, with further reflection of deep-seated problems such as resource depletion, industrial decline, imbalance in the proportion of industrial structure, and backward system and mechanism, the economic downturn and pressure on the livelihood of people in Northeast China are gradually increasing, which gradually restrict the sustainable development of social economy and the improvement of eco-efficiency in Northeast China. For these reason, China began proposing a Northeast revitalization strategy in 2006. However, individuals in Quadrant IV (H-L agglomeration group) in 2000 tended to move to Quadrant III (L-L agglomeration group) in 2006, indicating that if the eco-efficiency of the surrounding area is low, the area with high eco-efficiency will also be negatively affected due to the spillover effect. Overall, the spatial distribution of eco-efficiency in China has obvious dependencies and differences.
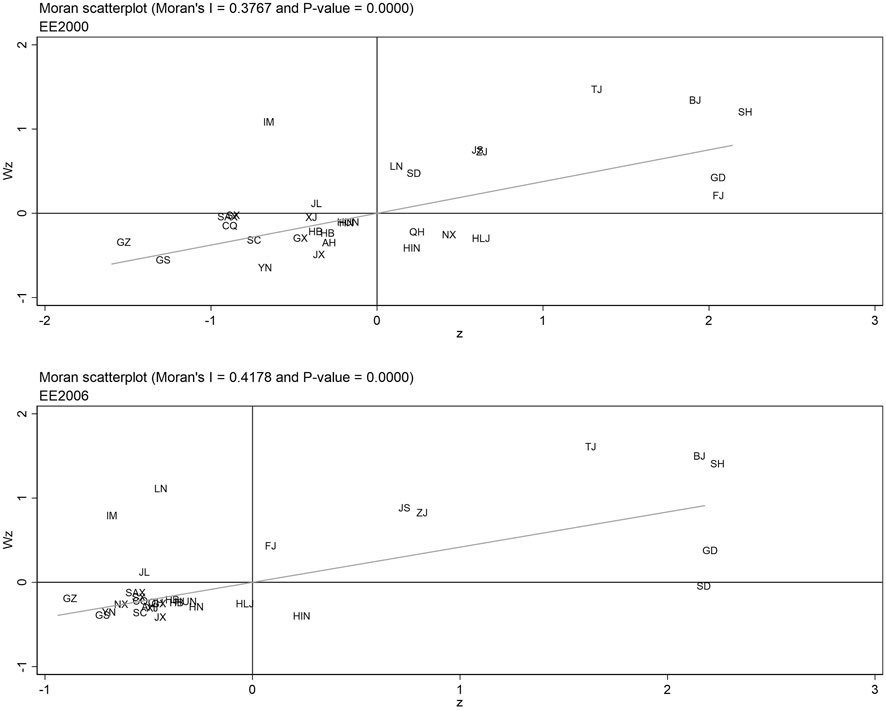
FIGURE 2. Moran scatter plot of eco-efficiency in China in 2000 and 2006.
5.2 Estimated results of GVC embeddedness on regional eco-efficiency
The estimated results of GVC embeddedness and regional eco-efficiency and the impact decomposition of GVC embeddedness are shown in Table 4.

TABLE 4. Estimation results of Model (1).
By comparing the estimation results of the spatial econometric model, it can seen that regardless of the spatial matrix used, the impact of GVC on eco-efficiency was significantly positive at the 10% significance level during the sample period, while the positive impact was weak. Meanwhile, among the three spatial matrices, the estimated result of GVC embedding using the inverse distance spatial matrix is the largest. Regarding the influence of environmental protection system institutions, the estimation results of spatial econometric models were significantly positive, indicating that the number of environmental protection system institutions has a positive effect on the local eco-efficiency. The coefficients of urbanization were negative in all models, indicating that continuous increases in urban population and blind expansion can easily cause problems such as the reduction of cultivated land and green space, the soaring of the haze index, additional environmental pollution, and unreasonable allocation of resources. Economic density has a significant positive effect on ecological efficiency, which may be because provinces and municipalities with abundant capital reserves have more funds for technological R&D upgrading and environmental governance. The industrial structure in regions with a high proportion of secondary industry has a negative impact on eco-efficiency. In terms of spatial lag coefficients, the GVC embeddedness of adjacent areas also has a significant positive impact on the local area. However, the higher the number of environmental institutions in adjacent areas, the more the spillover effects, such as demonstration and ecological education, to nearby areas, thus promoting the improvement of local eco-efficiency. The improvement of human capital and technical level in adjacent areas can promote the improvement of local ecological efficiency, which reflects the spillover effect of talents and technology from one aspect.
Given that this study mainly focused on the spatial impact of GVC, Table 4 presents the spatial utility decomposition of GVC embeddedness. The direct effect of GVC embeddedness refers to its regional impact on eco-efficiency, such as the feedback effects (FE) that not only contain the direct positive impact of local GVC embeddedness on the eco-efficiency of adjacent areas, but also in turn its impact on local eco-efficiency. Indirect effects are used to measure the impact of the GVC embeddedness of neighboring regions on local eco-efficiency. In general, the GVC embeddedness has significant regional spillover effects. Whilst embedding into the GVC, relevant regions can not only absorb the technology contained in imported intermediate commodities, but also improve their own technical level and innovation ability by accepting the advanced management experience from large multinational enterprises. This allows more efficient, energy saving, and environmentally friendly production and operation, thereby improving and promoting eco-efficiency. Furthermore, the indirect effect of GVC embeddedness is also significantly positive, indicating that the deepening of local GVC embeddedness will also have a significant positive effect on the eco-efficiency of other regions. In addition, it is worth noting that in the estimation results of the three spatial matrix models, the direct effect of GVC using the inverse distance matrix is the largest, which is reflected in the node selection of global value from one side, and the transportation cost of intermediate products is an important factors to consider; and the distance between regions will significantly affect the transportation cost of the relevant intermediate products.
6 Conclusion and suggestions
Using different spatial econometric matrices, this study analyzed and explored the spatial relationship between the direct GVC embeddedness and the local and surrounding areas and refined and verified the spatial spillover mechanism of GVC. The empirical results show that during the sample period, the degree of GVC embeddedness could play a certain positive role in regional eco-efficiency. It can not only improve the ecological efficiency of the region through traditional methods, such as import and export, but also drive the improvement of eco-efficiency in other regions through spatial spillover effects, such as diffusion, imitation, and competition. Government environmental protection system agencies can promote regional eco-efficiency through publicity, supervision, etc. However, environmental pollution problems are inevitable in the process of traditional urbanization, which is a problem that needs urgent attention in the transformation of social structure. Moreover, regional economic density has a significant positive effect on ecological efficiency. As global economy and GVC embeddedness are important globalization strategies for developing countries such as China, fully understanding the spatial spillover effect of GVC and clarifying the role of other key elements are of great significance to help other developing countries in Asia better manage regional economic development.
7 Future research directions
Although the relevant empirical results of this study indicate, from a macro perspective, that the level of regional GVC embeddedness has a spatial spillover effect on regional eco-efficiency, it fails to investigate this from the perspective of different stages of China’s GVC embeddedness, that is, the position on the global value chain. GVC embeddedness at different value chain stages will lead to different eco-efficiency results. For example, in the middle and low-end stages, environmental pollution caused by industrial transfer from developed countries is easy, while in the middle and high-end stages, it has a positive effect on the improvement of environmental ecological conditions. Therefore, in view of the regional heterogeneity of the impacts of GVC on China’s environment, future research and analysis should focus on different economic regions and different industrial stages.
Data availability statement
The raw data supporting the conclusion of this article will be made available by the authors, without undue reservation.
Author contributions
XL: Formal analysis, Conceptualization, Visualization, Software, Writing—original draft, Writing—review & editing. ZZ: Conceptualization, Data curation, Methodology, Writing—original draft, Validation. CL: Writing—review and editing, Funding acquisition, Supervision, Validation Formal analysis, Validation.
Funding
The work described in this paper is supported by the (Macau University of Science and Technology Faculty Research Grant Projects) under Grant (FRG-22-003-INT).
Conflict of interest
The authors declare that the research was conducted in the absence of any commercial or financial relationships that could be construed as a potential conflict of interest.
Publisher’s note
All claims expressed in this article are solely those of the authors and do not necessarily represent those of their affiliated organizations, or those of the publisher, the editors and the reviewers. Any product that may be evaluated in this article, or claim that may be made by its manufacturer, is not guaranteed or endorsed by the publisher.
References
Anselin, L. (1988b). Spatial econometrics: Methods and models. Dordrecht: Kluwer Academic Publishers. doi:10.1007/978-94-015-7799-1
Baldwin, J. R., and Yan, B. (2016). Global value chain participation and the productivity of Canadian manufacturing firms. Montreal, Canada: Institute for Research on Public Policy.
Dahlström, K., and Ekins, P. (2005). Eco‐efficiency trends in the UK steel and aluminum industries. J. Ind. Ecol. 9, 171–188. doi:10.1162/108819805775247954
Evenson, R. E., and Westphal, L. E. (1995). Chapter 37 Technological change and technology strategy. Handb. Dev. Econ. 3, 2209–2299. doi:10.1016/S1573-4471(05)80009-9
Feng, L., Li, Z., and Swenson, D. L. (2016). The connection between imported intermediate inputs and exports: Evidence from Chinese firms. J. Int. Econ. 101, 86–101. doi:10.1016/j.jinteco.2016.03.004
Gereffi, G. (1999). International trade and industrial upgrading in the apparel commodity chain. J. Int. Econ. 48 (1), 37–70. doi:10.1016/s0022-1996(98)00075-0
González-Torres, T., Rodríguez-Sánchez, J. L., Montero-Navarro, A., and Gallego-Losada, R. (2020). Visualizing research on industrial clusters and global value chains: A bibliometric analysis. Front. Psychol. 11, 1754. doi:10.3389/fpsyg.2020.01754
Gössling, S., and Hall, M. C. (2006). Tourism and global environmental change. Francis: Taylor & Francis.
Hukkinen, J. (2001). Eco-efficiency as abandonment of nature. Ecol. Econ. 38, 311–315. doi:10.1016/S0921-8009(01)00217-8
Hummels, D., Ishii, J., and Yi, K. M. (2001). The nature and growth of vertical specialization in world trade. J. Int. Econ. 54, 75–96. doi:10.1016/S0022-1996(00)00093-3
Humphrey, J., and Schmitz, H. (2000). Governance and upgrading: Linking industrial cluster and global value chain research. Brighton Inst. Dev. Stud. 120, 139–170.
Kee, H. L., and Tang, H. (2016). Domestic value added in exports: Theory and firm evidence from China. Am. Econ. Rev. 106 (6), 1402–1436. doi:10.1257/aer.20131687
Keller, W. (2002). Geographic localization of international technology diffusion. Am. Econ. Rev. 92, 120–142. doi:10.1257/000282802760015630
Lesage, J. P., and Pace, R. K. (2008). Spatial econometric modeling of origin destination flows. J. Reg. Sci. 48 (5), 941–967. doi:10.1111/j.1467-9787.2008.00573.x
Lindeman, R. L. (1941). Seasonal food-cycle dynamics in a senescent lake. Am. Midl. Nat. 26, 636–673. doi:10.2307/2420739
Lu, Y. (2017). China’s electrical equipment manufacturing in the global value chain: A GVC income analysis based on world input-output database (wiod). Int. Rev. Econ. Finance 52, 289–301. doi:10.1016/j.iref.2017.01.015
McWilliam, S. E., Kim, J. K., Mudambi, R., and Nielsen, B. B. (2020). Global value chain governance: Intersections with international business. J. World Bus. 55, 101067. doi:10.1016/j.jwb.2019.101067
Patterson, T. M., Niccolucci, V., and Bastianoni, S. (2007). Beyond “more is better”: Ecological footprint accounting for tourism and consumption in Val di Merse, Italy. Ecol. Econ. 62, 747–756. doi:10.1016/j.ecolecon.2006.09.016
Sarkis, J. (2003). A strategic decision framework for green supply chain management. J. Clean. Prod. Sun. 11, 397–409. doi:10.1016/S0959-6526(02)00062-8
Schaltegger, S., and Figge, F. (2000). Environmental shareholder value: Economic success with corporate environmental management. J. Corp. Environ. Manag. Eco-Mgmt. Aud. 7, 29–42. doi:10.1002/(SICI)1099-0925
Soundararajan, V., and Brown, J. A. (2016). Voluntary governance mechanisms in global supply chains: Beyond CSR to a stakeholder utility perspective. J. Bus. Ethics 134, 83–102. doi:10.1007/s10551-014-2418-y
Stringer, C., Hughes, S., Whittaker, D. H., Haworth, N., and Simmons, G. (2016). Labour standards and regulation in global value chains: The case of the New Zealand fishing industry. Environ. Plan. A 48, 1910–1927. doi:10.1177/0308518X16652397
Sun, C., Li, Z., Ma, T., and He, R. (2019). Carbon efficiency and international specialization position: Evidence from global value chain position index of manufacture. Energy Policy 128, 235–242. doi:10.1016/j.enpol.2018.12.058
Tone, K. (2001). A slacks-based measure of efficiency in data envelopment analysis. Eur. J. Oper. Res. 130, 498–509. doi:10.1016/S0377-2217(99)00407-5
Tone, K., and Sahoo, B. K. (2004). Degree of scale economies and congestion: A unified dea approach. Eur. J. Oper. Res. 158, 755–772. doi:10.1016/S0377-2217(03)00370-9
Upward, R., Wang, Z., and Zheng, J. (2013). Weighing China’s export basket: The domestic content and technology intensity of Chinese exports. J. Comp. Econ. 41, 527–543. doi:10.1016/j.jce.2012.07.004
Veal, G., and Mouzas, S. (2010). Learning to collaborate: A study of business networks. J. Bus. Ind. Mark. 25, 420–434. doi:10.1108/08858621011066017
Wang, L., Zhang, B., Xie, R., and Su, B. (2020a). The drivers of export value-added in China’s provinces: A multi-regional input-output model. Appl. Econ. 52, 6199–6214. doi:10.1080/00036846.2020.1787322
Wang, S., Chen, H., and Yin, K. (2022). The employment effect of Chinese industrial enterprises embedded in environmental cost-adjusted global value chains. Environ. Sci. Pollut. Res. 29, 18160–18176. doi:10.1007/s11356-021-17118-w
Wang, S., He, Y., and Song, M. (2021a). Global value chains, technological progress, and environmental pollution: Inequality towards developing countries. J. Environ. Manage. 277, 110999. doi:10.1016/j.jenvman.2020.110999
Wang, S. H., Li, Z. Z., and Song, M. (2019). How embodied carbon in trade affects labor income in developing countries. Sci. Total Environ. 672, 71–80. doi:10.1016/j.scitotenv.2019.03.456
Wang, S., Li, Z., and Zhang, H. (2021b). Does female labor share reduce embodied carbon in trade? Environ. Sci. Pollut. Res. 28, 8246–8257. doi:10.1007/s11356-020-11172-6
Wang, S., Wang, X., and Tang, Y. (2020b). Drivers of carbon emission transfer in China—an analysis of international trade from 2004 to 2011. Sci. Total Environ. 709, 135924. doi:10.1016/j.scitotenv.2019.135924
Wang, S., Zhao, D., and Chen, H. (2020c). A spatial analysis of corruption, misallocation, and efficiency. Environ. Sci. Pollut. Res. 27, 36845–36856. doi:10.1007/s11356-020-09707-y
WBCSD (2007). The global water tool. SwitzerlandGeneva: World Business Council on Sustainable Development. http://www.wbcsd.org.
Whitfield, L., Staritz, C., Melese, A. T., and Azizi, S. (2020). Technological capabilities, upgrading, and value capture in global value chains: Local apparel and floriculture firms in Sub-Saharan Africa. Econ. Geogr. 96, 195–218. doi:10.1080/00130095.2020.1748497
Yang, H., and Pollitt, M. (2010). The necessity of distinguishing weak and strong disposability among undesirable outputs in DEA: Environmental performance of Chinese coal-fired power plants. Energy Policy 38, 4440–4444. doi:10.1016/j.enpol.2010.03.075
Zhu, Q., and Cote, R. P. (2004). Integrating green supply chain management into an embryonic eco-industrial development: A case study of the guitang group. J. Clean. Prod. 12, 1025–1035. doi:10.1016/j.jclepro.2004.02.030
Keywords: eco-efficiency, global value chain, spatial econometrics, environmental institutions, spatial spillover
Citation: Li X, Liu C and Zhang Z (2022) Spatial spillover of global value chain in eco-efficiency. Front. Environ. Sci. 10:1023122. doi: 10.3389/fenvs.2022.1023122
Received: 19 August 2022; Accepted: 29 August 2022;
Published: 21 September 2022.
Edited by:
Shuhong Wang, Shandong University of Finance and Economics, ChinaReviewed by:
Xin Zhao, Anhui University of Finance and Economics, ChinaYuanxiang Zhou, Anhui University of Finance and Economics, China
Copyright © 2022 Li, Liu and Zhang. This is an open-access article distributed under the terms of the Creative Commons Attribution License (CC BY). The use, distribution or reproduction in other forums is permitted, provided the original author(s) and the copyright owner(s) are credited and that the original publication in this journal is cited, in accordance with accepted academic practice. No use, distribution or reproduction is permitted which does not comply with these terms.
*Correspondence: Zhe Zhang, emhhbmd6aGUyMDEyMDkxMkAxMjYuY29t