
94% of researchers rate our articles as excellent or good
Learn more about the work of our research integrity team to safeguard the quality of each article we publish.
Find out more
ORIGINAL RESEARCH article
Front. Environ. Sci., 11 November 2022
Sec. Water and Wastewater Management
Volume 10 - 2022 | https://doi.org/10.3389/fenvs.2022.1021777
This article is part of the Research TopicThe Detection of Emerging Pollutants by New or Alternative Analytical MethodsView all 4 articles
 Alberto Pistocchi1*
 Sergio Cinnirella2
 Pavlos Mouratidis3Nele Rosenstock3Caroline Whalley4Michel Sponar3Nicola Pirrone2
Mercury pollution is a cause of high concern for European freshwaters. In this study, we use modelled atmospheric deposition and novel high-resolution water cover and impervious urban areas data to quantify the input of Mercury to European rivers and lakes. This information, combined with estimates of releases from industrial installations and urban wastewater and from soils, yields an overall European budget of water Mercury. Compared to previous estimates, the calculation highlights that direct deposition to permanent and temporary inland water surfaces is a dominant source of pollution. We also show that an important source is the washout of impervious urban surfaces, while releases from soil and industrial and urban wastewater play a lesser, albeit sizable role. The contribution of wastewater to Mercury releases is expected to decrease over time because of more stringent regulations on Mercury use. The analysis confirms that reducing atmospheric deposition (hence air releases) of Mercury remains the single key action to control pollution. However, we show that control of urban runoff discharges to water bodies may be the most effective water management measure in order to reduce Mercury input to coastal and in-land water bodies.
On-water deposition is the main source of Hg freshwater pollution in the EU. Control of urban runoff is the most effective water management measure to reduce pollution.
By ratifying the Minamata Convention on Mercury (https://www.mercuryconvention.org/), the European Union (EU) has committed to reduce Mercury (Hg) pollution and therefore its release to the global environment (UNEP, 2013). Article 9 of the Convention requires controlling and, where feasible, reducing releases of Hg and its compounds to land and water, while Article 19 encourages the implementation of measures to improve our understanding of the Hg cycle. Hg and its compounds are furthermore identified as Priority Hazardous Substances (PHS) in Annex X to the Water Framework Directive (WFD, 2000/60/EC), and pose a concern in particular due to the potential of MethylMercury (MeHg) to bio-accumulate and bio-magnify in organisms. In line with Hg’s status as a PHS, discharges and losses of Hg to the aquatic environment should be phased out over a time frame of 20 years (WFD Art 16). This target has not been achieved, though, and monitoring of EU freshwaters still highlights widespread exceedance of the environmental quality standards (EQS) for Hg set in Directive 2008/105/EC (as amended by Directive 2013/39/EU), particularly of the EQS for biota (EEA, 2018a), reinforcing the urgency to undertake actions to reduce Hg pollution (Lassen et al., 2017).
Hg enters the aquatic environment through atmospheric deposition and direct discharges (AMAP/UNEP, 2019), including industrial and domestic wastewaters. In the latter, an important source of Hg is dental amalgam. According to a comprehensive study at European scale (BIO Intelligence Service, 2012), at least 15 t year−1 of Hg entering urban wastewater treatment plants were associated to this source, resulting in a contribution to surface water pollution of 2 t annually. A more recent study (Deloitte, Ineris and Wood, 2020) reduced the estimate to less than 6 t year−1 and concluded that dental amalgam is responsible for 67% of releases from municipal waste water treatment plants. Although the pathways of Hg to water are understood in broad terms (Hsu-Kim et al., 2018), our knowledge on this topic is relatively less advanced than the fate and transport of Mercury in air, both regionally and globally. Indeed, it was only in 2019 that the Global Mercury Assessment (GMA: AMAP/UNEP, 2019) first included an estimation of Mercury releases to water bodies. Still, the assessment is based on an assumed, fixed relationship between water and air emissions for specific sectors (UN Environment, 2017a; UN Environment, 2017b). This does not enable a specific assessment of the sources of Hg nor an appraisal of measures for their control. While surveys of Mercury loads and fluxes from wastewater exist for some European countries such as Switzerland (Suess et al., 2020) or city regions such as Frankfurt (Fricke et al., 2015), a similar evaluation is still lacking for larger regions such as the EU as a whole.
In this contribution, we develop a screening level assessment of the sources of Hg pollution discharging in the EU’s freshwaters, as a precondition to identify possible strategies for its control. Starting from Hg deposition estimated by EMEP’s well-established predictive model (Travnikov and Ilyin, 2005), we build a simple GIS-based model of Hg mass balance in European surface waters. To this end we employ a global dataset of surface water cover (the Global Surface Water Explorer: Pekel et al., 2016) at unprecedented resolution both in time and space, and a relatively high-resolution impervious urban area map (Lavalle et al., 2015). In the remainder of this paper, after explaining the modelling approach and data sources, we present our estimates of the Hg balance for European freshwaters. Based on the results of this calculation, we discuss the possible strategies to reduce Hg pollution in water.
In order to quantify the mass flows of Hg reaching EU waters, we refer to a simple, steady state mass balance model that we further justify below. The releases of Hg to surface waters R [M T−1] from a given region are computed as:
with S = releases to soils [M T−1] equal to:
In the above equations:
-
-
-
-
-
-
-
-
-
-
-
-
-
-
For industrial releases (Iw and Is) we assume those to water and soil reported under the European Pollutant Release and Transfer Register (E-PRTR) (https://prtr.eea.europa.eu). While E-PRTR is the best available source of information, it is likely not representing a complete account of industrial Hg releases: besides those from various large industrial installations, it also reports the releases of Hg to water and soil from many wastewater treatment plants above a capacity of 100,000 Population Equivalents (PE). Quite possibly, data gaps exist, as many plants do not report monitored Hg emissions systematically. At the same time, E-PRTR does not include industrial activities below a certain threshold (depending on the industrial sector). Given the uncertainty involved in the calculations, we assume that non-reported industrial releases compensate releases reported from large wastewater treatment plants, and we consider the total releases to water from E-PRTR as a proxy for the industrial contribution tout court. The most recently reported releases by country are shown in Table 1. Permitted releases to soil and accidental releases to soil and water reported in E-PRTR amount to a few kg per year, so that they can be neglected (Is∼0). Our assumption on industrial emissions is prone to the risk of some double-counting, hence overestimation of Hg coming with wastewater; however, there is a broad agreement on the fact that bulk (wet and dry) atmospheric deposition to land and water surfaces entails much larger mass flows (AMAP/UNEP, 2019), limiting the impact of any overestimation of wastewater loads. Atmospheric deposition on soils contributes indirectly to water pollution, and requires an estimation of the releases through leaching, runoff or erosion that eventually reach the water bodies. In this contribution, we do not quantify these releases through an explicit description of Hg fate and transport processes in soil, but we assign it as a simple model parameter. When deposited on soil, Hg undergoes physical and chemical processes associated with the hydrological cycle. Hg releases from soils, through runoff, leaching and erosion processes, may represent a significant contribution to the overall loadings of Hg discharged to waterbodies in the absence of other local sources (Jeong et al., 2020). In the presence of direct releases, though, they could be much less relevant.
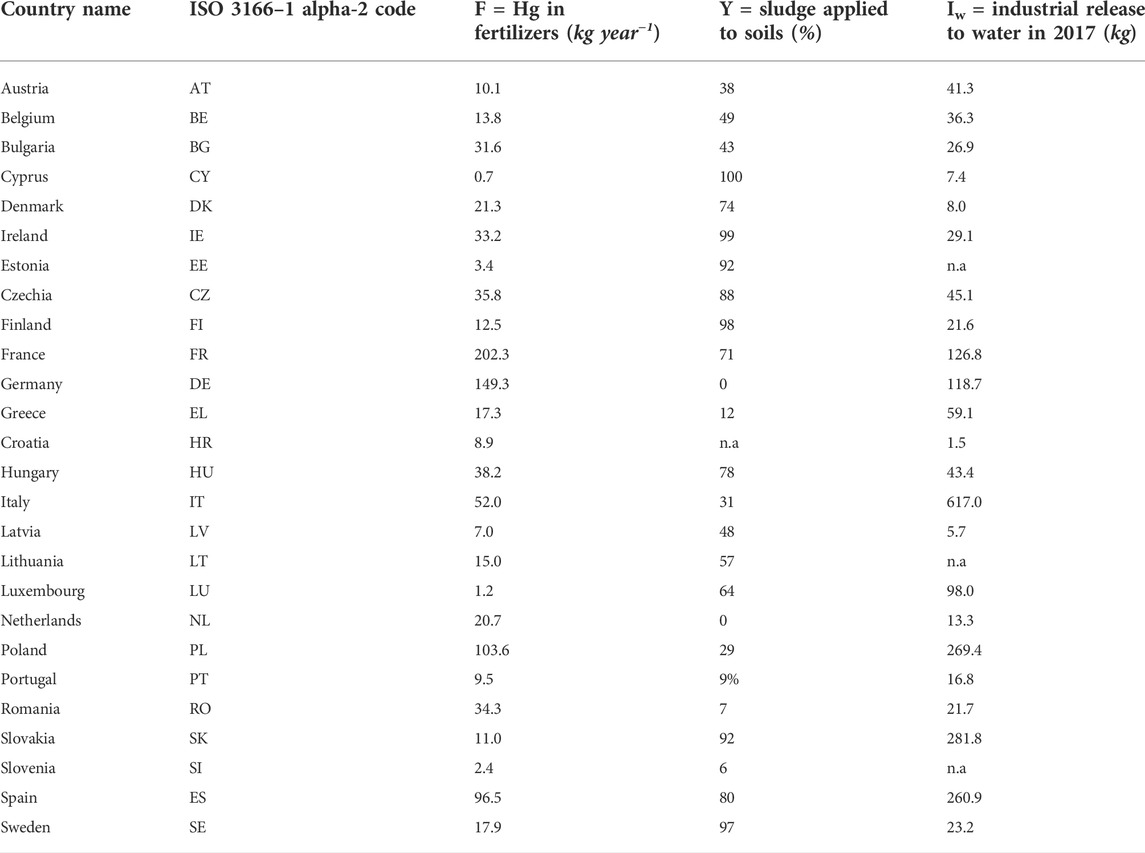
TABLE 1. Fertilizers and sludge applied in EU Countries adopted to calculate industrial release to water (n.a. = not available).
Atmospheric deposition on water surfaces is on a par with direct discharges. Although we usually consider water surfaces as those permanently covered by water, in reality we should also include atmospheric deposition on temporary water-covered surfaces, arguably a direct discharge during periods of flooding.
Deposition on impervious surfaces, such as urban areas, undergoes both volatilization and washout. The interplay of the two determines the corresponding release to water. In this contribution, we simply estimate the loss of Hg from impervious surfaces as a constant fraction of the incoming deposition, considered as a model parameter.
Deposition (D) as a total of dry and wet deposition was taken from the EMEP MSCE-HM model (Travnikov and Ilyin, 2005), providing values computed at nodes of a regular grid of approximately 50 × 50 km spatial resolution. In this exercise, we refer to the estimate available for the most recent year (2017).
The fraction of inland area that is impervious (fU) and fraction of inland area that is water-covered (fw) were estimated from the Urban Atlas (Lavalle et al., 2015) at 100 m resolution and the JRC Global Surface Water Explorer (GSWE: https://global-surface-water.appspot.com/; Pekel et al., 2016) at 30 m resolution (see Figure 1). At the European scale, we first downscaled the EMEP model deposition estimates (D) to a spatial resolution of 1 km using a natural neighbor interpolation algorithm (Sibson, 1981) applied to the EMEP grid nodal values. Subsequently, we upscaled the original resolution of 30 m to 1-km2 grid cells by averaging the percentage of water cover. Finally, we multiplied the average water cover per km2 by the corresponding EMEP model deposition flux. In this way, we count an area as water for the duration of its submersion as captured by the GSWE. For instance, an area covered by water for 10% of the time counts as if it were 10% water and 90% soil other than water. The results of this processing are shown in Figure 2. In a similar way we calculated the deposition falling on impervious areas.
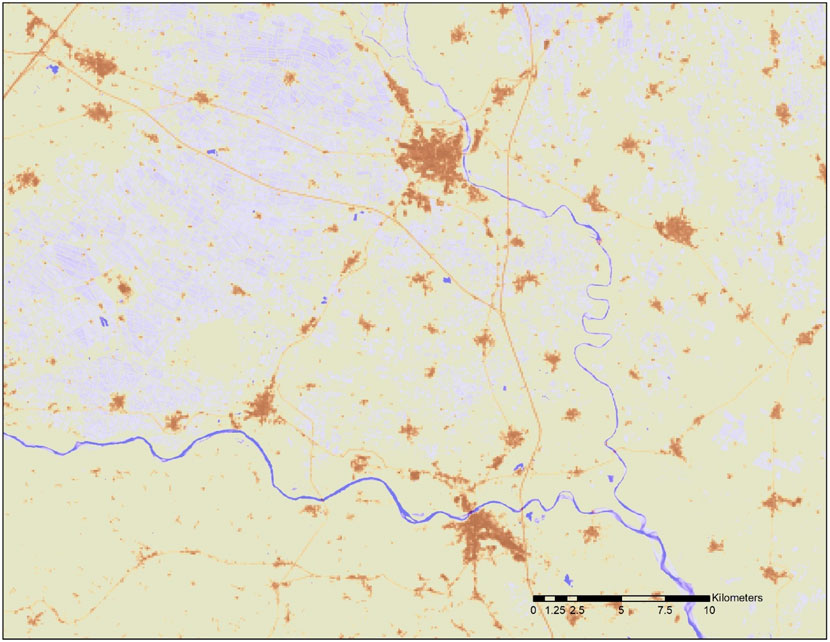
FIGURE 1. Example of water occurrence and impervious surface mapping. Pixels covered with water are in tones of blue with increasing intensity as water is more permanent (e.g., rivers) and paler tones corresponding to occasionally flooded land. Pixels containing impervious areas are in tones of brown (e.g., cities, infrastructure). Data source: JRC.
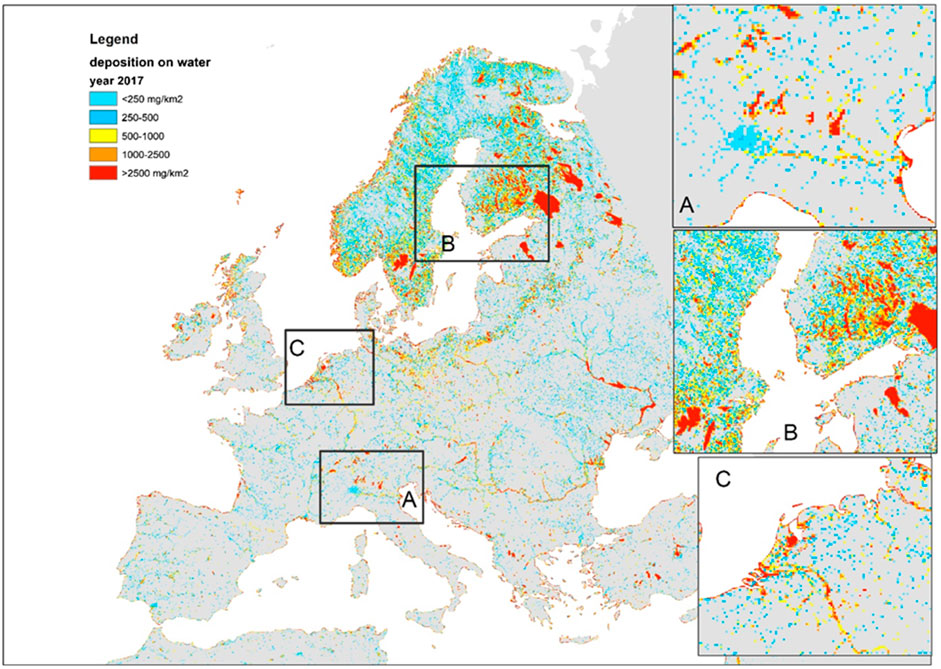
FIGURE 2. Total (dry and wet) atmospheric deposition of Hg on water surfaces in 2017 (source: JRC Global Surface Water Explorer, EMEP MSCE-HM model results). Zooms on frames (A–C) are shown in the insets to the right of the map.
We represent emissions through urban wastewater based on the population (Pop) data retrieved from EUROSTAT (https://ec.europa.eu/eurostat/databrowser/view/tps00001/default/table?lang=en).
Fertilizers applied to agricultural soil represent another source of Hg, along with sewage sludge applied to farmland (Carbonell et al., 2011). The amount of Hg released to soils through organic and mineral fertilizers (F) was estimated from the total fertilizer consumption given in EUROSTAT (https://ec.europa.eu/eurostat/statistics-explained/index.php?title=Agri-environmental_indicator_-_mineral_fertiliser_consumption) assuming an average Hg content in fertilizers of 0.090 mg per kg of nitrogen (Gambuś and Wieczorek, 2012). This concentration value seems representative of average conditions in Europe, although much higher Hg content is reported for certain fertilizers elsewhere (e.g. Zhao and Wang, 2010). Because the dataset on fertilizers reports both nitrogen and phosphorus, for the calculation we considered only the former as often distributed as multicomponent with the latter (Table 1). The fraction of sludge applied in agriculture (Y) that we assume for the calculation (from Pistocchi et al., 2019a) corresponds to data reported by the EU Member States to the European Commission, as per Table 1.
Fertilizers contribute a smaller input compared to sewage sludge, which is consistent with the observations of Sánchez-Báscones et al., 2017 on Hg content in soils subject to fertilizer and sludge application.
In some cases, leakage from landfills can be a potential Hg source (Gray, 2004). However, in this assessment we neglect this due to lack of data. Hg in soil may be also a legacy of old mining activities (Tóth et al., 2016a), but this source will not be considered further in this study.
Based on the above considerations, we can solve the above mass balance equations once we define the 5 parameters representing releases with wastewater (W), fraction of deposition on urban areas that is washed off (α), fraction of deposition on soils that is leached to water (β), fraction of wastewater that is discharged through CSO (γ), and efficiency of Mercury retention in wastewater sludge (η). For this assessment, we select the values shown in Table 2, where we also provide a rationale for the choice. While these coefficients could be in principle calibrated on the basis of robust observations of Hg loads, compiling an adequate calibration dataset is very demanding and beyond the scope of this screening level exercise. In the discussion of our results, we illustrate the sensitivity of Hg mass balances to variations in the elicited coefficients as shown in Table 3.
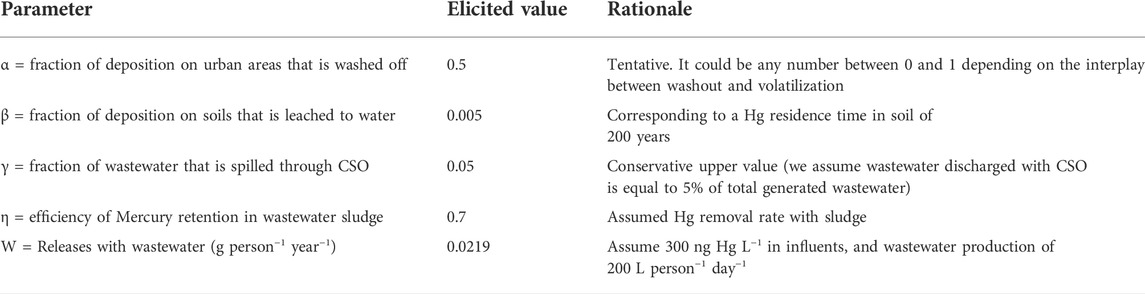
TABLE 2. Model parameters used in the estimation.
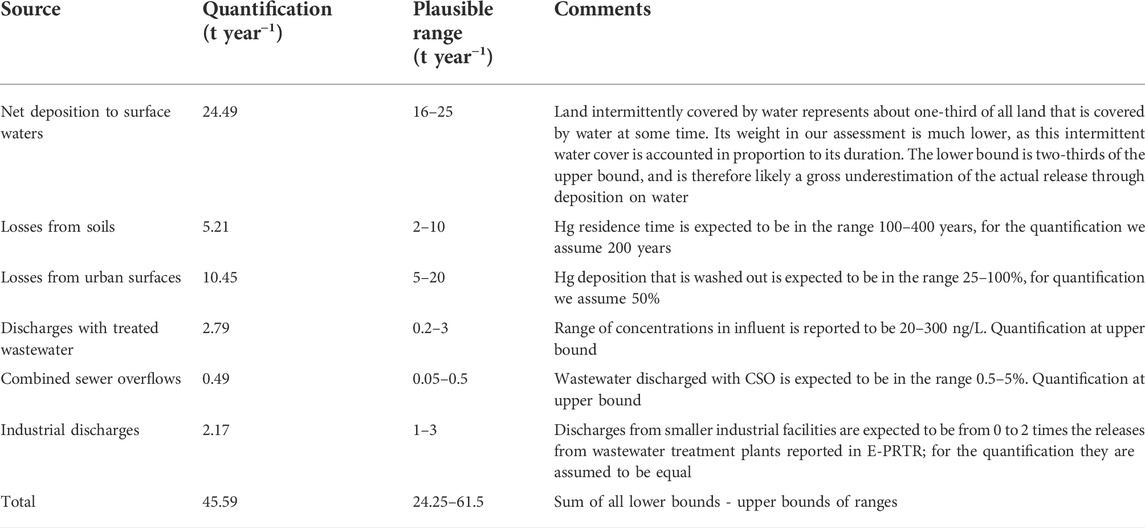
TABLE 3. Summary of the quantified Hg releases and their plausible range of uncertainty.
Deposition largely dominates the total input of Hg to topsoils (S), representing more than 1,000 t year−1 across the EU (Figure 3). Mercury applied to soils with sewage sludge is estimated to be 3.68 t year−1 or just above 0.3% of deposition. Mercury applied to soils with sludge depends in the first place on the possibility to use sludge in agriculture, which varies by country. Countries with highest absolute releases via this path are France, Spain and, at a distance, Italy, followed by Czech Republic, Poland, Portugal, Hungary and Sweden (Figure 3). In any case, releases via sludge do not exceed 1% of deposition. Fertilizers contribute less than one-third of this amount. Neither of these inputs represent a significant contribution to soil contamination (Figure 3). Total releases to water are estimated to be 45.59 t year−1 across the EU (Figure 4A). Of these, 24.49 t year−1 (53.7%) are represented by direct deposition. The second largest contribution (10.45 t year−1 or 22.9%) is urban runoff while leaching from soil is the third contribution with 5.21 t year−1 (11.4%), followed by treated effluents (6.1%, 2.79 t year−1), industrial releases (4.8%, 2.17 t year−1) and combined sewer overflows (CSO: 1.1%, 0.49 t year−1). Although closely reflecting the aggregated EU scale figures, releases vary by country depending on regional features. In countries with a relatively high urban land cover fraction (such as Germany or Italy) the contribution of urban runoff is more significant. In countries with a large cover of water (such as Finland or Sweden), on the contrary, direct deposition to water tends to dominate. Industrial releases are particularly high in Italy and, at a distance, in Spain and Poland, and provide a very high share of total releases in Slovakia (Figure 4B).
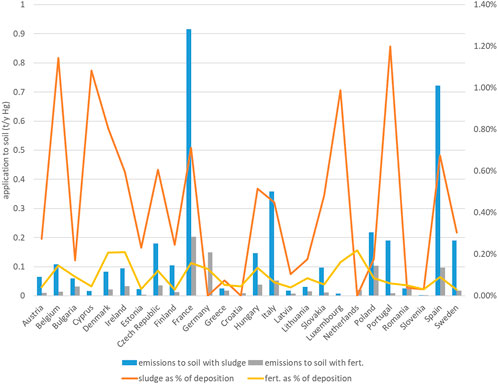
FIGURE 3. Mercury application to soil via sludge and fertilizers, and comparison with atmospheric deposition to land, by country.
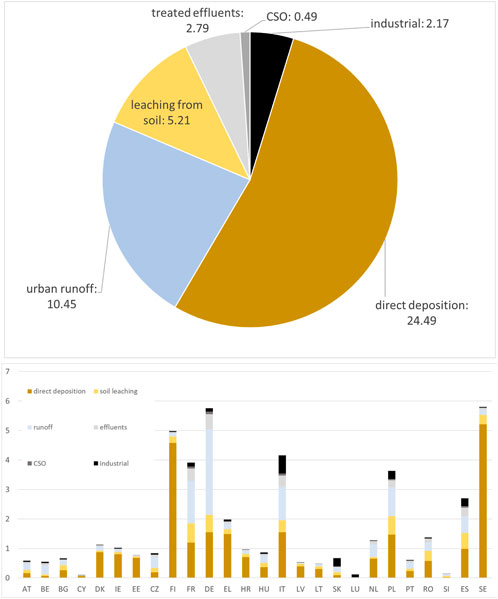
FIGURE 4. Estimated breakdown of Hg releases to water at EU scale, in tonnes per year (above) and total yearly Mercury loads to European surface waters by country, in tonnes per year (below).
Our estimation of 45.59 t year−1 across the EU is consistent with the results of Liu et al., 2021. These authors, based on an extrapolation of observations from across the world’s rivers, estimate for Europe a riverine export to coastal oceans from the whole Europe of 39.24 t year−1 (range 31.25–53.66 t year−1, depending on the model combinations considered by the authors). While the EU covers a subset of the European territory considered by Liu et al., 2021, our estimates represent inputs to the river network and neglect all attenuation of Hg, e.g. due to retention in sediments.
Model-based estimates of the total amount of Mercury released to the environment by humans always suffer from several sources of uncertainty (Kocman et al., 2017; Gworek et al., 2020). The screening level calculation presented above is based on the quantification of atmospheric deposition rates provided by the EMEP MSCE-HM model. Uncertainties associated to deposition fluxes affect all calculations and may vary with region and characteristics of the modeling system used (Kwon and Selin, 2016). In the case of MSCE-HM, the overall uncertainty on total deposition rates is in the range of 20–70% (with an average of 46%) (Travnikov and Ilyin, 2005), consistent with the review by Zhang et al., 2019, who highlight dry deposition as the main source of uncertainty. While this uncertainty is quite high in absolute terms, it does not influence the order of magnitude of the deposition flux of Hg (term D in our model equations), hence its importance relative to the other terms of the mass balance.
This study is, to our knowledge, the first to use a very high-resolution analysis of water surfaces exposed to deposition, including an account of intermittently covered surfaces. Consideration of larger water surfaces obviously yields significantly higher estimates of direct deposition to water than previous studies. For instance, the estimated atmospheric Hg deposition to water surfaces is quantified in E-PRTR using a land cover map at 100 m spatial resolution, notoriously unable to capture smaller and intermittent water surfaces (Roovaart et al., 2013). Roovaart et al. (2013) estimated Hg deposition to water surfaces for the year 2010 is 2.55 t, which is about 10% of our estimate. The latter is arguably closer to reality because of the accuracy achieved in the representation of water surfaces.
Our estimate of Hg releases due to the washout of urban surfaces is relatively high and is based on the assumption that 50% of the atmospheric deposition on these surfaces is washed out by runoff during rainfall events. The actual fraction of the total deposition conveyed by runoff depends on the percentage of rainfall on urban surfaces that is directly discharged to water bodies (the “runoff coefficient”), and on the interplay between washout during rainfall/runoff events and volatilization occurring during dry periods in between. However, we may assume that volatilization is already accounted for as we consider net deposition. Eckley and Branfireun, 2008, in a specific case, estimate an average yield of total Hg from urban washout at around 65% Hg coming with deposition, which would be fairly in line with our assumptions. We expect Hg discharges to vary significantly with the local conditions and hydrological event characteristics, hence 50% is arguably a better educated guess for a regional analysis.
A part of urban runoff is dispersed to soil, and a part is collected in combined sewers and finally reaches UWWTPs, so it could be already implicitly accounted for with the wastewater releases discussed below. In Europe, roughly 70% of the sewers are combined (Milieu, 2016). At the same time, not all the runoff collected in combined sewers reaches the UWWTP because of overflows. For the sake of a European scale screening level quantification, our 50% loss assumption may correspond to all runoff collected with separate sewers (roughly 30% of precipitation falling on urban surfaces) plus an additional 20% of precipitation on urban surfaces that, while collected in combined sewers, is discharged with overflows. A more refined assessment would entail more sophisticated hydrological modelling of urban runoff quality, which is beyond the scope of this study. However, any refinement would arguably not change the order of magnitude of the contribution of urban runoff to Hg releases.
Our estimate of the releases from soils to water is sizable but relatively small. Bravo et al., 2018, based on an observed correlation between dissolved organic matter of terrestrial origin in rivers and Hg concentration at 21 sites in Europe, argue that mobilization of Hg bound to soil organic matter may be an important source of Hg in rivers. Based on their dataset, they come to an order of magnitude of releases of 103 kg year−1 of total Hg for the whole of Europe, which is reasonably in line with our calculations. In our calculation we assume that 0.5% of the Hg deposition to soil is removed yearly (corresponding to a residence time of Hg in soil of 200 years). In our assessment, re-volatilization is already accounted for, in principle, as we consider a net deposition flux as input. Hence, the removal rate of Hg from soils depends on the rate of Hg mobilization with runoff, leaching and erosion. The fate of Hg in soil is complex (e.g. Obrist et al., 2018; Ballabio et al., 2021) and its accurate description requires more detailed models (e.g. Leterme et al., 2014; Leterme and Jacques, 2015), mostly entailing site-specific characterization of soil properties and calibration of the parameters. The residence time of Hg in soil can be estimated as the ratio of mass in soil to net deposition assuming steady state. Let us assume a soil density of 1.2 kg L−1 and a topsoil thickness of 30 cm. For a representative Hg content of 40 ug kg−1 in the topsoil (Toth et al., 2016b, in line with Ballabio et al., 2021), considering deposition fluxes between 10 and 40 g year−1 km−2 as estimated in 2017, the residence time is in the order of 400–1,600 years. This may indicate that our removal rate of deposition on soils (with a residence time of 2–8 times lower) is rather conservative. It should be stressed, however, that atmospheric deposition rates of Hg have fallen by a significant amount (see Streets et al., 2017; Obrist et al., 2018) over the recent past, so the currently observed soil concentration could be representative of much higher past deposition. A 5-fold higher deposition rate would bring residence times in the range of 80–320 years, which is consistent with our assumptions.
Roovaart et al., 2013 consider a release of Hg through wastewater effluents between 0.01 and 0.02 g per population equivalent (PE) per year. This release rate is between a half and the full value that we assume for the influents, to which we apply a 70% removal efficiency, making our estimate between approximately 15% and 30% of theirs.
A removal efficiency of about 70% is assumed also by Roovaart et al., 2013, with very small variability between primary and secondary treatment levels, suggesting that the discrepancy owes primarily to the release per PE that we assume for the wastewater treatment plant influents. However, our assumption is already in the upper end of the values found in more recent literature. For the case of Frankfurt am Main, Germany, Fricke et al., 2015, measured concentrations in wastewater effluents in the range of 0.58–3.63 ng L−1 and estimated the total Hg concentration in wastewater (taking into account the fraction eventually retained in the sludge) of 243 ng L−1 Suess et al., 2020, measured concentrations in inflows of 28 Swiss WWTPs in a range of 9–750 ng L−1, with a median concentration of 57 ng L−1 and an average of 110 ng L−1. They estimate an average contribution of 15.7 mg year−1per capita in raw wastewater. Our assumption of 300 ng L−1 and contribution of 21.9 mg year−1per capita seems therefore quite representative.
In our calculation, we have assumed that industrial releases reported in the E-PRTR database are representative of all industrial releases of Hg in the EU. In fact, releases from large UWWTPs included in the database, amount to 929 kg year−1 or slightly below 50% of total industrial releases. In our assessment, this amount is assumed to be representative of all industrial releases that are not accounted for in E-PRTR. A more specific analysis would be required in order to quantify these additional industrial releases, in which case we could derive the releases from large UWWTPs from our estimate of releases with wastewater (2.17 t year−1). However, this analysis would be complex and is expected to reduce the uncertainty of our estimates only by little, due to the rather small shares of Hg budget involved.
A relatively small, but sizable contribution is represented in our analysis by releases with CSO. We assume that 5% of wastewater is released through CSO virtually untreated in the EU. This estimate may be rather conservative (Pistocchi et al., 2019a): in some parts of Europe, wastewater released with CSO could be even 5 to 10 times less than this.
We have proposed a first quantification of the different routes of Hg pollution to water in Europe. Our analysis shows that direct deposition onto water surfaces is the main contributor. The next two largest contributors are losses from urban surfaces and losses from soil. We estimate that direct deposition is more than twice as large as losses from urban surfaces, in turn about twice as large as losses from soil. Direct deposition on water is also the least uncertain among our estimates. Still, it should be stressed that the fate of Hg deposition on intermittent water surfaces, accounted for in this exercise through a simple linear assumption, was not considered in previous assessments and needs to be better understood. In order to appreciate the impact of the novel assumption made here, intermittently water-covered land is about one-third of the total water-covered land in Europe. In our calculation, the contribution of deposition on intermittent water surfaces is weighted by the duration of flooding, making it significantly smaller than one-third of the total. However, we conservatively consider the uncertainty on direct deposition to water to be about 30%.
The uncertainty on urban losses and soil losses is substantially higher. While impervious urban areas are just a few percent of land area, they are assumed to contribute 100 times more than unsealed soil (50% of the net deposition vs 0.5%), making the two types of losses comparable in magnitude. We may expect these losses to change within the same order of magnitude. Therefore, they may be regarded as having about the same importance.
The releases of Hg through wastewater flows are affected by uncertainty due to 1) the accuracy of the reporting of industrial releases and 2) the variability of Hg concentrations in wastewater. The practical assumptions made in this exercise on industrial releases do not have an empirical ground and should be refined as soon as new evidence is available. In any case, any refinement is not expected to change the overall balance substantially, due to the relatively small contribution from these sources.
Urban wastewater was evaluated to be a larger contributor of Hg releases to water in a previous analysis (Roovaart et al., 2013). However, the loads with the effluents assumed in their study correspond to the loads that we assume for the influents, with a concentration of 300 ng L−1 and a discharge per population equivalent of 200 L day−1. On the other hand, a more recent review of available European data indicates for effluents a concentration below 100 ng L−1 and typically about 20 ng L−1 (Gardner et al., 2013). For a 70% removal of Hg with sewage sludge (as in Roovaart et al., 2013), the influent concentration would be typically about 60 ng L−1 and usually less than 300 ng L−1, confirming that our assumed concentration is at the upper end of the expected range. The uncertainties discussed above largely dominate the uncertainty introduced by the poor quantification available for the contribution of CSO.
In Table 3, we provide an indicative plausible range for each of the estimated components of the total Hg release to freshwater in Europe, drawing on the arguments discussed above. It should be stressed that the range does not stem from a formal uncertainty analysis, but reflects the expert judgment just outlined. When looking at the overall input of Hg to European freshwaters, our estimate of 45.6 t year−1 can be regarded as uncertain within no more than ±50% (see Table 3). It should be stressed, though, that this range of uncertainty is very conservative, and the likely “real” uncertainty could be considerably smaller. Table 3 provides additional comments in this regard. In the above considerations, we do not include the uncertainty in the modelled atmospheric deposition that we assume as input. However, that affects all the main releases to water (direct deposition, urban runoff, and losses from soils) to the same extent and therefore does not substantially change the overall mass balance.
Our estimation of the total release of Hg is reasonably in line with the total load discharged with freshwaters to the European seas as estimated by Pistocchi et al., 2019b, on the basis of a back-calculation of releases from observed concentrations in rivers. The discrepancy with a much lower previous quantification presented in the E-PRTR (Roovaart et al., 2013) can be explained by the more accurate assessment of direct deposition as well as losses from urban surfaces and soils, that were not included before.
Our quantification of Hg emissions to water from industrial sources is much lower than the 33.9 tonnes per year of Hg estimated by Global Mercury Assessment of 2018 (AMAP/UNEP, 2019). The latter, however, ignores any water pollution abatement process at industrial installations, admittedly leading to an overestimation that is not realistic for European conditions (see AMAP/UNEP, 2019, ch. 6, p. 8). In particular, more than a half of the emissions estimated in AMAP/UNEP, 2019 is attributed to non-ferrous metal production processes, which is an order of magnitude (or more) above the reports of the E-PRTR.
Our calculation is deliberately simple and aimed at capturing the order of magnitude of Hg releases to freshwater in Europe. However, we come to an estimate that appears affected by limited uncertainty, and as such suitable for decision support. We clarify that industrial and domestic wastewater represent together no more than 10% of the current releases, and additional control of these sources can only yield limited benefits. Compared to the latter, the cost of additional dedicated treatment may be high (Mazyck et al., 2009). Most importantly, once Hg is removed from the wastewater it may return to the environment through volatilization, leaching and erosion (e.g. from sludge undergoing incineration or land application) unless immobilized through crystallization. Measures to control Hg emissions to water at the source, such as the restriction of Hg use in dental amalgam (European Commission, 2020), may have the combined effect of reducing industrial releases (including atmospheric releases) and concentration of Hg in wastewater. As such, these measures seem a preferable option in comparison to down-the-drain solutions, still obviously needed for known local sources of pollution such as contaminated sites.
Avoiding direct discharge of urban runoff to water bodies, e.g. by promoting infiltration in soils, helps reduce releases to the aquatic environment by a sizable extent: if only 0.5% of deposition on soils reaches water bodies compared to about 50% of deposition on urban surfaces, as we assume here, replacing direct discharge to water with discharge on soil corresponds to a 99% removal efficiency. At the same time, the extent of European urban surfaces is only a few percent of the extent of unsealed soils (Lavalle et al., 2015), hence the additional pollution potentially impinging on soils as a consequence of reducing runoff discharges would not be significant compared to atmospheric deposition. A clear advantage of runoff control measures, such as urban greening, is in their multiple benefits (e.g. in terms of adaptation to climate change and flood risk mitigation) which often make these a no-regret management option for Hg as well as other forms of pollution (Pistocchi, 2017). Moreover, runoff control contributes to reducing releases with CSO, although these are already marginal.
On the other hand, atmospheric deposition is the key driver of freshwater pollution by Hg in Europe (in this confirming EEA, 2018b), with direct deposition representing more than a half of European releases to freshwaters. Reducing Hg pollution will hence require control of atmospheric releases. In Europe, about 50% of the total deposition originates from releases within the EU (particularly from thermal power stations and cement production), the rest coming from long range transport (De Simone et al., 2017; AMAP/UNEP, 2019). Considering this large share of atmospheric deposition in Europe originating from other regions of the world, the international management of long-range atmospheric Hg pollution remains key also for Hg pollution reduction in European freshwaters.
The raw data supporting the conclusions of this article will be made available by the authors, without undue reservation.
AP: Conceptualization, Methodology, Formal analysis, Investigation, Writing—Original Draft, Writing—Review and Editing; all co-authors: Investigation, Writing—Review and Editing. All authors listed have made a substantial, direct, and intellectual contribution to the work and approved it for publication.
SC and NP would like to acknowledge the contribution received from EU-H2020 project E-Shape (Grant Agreement: 820852).
The authors declare that the research was conducted in the absence of any commercial or financial relationships that could be construed as a potential conflict of interest.
All claims expressed in this article are solely those of the authors and do not necessarily represent those of their affiliated organizations, or those of the publisher, the editors and the reviewers. Any product that may be evaluated in this article, or claim that may be made by its manufacturer, is not guaranteed or endorsed by the publisher.
AMAP/UNEP (2019). Technical background report for the global Mercury assessment 2018. Arctic monitoring and assessment programme, oslo. Geneva, Switzerland: Norway/UN Environment Programme, Chemicals and Health Branch. viii + 426 pp including E-Annexes.
Ballabio, C., Martin, J., Osterwalder, S., Borrelli, P., Montanarella, L., and Panagos, P. (2021). A spatial assessment of Mercury content in the European Union topsoil. Sci. Total Environ. 769, 144755. doi:10.1016/j.scitotenv.2020.144755
BIO Intelligence Service (2012). Study on the potential for reducing Mercury pollution from dental amalgam and batteries. Final report prepared for the European Commission – DG ENV Available at: https://op.europa.eu/en/publication-detail/-/publication/ba2b1317-a995-462d-950f-faab159561a6.
Bravo, A. G., Kothawala, D. N., Attermeyer, K., Tessier, E., Pascal, B., José, L., et al. (2018). The interplay between total Mercury, methylMercury and dissolved organic matter in fluvial systems: A latitudinal study across Europe. Water Res. 144, 172–182. doi:10.1016/j.watres.2018.06.064
Carbonell, G., Imperial, R. M. d., Torrijos, M., Delgado, M., and Rodriguez, J. A. (2011). Effects of municipal solid waste compost and mineral fertilizer amendments on soil properties and heavy metals distribution in maize plants (Zea mays L.). Chemosphere 85, 1614–1623. doi:10.1016/j.chemosphere.2011.08.025
Concorde East/West (2004). Mercury flows in Europe and the world: The impact of decommissioned chlor-alkali plants. Available at: https://ec.europa.eu/environment/chemicals/mercury/pdf/Final%20Report_KH0617141ENN.pdf.
De Simone, F., Hedgecock, I. M., Carbone, F., Cinnirella, S., Sprovieri, F., and Pirrone, N. (2017). Estimating uncertainty in global Mercury emission source and deposition receptor relationships. Atmosphere 8 (12), 236. doi:10.3390/atmos8120236
Deloitte, Ineris, and Wood (2020). Assessment of the feasibility of phasing-out dental amalgam: Final report. (under Framework Contract No. ENV.C.4/FRA/2015/0042 – Service request 15) Available at: https://circabc.europa.eu/ui/group/19e66753-84ca-4e4e-a4a1-73befb368fc2/library/d862c135-5602-4f21-9abf-4bb26fc024b2?p=1&n=10&sort=modified_DESC.
Eckley, C. S., and Branfireun, B. (2008). Mercury mobilization in urban stormwater runoff. Sci. Total Environ. 403, 164–177. doi:10.1016/j.scitotenv.2008.05.021
EEA (2018a). Mercury in Europe’s environment. EEA Report No 11/2018. Available at: https://www.eea.europa.eu/publications/mercury-in-europe-s-environment.
EEA (2018b). Chemicals in European waters. Knowledge developments. EEA Report No 18/2018. Available at: https://www.eea.europa.eu/publications/chemicals-in-european-waters.
European Commission (2020). Report from the Commission to the European Parliament and the Council on the reviews required under Article 19 (1) of Regulation 2017/852 on the use of Mercury in dental amalgam and products. COM/2020/378 final Available at: https://eur-lex.europa.eu/legal-content/EN/TXT/?uri=CELEX:52020DC0378.
Fricke, I., Götz, R., Schleyer, R., and Püttmann, W. (2015). Analysis of sources and sinks of Mercury in the urban water cycle of Frankfurt am main, Germany. Water 7 (11), 6097–6116. doi:10.3390/w7116097
Gambuś, F., and Wieczorek, J. (2012). Pollution of fertilizers with heavy metals. Ecol. Chem. Eng. A 19 (4-5), 353–360. doi:10.2428/ecea.2012.19(04)036
Gardner, M., Jones, V., Comber, S., Scrimshaw, M. D., Coello-Garcia, T., Cartmell, E., et al. (2013). Performance of UK wastewater treatment works with respect to trace contaminants. Sci. Total Environ. 456–457, 359–369. doi:10.1016/j.scitotenv.2013.03.088
Gray, J. (2004). Leaching, transport, and methylation of Mercury in and around abandoned Mercury mines in the humboldt river basin and surrounding areas, Nevada. U.S. Geological Survey Bulletin 2210-C, 21. Available at: https://pubs.usgs.gov/bul/b2210-c/b2210-c-508.pdf.
Gworek, B., Dmuchowski, W., and Baczewska-Dąbrowska, A. H. (2020). Mercury in the terrestrial environment: A review. Environ. Sci. Eur. 32, 128. doi:10.1186/s12302-020-00401-x
Hsu-Kim, H., Eckley, C. S., Achá, D., Feng, X., Gilmour, C. C., Jonsson, S., et al. (2018). Challenges and opportunities for managing aquatic Mercury pollution in altered landscapes. Ambio 47, 141–169. doi:10.1007/s13280-017-1006-7
Jeong, J., Yang, J., Han, S., Seo, Y, -S., and Hong, Y. (2020). Assessment of coupled hydrologic and biogeochemical Hg cycles in a temperate forestry watershed using SWAT-Hg. Environ. Model. Softw. 126, 104644. doi:10.1016/j.envsoft.2020.104644
Kocman, D., Wilson, S. J., Amos, H. M., Telmer, K. H., Steenhuisen, F., Sunderland, E. M., et al. (2017). Toward an assessment of the global inventory of present-day Mercury releases to freshwater environments. Int. J. Environ. Res. Public Health 14, 138. doi:10.3390/ijerph14020138
Kwon, S. Y., and Selin, N. E. (2016). Uncertainties in atmospheric Mercury modeling for policy evaluation. Curr. Pollut. Rep. 2, 103–114. doi:10.1007/s40726-016-0030-8
Lassen, C., Maag, J., Warming, M., Sørensen, M. M., Andersen, L., Chan, Y., et al. (2017). Support to assessing the impacts of certain amendments to the proposal of the commission for a regulation on Mercury. Final Report, 18 July 2017. Available at: https://ec.europa.eu/environment/chemicals/mercury/pdf/Final%20Report_KH0617141ENN.pdf.
Lavalle, C., Kompil, M., and Barbosa, A. (2015). UI - artificial areas per inhabitant (LUISA platform REF2014). European Commission, Joint Research Centre. [Dataset] PID: http://data.europa.eu/89h/jrc-luisa-ui-art-areas-per-inh-ref-2014.
Leterme, B., Blanc, P., and Jacques, D. (2014). A reactive transport model for Mercury fate in soil—Application to different anthropogenic pollution sources. Environ. Sci. Pollut. Res. 21, 12279–12293. doi:10.1007/s11356-014-3135-x
Leterme, B., and Jacques, D. (2015). A reactive transport model for Mercury fate in contaminated soil—Sensitivity analysis. Environ. Sci. Pollut. Res. 22, 16830–16842. doi:10.1007/s11356-015-4876-x
Liu, M., Zhang, Q., Maavara, T., Liu, S., Wang, X., and Raymond, P. A. (2021). Rivers as the largest source of mercury to coastal oceans worldwide. Nat. Geosci. 14, 672–677. doi:10.1038/s41561-021-00793-2
Mazyck, D. W., Hagan, A. M., and Byrne, H. (2009). “Aqueous phase Mercury removal: Strategies for a secure future water supply,” in Critical national need idea white paper, submitted to national institute for standards and instrumentation, Technology innovation program (U.S. Department of Commerce). Available at: https://www.nist.gov/system/files/documents/2017/04/28/137_aqueous_phase_mercury_removal_strategies.pdf.
Milieu (2016). Assessment of impact of storm water overflows from combined waste water collecting systems on water bodies (including the marine environment) in the 28 EU Member States. European Commission Specific Contract No. 070201/2014/SFRA/693725/ENV/C.2. Available at: https://circabc.europa.eu/sd/a/c57243c9-adeb-40ce-b9db-a2066b9692a4/Final%20Report.
Obrist, D., Kirk, J. L., Zhang, L., Sunderland, E. M., Jiskra, M., and Selin, N. E. (2018). A review of global environmental mercury processes in response to human and natural perturbations: Changes of emissions, climate, and land use. Ambio 47, 116–140. doi:10.1007/s13280-017-1004-9
Pekel, J. F., Cottam, A., Gorelick, N., and Belward, A. S. (2016). High-resolution mapping of global surface water and its long-term changes. Nature 540, 418–422. doi:10.1038/nature20584
Pistocchi, A., Dorati, C., Alberto, A., Ginebreda, A., and Marcé, R. (2019b). River pollution by priority chemical substances under the water Framework directive: A provisional pan-European assessment. Sci. Total Environ. 662, 434–445. doi:10.1016/j.scitotenv.2018.12.354
Pistocchi, A., Dorati, C., Grizzetti, B., Udias Moinelo, A., Vigiak, O., and Zanni, M. (2019a). Water quality in Europe: Effects of the urban wastewater treatment directive. Luxembourg: EUR 30003 EN, Publications Office of the European Union, JRC115607. ISBN 978-92-76-11263-1 (online). doi:10.2760/303163
Pistocchi, A. (2017). “Hydrological impacts of soil sealing and urban land take,” in Urban expansion, land cover and soil ecosystem services. Editor C. Gardi (London: Routledge).
Roovaart, J. V. D., van Duijnhoven, N., Knecht, M., Theloke, J., Coenen, P., and ten Broeke, H. (2013). Diffuse water emissions in E-PRTR, Project report. Report 1205118-000-ZWS-0016, Deltares.
Sánchez-Báscones, M., Antolín-Rodríguez, J., Martín-Ramos, P., González-González, A., Bravo-Sánchez, C., and Martín-Gil, J. (2017). Evolution of Mercury content in agricultural soils due to the application of organic and mineral fertilizers. J. Soils Sediments 17 (4), 927–935. doi:10.1007/s11368-016-1622-z
Sibson, R. (1981). A brief description of natural neighbor interpolation," chapter 2 in interpolating multivariate data. New York: John Wiley & Sons, 21–36.
Streets, D. G., Horowitz, H. M., Jacob, D. J., Lu, Z., Levin, L., ter Schure, A. F. H., et al. (2017). Total Mercury released to the environment by human activities. Environ. Sci. Technol. 51 (11), 5969–5977. doi:10.1021/acs.est.7b00451
Suess, E., Berg, M., Bouchet, S., Cayo, L., Hug, S. J., Kaegi, R., et al. (2020). Mercury loads and fluxes from wastewater: A nationwide survey in Switzerland. Water Res. 175, 115708. doi:10.1016/j.watres.2020.115708
Tóth, G., Hermann, T., Da Silva, M. R., and Montanarella, L. (2016a). Heavy metals in agricultural soils of the European Union with implications for food safety. Environ. Int. 88, 299–309. doi:10.1016/j.envint.2015.12.017
Tóth, G., Hermann, T., Szatmári, G., and Pásztor, L. (2016b). Maps of heavy metals in the soils of the European Union and proposed priority areas for detailed assessment. Sci. Total Environ. 565, 1054–1062. doi:10.1016/j.scitotenv.2016.05.115
Travnikov, O., and Ilyin, I. (2005). Regional model MSCE-HM of heavy metal transboundary air pollution in Europe. EMEP/MSC-E Technical, 59. Report 6/2005. Available at: https://www.msceast.org/j-stuff/msce-hm.
UN Environment (2017b). Toolkit for identification and quantification of Mercury releases. Guideline for inventory level 1. Version 2.0. January 2017.
UN Environment (2017a). Toolkit for identification and quantification of Mercury releases. Reference report and guideline for inventory level 2. Version 1.4. January 2017.
UNEP (2013). Minamata convention on Mercury. Available at: https://www.mercuryconvention.org/Convention/Text/tabid/3426/language/en-US/Default.aspx.
Zhang, L., Zhou, P., Cao, S., and Zhao, Y. (2019). Atmospheric Mercury deposition over the land surfaces and the associated uncertainties in observations and simulations: A critical review. Atmos. Chem. Phys. 19, 15587–15608. doi:10.5194/acp-19-15587-2019
Zhao, X., and Wang, D. (2010). Mercury in some chemical fertilizers and the effect of calcium superphosphate on Mercury uptake by corn seedlings (Zea mays L.)ffect of calcium superphosphate on Mercury uptake by corn seedlings (Zea mays L.). J. Environ. Sci. 22 (8), 1184–1188. doi:10.1016/s1001-0742(09)60236-9
Keywords: Mercury, surface water, wastewater, urban runoff, impervious surface area, water surfaces, atmospheric deposition
Citation: Pistocchi A, Cinnirella S, Mouratidis P, Rosenstock N, Whalley C, Sponar M and Pirrone N (2022) Screening of Mercury pollution sources to European inland waters using high resolution earth surface data. Front. Environ. Sci. 10:1021777. doi: 10.3389/fenvs.2022.1021777
Received: 17 August 2022; Accepted: 13 October 2022;
Published: 11 November 2022.
Edited by:
Lawrence Mzukisi Madikizela, University of South Africa, South AfricaReviewed by:
Julien Lusilao, Namibia University of Science and Technology, NamibiaCopyright © 2022 Pistocchi, Cinnirella, Mouratidis, Rosenstock, Whalley, Sponar and Pirrone. This is an open-access article distributed under the terms of the Creative Commons Attribution License (CC BY). The use, distribution or reproduction in other forums is permitted, provided the original author(s) and the copyright owner(s) are credited and that the original publication in this journal is cited, in accordance with accepted academic practice. No use, distribution or reproduction is permitted which does not comply with these terms.
*Correspondence: Alberto Pistocchi, YWxiZXJ0by5waXN0b2NjaGlAZWMuZXVyb3BhLmV1
Disclaimer: All claims expressed in this article are solely those of the authors and do not necessarily represent those of their affiliated organizations, or those of the publisher, the editors and the reviewers. Any product that may be evaluated in this article or claim that may be made by its manufacturer is not guaranteed or endorsed by the publisher.
Research integrity at Frontiers
Learn more about the work of our research integrity team to safeguard the quality of each article we publish.