 Yiwen Zhou
 Jun Deng
95% of researchers rate our articles as excellent or good
Learn more about the work of our research integrity team to safeguard the quality of each article we publish.
Find out more
ORIGINAL RESEARCH article
Front. Environ. Sci. , 19 September 2022
Sec. Environmental Economics and Management
Volume 10 - 2022 | https://doi.org/10.3389/fenvs.2022.1020336
This article is part of the Research Topic Land Governance, Integrated Socio-Ecosystem and Sustainable Development View all 33 articles
To pursue higher agricultural output, farmers have invested heavily in fertilizers, pesticides and other factors of production, which inevitably causes agricultural nonpoint source pollution (ANPSP) and seriously restricted the sustainable development of global agriculture. Accurate and efficient integrated prevention and control of ANPSP requires scientific identification of critical source areas and influencing factors of nonpoint source pollution, which is particularly important in geographic conditions where steep-slope agriculture dominates and landscape features are complex. In this study, a typical small watershed in the mountainous area of the Three Gorges Reservoir area was selected, and the risk of nonpoint source phosphorus loss in the watershed was assessed using the Phosphorus Index (PI) on the basis of Soil Topographic Index (STI) prediction of runoff production area in the watershed. Finally, the critical source areas (CSAs) for its loss were identified. The results showed that the area of hydrologically sensitive areas in the watershed was approximately 22.87% of the total study area, with an area of 37.05 hm2. The hydrology of variable source areas within hydrologically sensitive areas plays a dominant role and is more likely to produce runoff and increase the risk of agricultural nonpoint source phosphorus pollution. The results of PI analysis showed that the risk of phosphorus loss was low in most areas of the watershed (45.77%), the areas at high risk of phosphorus loss accounted for 29.33% of the entire watershed with an area of 47.52 hm2, and tea plantation was the most dominant land use type. The critical source area of nonpoint source phosphorus output accounts for 5.47% of the watershed area and is mainly distributed along the watershed system, 82.55% of which is tea plantation. Compared with the traditional phosphorus index evaluation system, this method is important for the accurate identification of critical source areas of nonpoint source pollutants, for strengthening the efficient prevention, control and management of ANPSP, and for improving the utilization rate of arable land as well as land management and sustainable development of watersheds.
Studies from all over the world show that agricultural nonpoint source pollution has become a major source of water pollution and land degradation worldwide, which greatly limits the sustainability of both urban and rural areas. (Yang et al., 2013; Rissman and Carpenter, 2015; Carstensen et al., 2020). Nonpoint source pollution from farmland to surface water remains a major threat to the environment. (Mcdowell et al., 2015; Wang Z. et al., 2020). The problem of agricultural nonpoint source pollution (ANPSP) refers to fertilizers, pesticides and other pollutants, through the process of surface runoff, underground leakage, volatilization or residue, resulting in eutrophication of water bodies, soil sludge and other ecological pollution problems and food safety crises. (Beharry-Borg et al., 2013; Bowes et al., 2015; Wang R. et al., 2020). The loss of nitrogen and phosphorus from agricultural land not only deteriorates water quality, reduces the productive capacity of the land and weakens many nonproductive functions of the cultivated land ecosystem, such as recreation and biodiversity such as recreation and biodiversity of arable ecosystems, but also threatens the safety of water bodies and human health, causes huge economic losses and affects the functions of the ecosystem. (Beharry-Borg et al., 2013). More importantly, the acceleration of global freshwater eutrophication is largely driven by phosphorus. (Campbell et al., 2015; Lou et al., 2016; Rossel and Bui, 2016), and phosphorus-based nonpoint source management is a common response. Increasing attention is focused on nonpoint sources of P, with emphasis on developing strategies to prevent agricultural contributions to surface water P loading. (Chang et al., 2013; Djodjic and Villa, 2015). Therefore, it is critical to accurately identify critical source areas for nonpoint source pollutant phosphorus loss.
Studies from around the world have found that smaller critical areas within the watershed contribute to a greater share of pollutant loss. Agricultural catchment areas at the highest risk of diffuse pollution transfers are termed critical source areas (CSAs) (Doody et al., 2012). Defining critical source areas (CSAs) depends upon the accurate delineation of hydrologically sensitive areas (HSAs) at the highest risk of generating surface runoff pathway pollutant transport and delivery via hydrologically connected pathways. (M.Todd Walter et al., 2000; Xue et al., 2014; Thomas et al., 2016). To target mitigation measures and best management practices at appropriate locations and scales, HSAs and CSA nonpoint source pollution indices need to be more accurately modeled as areas within a watershed where pollutant loads are consistent with runoff area and can be used to spatially locate CSAs in the landscape (Johansson and Randall, 2003; Shen et al., 2011).
Many methods have been applied to identify critical source areas of phosphorus, such as index models (Osmond et al., 2012; Wang et al., 2015), isotope labeling methods (Li et al., 2017), process-based watershed models (Shen et al., 2015), and export coefficient methods (ECA) (Collick et al., 2015). Index models such as the phosphorus index (PI) consider factors that may have a potential impact on pollutant losses, ranking individual fields according to “sources” (e.g., soil test P, fertilizers, and application methods) and “transport” factors (e.g., soil erosion, surface runoff, proximity to streams.) The PI method has been tested and modified by numerous researchers and is effective in classifying the risk level of phosphorus loss (Heckrath et al., 2008; Ou and Wang, 2008; Anderson et al., 2015), and is therefore being widely adopted. However, these studies ignore that hydrologic connectivity processes can increase the loss of dissolved phosphorus. This is considered to be a neglect and simplification of reality, without considering the impact of micro topography on runoff generation, confluence and hydrological connectivity (Marjerison et al., 2011; Cassidy et al., 2019). At the same time, water pollution and land use change are closely related. Changes in land use and land cover are driven by human activities, and as phosphorus levels in soils increase, more phosphorus losses occur. At the same time, the increase in arable land leads to increasing fertilizer use and consequent soil erosion. (Watson et al., 2007; Lou et al., 2015).
The Three Gorges Reservoir is the largest strategic reserve of freshwater resources in China and the most important hub on the Yangtze River Economic Belt. Its special geographical position determines that it is the main link to maintain and control the ecological functions of the Yangtze River basin. The results of the comprehensive analysis of China’s water environment quality in 2016 show that the main pollution indicator of water environment quality in the Yangtze River basin has changed from ammonia nitrogen to total phosphorus, and total phosphorus pollution in the main stream of the Yangtze River has risen as the main pollutant. Total phosphorus exceeds the standard mainly due to agricultural surface source pollution, with relevant data showing that approximately 70% comes from agricultural surface source pollution. It has been pointed out that the N/P ratio of the water bodies in the main and tributaries of the Three Gorges Reservoir is as high as 40–200, and phosphorus has become a nutrient limiting factor in the water bodies in the main and tributaries of the Three Gorges Reservoir. Phosphorus (P) is a limiting nutrient in many terrestrial ecosystems. Compared with nitrogen, the behavior and fluxes of phosphorus in Three Gorges Reservoir are more sensitive to the impact on the water ecosystem of the main and tributary rivers. Focusing on the current status of phosphorus pollution and transport patterns in Three Gorges Reservoir is important for controlling eutrophication in reservoir waters and ensuring water ecological security in the reservoir and the middle and lower reaches of the Yangtze River. In order to more accurately delineate the critical source areas of agricultural nonpoint source phosphorus export in the basin, an innovative approach was adopted for our selected study area. Therefore, the main objectives of this study were: (1) to identify HSAs using high-resolution digital elevation models and soil data based on field surveys; (2) to identify and characterize the potential risk of phosphorus loss using Phosphorus Index; (3) to combine Soil Topographic Index and Phosphorus Index to identify CSAs for phosphorus loss; and (4) to determine the relationship of land use within CSAs. The results of the study will help to improve the accuracy of identifying CSAs of agricultural nonpoint source pollution, and open new horizons and bring new methods and ideas for watershed management, ecological restoration and sustainable development work of agricultural intensification in the new period.
The study was conducted in the Zhangjiachong watershed (110°57′20″E, 30°46′51″N) located in Zigui County of Hubei Province, China. The watershed is located approximately 5 km southeast of the Three Gorges Reservoir Area (TGRA), with an area of 162 hm2 (Figure 1). The climate of the watershed belongs to the subtropical monsoon. Elevations within the watershed range from 148 m to 530 m with slopes ranging from 2° to 47° and an average of 21°. The annual precipitation averages 1164 mm, of which 70% occurs between May and September. The lithology of the study area exhibits granite. Following the World Reference Base for Soil Resources (WRB, 2014), the soils refer to Entisols, Inceptisols and Alfisols. The dominant land use types are tea garden, cropland and forest land. The main agricultural crops are rape (Brassica napus L.), corn (Zea mays L.) and wheat (Triticum aestivum L.). The natural resources, land use patterns and population density of the Zhangjiachong watershed are the typical areas of the surrounding areas. Although the results of this study are from a small watershed in the Three Gorges Reservoir area, they could indicate the possible trends in the Three Gorges Reservoir area. The small watershed in this study area is equivalent to a microcosm of the ecological industry development in the Three Gorges Reservoir area, and the large area of tea plantation has brought considerable economic benefits to the residents. At the same time, the development of the watershed also faced some problems in terms of soil and water conservation and surface source pollution.
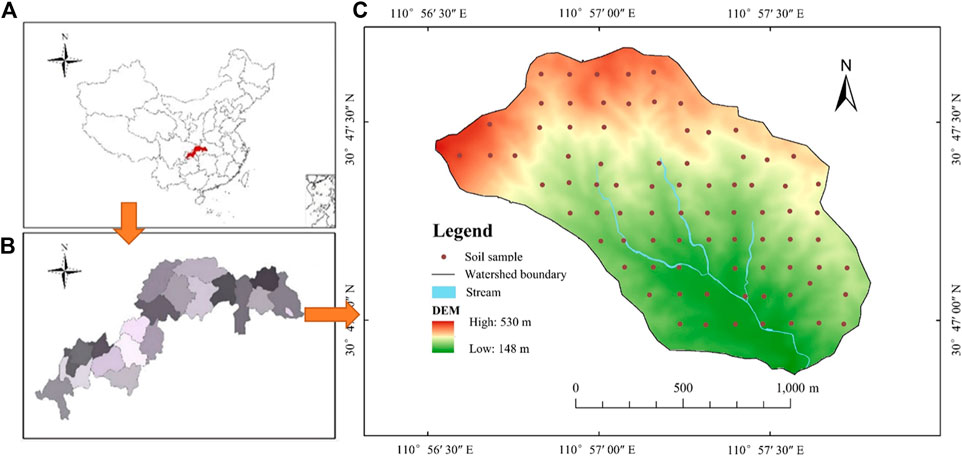
FIGURE 1. The location of the study sites (A): Three Gorges Reservoir Area in China; (B) Zhangjiachong Watershed in the Three Gorges Reservoir Area) and (C) the digital elevation model (DEM), drainage system of Zhangjiachong Watershed, China. The red dot represents the sampling points.
The 81 representative soil sites were selected according to statistical sampling designs, which adequately enabled the mapping of soil properties by digital soil map techniques. These 81 soil sites consisted of the main land uses including the cropland (21, 26%), tea garden (31, 38%), forest land (24,30%), and grassland (5, 6%). Due to the steep topography and dangerous road conditions, these 81 profiles represent the best coverage of the spatial variability of vegetation in the study area given the physical and resource constraints.
At each selected site, three undisturbed soil cores (5 cm in diameter and 5 cm in height) were sampled in each soil horizon with a thin silicone grease layer applied on the internal wall of the core to avoid the wall-effect. The samples were carefully sealed and then taken to the laboratory to determine the saturated hydraulic conductivity (Ks) and soil bulk density. In addition, disturbed soil samples were collected from different soil horizons to determine the organic carbon content, particle size distribution, and total phosphorus content. The geographical characteristics of each site including longitude and the latitude, soil depth, land use and slope were recorded.
The digital elevation model (DEM) of the Zhangjiachong small watershed used in this study was transformed from the 1:10,000 Digital Linear Map (DLG) of the study area. The DLG data came from the Basic Geographic Information Center of Hubei Province. After extracting contours, elevation points, closed static waters and other pretreatments, DLG data were supplemented with important feature points. After checking the edges, the second complementary points were made in ArcGIS. Based on the Irregular Triangulation network, the DEM data of the watershed was generated with a spatial resolution of 5 m (Table 1).
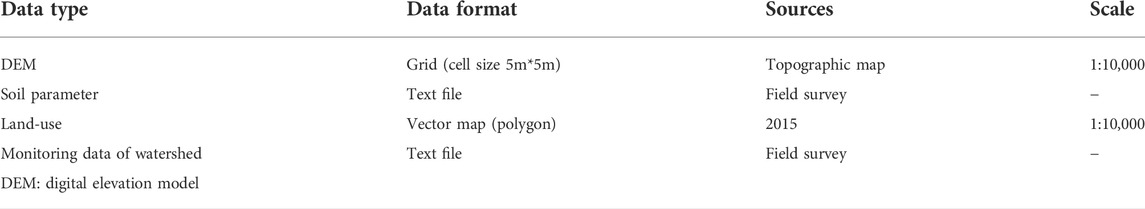
TABLE 1. Data format and sources for the study watershed.
To obtain the land use map of the study area, this study selected the 2015 Gaofen-2 (GF-2) digital product from Geospatial Data Cloud (http://www.gscloud.cn/). It uses the GCS WGS 84 coordinate system and has a spatial resolution of 2 m. Referring to the standard of China’s land use classification system, combined with the characteristics of the land landscape of the Zhangjiachong small watershed, and using a combination of unsupervised classification, supervised classification and visual interpretation, the land use types are finally divided into: tea garden, crop land, forest land, grass land, water area, road and housing estate. (Figure 2A)
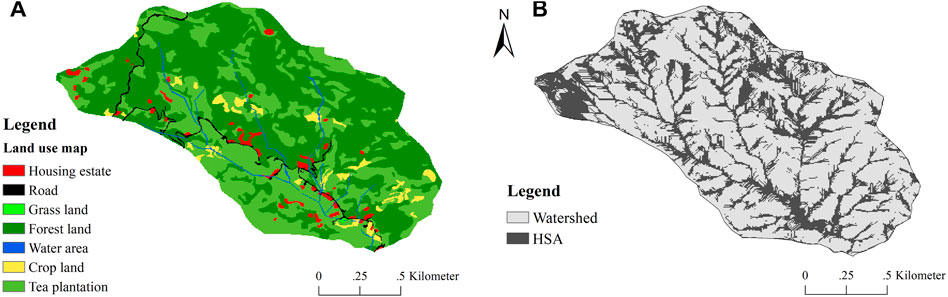
FIGURE 2. Land use types (A) and hydrologically sensitive areas (B) for the Zhangjiachong watershed created using digital elevation model (DEM) and soil data.
The Phosphorus index (PI) is a method that evaluates the risk of phosphorus loss in different areas of the watershed, based on the analysis of the natural environment, and social and economic data, and it comprehensively considers the main factors affecting agricultural non-point source phosphorus pollution. On the basis of the action mechanism of each influencing factor on the loss of phosphorus loss, the factors can be divided into source factors and transport factors. According to the contribution of each influencing factor to the loss of phosphorus element, the corresponding weight is given, and each factor is divided into several grades with the corresponding grade score. The potential risk index (PI) of phosphorus loss is calculated according to certain calculation rules:
where SFi is the corresponding rank score of the source factor evaluation index i; Wsi is the corresponding weights of the source factor evaluation index i; TFj is the corresponding rank score of the transport factor evaluation index j; Wij is the corresponding weights of the transport factor evaluation index j.
In this study, soil phosphorus content, phosphorus fertilizer application amount and time were selected as source factors. Soil erosion and overland flow distance were selected as transport factors. With the aid of GIS, based on 1:50,000 topographic maps, the research area is rasterized by 5 m *5 m grid, and other thematic maps are unified into the same geographic coordinate system. The attribute characteristics of each influencing factor were obtained by GIS. On this basis, the risk index of phosphorus loss was used to quantitatively evaluate the risk of phosphorus loss in the watershed.
Source factors include soil total phosphorus content, phosphate fertilizer application amount in watershed and phosphate fertilizer application time. All these data were based on a field survey in Zhangjiachong watershed during August 2018.
1) Soil erosion factor
Erosion caused by rainfall and runoff is calculated using the universal Soil Loss Equation (USLE), an empirical model based on Wischmeier (Wischmeier and Smith, 1965; Wischmeier and Smith, 1978). It can predict the average annual rate of soil erosion for a site, including any number of scenarios involving cropping systems, management techniques, and erosion control practices:
where A is the computed soil loss per unit area (t/hm2·a), R is the rainfall and runoff factor (MJ mm/(hm2·ha)), K is the soil erodibility factor (thm2·h/(hm2·MJmm)), LS is the topographic factor, C is the cover and management factor, and P is the support practice factor. Detailed information regarding the model can be obtained from the handbook (Foster et al., 2003). After the coordinate system of R, K, LS, C and p value, the distribution map of the soil erosion risk in Zhangjiachong watershed was calculated by using the grid calculator in ArcGIS and according to formula (1).
The rainfall erosivity model is applied to the watershed where the study area is located. Using the measured rainfall data of Zhangjiachong watershed from 2004 to 2016, the calculation method is applied to the calculation of rainfall erosivity. Then, the correlation regression analysis between the calculated value of the formula and the actual measured value is carried out by the relevant statistical software, and the rainfall erosivity value of the watershed is calculated by the calculation formula of rainfall erosivity in the study area.
The K value is computed as follows (Williams et al., 1983):
where Sd is the sand content (%), Si is the silt content (%), Cl is the clay content (%), and OC is organic carbon content (%). The soil particle size date were obtained from the field survey.
The LS values were calculated by the following equation:
where λ is the length of slope (m), θ is the inclination angle (°), and S is the percentage of slope. The current recommended values for index m are as follows:
The C value and p value adopted in this study were based on a literature review and determined on the basis of many studies on the range of values, combined with land use patterns and local farming systems. Referring to the research of Shi et al. (2009), the C value was determined to be 0.25 for crop land, 0.003 for forest land, 0.02 for garden land and 1 for bare land. The p value is determined as crop land 0.5, forest land 1, garden land 0.7 and water area 0.
2) Distance factor
Farmland ditches and rivers are the main transport channels for phosphorus nutrients to enter the water body. The distance between potential pollution sources and receiving water bodies is an important factor affecting phosphorus transport. The farther away the receiving water is, the more likely it is to be diluted and intercepted during transport, and the lower the risk of potential forest loss. The hydrological analysis tool in ArcGIS was used to generate DEM data and network data, and then run the Euclidean Distance tool was run to use the river network as input data to obtain the distance factor.
Soil Topographic Index (STI) calculation based on DEM and soil data in Zhangjiachong watershed. Topographic index (TI) can accurately depict the control of soil moisture saturation by topographic features (Beven and Kirkby, 1979), and it has been widely used to study the spatial heterogeneity of hydrological processes in river basins. The Soil topographic index (STI) is based on the existing TI, introducing soil factors and taking into account soil storage capacity, so as to better evaluate hydrological sensitivity of watershed landscapes. When variable source hydrology is the dominant hydrological process in the watershed, STI approximately reflects the propensity of runoff generation at a certain point in the watershed (M.Todd Walter et al., 2000). The STI is derived from the following equation, which accounts for soil properties in addition to topography (Qiu, 2009; Qiu et al., 2017):
where α is the upslope area per unit contour length in m, β is the local slope surface angle in decimal, Ks is saturated hydraulic conductivity (m/day), and D is the depth to the restrictive layer in m (Walter et al., 2002).
In our study area, because of the different degrees of soil development, there are several soil layers with different Ks values above a restrictive layer or bedrock. In this case, the formula for calculating Ks is:
where D is the total depth of the soil above the restrictive layer (cm); Di is the depth of the ith layer, and Ki is the saturated hydraulic conductivity (m/day) of the ith layer.
In Eq. 5, ln (α/tan(β)) is known as the wetness index and ln (KsD) represents soil transmissivity. The wetness index at the study sites was based on the 5-m resolution light detection and ranging (LiDAR) digital elevation model (DEM) using the SAGA GIS package in R (Team, 2012). Deriving the wetness index involves different processes, such as LiDAR DEM filling, slope calculations, and catchment area calculations. The soil transmissivity layer was derived using the soil data collected from the field survey. The soil saturated hydraulic conductivity used to calculate soil transmissivity was the geometric mean of the saturated hydraulic conductivities related to multiple soil layers above the restrictive layer. Soil transmissivity was multiplied by 0.000864 to convert the units of measurement for soil transmissivity to m2/day. Finally, the soil transmissivity layer was added to the wetness index to create STI for the study site. HSA was the subset of grids that had high STI values in the watershed landscape (Qiu, 2009; Qiu et al., 2014).
Previous studies have used different methods to delineate hydrological sensitive areas, including the method of average saturation probability, the method of focusing 20% of the watershed area with a high STI value, and the method of delineating hydrological sensitive areas by setting the TI threshold or STI threshold. This study drawed on the research of Qiu et al., (Qiu, 2009; Qiu et al., 2014; Giri et al., 2016; Giri et al., 2017), that is to set the threshold level of the STI, and classify the areas where STI is above the threshold level as HSAs. Based on the results of HSAs delineated by different thresholds of STI, the spatial variations in HSAs delineated by the thresholds were 8.5. On the occasion, the HSAs account for approximately 22.87% of the total area of the watershed.
The soil thickness for the Zhangjiachong watershed exhibited strong spatial variability, varying from 4 to 105 cm. In the whole watershed, the area of soil depth between 15 and 45 cm accounted for 70.6%. The saturated hydraulic conductivity of the watershed varied from 0.0025 to 0.0384 cm/s. The soil transmissivity for the watershed varied from 0.0001 m2/d to 0.0084 m2/d, which indicated that water infiltration was sufficient to reduce the probability of runoff.
The delineated HSAs have STI values ranging from 3.75 to 17.95, showed that the location of HSAs in the areas where runoff is the most prone to occur in the watershed. As be shown in Figure 2, the higher STI (darker shading) indicated a higher probability of runoff generation. In the course of a rainfall event, runoff would first appear in areas with higher STI values. HSAs were located near streams in the upland areas of the watershed. The total area of HSAs was 35.77 hm2, which was approximately 22.87% of the watershed. In the HSAs of area 35.77 hm2, 3.53 hm2 was crop lands, 15.60 hm2 was tea plantation, 12.76 hm2 was forest land, and 2.50 hm2 was urban land. The tea plantation was the main land use type in HSAs (Table 2). The delineated HSAs have STI values ranging from 3.75 to 17.95, showed that the location of HSAs in the areas where the runoff are most prone to produce in the watershed. A higher STI (darker shading) indicated a higher probability of runoff generation. During a rainfall event, runoff would first appears in areas with higher STI values.
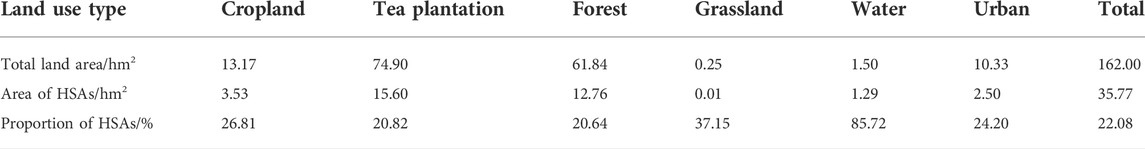
TABLE 2. Distribution of different land use types in hydrological sensitive areas.
The pollution producing areas of phosphorus in the watershed were based on the Phosphorus Index. The spatial distribution of each evaluation factor was shown in Figure 3. According to the universal Soil Loss Equation, the soil erosion factor map was generated by using the results of the grid calculator. The map reflected the soil erosion of the whole small watershed. The average annual soil erosion in Zhangjiachong watershed was 1620 t/(km2·a). The largest area of soil erosion was mainly distributed in the slight erosion area (52.47%). Mild erosion and slight erosion accounted for 40.21% of the total erosion area, while intensive erosion, extreme erosion and severe erosion accounted for a small proportion. The areas with serious soil erosion (A > 5,000 t/(km2·a)) were mainly distributed on both sides of the river course and steep areas in the north of the watershed.
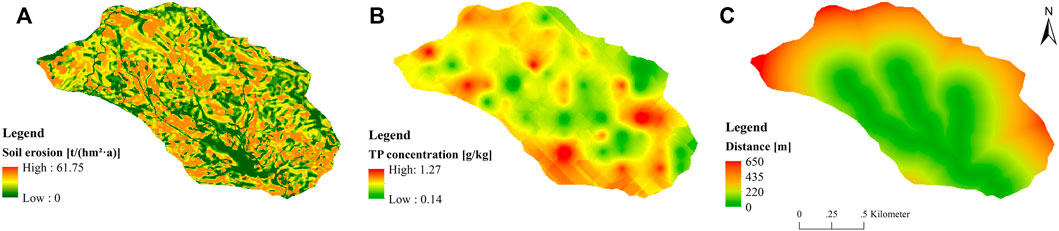
FIGURE 3. The spatial distribution of the phosphorus loss factors (A). Soil erosion. (B). Soil phosphorus content. (C). Distance in the watershed.
Based on the measured soil total phosphorus data, ArcGIS spatial interpolation was used to generate the total phosphorus distribution map. As Figures 3B shows, the total phosphorus content in most areas of Zhangjiachong small watershed was at the middle level. The area with 0–5 mg/kg soil total phosphorus content accounted for 9.53% of the watershed area, the area with 5–10 mg/kg soil total phosphorus content accounted for 89.68% of the watershed area, and the area with 10 mg/kg soil total phosphorus content accounted for 0.79% of the watershed area. The high value areas were mainly distributed in tea gardens in the west and middle of the watershed.
Based on the water system map, the distance factor map was obtained by using the distance mapping function of ArcGIS. As shown in Figure 3C, 44.23% of the watershed was at the risk level of high phosphorus loss from 0 to 150 m away from the water body. On the whole, a large number of tea gardens were planted in the southeastern part of the watershed and fertilized at the same time, which was close to the water body and had a higher risk of phosphorus loss.
The risk degree of the phosphorus index was classified by the natural fracture method in ArcGIS. The results showed that it is divided into three grades, which could better distinguish the risk level of phosphorus loss in the study area. According to the measured values of each factor, it was divided into three grades, low, medium, and high. Each grade corresponded to a grade score, ≤2.29, 2.29–3.05, ≥3.84 (Table.3). The corresponding weight values of each factor were given. Table 3 showed the details.
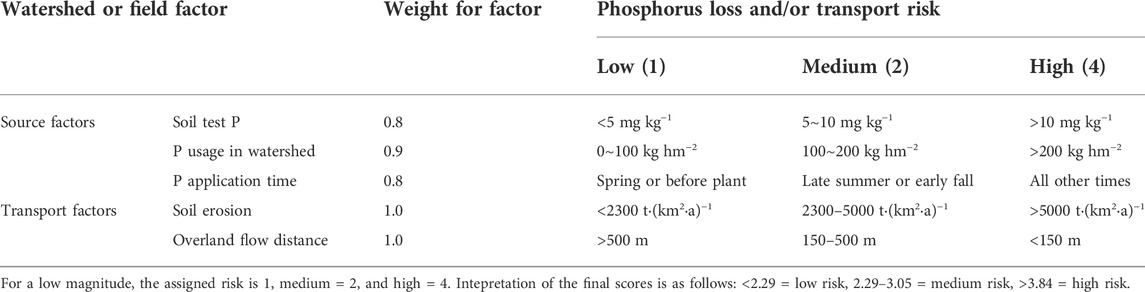
TABLE 3. Risk assessment factors of the phosphorus export in the study watershed.
According to the established risk evaluation index system of phosphorus loss, the risk grade map of agricultural non-point source phosphorus loss in Zhangjiachong small watershed was calculated (Figure 4). As can be seen from the map, most areas in the study area showed “medium” and “low” risk of phosphorus loss, of which the low risk areas accounted for 59.93% and the medium risk areas account for 19.83%. Most of the low and medium risk areas lied in the northern part of the watershed, where there were woodland with high vegetation coverage and low intensity of human activities. The areas of high-risk covered an area of 32.78 hm2, accounting for 20.24% of the watershed. The main loss risk areas are the southern and both sides of the river of the central part of the watershed where tea trees were planted on a large scale in this area.
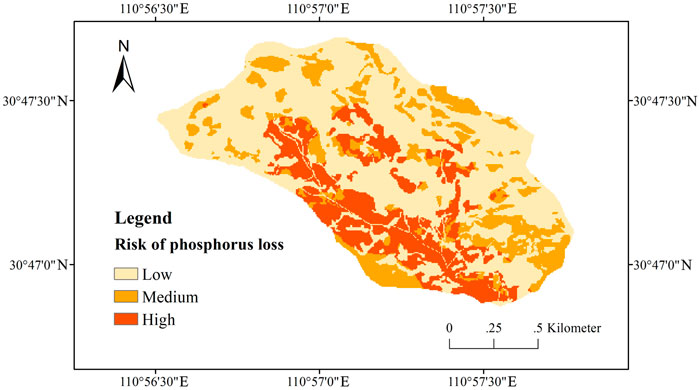
FIGURE 4. High, medium, and low potential phosphorus producing areaS in Zhangjiachong watershed.
Phosphorus CSAs were the intersection of HSAs and high potential phosphorus producing areas in the watershed. Table 4 gave the land area in CSAs by phosphorus pollutant and land use. The total area of CSAs for phosphorus was 8.86 hm2, accounting for 5.47% of the total watershed, of which 7.59 hm2 was the tea plantation, and 1.27 hm2 was the crop land. The tea plantation was the main land use type of the watershed. Figure 5 illustrated the location of CSAs for phosphorus in the Zhangjiachong Watershed.
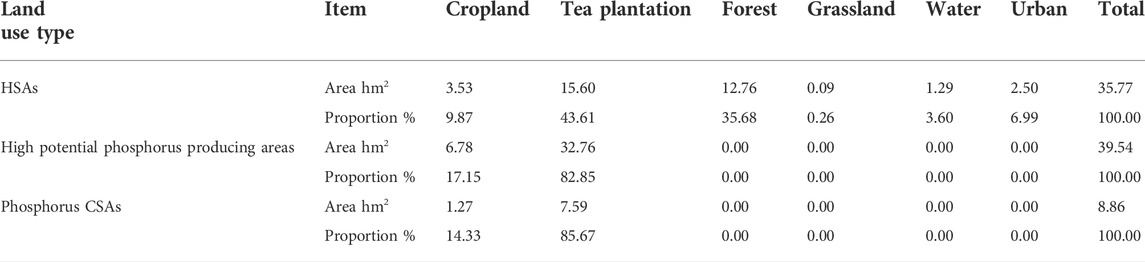
TABLE 4. Land use in hydrologically sensitive areas, high potential phosphorus producing areas, and phosphorus critical source areas, in hectares, the Zhangjiachong watershed.
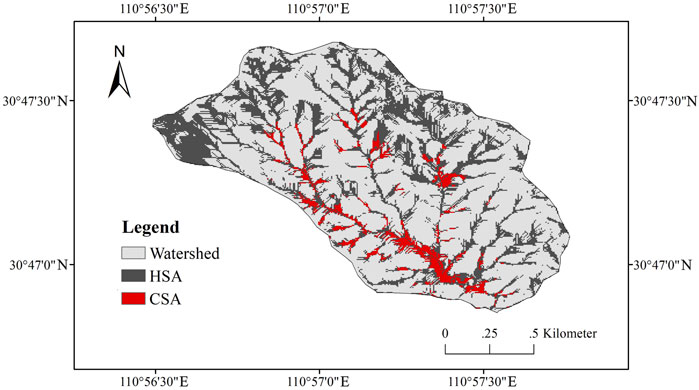
FIGURE 5. Phosphorus Critical Source Areas in Zhangjiachong watershed.
Comparing the area of different land use types in the hydrological sensitive area, high risk area of phosphorus loss and critical source area of phosphorus pollution under STI ≥8.5. As shown in Table 4, it can be concluded that in the hydrological sensitive area under STI ≥8.5, tea plantations and forest lands account for a larger proportion of the hydrological sensitive area (28.36 hm2), with the areas of 15.6 hm2 and 12.76 hm2, respectively. And the grassland area is the smallest. The total area of high-risk areas of phosphorus loss was 39.54 hm2. Tea plantations account for 82.85% of the total high-risk areas of phosphorus loss, with an area of 32.76 hm2 and an area of crop land of 6.78 hm2. Most of the critical source areas of phosphorus pollution in the study area were tea plantations with an area of 7.59 hm2, accounting for 85.67% of the total area of the CSAs.
In addition, recent research has demonstrated the importance of accurately identifying HSAs when identifying and mitigating CSAs. Watershed hydrology has been found to be an important part of CSAs of phosphorus transfers in agricultural watersheds (Shore et al., 2014; Campbell et al., 2015). In some of these studies, HSAs were a dominant CSA factor which outweighed source and land management pressures (Mellander et al., 2012; Mellander et al., 2015). This study proposes a new approach that incorporates P loss factors and runoff probability to detect CSAs at the watershed scale. This approach considers more data on generating factors for CSAs in order to obtain more precise information on their status. Actually, the approach proposed in this study provides an objective and brand new perspective to identify the areas posing the greatest risk to river water quality from agricultural nonpoint pollution and makes it possible for the most efficient of incorporating proper mitigation measures. It is also a basis for identifying critical source areas of phosphorus produce at watershed scale with garden land as the main utilization, based on the investigation and analysis of phosphorus risk factors in an agricultural catchment area of the Three Gorges Reservoir Area. The CSAs of phosphorus loss are the areas where nonpoint source phosphorus pollution needs to be controlled. The total area of CSAs for phosphorus is 39.54 hm2, accounting for 24.41% of the total watershed, of which 6.78 hm2 is the crop land, 32.76 hm2 is tea plantation. Tea plantation is the main agricultural land use type in Zhangjiachong small watershed. The residents in the watershed mainly obtain the main family income through tea picking. In the whole TGRA, similar to the Zhangjiachong small watershed, there are many watersheds with garden land as the main land use. However, in order to pursue high income, “abuse of water and fertilizer” and the abuse of pesticides are common in the garden (tea garden and citrus garden) of the TGRA. Garden land has become an important source of environmental pollution in the Three Gorges Reservoir Area. According to the ecological and Environmental Monitoring Bulletin of the Three Gorges Project of the Yangtze River published by the Ministry of Environmental Protection of the People’s Republic of China in 2017 (China, 2017), the garden area in the reservoir area accounts for 32.3% of the agricultural land area, reaching 132,186 ha. Tea plantations accounted for 3.5% of agricultural land. Therefore, it is necessary to control the output of nonpoint source pollution from the source. It is representative to select Zhangjiachong small watershed as a typical case to study how to improve the accuracy of identifying the output of phosphorus nonpoint source pollution in the Three Gorges Reservoir Area.
The CSA of phosphorus loss is an important control area of nonpoint source phosphorus pollution in the watershed. According to the characteristics of the CSAs of phosphorus loss, the control and management measures should be taken in Zhangjiachong small watershed. Firstly, for vegetable fields and tea plantations, we must start with the application mode of phosphorus fertilizer, apply phosphorus fertilizer appropriately to avoid excessive accumulation of phosphorus in soil. Especially in tea plantations, appropriate application amount and mode should be determined according to their growth and development needs, and a buried application method should be adopted as far as possible to avoid phosphorus fertilizer migration because of rainfall runoff and soil erosion. Then, for the critical source areas of phosphorus loss distributed on both sides of the river, the principle of landscape ecology can be used to optimize the allocation of land resources, or to establish new landscape elements such as green belts or buffer belts on both sides of the river bank, so as to readjust the distribution and balance of soil phosphorus and reduce the phosphorus load of nonpoint sources. Moreover, the upper and middle slopes of Zhangjiachong small watershed are steeper (Collick et al., 2015). For the critical source areas with high soil erosion in the middle and upper watersheds, which are far away from rivers and small in area, soil erosion can be controlled by adopting appropriate soil and water conservation measures.
HSAs play a significant role in the generation of surface runoff, and their utilization has great significance to the quantity management and quality of water resources. The HSAs was declined to represent the most easily runoff-producing areas in the watershed by the calculation of STI. The results showed that 22.08% of the watershed area was divided into the hydrological sensitive area with an STI threshold of 8.5. As Herron and Hairsine (Herron and Hairsine, 1998) demonstrated that attention should be given to the high STI areas of the watershed, which is about 20% of the watershed areas, the threshold in our study was set as 8.5. Similar results were also observed by Qiu et al. (Qiu et al., 2014), HSAs were defined as the areas having STI values greater than or equal to 9 to assess HSAs in three municipalities in New Jersey to evaluate alternative water resource protection strategies. Different from the above study, the Zhangjiachong watershed is a typical mountainous watershed, with an elevation of 148–530m and a slope of 2°–47°. Agricultural land was the main land use type, which accounted for over 45.78% of the whole watershed area (Figures 2A) with fewer crop land and grass land. Therefore the difference may be attributed to the influence of topographic factors and land use type in the watershed. Therefore, compared with other areas in the watershed, farming and fertilization in the hydrological sensitive areas are more likely to lead to agricultural nonpoint source phosphorus pollution and increase the risk of regional phosphorus pollution. Zhangjiachong small watershed area has been seriously eroded because of the artificial expansion of the tea plantation area. This study is an important step toward the rational planning and implementation of effective measures to control erosion and protect natural resources. It is suggested that the establishment of farmland catchment management system should be strengthened, and other measures to control erosion, such as planting trees and establishing buffers, can be taken to minimize the degree of soil erosion and reduce soil erosion in this area.
The spatial difference in nonpoint source phosphorus pollution in the watershed is the result of the interaction of several influencing factors with spatial differences. These influencing factors promote and restrict each other in the occurrence of nonpoint source phosphorus pollution. Considering both source factors and transport factors, the Phosphorus Index method was applied in Zhangjiachong watershed. The whole watershed is divided into three grades: high, medium and low, of which 20.24% are at high risk of phosphorus loss. These hotspots in the watershed would be appropriate locations for the implementation of source-control BMPs such as restrictions on nutrient application (Buchanan et al., 2013; Zhang et al., 2020) or deploying appropriate soil and water conservation measures. And Haygarth et al. (2005) promoted the control of phosphorus transport pathways to reduce overall phosphorus load to receiving water and outlined several transport management techniques. Based on PI, Lane et al. (2004, 2009) assessed the risk potential in the watershed, and designed a novel approach to consider network connectivity when assessing the potential for pollution risk, which is somewhat analogous to the TTPI. Their approach assumed that the saturated region was hydrologically connected, and therefore the risk of contamination is considered high when a topographic index indicates continuous (Kirkby, 1975). Based on this point of view, our research proposes to apply both PI and STI to small watersheds to obtain high-risk areas for pollutant output based on HSAs (Figure 6).
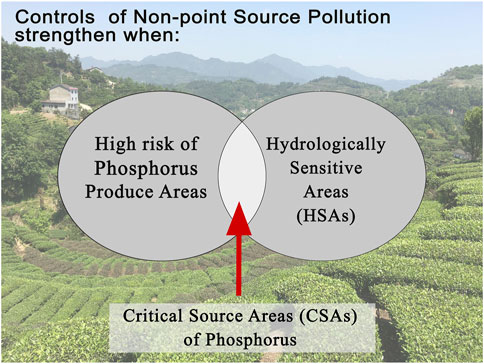
FIGURE 6. Schematic of HSAs and high risk of phosphorus producing areas.
Previous methods for identifying CSAs are based on only a single criterion (Shen et al., 2011; Zhuang et al., 2016; Moges et al., 2017; Hua et al., 2019), such as STIs or high pollution producing areas. One of the main contributions of this study is that CSA controls phosphorus pollution by integrating two standards, namely HSA measured by STI method and high-risk phosphorus producing areas measured by PI method, in the Zhangjiachong watershed of the Three Gorges Reservoir. More specifically, CSAs for phosphorus can be identified by the intersection of HSAs and the high risk of phosphorus producing areas in the watershed. The advantage of using the integrated approach to delineate CSAs in the Zhangjiachong watershed is that it can significantly reduce the target area of soil and water conservation and land governance measures implementation, which will increase the economic efficiency aimed at reducing NPS pollution. Using the innovative approach described in this study, soil and water conservation and land governance measures, are positioned in CSAs, which can effectively improve the efficiency of governance and save the funds needed for governance. By incorporating STI and PI, the phosphorus output critical source area was identified as intersection area of the HSAs and high risk of phosphorus producing area. This novel CSA identification approach can be widely used in the watersheds where funds are limited and need to be processed in the TGRA. Accurate and efficient integrated nonpoint pollution prevention and control requires precise identification of critical source areas, key processes and influencing factors. This method proposed in this paper can simply, efficiently and accurately depict the path of prone runoff production and its influence on pollutant transport, and can be well applied at both small watershed scale and regional scale. It has excellent application prospects in ecological research directions such as landscape ecology and green sustainable development, and has important application value for the integrated and efficient prevention and control of regional surface source pollution.
Identification of the critical source area of the agricultural watershed is essential for nonpoint source pollution control. However, due to the topographic characteristics of the Three Gorges Reservoir area with high mountains and steep slopes, it is still a challenge to accurately identify the areas that need to be controlled. The risk assessment of nonpoint source phosphorus loss and the identification of critical source areas in this study were conducted at the watershed scale. The combined phosphorus index (PI) and soil topographic index (STI) approach allows for quick and easy identification of critical source areas of nonpoint source phosphorus contamination. By combining PI and STI, CSAs are identified as the intersection of HAS and high-risk phosphorus-producing areas, and the majority of CSAs are located along streams where high or relatively high soil phosphorus content and phosphorus fertilization, or heavy soil erosion, can be observed Therefore, the garden, especially the tea garden, according to its growth and development needs, should determine the appropriate amount of fertilizer and fertilization methods, and try to use buried fertilization methods to avoid the migration of phosphorus fertilizer with rainfall runoff and soil erosion. Taking a typical watershed in the Three Gorges Reservoir area as an example, this study suggests the application of appropriate soil and water conservation measures or best management practices for the integrated management of small watersheds. When the innovative approach is applied to large watersheds, spatial differences in nonpoint source phosphorus pollution can be acquired from a macroscopic perspective and effective control can be implemented. The results of the study will help to strengthen the accuracy of identifying critical source areas of agricultural nonpoint source pollution, and open new perspectives and methods for land management, ecological restoration, and sustainable development efforts of agricultural intensification in the new period. Moreover, since the data required to run the method are easily accessible, it can be quickly and efficiently applied to identify critical source areas in small watersheds and large regions, and is worthy of replication in other regions.
The original contributions presented in the study are included in the article/supplementary material, further inquiries can be directed to the corresponding author.
YZ: Methodology, Formal analysis, Investigation, Writing - original draft. JD: Validation, Language editing &Visualization. ZL:Resource, Writing-review and editing, Project administration, Supervision, Funding acquisition. TW: Resource, Data curation, Validation, Funding acquisition. YD: Validation. XZ& SZ: Language editing. All authors have read and agreed to the published version of the manuscript.
Financial support for this research was provided by the National Natural Science Foundation of China [U2240222 and NO.42077065].
We are grateful to Lin Chu and Mengdan Jia for the assistance in the data arrangement and processing.
The authors declare that the research was conducted in the absence of any commercial or financial relationships that could be construed as a potential conflict of interest.
All claims expressed in this article are solely those of the authors and do not necessarily represent those of their affiliated organizations, or those of the publisher, the editors and the reviewers. Any product that may be evaluated in this article, or claim that may be made by its manufacturer, is not guaranteed or endorsed by the publisher.
Anderson, T. R., Groffman, P. M., and Walter, M. T. (2015). Using a soil topographic index to distribute denitrification fluxes across a northeastern headwater catchment. J. Hydrology 522, 123–134. doi:10.1016/j.jhydrol.2014.12.043
Beharry-Borg, N., Smart, J. C. R., Termansen, M., and Hubacek, K. (2013). Evaluating farmers' likely participation in a payment programme for water quality protection in the UK uplands. Reg. Environ. Change 13, 633–647. doi:10.1007/s10113-012-0282-9
Beven, K. J., and Kirkby, M. J. (1979). A physically based, variable contributing area model of basin hydrology/Un modèle à base physique de zone d'appel variable de l'hydrologie du bassin versant. Hydrol. Sci. Bull. 24, 43–69. doi:10.1080/02626667909491834
Bowes, M. J., Jarvie, H. P., Halliday, S. J., Skeffington, R. A., Wade, A. J., Loewenthal, M., et al. (2015). Characterising phosphorus and nitrate inputs to a rural river using high-frequency concentration–flow relationships. Sci. Total Environ. 511, 608–620. doi:10.1016/j.scitotenv.2014.12.086
Buchanan, B. P., Archibald, J. A., Easton, Z. M., Shaw, S. B., and Schneider, R. L. (2013). A phosphorus index that combines critical source areas and transport pathways using a travel time approach. J. Hydrol. -AMSTERDAM 486 (1), 123–135.
Campbell, J. M., Jordan, P., and Arnscheidt, J. (2015). Hydrology and earth system Sciences.Using high-resolution phosphorus data to investigate mitigation measures in headwater river catchments
Carstensen, M. V., Hashemi, F., Hoffmann, C. C., Zak, D., Audet, J., and Kronvang, B. (2020). Efficiency of mitigation measures targeting nutrient losses from agricultural drainage systems: A review. Ambio 49, 1820–1837. doi:10.1007/s13280-020-01345-5
Cassidy, R., Thomas, I. A., Higgins, A., Bailey, J. S., and Jordan, P. (2019). A carrying capacity framework for soil phosphorus and hydrological sensitivity from farm to catchment scales. Sci. Total Environ. 687, 277–286. doi:10.1016/j.scitotenv.2019.05.453
Chang, N. B., Xuan, Z., and Yang, Y. J. (2013). Exploring spatiotemporal patterns of phosphorus concentrations in a coastal bay with MODIS images and machine learning models. Remote Sens. Environ. 134, 100–110. doi:10.1016/j.rse.2013.03.002
China, M. O. E. P. O. T. P. S. R. O. (2017). Bulletin on ecological and environmental monitoring of the three Gorges Project of the Yangtze. River.
Collick, A. S., Fuka, D. R., Kleinman, P. J. A., Buda, A. R., Weld, J. L., White, M. J., et al. (2015). Predicting phosphorus dynamics in complex terrains using a variable source area hydrology model. Hydrol. Process. 29, 588–601. doi:10.1002/hyp.10178
Djodjic, F., and Villa, A. (2015). Distributed, high-resolution modelling of critical source areas for erosion and phosphorus losses. AMBIO 44, 241–251. doi:10.1007/s13280-014-0618-4
Foster, G. R., Yoder, D. C., Weesies, G. A., Mcgregor, K. C., and Binger, R. L. (2003). User's guide - revised universal soil loss equation (draft).
Giri, S., Qiu, Z., Prato, T., and Luo, B. (2016). An integrated approach for targeting critical source areas to control nonpoint source pollution in watersheds. Water Resour. manage. 30, 5087–5100. doi:10.1007/s11269-016-1470-z
Giri, S., Qiu, Z., and Zhang, Z. (2017). A novel technique for establishing soil topographic index thresholds in defining hydrologically sensitive areas in landscapes. J. Environ. Manage. 200, 391–399. doi:10.1016/j.jenvman.2017.04.080
Haygarth, P. M., Wood, F. L., Heathwaite, A. L., and Butler, P. J. (2005). Phosphorus dynamics observed through increasing scales in a nested headwater-to-river channel study. Sci. Total Environ. 344, 83–106. doi:10.1016/j.scitotenv.2005.02.007
Heckrath, G., Bechmann, M., Ekholm, P., Ulen, B., Djodjic, F., and Andersen, H. E. (2008). Review of indexing tools for identifying high risk areas of phosphorus loss in nordic catchments. J. Hydrol. 349 (1–2), 68–87.
Herron, N. F., and Hairsine, P. B. (1998). A scheme for evaluating the effectiveness of riparian zones in reducing overland flow to streams. Soil Res. 36, 683. doi:10.1071/s96098
Hua, L., Li, W., Zhai, L., Yen, H., Lei, Q., Liu, H., et al. (2019). An innovative approach to identifying agricultural pollution sources and loads by using nutrient export coefficients in watershed modeling. J. Hydrology 571, 322–331. doi:10.1016/j.jhydrol.2019.01.043
Johansson, R. C., and Randall, J. R. (2003). Incorporating economics into the phosphorus index: An application to U.S. Watersheds. J. Soil Water Conserv. 58 (5), 224–231.
Lane, S. N., Brookes, C. J., Kirkby, M. J., and Holden, J. (2004). A network‐index‐based version of TOPMODEL for use with high‐resolution digital topographic data. John Wiley & Sons.
Lane, S. N., Reaney, S. M., and Heathwaite, A. L. (2009). Representation of landscape hydrological connectivity using a topographically driven surface flow index. Water Resour. Res. 45, 2263–2289. doi:10.1029/2008wr007336
Li, S., Liang, Z., Liu, H., Loaiciga, H. A., Zhai, L., Zhuang, Y., et al. (2017). Evaluating the risk of phosphorus loss with a distributed watershed model featuring zero-order mobilization and first-order delivery. Sci. Total Environ. 609, 563–576. doi:10.1016/j.scitotenv.2017.07.173
Lou, H., Yang, S., Zhao, C., Shi, L., Wu, L., Wang, Y., et al. (2016). Detecting and analyzing soil phosphorus loss associated with critical source areas using a remote sensing approach. Sci. Total Environ. 573, 397–408. doi:10.1016/j.scitotenv.2016.08.048
Lou, H., Yang, S., Zhao, C., Zhou, Q., Bai, J., Hao, F., et al. (2015). Phosphorus risk in an intensive agricultural area in a mid-high latitude region of China. Catena 127, 46–55. doi:10.1016/j.catena.2014.12.013
Marjerison, R. D., Dahlke, H., Easton, Z. M., Seifert, S., and Walter, M. T. (2011). A Phosphorus Index transport factor based on variable source area hydrology for New York State. J. Of Soil Water Conservation 66, 149–157. doi:10.2489/jswc.66.3.149
Mcdowell, N. G., Williams, A. P., Xu, C., Pockman, W. T., and Koven, C. (2015). Nature climate change massive mortality supplementary material.
Mellander, P. E., Jordan, P., Shore, M., Melland, A. R., and Shortle, G. (2015). Flow paths and phosphorus transfer pathways in two agricultural streams with contrasting flow controls. Hydrol. Process. 29, 3504–3518. doi:10.1002/hyp.10415
Mellander, P. E., Melland, A. R., Jordan, P., Wall, D. P., Murphy, P. N. C., and Shortle, G. (2012). Quantifying nutrient transfer pathways in agricultural catchments using high temporal resolution data. Environ. Sci. Policy 24, 44–57. doi:10.1016/j.envsci.2012.06.004
Moges, M. A., Schmitter, P., Tilahun, S. A., and Steenhuis, T. S. (2017). Watershed modeling for reducing future non-point source sediment and phosphorus load in the Lake Tana Basin, Ethiopia. J. Soils Sediments.
Osmond, D., Sharpley, A., Bolster, C., Cabrera, M., Feagley, S., Lee, B., et al. (2012). Comparing phosphorus indices from twelve southern U.S. States against monitored phosphorus loads from six prior southern studies. J. Environ. Qual. 41, 1741–1749. doi:10.2134/jeq2012.0013
Ou, Y., and Wang, X. (2008). Identification of critical source areas for non-point source pollution in Miyun reservoir watershed near Beijing, China. Water Sci. Technol. 58, 2235–2241. doi:10.2166/wst.2008.831
Qiu, Z. (2009). Assessing critical source areas in watersheds for conservation buffer planning and riparian restoration. Environ. Manag. 44, 968–980. doi:10.1007/s00267-009-9380-y
Qiu, Z., Hall, C., Drewes, D., Messinger, G., Prato, T., Hale, K., et al. (2014). Hydrologically sensitive areas, land use controls, and protection of healthy watersheds. J. Water Resour. Plan. Manag. 140. doi:10.1061/(asce)wr.1943-5452.0000376
Qiu, Z., Pennock, A., Giri, S., Trnka, C., du, X., and Wang, H. (2017). Assessing soil moisture patterns using a soil topographic index in a humid region. Water Resour. manage. 31, 2243–2255. doi:10.1007/s11269-017-1640-7
Rissman, A. R., and Carpenter, S. R. (2015). Progress on nonpoint pollution: Barriers & opportunities. Daedalus 144 (3).
Rossel, R. A. V., and Bui, E. N. (2016). A new detailed map of total phosphorus stocks in Australian soil. Sci. Of Total Environ. 542, 1040–1049. doi:10.1016/j.scitotenv.2015.09.119
Shen, Z., Qian, H., Zheng, C., and Gong, Y. (2011). A framework for priority non-point source area identification and load estimation integrated with APPI and PLOAD model in Fujiang Watershed, China. Agric. Water Manag. 98, 977–989. doi:10.1016/j.agwat.2011.01.006
Shen, Z., Zhong, Y., Huang, Q., and Chen, L. (2015). Identifying non-point source priority management areas in watersheds with multiple functional zones. Water Res. 68, 563–571. doi:10.1016/j.watres.2014.10.034
Shi, Z. H., Chen, L. D., Fang, N. F., Qin, D. F., and Cai, C. F. (2009). Research on the SCS-CN initial abstraction ratio using rainfall-runoff event analysis in the Three Gorges Area, China. CATENA 77, 1–7. doi:10.1016/j.catena.2008.11.006
Shore, M., Jordan, P., Mellander, P. E., Kelly-Quinn, M., Wall, D. P., Murphy, P. N., et al. (2014). Evaluating the critical source area concept of phosphorus loss from soils to water-bodies in agricultural catchments. Sci. Total Environ. 490, 405–415. doi:10.1016/j.scitotenv.2014.04.122
Thomas, I. A., Jordan, P., Mellander, P. E., Fenton, O., Shine, O., Creamer, R., et al. (2016). Improving the identification of hydrologically sensitive areas using LiDAR DEMs for the delineation and mitigation of critical source areas of diffuse pollution. Sci. Total Environ. 556, 276–290. doi:10.1016/j.scitotenv.2016.02.183
Todd Walter, M., Michaelwalter, F., Erinbrooks, S., Tammosteenhuis, S., and Jan Boll, K. W. (2000). Hydrologically sensitive areas: Variable source area hydrology implications for water quality risk assessment. J. Soil Water Conservation 3, 277–284.
Walter, M. T., Steenhuis, T. S., Mehta, V. K., Thongs, D., Zion, M., and Schneiderman, E. (2002). Refined conceptualization of TOPMODEL for shallow subsurface flows. Hydrol. Process. 16, 2041–2046. doi:10.1002/hyp.5030
Wang, R., Wang, Y., Sun, S., Cai, C., and Zhang, J. (2020a). Discussing on "source-sink" landscape theory and phytoremediation for non-point source pollution control in China. Environ. Sci. Pollut. Res. 27, 44797–44806. doi:10.1007/s11356-020-10952-4
Wang, T., Xu, P., and Zhu, L. (2015). Variable selection and estimation for semi-parametric multiple-index models. Bernoulli 21, 242–245. doi:10.3150/13-bej566
Wang, Z., Zhang, T., Tan, C. S., and Qi, Z. (2020b). Modeling of phosphorus loss from field to watershed: A review. J. Environ. Qual. 49, 1203–1224. doi:10.1002/jeq2.20109
Watson, C. J., Smith, R. V., and Matthews, D. I. (2007). Increase in phosphorus losses from grassland in response to olsen-P accumulation. J. Environ. Qual. 36, 1452–1460. doi:10.2134/jeq2006.0207
Wischmeier, W. H., and Smith, D. D. (1978). Predicting rainfall erosion losses —a guide to conservation planning. Agriculture handbook (USA): United States. Dept. of Agriculture.
Wischmeier, W. H., and Smith, D. D. (1965). Predicting rainfall-erosion losses from cropland east of the Rocky Mountains. Agric. Handb., 282.
Xue, L., Bao, R., Meixner, T., Yang, G., and Zhang, J. (2014). Influences of topographic index distribution on hydrologically sensitive areas in agricultural watershed. Stoch. Environ. Res. Risk Assess. 28, 2235–2242. doi:10.1007/s00477-014-0925-0
Yang, L., Han, J., Xue, J., Zeng, L., Jiang, Y., Wu, L., et al. (2013). Nitrate source apportionment in a subtropical watershed using Bayesian model. Sci. Total Environ. 463-464C, 340–347. doi:10.1016/j.scitotenv.2013.06.021
Zhang, T., Yang, Y., Ni, J., and Xie, D. (2020). Best management practices for agricultural non-point source pollution in a small watershed based on the AnnAGNPS model. Soil Use Manag. 36, 45–57.
Keywords: nonpoint sources phosphorus, critical source area, hydrological sensitive areas, phosphorus index, watershed management
Citation: Zhou Y, Deng J, Li Z, Wang T, Du Y, Zhao S and Zhang X (2022) Targeting the critical source areas of phosphorus based on hydrological sensitive area delineation to control nonpoint source pollution in watersheds. Front. Environ. Sci. 10:1020336. doi: 10.3389/fenvs.2022.1020336
Received: 16 August 2022; Accepted: 25 August 2022;
Published: 19 September 2022.
Edited by:
Qingsong He, Huazhong University of Science and Technology, ChinaReviewed by:
Nufang Fang, Institute of Soil and Water Conservation (CAS), ChinaCopyright © 2022 Zhou, Deng, Li, Wang, Du, Zhao and Zhang. This is an open-access article distributed under the terms of the Creative Commons Attribution License (CC BY). The use, distribution or reproduction in other forums is permitted, provided the original author(s) and the copyright owner(s) are credited and that the original publication in this journal is cited, in accordance with accepted academic practice. No use, distribution or reproduction is permitted which does not comply with these terms.
*Correspondence: Zhaoxia Li, enhsaUBtYWlsLmh6YXUuZWR1LmNu
Disclaimer: All claims expressed in this article are solely those of the authors and do not necessarily represent those of their affiliated organizations, or those of the publisher, the editors and the reviewers. Any product that may be evaluated in this article or claim that may be made by its manufacturer is not guaranteed or endorsed by the publisher.
Research integrity at Frontiers
Learn more about the work of our research integrity team to safeguard the quality of each article we publish.