 Fernanda E. Ibarra-Esparza1
 Marycarmen Verduzco Garibay1
 Gary Ossmar Lara-Topete1
 Martín Esteban González-López1
 Danielle A. Orozco-Nunnelly2
 Oscar Aguilar-Juárez3
 Carolina Senés-Guerrero1
 Misael Sebastián Gradilla-Hernández1*
- 1Tecnologico de Monterrey, Escuela de Ingenieria y Ciencias, Laboratorio de Sostenibilidad y Cambio Climatico, Zapopan, Jalisco, México
- 2Department of Biology, Valparaiso University, Valparaiso, IN, United States
- 3Unidad de Tecnología Ambiental, Centro de Investigación y Asistencia en Tecnología y Diseño del Estado de Jalisco, Guadalajara, Jalisco, México
The management of municipal solid waste (MSW) is a complex and expensive task. This is especially the case in developing countries, where waste generation rates are continuously increasing and where current MSW management strategies are focused on inadequate practices, such as landfilling and incineration, which result in numerous health and environmental problems. The anaerobic digestion (AD) of MSW has been implemented worldwide as a solution to decrease the amount of waste ending up in landfills. This process allows for the recovery of energy from the organic fraction of MSW (OFMSW) in the form of biogas, which is largely composed of methane. Therefore, the goal of the present study was to evaluate the biochemical methane potential (BMP) of the OFMSW generated within different socioeconomic strata of the Metropolitan Area of Guadalajara (MAG), Mexico. From a microscale perspective, the microbial communities within the experimental AD system were analyzed using high-throughput sequencing of the 16S rRNA gene to assess the relationship between these communities and the biogas composition. This microbial identification revealed a typical AD composition consisting of the following six phyla: Actinobacteria, Bacteroidetes, Chloroflexi, Euryarchaeota, Firmicutes, and Proteobacteria. Furthermore, through the identification of Methanobacterium and Methanosaeta, two methanogenesis pathways (hydrogenotrophic and acetoclastic) were pinpointed. From a macroscale perspective, a multi-stage Gompertz kinetic model was used to describe cumulative biogas production. This model considered the complex nature of the OFMSW substrate in order to estimate the potential level of biogas production in the MAG using a weighted average that was based on the size of the population in each socioeconomic stratum evaluated (732.8 mL⋅g−1 VS). This novel contribution to the literature provides an estimation of the potential economic, energetic, and environmental benefits of treating the OFMSW produced in the MAG through AD. Through this approach, an estimated 8.5 MWh·year−1 of electrical power could be produced, translating into 1.13 million USD of yearly revenue and resulting in reduced GHG emissions (10,519 tonne CO2eq⋅year−1).
1 Introduction
Waste management (WM) is a worldwide challenge for public and private institutions, as well as for individual citizens (Ornelas-Ferreira et al., 2020). Municipal solid waste (MSW) is generated in households, offices, small businesses, and public spaces and is generally managed by municipalities (OECD, 2021). The annual worldwide generation of MSW is projected to reach 3.4 billion tonnes by 2050 (Kaza et al., 2018). Although WM is a complex and expensive task for countries of all income levels, there is a strong positive correlation between MSW generation and national income. In 2016, the global per capita daily average for MSW generation was 0.74 kg, ranging from 0.11 to 4.53 kg among different countries (Kaza et al., 2018). Furthermore, while these rates are stabilizing in high-income countries and have even begun to decrease in some cases, in low- and middle-income countries, the rates are still increasing (United Nations Environment Programme, 2015). The largest fraction of MSW around the world is organic waste, commonly referred to as the organic fraction of municipal solid waste (OFMSW), which includes food and green waste and accounts for 44% of the MSW produced globally (Kaza et al., 2018). The OFMSW generated in many developing countries (such as those in Latin America and the Caribbean) is approximately 52% of the MSW, while developed countries (such as the USA and countries in the European Union) display a lower OFMSW of 27–29% (Kaza et al., 2018).
Inadequate WM is associated with several health and environmental problems (United Nations Environment Programme, 2015; WHO, 2015; Kaza et al., 2018), which are due to diverse factors, such as waste composition, the treatment methods employed, the conditions of the disposal site, and the exposure of the population to these sites (Vinti et al., 2021). Globally, MSW is managed through the following routes: 33% ends up in open-dumps, 29% is placed in semi- or fully-controlled landfills, 7.7% is discarded in sanitary landfills, 19% is recovered for recycling or composting, 11% is incinerated, and less than 1% is treated through other WM technologies, such as anaerobic digestion (AD) (Kaza et al., 2018). Of those aforementioned routes, open dumping and landfilling are the least preferred options for WM (Ferronato and Torretta, 2019). In recent years, the number of AD plants worldwide has dramatically increased, to decrease the amount of OFMSW ending up in landfills (Scarlat et al., 2018; Atelge et al., 2020). AD is a biochemical process that allows for the recovery of energy from the OFMSW, in the form of biogas, which is mainly composed of methane (CH4) (60–65%) and carbon dioxide (CO2) (30–35%). This occurs through the following four sequential steps: hydrolysis (the breakdown of biopolymers to monomers), acidogenesis (the conversion of monomers into volatile fatty acids [VFAs] and alcohols), acetogenesis (the conversion of VFAs and alcohols into acetic acid [CH₃COOH], hydrogen [H2] and CO2), and methanogenesis (the production of CH4 and CO2 from H2 and acetic acid) (Chaudhari et al., 2011; Jain, 2019; Rodrigues et al., 2019; Ellacuriaga et al., 2021). The co-product generated through AD is called the digestate, which is composed of the remains of the organic feedstock fed into the digester (Chaudhari et al., 2011; Jain, 2019; Hassaneen et al., 2020). The biogas produced can be used to generate heat and electricity, or it can be converted into biofuel, while the digestate can be processed to be used as a biofertilizer, through a circular bioeconomy approach (Chaudhari et al., 2011; Jain, 2019). Hence, the implementation of AD plants can help the world achieve the following UN Sustainable Development Goals: (3) good health and well-being, (6) clean water and sanitation, (7) affordable and clean energy, (8) decent work and economic growth, (11) sustainable cities and communities, (13) climate action, and (15) life on land (Jain, 2019; United Nations Development Programme, 2022). Developed countries, such as Germany, Italy, Switzerland, the United Kingdom, and the United States, are leading in the implementation of AD plants (Chaudhari et al., 2011; Atelge et al., 2020; Ellacuriaga et al., 2021). However, recent efforts have also been made in developing countries to determine the bioenergetic potential of the OFMSW to propose strategies for more efficient electricity, biofuel and biofertilizer generation practices (Kaza et al., 2018; Cudjoe et al., 2020). Life cycle assessment (LCA) has been employed to conduct an environmental assessment of AD as a treatment method for the OFMSW (Morero et al., 2017) and compare it with other existing technologies such as composting (Behrooznia et al., 2020) and landfill gas recovery (LFG) (Ayodele et al., 2018; Cudjoe et al., 2020). Theoretical energy and biofertilizer production estimations have been conducted by several authors to assess the environmental and economic benefits of treating OFMSW in large scale AD facilities (El Baz et al., 2020; Yong et al., 2021). Other authors have focused their research on lab-scale biochemical methane potential (BMP) assays and demo-scale systems in order to estimate the potential biomethane production along with the projected economic and environmental gains (Benitez Fonseca et al., 2020; Ornelas-Ferreira et al., 2020; Sohoo et al., 2021).
The biogas yield in AD processes is influenced by several parameters, including feedstock composition, organic loading rate, residence time, temperature, and the microbiome composition (Sohoo et al., 2021). One analytical method that is commonly used to determine the methanogenic potential and anaerobic biodegradability of the OFMSW is the BMP. Additionally, next-generation sequencing technologies have been implemented to elucidate the structure and diversity of the microbial communities present throughout AD processes (Castellano-Hinojosa et al., 2018). The relationship between the AD process performance and the microbial community structure has become a topic of interest for those wanting to develop improved AD strategies in the treatment of MSW (Carballa et al., 2011; Venkiteshwaran et al., 2015; Chen et al., 2016; Gonzalez-Martinez et al., 2016). Over the past decade, researchers have indeed begun to examine this topic, along with the influence of environmental parameters (temperature, pH, and substrate composition and concentration) on microbial community composition (Venkiteshwaran et al., 2015). However, a deeper understanding of these bidirectional interactions would allow for the development of approaches that could enhance the efficiency and stability of AD systems (Venkiteshwaran et al., 2015; Chen et al., 2016).
The present study aimed to evaluate the methanogenic potential of the OFMSW generated in households of different socioeconomic strata within the Metropolitan Area of Guadalajara (MAG) using a stratified sampling scheme. From a microscale perspective, the succession of the microbial community within the AD system was analyzed over time through high-throughput sequencing, while the production and composition of the generated biogas were simultaneously monitored. These results were then used to identify strategies to improve biogas and CH4 production yields. From a macroscale perspective, the BMP was modelled using a multi-stage Gompertz model to represent the complex dynamics of AD in biogas production, while considering different substrates and their interactions. These results were extrapolated to estimate the methanogenic potential of the MAG’s OFMSW to propose a methanogenic harnessing strategy for this region in Mexico. This novel work provides an in-depth and valuable analysis of the methane potential of the OFMSW produced in the MAG. Moreover, the strategies proposed herein should be helpful to policy makers involved in MSW management within metropolitan areas of developing countries.
2 Materials and methods
2.1 Study site
The Metropolitan Area of Guadalajara (MAG), as illustrated in Figure 1, is located in the central area of the state of Jalisco and is the second largest and third most populous metropolitan area in Mexico, with 5,179,874 inhabitants in 2020 (INEGI, 2020; Gobierno del Estado de Jalisco, 2022). The MAG officially contains ten municipalities, of which Guadalajara and Zapopan have the largest populations with 1.4 million and 1.5 million inhabitants, respectively (Gobierno del Estado de Jalisco, 2022). The MAG produces 5,194 tonnes of MSW per day, and the municipalities of Guadalajara and Zapopan are the largest contributors at 1,661 and 1,488 daily tonnes of MSW, respectively (1.098 kg of MSW is generated per capita per day) (Aristoteles et al., 2017). WM in the MAG is currently focused on disposal at three operating sanitary landfills (Aristoteles et al., 2017; SEPLAN, 2022). The MSW of the MAG has the following composition: 54.3% organic material (food and yard wastes), 7.9% paper and cardboard, 16.3% plastics, 2.7% glass, 2.1% metals, and 16.7% other miscellaneous wastes (Lara-topete et al., 2022).
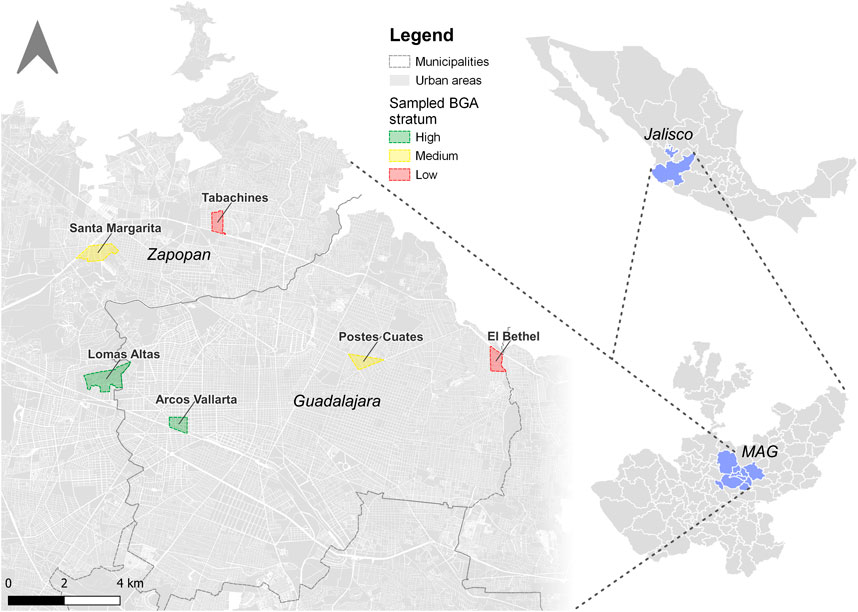
FIGURE 1. Map of selected BGAs in Zapopan and Guadalajara for the stratified sampling of the OFMSW.
2.2 Stratified sampling of the organic fraction of municipal solid waste
A stratified scheme was used in this study to sample the OFMSW produced in households of different socioeconomic strata (low, medium, and high), based on the degrees of marginalization reported by the National Council of Evaluation of the Social Development Policy (CONEVAL) in Mexico (Coneval, 2020; Lara-topete et al., 2022). Six basic geostatistical areas (BGAs) were selected for stratified sampling of the OFMSW, three in the municipality of Guadalajara and three in Zapopan. Within each of these municipalities, one BGA was selected for each socioeconomic stratum (low, medium, and high). All six BGAs are illustrated in Figure 1. Next, five households per BGA were randomly selected for sampling the OFMSW, resulting in a total of 30 households, fifteen in Guadalajara and fifteen in Zapopan. The aim of the study was explained to each household owner who agreed to participate. For the collection of the OFMSW, participants were given labeled plastic bags and asked to exclusively collect kitchen organic waste in these bags. Organic wastes were collected from each household twice within a period of 6 days, on every third day. Samples were immediately transferred to lab facilities at the Research and Technology and Design Assistance Center of Jalisco (CIATEJ) for pretreatment (CIATEJ, 2022). The waste collection process was limited to kitchen organic waste and excluded yard waste due to the high lignocellulosic biomass found in non-edible plants, which shields cellulose from hydrolysis, resulting in lower CH4 yields (Nwokolo et al., 2020). The AD of lignocellulosic biomass requires specialized physical, chemical, or biological pretreatment processes (Panigrahi et al., 2020). Other waste-to-energy (WtE) technologies, like composting, can be more suitable for yard wastes due to their physicochemical characteristics (Sangamithirai et al., 2015; Vigneswaran et al., 2016), but composting was not within the scope of the current study.
2.3 Pretreatment and characterization of the organic fraction of municipal solid waste
Samples from each household (30 total) were individually weighed and left at room temperature for 24 h. Afterwards, samples were grouped by socioeconomic stratum (10 samples each), homogenized and quartered according to the applicable method set by Mexico’s Ministry of the Environment (SEMARNAT, 1985). A quarter of each socioeconomic stratum sample was weighed (4.9–8.0 kg) and dried (SEMARNAT, 1985). Dried samples were homogenized, weighed again (1–2 kg), and ground using a mortar and pestle. The average moisture percentage in the OFMSW was calculated according to the applicable method set by Mexico’s Ministry of Health (Secretaria de Salud, 1994). Between 1.5 and 1.6 g of these samples were used per bottle (360 mL) for the BMP assays. Total solids (TS) and volatile solids (VS) in the OFMSW samples by socioeconomic stratum were calculated in triplicate according to methods established by the United States Environmental Protection Agency (EPA method 1684) (U.S. Environmental Protection Agency, 2001).
2.4 Biochemical methane potential assay
The Automated Methane Potential Test System (AMPTS) II was used for the BMP assays. This analytical instrument is able to conduct real-time measurements of multiple anaerobic batch fermentation tests simultaneously (Bioprocess Control Sweden AB, 2016; Filer et al., 2019; TU Delft, 2022). BMP tests were conducted under mesophilic conditions (37°C ± 1) using a working volume of 500 mL with intermittent agitation (using automated mixing intervals of 2 min on and 5 min off) at 108 rpm. For each test an anaerobic bacterial inoculum was added to the OFMSW substrate, setting the substrate to inoculum ratio (S/I) at 0.33 g VSsubstrate⋅ g−1 VSinoculum. The inoculum bacteria employed were from the granular anaerobic sludge of an anaerobic digester used for tequila vinasses (Casa Herradura, 2022). Thus, this microbial culture was well-adapted for use in an anaerobic digestion system. The phylum-level composition of this inoculum was analyzed using high-throughput sequencing, as a part of this study (described in Section 2.7). Supplemental micronutrients were used in the BMP tests, as shown in Table 1. The duration of the BMP assays was approximately 20 days, and the experiments were stopped as soon as the biogas production rate reached zero. The BMP values of the samples from each socioeconomic stratum (low, medium, and high) were evaluated in triplicate.
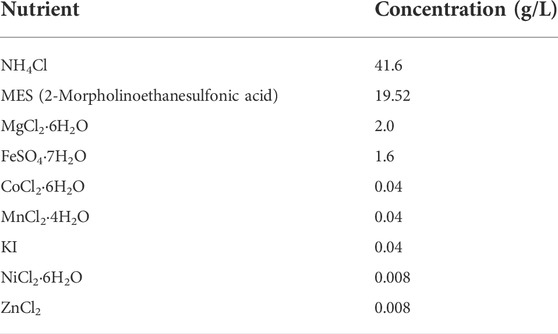
TABLE 1. Micronutrient supplementation composition used for BMP assays.
2.5 Characterization of the generated biogas
During the BMP assays, CH4, CO2, and H2 were measured, and the methane potential of the substrate was estimated (Hagos et al., 2017; Filer et al., 2019). The composition (CH4, CO2 and H2) of the biogas produced during the BMP assays was analyzed via a gas chromatographer using a thermal conductivity detector (Clarus 580, Perkin Elmer) equipped with a HayeSep D packed column (3 m × 3.2 mm, 100/120 mesh; Perkin Elmer Clarus NOCI). The oven, injector and detector temperatures were kept constant at 110°C. Nitrogen (N2) was used as the carrier gas with a flow rate of 30 mL⋅min−1.
2.6 Kinetic model and macroscale extrapolation
Kinetic modeling of the cumulative biogas production curves was used to provide insight into the maximum biogas yield and specific production rate constant. Although several studies report the use of first-order exponential or logistic kinetic models (Mouftahi et al., 2021; Ebrahimzade et al., 2022), two-phase and multi-stage models more accurately represent the complex dynamics of biogas production during AD, because they consider different substrates, stages, and substrate-interactions, and they are able to provide a kinetic constant for each stage of the BMP test (Karki et al., 2022). In this study, a multi-stage Gompertz model was used, since the BMP curves displayed two or more clearly distinguishable stages (Pardilhó et al., 2022). Additionally, this model also considers lag phases for each stage. The model is depicted in Eq. 1.
In this model, G is the cumulative biogas yield (mL·g−1VS), and Gi (mL·g−1VS) represents the specific biogas production values for each stage (i). Accordingly, ki (mL·g−1VS·h−1) depicts the maximum production rate constant for each stage (i), while λi (h) represents the lag phases of each stage (i). The maximum biogas production is calculated through the addition of the parameters (Gi) from the 1st stage to the ith stage.
The BMP experimental values were then input into this model, using n = 2 (two-stage) or n = 3 (three-stage) based on the behavior of the curve, via non-linear regression with the non-linear least squares method using the trust-region algorithm. The regression was carried out in MATLAB® software using the curve fitting toolbox. Additionally, to assess the BMP potential from a macroscale perspective, a weighted average of the BMP curves from different strata was obtained by using the weight of each socioeconomic stratum divided by the total population in the MAG. The weighted averaged curve was also modelled to extrapolate the BMP potential based on the kinetic parameters. The accuracy of the model predictions was validated with the root mean squared error (RMSE) and R-squared (R2) values.
2.7 DNA extraction and high-throughput sequencing
Samples were taken for DNA extraction at different time points during the BMP assays and grouped into three time periods for analysis. The first period was between the 1st and the 2nd days (T1). The second period was between the 3rd and 8th days (T2), and the third period was between the 9th and 14th days (T3). These periods were established based on the cumulative biogas production kinetics observed during the BMP assays, in an effort to link these periods with the stages of anaerobic digestion. T1 comprised the beginning of the log phase (since no lag phase was observed), T2 comprised most of the log phase, when most of the biogas was produced, and T3 comprised the stationary stage, once biogas production had declined and stopped (Jákói et al., 2022). Additionally, control substrate samples (prior to the AD process) were taken for each stratum, along with a sample of the tequila vinasse inoculum employed for the BMP analysis. These samples were taken to assess the structure and diversity of microbial communities within the substrates and inoculum before the BMP assays were carried out. All of the samples were stored at −20°C until further processing. For the DNA extractions, samples were thawed, and DNA was extracted from 500 µL of the sediment using the FastDNA Spin Kit for Soil (MP Biomedicals, Solon, OH, United States) and the E matrix, following the manufacturer’s instructions. DNA was stored at −80°C until further analysis. High-throughput sequencing of the V3–V4 region of the 16S rRNA gene was performed by Novogene Corporation Inc. (Chaoyang District, Beijing, China) using an Illumina NovaSeq 6000 PE250 (paired-end to generate 250 bp paired-end raw reads), which resulted in 100k raw reads per sample using the 341F (CCTAYGGGRBGCASCAG) and 806R (GGACTACNNGGGTATCTAAT) primers.
2.8 Bioinformatic analyses
QIIME 2 version 2021.11 (Quantitative Insights Into Microbial Ecology) software (Kuczynski et al., 2011) was used to perform bioinformatic analyses following a standard bioinformatic pipeline. Demultiplexed sequences were denoised into amplicon sequence variants (ASV) using DADA2 algorithm with the default settings. After denoising, two characteristic tables [FeatureData(Sequence) and FeatureData(Taxonomy)] were constructed based on 99% similarity with Greengenes 13_8 (McDonald et al., 2012; Bokulich et al., 2018). Subsequently, the classifier was trained based on the length of the primers using the Naives Bayes classifier method. Finally, the taxonomic classification and the denoised sequences (the output of the DADA2 algorithm) with the trained classifier were aligned using the classify-sklearn algorithm (Hall and Beiko, 2018). Taxonomically classified ASV were downloaded in a comma-separated value file format from the QIIME2 (visualizer view.qiime2.org) for further analysis.
The DESeq 2 package was used to normalize the read numbers (Love et al., 2014). Sufficient sampling was determined by a rarefaction curve performed in R using the rarefy function based on Hurlbert’s formulation (Hurlbert, 1971). The standard errors were calculated as proposed by Heck et al. (1975). Bar plots of relative read abundance at both the phylum and genus levels were performed using the Scale package in the R studio to visualize bacterial community composition. Any microbial group with a relative read abundance of <1% was designated as “others,” and any unclassified genus was denoted with the label “Un”.
2.9 Statistical analyses
A redundancy analysis (RDA) was performed to analyze the relationship between the biogas composition and the microbial community composition during the time periods sampled and for all three strata. The RDA analysis was used to model response variables, which in this case are the microbial genera, as a function of explanatory variables (biogas composition in this study) (Zuur et al., 2007). Additionally, correlation triplots were performed to further assess the relationship between microbial communities and biogas composition. A correlation triplot consists of two superimposed biplots that include quantitative explanatory and response variables (represented by vectors) and observations (represented by points) (Zuur et al., 2007). Within the triplot, the angles between two response variable vectors, between two explanatory variable vectors, or between a response variable vector and an explanatory variable vector reflect their correlation (Borcard et al., 2011). Points or observations can be projected perpendicularly onto the response and explanatory variable vectors and indicate their values in the corresponding samples (Borcard et al., 2011).
Permutational multivariate analysis of variance (PERMANOVA; p < 0.05) and analysis of similarity (ANOSIM) using the Bray-Curtis dissimilarity index, were then employed to evaluate statistically significant differences in the microbial composition among the three sampling periods (Oksanen et al., 2012). An ANOSIM statistic R value close to 1 indicates dissimilarity between groups, while an R value close to 0 indicates a distribution of high and low ranks within and between groups (Clarke, 1993). These statistical analyses (RDA, PERMANOVA and ANOSIM) were performed using R software version 4.0.2 and the scales (Wickham, 2016), vegan (Dixon, 2003) and ggplot2 (Wickham, 2016) packages.
Additionally, one-way analysis of variance (ANOVA; p < 0.05) tests were performed using the Minitab® software version 21.1 to compare the effects of the three socioeconomic strata on the biogas and CH4 yields and boxplot comparison along with Tukey tests were developed using the R software version 4.0.2 to compare the biogas composition of the different socioeconomic strata.
2.10 Economic and environmental assessment
An economic benefits assessment was performed based on the total potential revenue that can be obtained from selling the methane-generated power produced using OFMSW as a substrate in an AD process. The power generation computation considered the annual operation of a mesophilic AD facility (21 days HRT) with the capacity to receive the OFMSW generated in 1 day in the MAG (Aristoteles et al., 2017; Gobierno del Estado de Jalisco, 2022; SEPLAN, 2022). A sorting process to separate the non-suitable organic waste fraction was assumed, which represented a 15% mass loss (based on wet weight) (Ardolino et al., 2018). The biogas and CH4 production were calculated based on the results obtained in this study. Furthermore, a facilities biogas leakage of 3% of the total production was included (Liebetrau et al., 2013). The density at room temperature, calorific value of pure CH4 (Sohoo et al., 2021) and the electrical efficiency factor (U.S. Environmental Protection Agency, 2013) were all employed to obtain the annual potential electrical power generation. From this value, the AD facilities energy requirement (Ardolino et al., 2018) was subtracted to obtain the net energy production. The potential revenue was then calculated using the current cost of electricity reported in the literature (Agencia de Energia del Estado de Jalisco, 2019).
Regarding the environmental assessment, a global warming potential over a 100-year time span was employed (Ornelas-Ferreira et al., 2020). GHGs emission savings as a result of OFMSW treatment (landfilling avoidance) and energy recovery from biogas (electrical energy substitution) were computed using Mexican landfill (Lara-topete et al., 2022) and electricity production emission factors (Secretaria de Medio Ambiente y Recursos Naturales, 2022). From this value, the emissions generated through the operation of the AD facility and the methane leakage were both subtracted to obtain the net GHG emission savings.
3 Results and discussion
3.1 Biogas production from stratified organic fraction of municipal solid waste samples
The total weight of OFMSW collected for the BMP assays was 106.3 kg, of which 51.4% corresponded to the high socioeconomic stratum, 18.4% to the medium stratum, and 30.2% to the low stratum. Table 2 contains a chemical characterization summary the OFMSW samples collected from all three strata. The average moisture content (79 ± 1%) was consistent with the values reported by Campuzano and González-Martínez (2016) for OFMSW samples from 22 countries, which ranged from 49.8 to 85% with an average of 72.8%. The average TS (19 ± 2%), VS (16 ± 2%) and VS/TS (85 ± 6%) percentages herein were also consistent with the values reported by Campuzano and González-Martínez (2016), which ranged from 15 to 50.2% (average of 27.2%) for TS, 7.4–36.1% (average of 22.6%) for VS, and 43–95% (average of 84.6%) for VS/TS (Campuzano and González-Martínez, 2016).
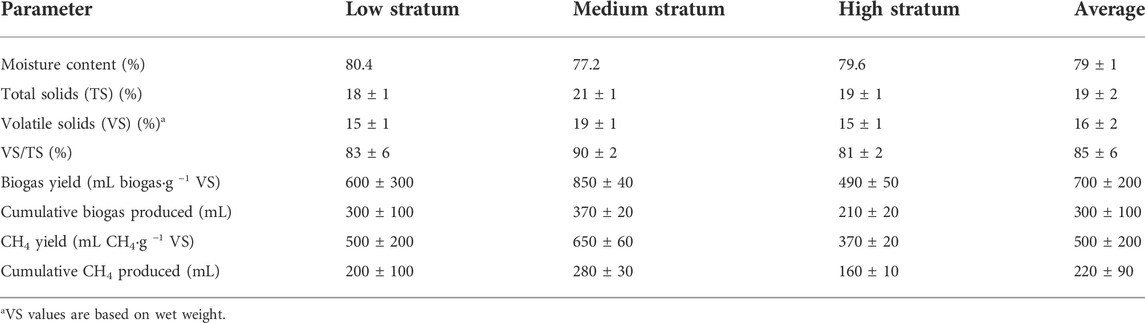
TABLE 2. Chemical characteristics and gas (biogas and CH4) production of the OFMSW for each socioeconomic stratum.
The average biogas and CH4 yields produced from the OFMSW samples were 700 ± 200 mL biogas⋅g −1 VS and 500 ± 200 mL CH4⋅g −1 VS, respectively. This result is similar to the CH4 yield reported by other authors for OFMSW sampled in different countries, as shown in Table 3. The results from a one-way ANOVA revealed that there was no significant difference in biogas (p = 0.161) or CH4 (p = 0.211) yields between the three socioeconomic strata.
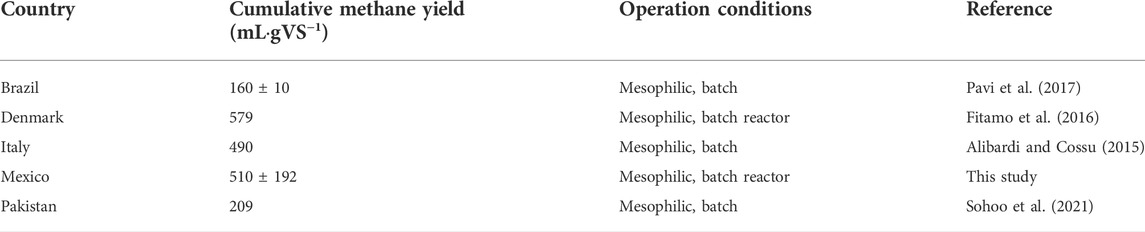
TABLE 3. Comparison of methane yield obtained from the AD of OFMSW in different countries.
The cumulative biogas and CH4 production for each stratum is shown in Figure 2. The anaerobically digested OFMSW from the medium socioeconomic stratum displayed the highest biogas and CH4 production and yield. While biogas was produced until the 19th day, CH4 production stopped after the 17th day. This trend is consistent with previous reports, which show biogas and CH4 production ceasing after 15–17 days (Pavi et al., 2017; Sohoo et al., 2021). For the OFMSW of the low socioeconomic stratum, both the biogas and the CH4 production rates were zero after the 10th day. Similarly, the biogas and CH4 production from the OFMSW of the high stratum ended after the seventh day. A plausible explanation for this early cessation of gas production could be the accumulation of VFAs in these samples, as a result of a high content of mono- and disaccharides in the OFMSW, which may result in a decrease in pH and the inhibition of methanogenesis (Hagos et al., 2017; Pavi et al., 2017). Food wastes with elevated concentrations of simple sugars and disaccharides are associated with a high formation of VFAs during AD. Indeed, studies have shown that households in high socioeconomic strata of developing countries have a tendency to consume more processed food products than low and middle socioeconomic strata (Khan et al., 2016). These types of products have a high content of simple carbohydrates that could increase the formation of VFAs, thus decreasing the pH and inhibiting methanogenesis. This may explain the reason for the low CH4 production in the high socioeconomic stratum group (Vos et al., 2017).
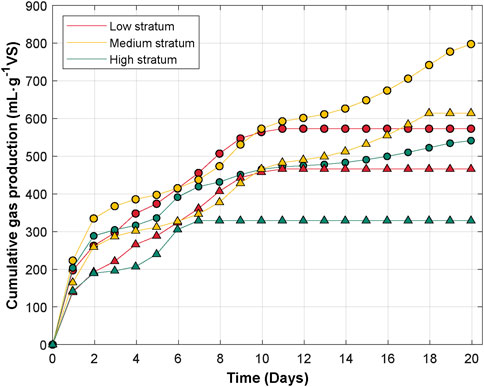
FIGURE 2. Cumulative biogas (indicated with circles) and CH4 (indicated with triangles) production from anaerobically digested (37°C, 108 rpm, S/I: 0.33) OFMSW samples of low, medium, and high socioeconomic strata.
The biogas produced from the OFMSW in the present study was comprised of 62–86% CH4, 13–23% CO2, 0.1–2% H2, and other trace compounds, which may include N2, oxygen (O2), hydrogen sulphide (H2S), and ammonia (NH3) (Vögeli et al., 2014; Halder et al., 2016). However, N2, O2 and H2S were not monitored in the present study. The CH4 and CO2 concentrations in the biogas were consistent with levels found in the literature for anaerobically digested OFMSW, where CH4 and CO2 concentrations within the ranges of 50–75% and 25–50% were respectively reported (Chaudhari et al., 2011; Vögeli et al., 2014; Halder et al., 2016; Ornelas-Ferreira et al., 2020). The volume percent for the two main biogas components (CH4 and CO2) produced during the AD of OFMSW for three socioeconomic strata is shown in Figure 3 along with a boxplot comparison of the gaseous fractions among the three strata. The CH4 concentration in the biogas began increasing on day 1 until it peaked at a maximum concentration of 85–88% on day 7 for the high stratum and on day 13 for the low and medium strata. After peaking, the CH4 concentration remained above 80% for the low and medium strata, while for the high stratum, the CH4 concentration decreased to 16% after peaking. For the low and medium strata, the CO2 concentration increased to its maximum value (25–26%) during the first 24 h and decreased afterwards, stabilizing at 9–11%. For the high stratum, the CO2 concentration reached 21% during the first 3 days, then slightly decreased, but started to increase again after day 5, peaking at 30% on day 16. This brief decrease in CO2 concentration may be due to hydrogenotrophic methanogenic activity, which utilizes H2 and CO2 to produce CH4 (Chaudhari et al., 2011). For all three strata, H2 was only detected at low concentrations (2–3%) in the first 24 h of the BMP test.
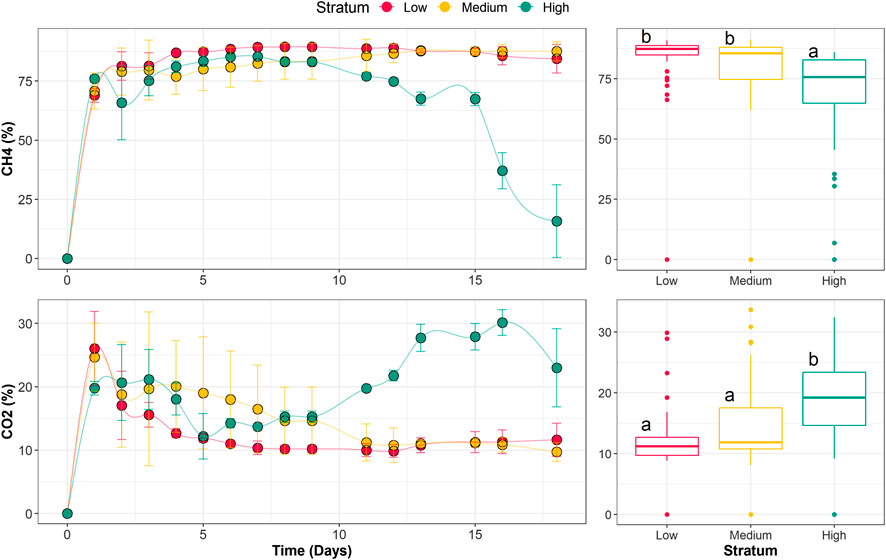
FIGURE 3. Volume percent of CH4 and CO2 in the biogas produced from the AD of OFMSW of the three socioeconomic strata; boxplots comparison of CH4 and CO2 in the biogas (different letters represent significantly different groups according to Tukey test).
These trends in the concentrations of CH4, CO2, and H2 can be explained by the various biochemical reactions and metabolic activities occurring in the different stages of AD. During the acetogenesis stage, VFAs and alcohols are converted to acetic acid, H2, and CO2. Subsequently, during the methanogenesis stage, these intermediate products are converted to CH4 via two pathways, acetotrophic, and hydrogenotrophic methanogenesis (Chaudhari et al., 2011). From the trends shown in Figure 3, it can be inferred that the degradation of organic matter (through hydrolysis, acidogenesis, and acetogenesis) occurred primarily in the first days of the experiment, and methanogenesis began early and peaked somewhere between days 7 and 13. In general, the concentration of trace compounds is expected to increase when the concentration of CH4 decreases, which is explained by the inhibitory effect that trace gases, such as H2S and NH3, have on methanogenesis (Ellacuriaga et al., 2021). This relationship can be observed in the present study between days 15 and 18 in the biogas composition curve from the high stratum.
As observed in the Figure 3 boxplots, both the CH4 and CO2 concentrations produced from the OFMSW of the low and medium strata displayed similar trends, while the high stratum displayed overall lower CH4 and higher CO2 concentrations than either of the other two strata. These differences in gas production among the three strata can be attributed to the chemical and bromatological characteristics of the OFMSW samples. The TS and VS content in OFMSW are two of the most influential chemical components affecting CH4 production during AD (Zamri et al., 2021). In this study, the OFMSW from the medium stratum displayed a higher VS/TS percentage (90%) than either the low or high strata (which were 83% and 81%, respectively). Campuzano and González-Martínez (2016) reported a positive correlation between the VS/TS% and CH4 production, which explains the higher CH4 production in the OFMSW of the medium stratum. Although the VS/TS% in the OFMSW from the high socioeconomic stratum was similar to that of the low stratum, a difference in AD performance was nevertheless observed. This can be attributed to possible differences in bromatological characteristics of the OFMSW based on socioeconomic strata. Several authors have studied the dietary trends of the Mexican population and the association of these trends with socioeconomic level. The high socioeconomic stratum has been reported to consume more protein and animal based products, and less fatty acids and saturated fats compared with medium and low strata (Pérez-Tepayo et al., 2020). Furthermore, elevated fats and oils have been associated with high CH4 yields during AD due to the easy hydrolyzation of long-chain fatty acids (Campuzano and González-Martínez, 2016). While increased protein content has also been associated with high CH4 yields during AD, some studies have shown that excessive decomposition of protein can produce gases that are toxic to methanogens (Campuzano and González-Martínez, 2016; Zamri et al., 2021).
3.2 Kinetic analysis of the biogas generated from the organic fraction of municipal solid waste in the metropolitan area of Guadalajara
Next, a kinetic analysis was performed to predict potential outcomes of treating OFMSW via AD of in the MAG. Cumulative biogas production curves were constructed using a multi-stage Gompertz kinetic model. The model accuracy to predict the cumulative biogas production was confirmed with the R2 value of the non-linear regression (R2 > 0.99 in all cases). Also, the RMSE function confirmed that the predicted values are close to the experimental observations in all datasets. Figure 4 displays the kinetic curves based on the experimental data.
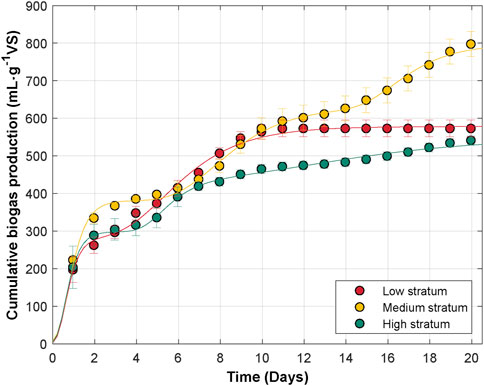
FIGURE 4. Cumulative biogas production curves of the three socioeconomic strata fitted to the multi-stage Gompertz model (solid lines represent the plot of the model).
During the AD process, the curves from all three strata displayed multiple stages, along with diauxic growth patterns. Diauxie is due to the multifactorial effects of the degradation of simple and high complexity substrates, substrate-interactions, microbial adaptability, and the accumulation of VFAs (Gomes et al., 2021). Of these factors, VFA accumulation is the most important for process stability, as it causes a sharp drop in the pH and a subsequent decrease in methane production (Zhang et al., 2018). The curve from the AD of the low stratum sample had two distinct phases, each with a specific production rate and associated lag phase (Yingthavorn et al., 2020). However, the curves of the medium and high strata displayed three distinguishable stages, suggesting a complex chain of consumption by the microbial groups identified herein, and discussed in Section 3.3.
Table 4 summarizes the model parameters for each socioeconomic stratum, along with a weighted average for each parameter, which was calculated based on the weight of each socioeconomic stratum value divided by the total population in the MAG.
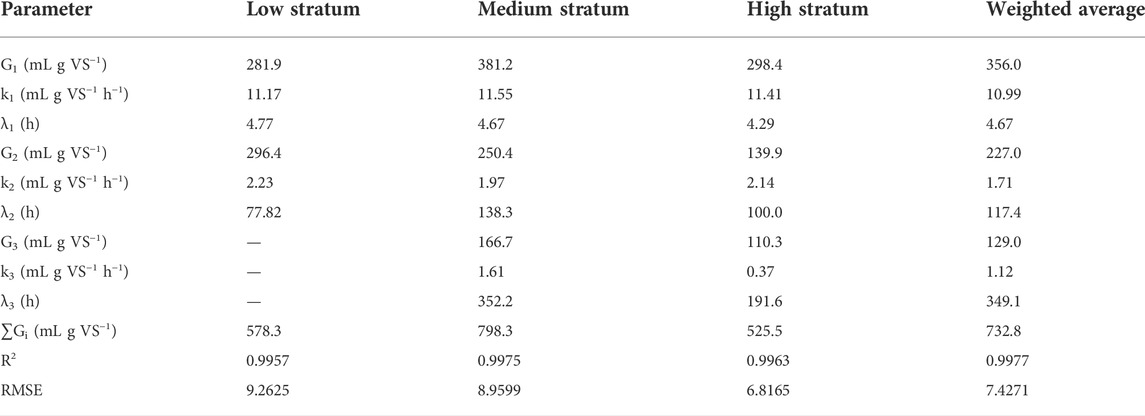
TABLE 4. Parameters for the multi-stage Gompertz kinetic model used in the modeling of the BMP tests.
The lag phase for the initial stage (λ1) of the BMP test was similar for all three strata (between hours 4 and 5). This short lag phase indicates a quick adaptation of the microorganisms to the substrate. This shows that the microbial inoculum can degrade OFMSW and that it is well suited for use with a tequila vinasse substrate (Pererva et al., 2020; Karki et al., 2022). Conversely, the lag phase for the second (λ2) and third (λ3) stages of the BMP test were considerably higher for the medium stratum than for the high stratum. This could be an indication that VFA accumulation is inhibiting the AD process. VFAs are intermediates of AD, resulting from the acidogenesis and methanogenesis reactions (Delgadillo Mirquez et al., 2018). The maximum biogas yield is calculated through the addition of the Gi constants of the model. These values were 578.3, 797.6, and 525.5 mL gVS−1 for the low, medium, and high strata, respectively, which agree with the final asymptote observed in all three corresponding curves. The Gi parameters indicate the biogas yield at each degradation stage. G1 was different for all three strata, being higher for the medium stratum curve than for the low and high strata curves. This indicates that the production of biogas from the consumption of readily available substrate is higher in the OFMSW of the medium stratum. The parameters k1, k2, and k3 represent the maximum biogas production rate constants at each degradation step in the BMP curves. During the first stage, k1 was similar for all three strata, with a production rate between 11.17 and 11.55 mL·g−1VS·h−1. These rates were considerably higher than the those of the next stages, where the rate constants were between 1.97 and 2.23 mL·g−1VS·h−1, and between 0.37 and 1.0 mL·g−1VS·h−1 for the second and third stages, respectively. This observation is consistent with a slowdown of the degradation process and biogas production once the easily degradable fractions are depleted and when microbial communities must adapt in order to consume more complex nutritional materials within the substrate (Pardilhó et al., 2022). Using a weighted average of biogas production accounting for each stratum in the MAG, the maximum biogas production was estimated at 732.8 mL⋅g −1 VS. This value represents the maximum amount of biogas that could potentially be produced in the MAG by treating the OFMSW through AD. The implications of this are discussed in detail in Section 3.4.
3.3 Microbiome analysis
Sequencing of the 16S rRNA gene amplicon yielded 7,536,418 high-quality microbial raw sequence reads with a mean length of 409 bp. A total of 3,583,101 (76%) were classified as bacteria and 1,121,749 (23.8%) as archaea using the Greengenes database. The sequencing results for the initial inoculum and substrates from the low, medium, and high strata BMP assays are shown in Figure 5A. The following five predominant phyla (four bacterial and one archaeal) were identified in the inoculum from an anaerobic digester of tequila vinasses (Figure 5A): Actinobacteria (8.31%), Bacteroidetes (9.93%), Chloroflexi (8.60%), Proteobacteria (7.02%), and the archaeal phylum identified was Euryarchaeota (49.70%). The three main genera identified were Methanobacterium (24.33%), Methanosaeta (25.65%), and unclassified members of Bacteroidales (9.21%). Regarding the OFMSW of the three strata, which were the substrates for the AD process, the two main bacterial phyla identified were Firmicutes (29.68–64.31%) and Proteobacteria (21.67–59.70%). At genus level, the most relevant Firmicutes identified was Clostridium (5.03–6.85%), and the most relevant Proteobacteria identified were unclassified members of the Enterobacteriaceae family (3.57–4.32%) along with the Pseudomonas (3.26–38.25%) genera. Overall, the phyla identified in the inoculum and substrates (Figure 5A) are consistent with the phyla identified in the T1–T3 samples (Figure 5B), indicating that both the inoculum and substrates contributed to the AD microbiome. However, other Firmicutes and Proteobacteria genera, such as Geobacillus, Sporolactobacillus, Brochothrix, Rahnella, and unclassified members of Planococcaceae family were initially identified in the substrates but not found later in the AD during time periods T1–T3.
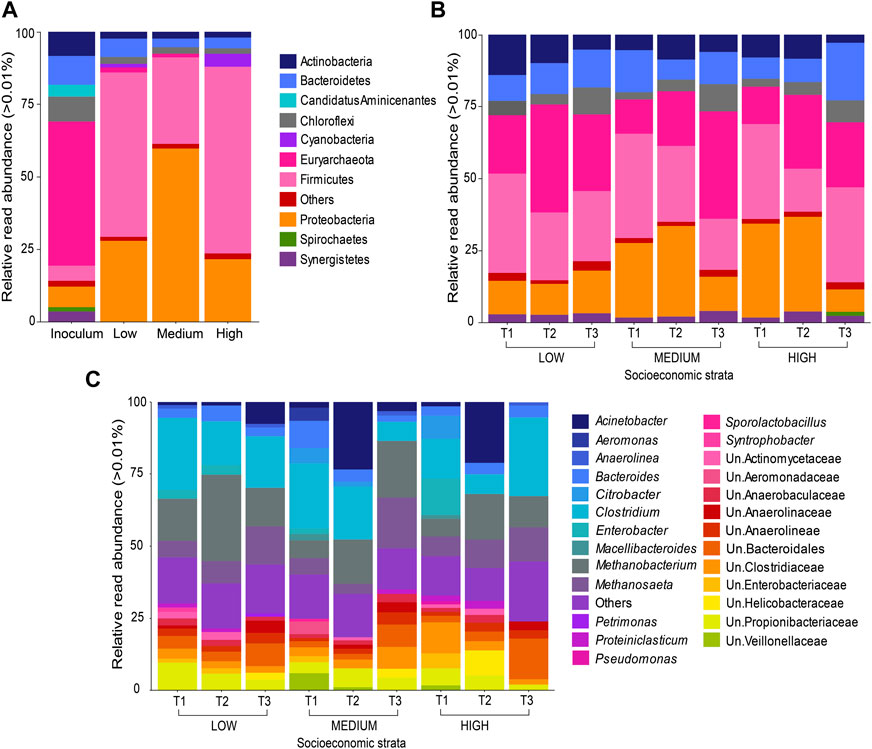
FIGURE 5. Relative read abundance of the most abundant bacteria and archaea: (A) at the phylum-level for the OFMSW substrates from the three socioeconomic strata and for the inoculum used in the BMP assays; (B) at the phylum-level for the OFMSW substrates from the three socioeconomic strata at timepoints T1, T2 and T3; (C) at the genus-level for OFMSW substrates from the three socioeconomic strata at timepoints T1, T2 and T3. ANOSIM = 0.4226, Significance = 0.001.
Seven predominant phyla (six bacterial and one archaeal) were identified in the samples of all three strata during the complete AD process, at time periods T1–T3 (Figure 5B). The bacterial phyla identified were Firmicutes (14.9–36.3%), Proteobacteria (7.8–32.9%), Bacteroidetes (7.4–20.0%), Actinobacteria (2.9–14.0%), Chloroflexi (2.5–9.4%), and Synergistetes (1.8–3.9%), while the archaeal phylum identified was Euryarchaeota (11.9–37.5%). This is consistent with previous studies, in which Firmicutes, Proteobacteria, Bacteroidetes, Actinobacteria and Euryarchaeota have been reported as the predominant microbial phyla during the AD of both food wastes and OFMSW (Chaudhari et al., 2011; Yi et al., 2014; Qin et al., 2021; Tyagi et al., 2021; Zheng et al., 2021). Furthermore, 26 genera (24 bacterial and two archaeal) were identified in these samples (Figure 5C); these results are discussed in the following section.
3.3.1 Microbiological communities during the anaerobic digestion stages
The analysis of similarity (ANOSIM), conducted to evaluate differences in the microbial composition among the three sampling periods, showed that there was a statistically significant difference in the microbiome composition among T1, T2 and T3 (T1–T3; ANOSIM = 0.4226, Significance = 0.001). A summary of the most relevant microbial genera identified in the study, the AD stage in which they participate, and the relative abundance of each throughout the three sampling periods is shown in Figure 6. The length and position of each arrow indicates in which of the four AD stages each genus is reported to participate, with some participating in more than one stage. The color gradient within each arrow represents the average relative abundance (%), and the following positions within each arrow indicate the exact sampling time point: T1 (arrow’s tail), T2 (shaft), and T3 (arrowhead).
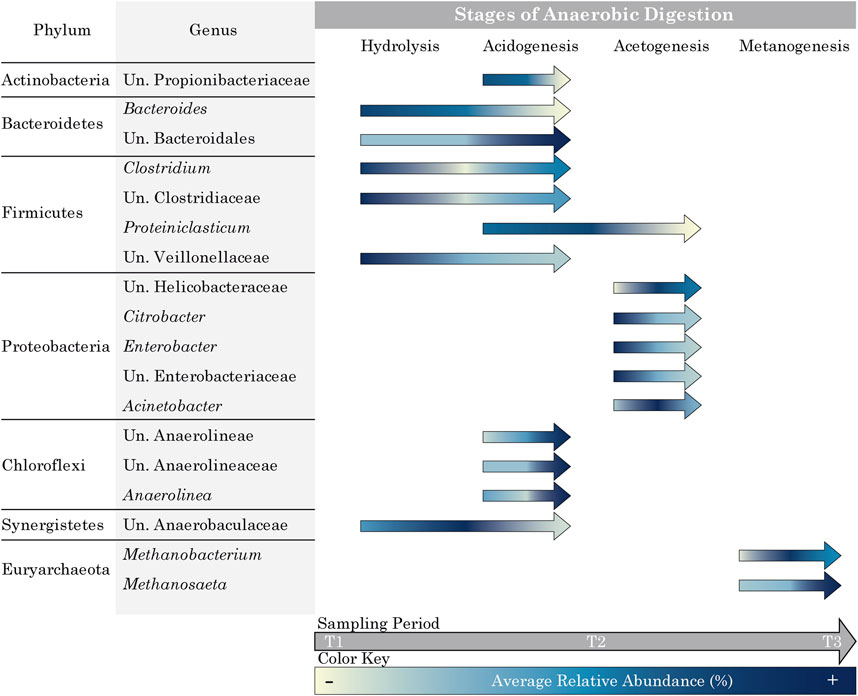
FIGURE 6. Graphical summary of the main genera identified, the AD stages in which they participate, and the shift in relative abundance from T1 to T3 for each genus.
3.3.1.1 Hydrolysis
Firmicutes, Bacteroidetes and Synergistetes have been reported to be involved in the hydrolysis stage of AD (Amani et al., 2010; Chaudhari et al., 2011). In the present study, Firmicutes was the most abundant phylum (33.0–36.3%) during the first 2 days (T1) of the BMP test for all three strata samples and remained present in all three strata samples during time periods T2 and T3. The Firmicutes genera identified were Clostridium (5.65–27.07%), Proteiniclasticum (1.32–2.66%), and unclassified members of the Clostridiaceae (1.93–10.75%) and Veillonellaceae (1.2–5.96%) families (Figure 5C). Clostridium spp. are among the most abundant bacteria identified during the hydrolysis of proteins, carbohydrates and lipids, which explains its peak in abundance at T1 (Figure 6) (Amani et al., 2010; Xiao et al., 2013; Tyagi et al., 2021). The Veillonellaceae family has also been associated with the hydrolysis stage of AD, which explains its decrease in abundance from T1 to T3 (Figure 6) (Khatami et al., 2021). Regarding the Bacteroidetes phylum, the most relevant genera identified were Bacteroides (3.14–9.28%) and other unclassified members of the Bacteroidales family (1.91–14.1%) (Figure 5C). Bacteroides has been identified as a dominant hydrolyzing genus, with reported hydrolytic activities against carbohydrates and protein, generally occurring at the start of AD processes during the operation of mesophilic digesters, as illustrated in Figure 6 (Amani et al., 2010; Gonzalez-Martinez et al., 2016; Castellano-Hinojosa et al., 2018; Tyagi et al., 2021). Furthermore, the Synergistetes identified in this study were unclassified members of the Anaerobaculaceae family (1.26–2.68%) (Figure 5C). This phylum has an important role in the degradation of complex carbohydrates, such as lignocellulosic biomass (Wirth et al., 2021). The abundance of this phylum increased and peaked at T2 then decreased in T3 (Figure 6).
3.3.1.2 Acidogenesis
Firmicutes, Chloroflexi, Actinobacteria, Bacteroidetes, and Synergistetes have been reported to have acidogenic activity (Zhang et al., 2010; Khatami et al., 2021; Qin et al., 2021). Among these, Firmicutes was the most abundant (14.9–36.3%) throughout T1–T3 in all strata samples, followed by Actinobacteria (2.9–14.0%). Among the Firmicutes identified, Clostridium spp. are some of the most abundant fermentative bacteria reported during acidogenesis (Iltchenco et al., 2021; Qin et al., 2021), due to their ability to convert amino acids into VFAs, such as acetic acid, as well as H2 (Amani et al., 2010; Xiao et al., 2013; Tyagi et al., 2021). Clostridium (5.7–27.1%) was among the most abundant bacterial genus identified throughout T1–T3 for all strata. Other Firmicutes that participate in acidogenesis that were identified in this study include Proteiniclasticum spp. (T1–T3) and the Veillonellaceae family (T1–T2) (Zhang et al., 2020; Khatami et al., 2021). The Proteiniclasticum spp. are proteolytic bacteria which can use amino acids as carbon and nitrogen sources to produce VFAs, such as acetic acid, propionic acid and iso-butyric acid (Zhang et al., 2010; Zhang et al., 2020). As shown in Figure 6, the abundance of this genus increased in T2 then decreased in T3. Chloroflexi (2.5–9.4%) is a well-established acidogenic phylum, which is ubiquitous in most anaerobic digestion processes (Yi et al., 2014; Venkiteshwaran et al., 2015; Qin et al., 2021) and capable of organic compound degradation and glucose utilization (Qin et al., 2021). Chloroflexi was identified throughout T1–T3 with an increasing trend (as shown in Figure 6). The Chloroflexi genus identified herein was Anaerolinea (1.13–1.51%), as well as other unclassified members of the Anaerolineaceae family (1.12–4.23%) and other unclassified members of the Anaerolineae class (1.13–4.22%) (Figure 5C). The Anaerolineaceae family is regarded as a non-hydrolytic acidogen, which contributes to the conversion of carbohydrates into acetate and H2 (Khatami et al., 2021). The Actinobacteria (2.9–14.0%) phylum has been reported to have complex carbohydrate fermentative activity and to play an essential role in the production of propionate acid and acetate during the acidogenesis stage of AD (Qin et al., 2021; Wirth et al., 2021). The Actinobacteria phylum was identified throughout T1–T3, with a decreasing trend (Figure 6). The specific Actinobacteria identified were unclassified members of the Propionibacteriaceae family (2.01–9.62%) (Figure 5C), which contains organisms that are well-known for their ability to produce propionic acid (Turgay et al., 2022). Regarding the Bacteroidetes (7.4–20.0%) phylum, Bacteroides spp. are involved in the acidogenesis stage and have been associated with VFA production (Qin et al., 2021; Tyagi et al., 2021). Bacteroides were identified throughout T1–T3, with a decreasing trend (Figure 6). The Synergistetes (1.8–3.9%) phylum identified in this study is known for its involvement in acidogenesis through amino acid utilization and VFAs production (Chen et al., 2016; Castellano-Hinojosa et al., 2018).
3.3.1.3 Acetogenesis
The Proteobacteria and Firmicutes phyla identified in this study have been reported to be involved in the acetogenic phase of AD. Proteobacteria play an important role in the acetogenesis stage of AD due to their utilization of important CH4 precursors, such as glucose, propionate, butyrate, and acetate (Guo et al., 2015). In this study, Proteobacteria (7.8–32.9%) was the second most abundant bacterial phylum, and its presence increased throughout the AD process, peaking at T2 for the medium and high strata and in T3 for the low stratum (Figure 5B). The most abundant Proteobacteria genera identified herein were Citrobacter (1.59–8.06%), Enterobacter (1.79–12.56%), and Acinetobacter (1.12–23.45%), as well as other unclassified members of the Helicobacteraceae (2.44–8.52%) and Enterobacteriaceae (1.38–5.28%) families (Figure 5C). The Enterobacteriaceae family possesses well-known carbohydrate fermenters, responsible for producing methanogenic substrates like acetate, formate, H2 and CO2 (Carbone et al., 2002). The abundance of the Enterobacteria identified in this study (Citrobacter and Enterobacter) decreased by the T3 timepoint (Figure 6). This is consistent with other studies, in which the presence of this family during the AD of food waste was identified as a contribution from the feedstock (Xiao et al., 2013). The presence of the Helicobacteraceae family in AD has previously been reported in a study using blackwater as feedstock (Guo et al., 2022). Likewise, Acinetobacter has been identified in AD plants that treat urban sewage sludge (Gonzalez-Martinez et al., 2016) and manure (Pulami et al., 2020). Members of the Proteinclasticum genus of the Firmicutes phylum are also involved in the acetogenesis stage (Zhang et al., 2010; Zhang et al., 2020).
3.3.1.4 Methanogenesis
The Euryarchaeota phylum increased during the AD of the OFMSW across all three strata. Two Euryarchaeota genera were identified in this study, Methanosaeta (3.61–17.61%) and Methanobacterium (6.09–29.89%) (Figure 5C). Methanosaeta is one of the most important acetoclastic methanogenic genera involved in AD, and its members are found to grow exclusively in the presence of acetate (Carbone et al., 2002). Methanobacterium is the dominant hydrogenotrophic methanogenic genus involved in AD, due to the fact that it is an efficient H2 utilizer (Tyagi et al., 2021). Acetoclastic methanogens produce CH4 using acetic acid, while the hydrogenotrophic methanogens use H2 and CO2 for the synthesis of CH4 (Castellano-Hinojosa et al., 2018). As shown in Figure 5C, Methanobacterium was the predominant methanogen genus during T1–T3 in both the low and medium socioeconomic strata samples. This points to the predominance of the hydrogenotrophic methanogenic pathway in these groups throughout the AD. In both samples, the relative abundance of Methanobacterium increased from T1 to T2 and then decreased in T3 (Figure 5C). Regarding the OFMSW of the high stratum group, the relative abundance of Methanobacterium displayed the same trend. Nevertheless, the acetoclastic pathway (the presence of Methanosaeta spp.) was dominant in T1 and T3 (Figure 5C). This difference in the relative abundance of Methanobacterium is consistent with the high CO2 values (12–30%) in the biogas throughout the AD process for this stratum, which can be indicative of a lack of hydrogenotrophic methanogen activity.
3.3.2 Redundancy analyses of biogas composition and microbiological communities
An RDA was performed to analyze correlations between the biogas composition (CH4, CO2, and H2) and the microbial communities during the time periods sampled (T1–T3). In this triplot (Figure 7), samples are represented by dots, and microbial genera and biogas gas constituents are depicted by vectors (Ramette, 2007). The angles in a triplot reflect correlations between response variable vectors, between explanatory variable vectors, or between a response and an explanatory variable vector. Additionally, the projection of points onto the response and explanatory variable vectors indicates their value in the corresponding sample (Garibay et al., 2021). The two main redundancy components explained 54% of the total variability within the microbial community (two archaeal and seven bacterial genera with relative abundance over 5%). The variation in the relative abundance of the selected genera during the AD process is consistent with the activity of these microorganisms in the different stages of AD. Citrobacter, Enterobacter, and unclassified members of the Enterobacteriaceae family were more abundant in T1 (days 1–2) and decreased in abundance as the AD process advanced (T2–T3). These Proteobacteria play important roles in the acidogenesis and acetogenesis stages of AD (Carbone et al., 2002; Jiménez et al., 2014). Furthermore, the RDA results suggest that Bacteroides and Acinetobacter were strongly correlated with the production of H2 and moderately correlated with the production of CO2 during time periods T2 and T3. Both Bacteroides and Acinetobacter have been identified as acidogenic bacteria (Qin et al., 2021; Tyagi et al., 2021). The production of H2 mainly occurs during the acidogenesis and acetogenesis stages of AD, and it is used later through the hydrogenotrophic methanogenesis pathway (Ellacuriaga et al., 2021). This suggests that these two genera were responsible for the conversion of soluble organic monomers during T2–T3 and that the acetogenic activity was displayed by Acinetobacter during the T2–T3 periods. Clostridium, Methanobacterium, Methanosaeta and unclassified members of the Propionibacteriaceae family were found to be correlated with the production of CH4, CO2, and overall biogas. Accordingly, the relative abundance of these genera was higher in the T2 and T3 periods than in the T1 period. Clostridium has been reported to be among the most abundant hydrolytic and acidogenic bacteria (Amani et al., 2010; Xiao et al., 2013; Tyagi et al., 2021). The Clostridia class has been regarded as a major acetic acid producer (Qin et al., 2021). Furthermore, the Propionibacteriaceae family is a well-known propionic acid producer (Turgay et al., 2022). The present results suggest that propionic acid was one of the main VFAs produced that served as an acetic acid precursor (acetotrophic methanogenesis pathway) in the BMP tests. Methanobacterium and Methanosaeta were likely responsible for producing CH4 throughout T2 and T3 through the hydrogenotrophic and acetoclastic pathways. The moderate correlation between CO2 and Methanobacterium is consistent with the utilization of this gas by these microorganisms to produce CH4. Finally, the strong correlation between Clostridium and Methanosaeta suggests that Clostridium played a key role in the production of acetic acid, which in turn was used by Methanosaeta for methanogenesis.
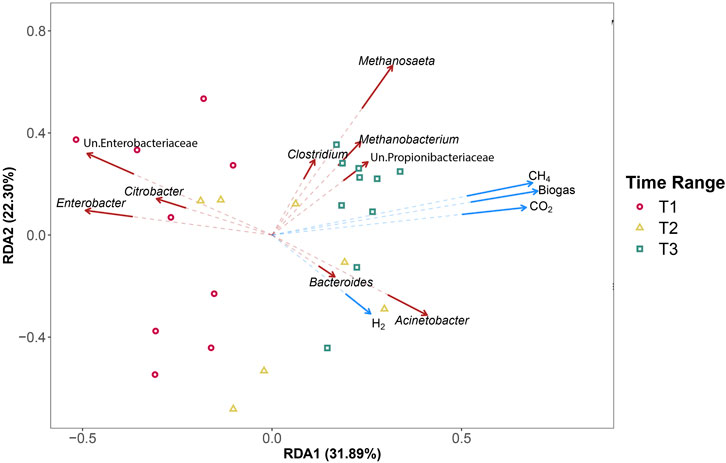
FIGURE 7. Redundancy analysis (RDA) triplot showing correlations between the production of biogas constituents (blue vectors) and selected archaeal and bacterial families (red vectors).
3.4 Implications for an energy transition in the metropolitan area of Guadalajara
In 2015, the Mexican government established a 10-year (2020–2030) plan for climate change mitigation and adaptation. The goals of this pledge included a 51% reduction in black carbon emissions, a 22% decrease in greenhouse gasses (GHG) emissions, and an overall target of 43% clean energy generation by 2030 (Instituto Nacional de Ecología y Cambio Climático, 2015). However, so far, few advances towards these goals have been achieved. In 2020, 75.22% of Mexico’s energy was obtained from fossil fuels and 24.78% from low-carbon sources (Ritchie and Roser, 2020). Based on the weighted average biogas production estimated herein (Table 4), the maximum biogas production from the AD of OFMSW was 732.8 mL⋅g−1 VS. Through this estimation, a macroscale extrapolation can be used to estimate the potential energy production. Table 5 displays the potential energetic, economic, and environmental benefits of implementing an AD system to treat the OFMSW on a larger scale. Electrical power generation from the CH4 produced could bring about an important step towards clean energy generation (Vögeli et al., 2014). In this study, a scaled process using specific experimental conditions (sorted OFMSW, mesophilic, 21 days hydraulic retention time (HRT), vinasses inoculum) has the potential to produce around 8.5 net MWh/year. This amount of energy could help reduce the energetic vulnerability of the state of Jalisco, which currently only produces 4% of the electricity it consumes (13.5 million MWh/year−1) (Agencia de Energia del Estado de Jalisco, 2019). Despite the relatively low contribution to the energy demand, the proposed scenario has the potential to mitigate 10 Mt of CO2eq, which represents more than 10% of the entire GHG emissions produced in the MAG for MSW management (Lara-topete et al., 2022). Furthermore, treatment of the OFMSW would help release some of the pressure on local sanitary landfills that are being saturated due to the high rates of MSW generation and low recycling rates (less than 5%) (Lara-topete et al., 2022). AD has several advantages over composting, such as smaller surface area requirements and a shorter treatment period (20–30 days vs. 2–3 months) to handle the OFMSW generated (Bezama et al., 2007). Moreover, large OFMSW composting facilities, such as “Bordo Poniente” in Mexico City (with an incoming rate of 2,500 tonnes·day−1), have reported incomplete stabilization processes due to ineffective aeration and lack of equipment and staff to operate the plant (González-Moreno and Olvera-Pérez, 2014).
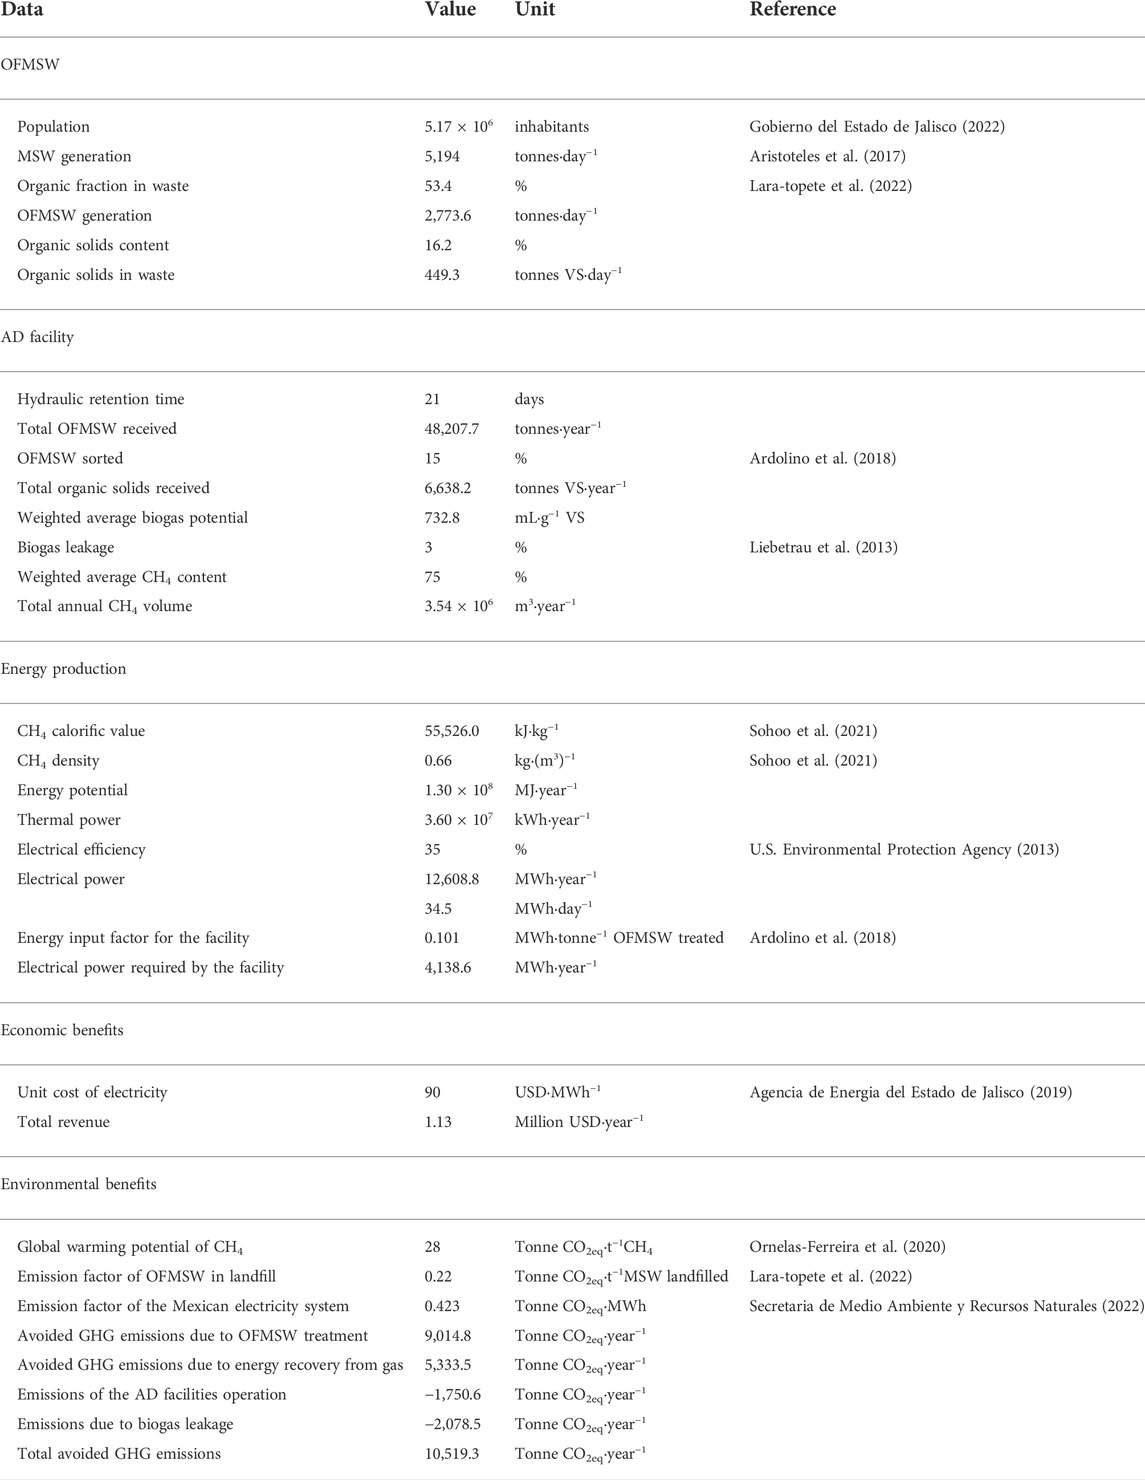
TABLE 5. Estimations of power production, economic and environmental benefits in the MAG through the AD of OFMSW.
The information generated herein can contribute to scaling up and implementing the AD process in the MAG. For instance, even though biogas production occurred during the entire test (20 days), a substantial decrease was observed throughout the process. This behavior was confirmed with the kinetic modelling, in which the biogas production rate constant k decreased from 10.99 to 1.72 mL⋅g−1 VS⋅h−1 between the first and the second stage. Furthermore, in two of the three socioeconomic strata samples, CH4 production stopped after 10–12 days. As previously discussed, both of these events could be triggered by the accumulation of VFAs, since methanogens are extremely sensitive to high concentrations of VFAs (Bezama et al., 2007). Another cause could be the different pH requirements between pivotal microbial groups like acidogens/acetogens (acid-weak environments) (Bezama et al., 2007; Vögeli et al., 2014) and methanogens (7.0–7.2, with inhibition below 6.2) (Bezama et al., 2007). These inhibitory effects could be addressed by the implementation of a two-stage AD (TAD) process, where the hydrolysis, acidogenesis and acetogenesis phases are physically separated from the methanogenic process (Cremonez et al., 2021). Indeed, TAD has demonstrated increases in energy yield (between 16 and 33%), chemical oxygen demand removal efficiency (16%), and VS removal efficiency (16% for food waste) when compared to single-stage AD (Srisowmeya et al., 2020).
Moreover, despite the similarity in the VS/TS (%) of the OFMSW between the three socioeconomic strata samples, a difference in AD performance was observed. This was attributed to possible differences in bromatological characteristics of the samples, primarily in the fat, oil, and protein contents. This issue could be addressed by the co-digestion of food wastes with other organic feedstocks, which can increase the availability of key nutrients and promote synergistic effects between microorganisms (Braguglia et al., 2018). Some feedstocks that are thought to enhance biogas production of kitchen and food wastes are livestock and agricultural wastes. This represents a huge opportunity in the MAG, as Jalisco generates more than 2.94 million tonnes of waste annually during food production (Achinas et al., 2017; Odejobi et al., 2022). Moreover, identifying the key environmental factors that are associated with the poor performance of the AD system would allow for the selection appropriate co-digestion feedstocks. In the case of VFA accumulation during AD of kitchen waste, a co-digestion with agricultural waste or sewage sludge could minimize or avoid this problem (Odejobi et al., 2022). Additionally, animal waste contains a wide variety of macro- and micro-nutrients that can balance the available nutrients in the substrate and improve the AD microbiome performance (Braguglia et al., 2018; Odejobi et al., 2022).
Further studies, in which operational factors (like C/N ratio, VFAs, NH4+-N, and pH) are measured throughout the AD of the OFMSW, are needed to identify optimization opportunities. For example, the impact of these factors could be evaluated through an RDA to provide insights into which of these factors are inhibiting the activity and proliferation of the different members of the AD microbiome (Zheng et al., 2021). Additionally, co-digestion opportunities should be identified that balance the nutrient supplementation of the feedstock and enhance biogas production through a deeper characterization of the OFMSW of the MAG (physicochemical characteristics e.g., calorific value, particle size, TOC, and ultimate analysis). Moreover, a life cycle environmental assessment considering several reactor configurations, digestate applications, and a whole set of impact categories must be performed to validate the benefits of implementing AD in the MAG. Finally, an economical assessment should be conducted to evaluate the large-scale feasibility of the proposed methods considering the current budget and expenses of the local government for the management of MSW.
4 Conclusion
Biochemical methane potential assays of OFMSW composite samples from three socioeconomic strata within the MAG were successfully performed. A comparison of the biogas and methane yields of the OFMSW among the three socioeconomic strata showed no significant differences. Nonetheless, the biogas composition (CH4 and CO2) was significantly different between the low and medium strata compared to the high stratum, which displayed overall lower CH4 and higher CO2 concentrations. This may be due to differences in consumption patterns among the various socioeconomic strata. A multi-stage Gompertz kinetic model was used to describe the cumulative biogas production curves for all three strata, as well as for a weighted average based on the proportion of the population in each socioeconomic strata in the MAG. Through this extrapolation, the biogas potential production using the OFMSW of the MAG was estimated to be 732.8 mL⋅g−1 VS. Furthermore, three sampling periods were established to analyze microbial changes within the AD system and to link the microbial communities with the four stages of AD based on the relevant literature. This resulted in the identification of two methanogenic pathways (hydrogenotrophic and acetoclastic), as well as two genera responsible for CH4 production (Methanobacterium and Methanosaeta). Additionally, understanding the relationships between microbial communities and biogas composition (CH4, CO2, and H2) helped to pinpoint important microbial functions and relevant correlations. On a larger scale, this knowledge could be used to establish specific operational conditions and supplementation requirements to enhance microbial growth and methanogenesis.
In this study, the potential energetic, economic, and environmental benefits of implementing an AD system to treat the OFMSW on a large scale in the MAG were estimated. Although the potential electrical power that could be produced through this system (8.5 MWh·year−1) was found to be low considering the total electricity consumed in the MAG (13.5 million MWh·year−1), a 10% reduction in GHG emissions could be achieved (10 Mt of CO2eq). Additionally, the treatment of the OFMSW through AD could help mitigate the current saturation issues faced at local sanitary landfills. The aim of this work was to demonstrate, both from a micro- and macroscale perspective, the potential of using AD for the treatment of the OFMSW produced in the MAG. These findings can now be used for the generation of new policies to promote a more sustainable energy scenario in Mexico.
Data availability statement
The datasets presented in this study can be found in online repositories. The names of the repository/repositories and accession number(s) can be found below: https://www.ncbi.nlm.nih.gov/, PRJNA869462.
Ethics statement
Ethical review and approval was not required for the study on human participants in accordance with the local legislation and institutional requirements. Written informed consent from the participants was not required to participate in this study in accordance with the national legislation and the institutional requirements.
Author contributions
Conceptualization, FI-E and MG-H; Data curation, MV-G and MG-L; Formal analysis, FI-E, MV-G, and MG-L; Funding acquisition, MG-H and OA-J; Investigation, GL-T, MV-G, and OA-J; Methodology, OA-J; Project administration, MG-H; Resources, MG-H and OA-J; Software, MV-G and MG-L; Supervision, MG-H; Validation, CS-G and DO-N; Visualization, FI-E, MV-G and MG-L; Roles/Writing—original draft, FI-E, MV-G, GL-T and MG-L; Writing- review & editing, MG-H, and DO-N.
Funding
The authors would like to gratefully acknowledge and thank the State Council of Science and Technology of Jalisco (COECYTJAL, by its acronym in Spanish) for financially supporting this work through the project number 8226 “CALIDAD Y CANTIDAD DE BIOGÁS Y DIGESTATO PROVENIENTES DE LA FORSU DEL ÁREA METROPOLITANA DE GUADALAJARA, EVALUACIÓN DE ESCENARIOS.”
Acknowledgments
The authors gratefully acknowledge the technical support of Diego Díaz-Vázquez, and Enrique Cervantes-Astorga and the administrative support of Tecnologico de Monterrey campus Guadalajara and Consejo Nacional de Ciencia y Tecnologia (CONACYT).
Conflict of interest
The authors declare that the research was conducted in the absence of any commercial or financial relationships that could be construed as a potential conflict of interest.
Publisher’s note
All claims expressed in this article are solely those of the authors and do not necessarily represent those of their affiliated organizations, or those of the publisher, the editors and the reviewers. Any product that may be evaluated in this article, or claim that may be made by its manufacturer, is not guaranteed or endorsed by the publisher.
References
Achinas, S., Achinas, V., and Euverink, G. J. W. (2017). A technological overview of biogas production from biowaste. Engineering 3 (3), 299–307. doi:10.1016/J.ENG.2017.03.002
Agencia de Energia del Estado de Jalisco (AEEJ) (2019). Jalisco recargado plan estatal de Energía. Guadalajara: Agencia de Energía del Estado de Jalisco.
Alibardi, L., and Cossu, R. (2015). Composition variability of the organic fraction of municipal solid waste and effects on hydrogen and methane production potentials. Waste Manag. 36, 147–155. doi:10.1016/j.wasman.2014.11.019
Amani, T., Nosrati, M., and Sreekrishnan, T. R. (2010). Anaerobic digestion from the viewpoint of microbiological, chemical, and operational aspects - a review. Environ. Rev. 18 (1), 255–278. doi:10.1139/A10-011
Ardolino, F., Parrillo, F., and Arena, U. (2018). Biowaste-to-biomethane or biowaste-to-energy? An LCA study on anaerobic digestion of organic waste. J. Clean. Prod. 174, 462–476. doi:10.1016/j.jclepro.2017.10.320
Aristoteles, J., et al. (2017). Programa Estatal para la Prevención y Gestión Integral de Residuos del Estado de Jalisco 2016-2022. Guadalajara: Gobierno de Guadalajara.
Atelge, M. R., Krisa, D., Kumar, G., Eskicioglu, C., Nguyen, D. D., Chang, S. W., et al. (2020). Biogas production from organic waste: Recent progress and perspectives. Waste Biomass Valorization 11 (3), 1019–1040. doi:10.1007/s12649-018-00546-0
Ayodele, T. R., Ogunjuyigbe, A. S. O., and Alao, M. A. (2018). Economic and environmental assessment of electricity generation using biogas from organic fraction of municipal solid waste for the city of Ibadan, Nigeria. J. Clean. Prod. 203, 718–735. doi:10.1016/j.jclepro.2018.08.282
Behrooznia, L., Sharifi, M., and Hosseinzadeh-Bandbafha, H. (2020). Comparative life cycle environmental impacts of two scenarios for managing an organic fraction of municipal solid waste in Rasht-Iran. J. Clean. Prod. 268, 122217. doi:10.1016/j.jclepro.2020.122217
Benitez Fonseca, M., Abalos Rodríguez, A., and Rodríguez Pérez, S. (2020). Co- digestión anaerobia de la fracción orgánica de residuos sólidos urbanos y su lixiviado. Rev. Colomb. Biotecnol. 22 (2), 70–81. doi:10.15446/rev.colomb.biote.v22n2.70345
Bezama, A., Aguayo, P., Konrad, O., Navia, R., and Lorber, K. E. (2007). Investigations on mechanical biological treatment of waste in South America: Towards more sustainable MSW management strategies. Waste Manag. 27 (2), 228–237. doi:10.1016/j.wasman.2006.01.010
Bioprocess Control Sweden AB (2016). AMPTS II & AMPTS II light automatic methane potential test system. Lund: Bioprocess Control.
Bokulich, N. A., Kaehler, B. D., Rideout, J. R., Dillon, M., Bolyen, E., Knight, R., et al. (2018). Optimizing taxonomic classification of marker-gene amplicon sequences with QIIME 2’s q2-feature-classifier plugin. Microbiome 6 (1), 90. doi:10.1186/s40168-018-0470-z
Borcard, D., Gillet, F., and Legendre, P. (2011). Numerical Ecology with R. New York, NY: Springer New York. doi:10.1007/978-1-4419-7976-6
Braguglia, C. M., Gallipoli, A., Gianico, A., and Pagliaccia, P. (2018). Anaerobic bioconversion of food waste into energy: A critical review. Bioresour. Technol. 248, 37–56. doi:10.1016/j.biortech.2017.06.145
Campuzano, R., and González-Martínez, S. (2016). Characteristics of the organic fraction of municipal solid waste and methane production: A review. Waste Manag. 54, 3–12. doi:10.1016/j.wasman.2016.05.016
Carballa, M., Smits, M., Etchebehere, C., Boon, N., and Verstraete, W. (2011). Correlations between molecular and operational parameters in continuous lab-scale anaerobic reactors. Appl. Microbiol. Biotechnol. 89 (2), 303–314. doi:10.1007/s00253-010-2858-y
Carbone, S. R., da Silva, F. M., Tavares, C. R. G., and Dias Filho, B. P. (2002). Bacterial population of a two-phase anaerobic digestion process treating effluent of cassava starch factory. Environ. Technol. (United Kingdom) 23 (5), 591–597. doi:10.1080/09593332308618386
Casa Herradura (2022). Tequila Herradura. Available at: www.herradura.com/mx/.
Castellano-Hinojosa, A., Armato, C., Pozo, C., Gonzalez-Martinez, A., and Gonzalez-Lopez, J. (2018). New concepts in anaerobic digestion processes: Recent advances and biological aspects. Appl. Microbiol. Biotechnol. 102 (12), 5065–5076. doi:10.1007/s00253-018-9039-9
Chaudhari, A. B., Suryawanshi, P. C., and Kothari, R. M. (2011). “Microbial aspects of anaerobic digestion for biogas production,” in Anaerobic digestion: Processes, products and applications (New York: Nova Science Publishers, Inc.), 149–174.
Chen, S., Cheng, H., Wyckoff, K. N., and He, Q. (2016). Linkages of Firmicutes and Bacteroidetes populations to methanogenic process performance. J. Ind. Microbiol. Biotechnol. 43 (6), 771–781. doi:10.1007/s10295-016-1760-8
CIATEJ (2022). CIATEJ sede Guadalajara. Available at: https://ciatej.mx/el-ciatej/sede/guadalajara (Accessed: May 9, 2022).
Clarke, K. R. (1993). Non-parametric multivariate analyses of changes in community structure. Austral Ecol. 18 (1), 117–143. doi:10.1111/j.1442-9993.1993.tb00438.x
Coneval (2020). Indice de rezago social 2020, anexos. Available at: https://www.coneval.org.mx/Medicion/IRS/Paginas/Indice_Rezago_Social_2020.aspx (Accessed: January 6, 2022).
Cremonez, P. A., Teleken, J. G., Weiser Meier, T. R., and Alves, H. J. (2021). Two-stage anaerobic digestion in agroindustrial waste treatment: A review. J. Environ. Manag. 281, 111854. doi:10.1016/j.jenvman.2020.111854
Cudjoe, D., Han, M. S., and Nandiwardhana, A. P. (2020). Electricity generation using biogas from organic fraction of municipal solid waste generated in provinces of China: Techno-economic and environmental impact analysis. Fuel Process. Technol. 203, 106381. doi:10.1016/j.fuproc.2020.106381
Delgadillo Mirquez, L., Machado Higuera, M., and Hernández Sarabia, M. (2018). Mathematical modelling and simulation for biogas production from organic waste. Int. J. Eng. Syst. Model. Simul. 10 (2), 97. doi:10.1504/ijesms.2018.10013112
Dixon, P. (2003). VEGAN, a package of R functions for community ecology. J. Veg. Sci. 14 (6), 927–930. doi:10.1111/j.1654-1103.2003.tb02228.x
Ebrahimzade, I., Ebrahimi-Nik, M., Rohani, A., and Tedesco, S. (2022). Towards monitoring biodegradation of starch-based bioplastic in anaerobic condition: Finding a proper kinetic model. Bioresour. Technol. 347, 126661. doi:10.1016/j.biortech.2021.126661
El Baz, F., Arjdal, S., Bakrim, M., Mediouni, T., and Faska, N. (2020). Methanisation of Agadir urban solid waste: Theoretical evaluation of the energy production potential. Mater. Today Proc. 22, 97–99. doi:10.1016/j.matpr.2019.08.102
Ellacuriaga, M., García-Cascallana, J., and Gómez, X. (2021). Biogas production from organic wastes: Integrating concepts of circular economy. Fuels 2 (2), 144–167. doi:10.3390/fuels2020009
Ferronato, N., and Torretta, V. (2019). Waste mismanagement in developing countries: A review of global issues. Int. J. Environ. Res. Public Health 16 (6), 1060. doi:10.3390/ijerph16061060
Filer, J., Ding, H. H., and Chang, S. (2019). Biochemical methane potential (BMP) assay method for anaerobic digestion research. Water 11 (921). doi:10.3390/w11050921
Garibay, M. V., Fernandez del Castillo, A., Diaz Torres, O., de Anda, J., Yebra-Montes, C., Senes-Guerrero, C., et al. (2021). Characterization of the spatial variation of microbial communities in a decentralized subtropical wastewater treatment plant using passive methods. WaterSwitzerl. 13 (9), 1157. doi:10.3390/w13091157
Gobierno del Estado de Jalisco (2022). Área Metropolitana de Guadalajara | Gobierno del Estado de Jalisco. Available at: https://www.jalisco.gob.mx/es/jalisco/guadalajara (Accessed: September 17, 2021).
Gomes, C. S., Strangfeld, M., and Meyer, M. (2021). Diauxie studies in biogas production from gelatin and adaptation of the modified gompertz model: Two-phase gompertz model. Appl. Sci. Switz. 11 (3), 1067. doi:10.3390/app11031067
Gonzalez-Martinez, A., Garcia-Ruiz, M. J., Rodriguez-Sanchez, A., Osorio, F., and Gonzalez-Lopez, J. (2016). Archaeal and bacterial community dynamics and bioprocess performance of a bench-scale two-stage anaerobic digester. Appl. Microbiol. Biotechnol. 100 (13), 6013–6033. doi:10.1007/s00253-016-7393-z
González-Moreno, S. B., and Olvera-Pérez, G. E. (2014). Caracterización de la composta producida en la planta de bordo poniente. Mexico City: Univerisdad Autónoma Metropolitana Azcapotzalco.
Guo, B., Zhang, L., Sun, H., Gao, M., Yu, N., Zhang, Q., et al. (2022). Microbial co-occurrence network topological properties link with reactor parameters and reveal importance of low-abundance genera. npj Biofilms Microbiomes 8 (1), 3–13. doi:10.1038/s41522-021-00263-y
Guo, J., Peng, Y., Ni, B. J., Han, X., Fan, L., and Yuan, Z. (2015). Dissecting microbial community structure and methane-producing pathways of a full-scale anaerobic reactor digesting activated sludge from wastewater treatment by metagenomic sequencing. Microb. Cell Fact. 14 (1), 33–11. doi:10.1186/s12934-015-0218-4
Hagos, K., Zong, J., Li, D., Liu, C., and Lu, X. (2017). Anaerobic co-digestion process for biogas production: Progress, challenges and perspectives. Renew. Sustain. Energy Rev. 76, 1485–1496. doi:10.1016/j.rser.2016.11.184
Halder, P. K., Paul, N., Joardder, M., Khan, M., and Sarker, M. (2016). Feasibility analysis of implementing anaerobic digestion as a potential energy source in Bangladesh. Renew. Sustain. Energy Rev. 65, 124–134. doi:10.1016/j.rser.2016.06.094
Hall, M., and Beiko, R. G. (2018). 16S rRNA gene analysis with QIIME2. Methods Mol. Biol. 1849, 113–129. doi:10.1007/978-1-4939-8728-3_8
Hassaneen, F. Y., Abdallah, M. S., Ahmed, N., Taha, M. M., Abd ElAziz, S. M. M., El-Mokhtar, M. A., et al. (2020). Innovative nanocomposite formulations for enhancing biogas and biofertilizers production from anaerobic digestion of organic waste. Bioresour. Technol. 309, 123350. doi:10.1016/j.biortech.2020.123350
Heck, K. L., van Belle, G., and Simberloff, D. (1975). Explicit calculation of the rarefaction diversity measurement and the determination of sufficient sample size. Ecology 56 (6), 1459–1461. doi:10.2307/1934716
Hurlbert, S. H. (1971). The nonconcept of species diversity: A critique and alternative parameters. Ecology 52 (4), 577–586. doi:10.2307/1934145
Iltchenco, J., Peruzzo, V., Eva Magrini, F., Marconatto, L., Paula Torres, A., Luiz Beal, L., et al. (2021). Microbiota profile in mesophilic biodigestion of sugarcane vinasse in batch reactors. Water Sci. Technol. 84 (8), 2028–2039. doi:10.2166/wst.2021.375
INEGI (2020). Número de habitantes. Jalisco: INEGI. Available at: http://cuentame.inegi.org.mx/monografias/informacion/jal/poblacion/ (Accessed September 29, 2021).
Instituto Nacional de Ecología y Cambio Climático (2015). Compromisos de Mitigación y Adaptacipon ante el Cambio Climático para el Periodo 2020-2030. Mexico City: Instituto Nacional de Ecología y Cambio Climático.
Jákói, Z., Hodúr, C., and Beszédes, S. (2022). Monitoring the process of anaerobic digestion of native and microwave pre-treated sludge by dielectric and rheological measurements. Water 14 (8), 1294. doi:10.3390/w14081294
Jiménez, D. J., Korenblum, E., and Van Elsas, J. D. (2014). Novel multispecies microbial consortia involved in lignocellulose and 5-hydroxymethylfurfural bioconversion. Appl. Microbiol. Biotechnol. 98 (6), 2789–2803. doi:10.1007/s00253-013-5253-7
Karki, R., Chuenchart, W., Surendra, K., Sung, S., Raskin, L., and Khanal, S. K. (2022). Anaerobic co-digestion of various organic wastes: Kinetic modeling and synergistic impact evaluation. Bioresour. Technol. 343, 126063. doi:10.1016/j.biortech.2021.126063
Kaza, S., Yao, L., Badha-Tata, P., and Van Woerden, F. (2018). What a waste 2.0 A global snapshot of solid waste management to 2050. Washington: International Bank for Reconstruction and Development.
Khan, D., Kumar, A., and Samadder, S. R. (2016). Impact of socioeconomic status on municipal solid waste generation rate. Waste Manag. 49, 15–25. doi:10.1016/j.wasman.2016.01.019
Khatami, K., Atasoy, M., Ludtke, M., Baresel, C., Eyice, O., and Cetecioglu, Z. (2021). Bioconversion of food waste to volatile fatty acids: Impact of microbial community, pH and retention time. Chemosphere 275, 129981. doi:10.1016/j.chemosphere.2021.129981
Kuczynski, J., Stombaugh, J., Walters, W. A., Gonzalez, A., Caporaso, J. G., and Knight, R. (2011). Using QIIME to analyze 16S rRNA gene sequences from microbial communities. Curr. Protoc. Bioinforma. 36 (1), 1–20. doi:10.1002/0471250953.bi1007s36
Lara-topete, G. O., Yebra-Montes, C., Orozco-Nunnelly, D. A., Robles-Rodriguez, C. E., and Gradilla-Hernandez, M. S. (2022). An integrated environmental assessment of MSW management in a large city of a developing country : Taking the first steps towards a circular economy model. Front. Environ. Sci. 10, 1–20. doi:10.3389/fenvs.2022.838542
Liebetrau, J., Reinelt, T., Clemens, J., Hafermann, C., Friehe, J., and Weiland, P. (2013). Analysis of greenhouse gas emissions from 10 biogas plants within the agricultural sector. Water Sci. Technol. 67 (6), 1370–1379. doi:10.2166/wst.2013.005
Love, M., Anders, S., and Huber, W. (2014). Moderated estimation of fold change and dispersion for RNA-seq data with DESeq2. Genome Biol. 15 (10), 550. doi:10.1186/s13059-014-0550-8
McDonald, D., Price, M. N., Goodrich, J., Nawrocki, E. P., DeSantis, T. Z., Probst, A., et al. (2012). An improved Greengenes taxonomy with explicit ranks for ecological and evolutionary analyses of bacteria and archaea. ISME J. 6 (3), 610–618. doi:10.1038/ismej.2011.139
Morero, B., Vicentin, R., and Campanella, E. A. (2017). Assessment of biogas production in Argentina from co-digestion of sludge and municipal solid waste. Waste Manag. 61, 195–205. doi:10.1016/j.wasman.2016.11.033
Mouftahi, M., Tlili, N., Hidouri, N., Bartocci, P., and Fantozzi, F. (2021). Bioenergy recovery from southern Tunisia’s organic wastes: Analysis and kinetic modeling study of biomethane production. Biomass Convers. Biorefinery, 1–17. doi:10.1007/s13399-021-01684-7
Nwokolo, N., Mukumba, P., Obileke, K., and Enebe, M. (2020). Waste to energy: A focus on the impact of substrate type in biogas production. Processes 8 (10), 1224. doi:10.3390/pr8101224
Odejobi, O. J., Ajala, O. O., and Osuolale, F. N. (2022). Review on potential of using agricultural, municipal solid and industrial wastes as substrates for biogas production in Nigeria. Biomass Convers. Biorefinery. doi:10.1007/s13399-022-02613-y
OECD (2021). Municipal waste. Available at: https://doi.org/10.1787/89d5679a-en (Accessed September 17, 2021).
Oksanen, J., Blanchet, F. G., Kindt, R., Legendre, P., Minchin, P., O’Hara, R. B., et al. (2012). Vegan: Community ecology package. R package version 2.0-2. Available at: https://www.researchgate.net/publication/282247686_Vegan_Community_Ecology_Package_R_package_version_20-2 (Accessed July 26, 2022).
Ornelas-Ferreira, B., Lobato, L. C. S., Colturato, L. F. D., Torres, E. O., Pombo, L. M., Pujatti, F. J. P., et al. (2020). Strategies for energy recovery and gains associated with the implementation of a solid state batch methanization system for treating organic waste from the city of Rio de Janeiro - Brazil. Renew. Energy 146, 1976–1983. doi:10.1016/j.renene.2019.08.049
Panigrahi, S., Sharma, H. B., and Dubey, B. K. (2020). Anaerobic co-digestion of food waste with pretreated yard waste: A comparative study of methane production, kinetic modeling and energy balance. J. Clean. Prod. 243, 118480. doi:10.1016/j.jclepro.2019.118480
Pardilhó, S., Pires, J. C., Boaventura, R., Almeida, M., and Maia Dias, J. (2022). Biogas production from residual marine macroalgae biomass: Kinetic modelling approach. Bioresour. Technol. 359, 127473. doi:10.1016/j.biortech.2022.127473
Pavi, S., Kramer, L. E., Gomes, L. P., and Miranda, L. A. S. (2017). Biogas production from co-digestion of organic fraction of municipal solid waste and fruit and vegetable waste. Bioresour. Technol. 228, 362–367. doi:10.1016/j.biortech.2017.01.003
Pererva, Y., Miller, C. D., and Sims, R. C. (2020). Existing empirical kinetic models in biochemical methane potential (BMP) testing, their selection and numerical solution. Water 12 (6), 1831. doi:10.3390/w12061831
Pérez-Tepayo, S., Rodriguez-Ramirez, S., Unar-Munguia, M., and Shamah-Levy, T. (2020). Trends in the dietary patterns of Mexican adults by sociodemographic characteristics. Nutr. J. 19 (1), 51–10. doi:10.1186/s12937-020-00568-2
Pulami, D., Schauss, T., Eisenberg, T., Wilharm, G., Blom, J., Goesmann, A., et al. (2020). Acinetobacter baumannii in manure and anaerobic digestates of German biogas plants. FEMS Microbiol. Ecol. 96 (10), fiaa176–20. doi:10.1093/femsec/fiaa176
Qin, S., Wainaina, S., Liu, H., Soufiani, A. M., Pandey, A., Zhang, Z., et al. (2021)., 303. Fuel, 121276. doi:10.1016/j.fuel.2021.121276Microbial dynamics during anaerobic digestion of sewage sludge combined with food waste at high organic loading rates in immersed membrane bioreactorsFuel (Lond).
Ramette, A. (2007). Multivariate analyses in microbial ecology. FEMS Microbiol. Ecol. 62 (2), 142–160. doi:10.1111/j.1574-6941.2007.00375.x
Ritchie, H., and Roser, M. (2020). Mexico: Energy country profile - our world in data. Available at: https://ourworldindata.org/energy/country/mexico (Accessed September 29, 2021).
Rodrigues, R. P., Rodrigues, D., Klepacz-Smolka, A., Martins, R., and Quina, M. (2019). Comparative analysis of methods and models for predicting biochemical methane potential of various organic substrates. Sci. Total Environ. 649, 1599–1608. doi:10.1016/j.scitotenv.2018.08.270
Sangamithirai, K. M., Jayapriya, J., Hema, J., and Manoj, R. (2015). Evaluation of in-vessel co-composting of yard waste and development of kinetic models for co-composting. Int. J. Recycl. Org. Waste Agric. 4 (3), 157–165. doi:10.1007/s40093-015-0095-1
Scarlat, N., Dallemand, J. F., and Fahl, F. (2018). Biogas: Developments and perspectives in europe. Renew. Energy 129, 457–472. doi:10.1016/j.renene.2018.03.006
Secretaria de Medio Ambiente y Recursos Naturales (2022). Factor de Emisión del Sistema Eléctrico Nacional 2021. Available at: https://www.gob.mx/cms/uploads/attachment/file/706809/aviso_fesen_2021.pdf (Accessed July 26, 2022).
Secretaria de Salud (1994). Norma oficial mexicana NOM-116-SSA1-1994. Bienes y servicios. Determinación de humedad en alimentos por tratamiento térmico. Método por arena o gasa. Available at: http://www.salud.gob.mx/unidades/cdi/nom/116ssa14.html (Accessed July 26, 2022).
SEMARNAT (1985). Norma mexicana NMX-AA-15-1985. Protección al ambiente- contaminación del suelo- residuos sólidos municipales- muestreo- método de cuarteo. Available at: https://www.gob.mx/semarnat/acciones-y-programas/normatividad-aplicable-al-tema-de-residuos (Accessed July 26, 2022).
SEPLAN (2022). Mapa municipal :: Mide. Available at: https://mide.jalisco.gob.mx/mide/panelCiudadano/mapaMunicipal/182?format=&indicadorTablaDatos=182&accionRegreso=detalleIndicador (Accessed September 17, 2021).
Sohoo, I., Ritzkowski, M., Heerenklage, J., and Kuchta, K. (2021). Biochemical methane potential assessment of municipal solid waste generated in asian cities: A case study of karachi, Pakistan. Renew. Sustain. Energy Rev. 135, 110175. doi:10.1016/j.rser.2020.110175
Srisowmeya, G., Chakravarthy, M., and Nandhini Devi, G. (2020). Critical considerations in two-stage anaerobic digestion of food waste – a review. Renew. Sustain. Energy Rev. 119, 109587. doi:10.1016/j.rser.2019.109587
TU Delft (2022). Automatic methane potential test system (AMPTS). Available at: https://www.tudelft.nl/citg/over-faculteit/afdelingen/watermanagement/research/waterlab/equipment/automatic-methane-potential-test-system-ampts (Accessed: September 28, 2021).
Turgay, M., Bachmann, H.-P., Irmler, S., von Ah, U., Fröhlich-Wyder, M.-T., Falentin, H., et al. (2022). “Bacteria, beneficial: Propionibacterium spp. and acidipropionibacterium spp.,” in Encyclopedia of dairy sciences, 34–45. doi:10.1016/B978-0-08-100596-5.23016-3
Tyagi, V. K., Bhatia, A., Kubota, K., Rajpal, A., Ahmed, B., Khan, A. A., et al. (2021). Microbial community dynamics in anaerobic digesters treating organic fraction of municipal solid waste. Environ. Technol. Innov. 21, 101303. doi:10.1016/j.eti.2020.101303
United Nations Development Programme (2022). THE 17 GOALS | sustainable development. Available at: https://sdgs.un.org/es/goals (Accessed: September 27, 2021).
U.S. Environmental Protection Agency (2013). CHP project development handbook. Washington: Environmental Protection Agency.
U.S. Environmental Protection Agency (2001). Method 1684 total, fixed, and volatile solids in water, solids and biosolids. Washington: Environmental Protection Agency.
Venkiteshwaran, K., Bocher, B., Maki, J., and Zitomer, D. (2015). Relating anaerobic digestion microbial community and process function : Supplementary issue: Water microbiology. Microbiol. Insights 8s2, MBI.S33593. doi:10.4137/mbi.s33593
Vigneswaran, S., Kandasamy, J., and Johir, M. A. H. (2016). Sustainable operation of composting in solid waste management. Procedia Environ. Sci. 35, 408–415. doi:10.1016/j.proenv.2016.07.022
Vinti, G., Bauza, V., Clasen, T., Medlicott, K., Tudor, T., Zurbrugg, C., et al. (2021). Municipal solid waste management and adverse health outcomes: A systematic review. Int. J. Environ. Res. Public Health 18 (8), 4331–4357. doi:10.3390/ijerph18084331
Vögeli, Y., Lohri, C. R., Gallardo, A., Diener, S., and Zurbrugg, C. (2014). Anaerobic digestion of biowaste in developing countries. Sandec: Department of Water and Sanitation in Developing Countries. Available at: http://www.eawag.ch/forschung/sandec/publikationen/swm/dl/biowaste.pdf.
Vos, M. B., Kaar, J. L., Welsh, J. A., Van Horn, L. V., Feig, D. I., Anderson, C. A., et al. (2017). Added sugars and cardiovascular disease risk in children: A scientific statement from the American Heart Association. Circulation 135 (19), e1017e1017–e1034. doi:10.1161/CIR.0000000000000439
WHO (2015). Waste and human health. Bonn, Germany: WHO, 35. Available at: http://www.euro.who.int/pubrequest%0Ahttp://www.euro.who.int/__data/assets/pdf_file/0003/317226/Waste-human-health-Evidence-needs-mtg-report.pdf?ua=1.
Wirth, R., Pap, B., Dudits, D., Kakuk, B., Bagi, Z., Shetty, P., et al. (2021). Genome-centric investigation of anaerobic digestion using sustainable second and third generation substrates. J. Biotechnol. 339, 53–64. doi:10.1016/j.jbiotec.2021.08.002
Xiao, L., Deng, Z., Fung, K. Y., and Ng, K. M. (2013). Biohydrogen generation from anaerobic digestion of food waste. Int. J. Hydrogen Energy 38 (32), 13907–13913. doi:10.1016/j.ijhydene.2013.08.072
Yi, J., Dong, B., Jin, J., and Dai, X. (2014). Effect of increasing total solids contents on anaerobic digestion of food waste under mesophilic conditions: Performance and microbial characteristics analysis. PLoS ONE 9 (7), e102548. doi:10.1371/journal.pone.0102548
Yingthavorn, N., Noynoo, L., Boonkamnerd, T., Rakmak, N., and Siripatana, C. (2020). Biochemical methane potential of palm oil mill effluent (POME) co-digested with rubber latex effluent (LTE): Effect of POME/LTE ratio and temperature. Walailak J. Sci. Technol. 17 (12), 1321–1334. doi:10.48048/wjst.2021.6495
Yong, Z. J., Bashir, M. J. K., and Hassan, M. S. (2021). Biogas and biofertilizer production from organic fraction municipal solid waste for sustainable circular economy and environmental protection in Malaysia. Sci. Total Environ. 776, 145961. doi:10.1016/j.scitotenv.2021.145961
Zamri, M. F. M. A., Hasmady, S., Akhiar, A., Ideris, F., Shamsuddin, A., Mofijur, M., et al. (2021). A comprehensive review on anaerobic digestion of organic fraction of municipal solid waste. Renew. Sustain. Energy Rev. 137, 110637. doi:10.1016/j.rser.2020.110637
Zhang, K., Song, L., and Dong, X. (2010). Proteiniclasticum ruminis gen. nov., sp. nov., a strictly anaerobic proteolytic bacterium isolated from yak rumen. Int. J. Syst. Evol. Microbiol. 60 (9), 2221–2225. doi:10.1099/ijs.0.011759-0
Zhang, W., Xing, W., and Li, R. (2018). Real-time recovery strategies for volatile fatty acid-inhibited anaerobic digestion of food waste for methane production. Bioresour. Technol. 265, 82–92. doi:10.1016/j.biortech.2018.05.098
Zhang, Y., Sun, R., Varrone, C., Wei, Y., Shyryn, A., Zhou, A., et al. (2020). Enhanced acetogenesis ofwaste activated sludge by conditioning with processed organic wastes in co-fermentation: Kinetics, performance and microbial response. Energies 13 (14), 3630. doi:10.3390/en13143630
Zheng, Y., Wang, P., Yang, X., Lin, P., Wang, Y., Cheng, M., et al. (2021). Process performance and microbial communities in anaerobic Co-digestion of sewage sludge and food waste with a lower range of carbon/nitrogen ratio. Bioenergy Res. 15, 1664–1674. doi:10.1007/s12155-021-10357-2
Keywords: anaerobic digestion, organic fraction municipal solid waste, biogas, methane potential, organic waste, developing country, biochemical methane potential
Citation: Ibarra-Esparza FE, Verduzco Garibay M, Lara-Topete GO, González-López ME, Orozco-Nunnelly DA, Aguilar-Juárez O, Senés-Guerrero C and Gradilla-Hernández MS (2022) A micro- and macro-scale look at the biochemical methanogenic potential of the organic fraction of municipal solid waste generated in a large city of a developing country. Front. Environ. Sci. 10:1020208. doi: 10.3389/fenvs.2022.1020208
Received: 15 August 2022; Accepted: 30 September 2022;
Published: 14 October 2022.
Edited by:
Toufiq Reza, Florida Institute of Technology, United StatesCopyright © 2022 Ibarra-Esparza, Verduzco Garibay, Lara-Topete, González-López, Orozco-Nunnelly, Aguilar-Juárez, Senés-Guerrero and Gradilla-Hernández. This is an open-access article distributed under the terms of the Creative Commons Attribution License (CC BY). The use, distribution or reproduction in other forums is permitted, provided the original author(s) and the copyright owner(s) are credited and that the original publication in this journal is cited, in accordance with accepted academic practice. No use, distribution or reproduction is permitted which does not comply with these terms.
*Correspondence: Misael Sebastián Gradilla-Hernández, bXNncmFkaWxsYUB0ZWMubXg=