 Ayong Jiao
 Wenqi Wang
 Hongbo Ling
 Xiaoya Deng
 Junjie Yan4
95% of researchers rate our articles as excellent or good
Learn more about the work of our research integrity team to safeguard the quality of each article we publish.
Find out more
ORIGINAL RESEARCH article
Front. Environ. Sci. , 14 September 2022
Sec. Atmosphere and Climate
Volume 10 - 2022 | https://doi.org/10.3389/fenvs.2022.1019695
This article is part of the Research Topic Climate Change and Adaptive Capacity Building View all 15 articles
Ecological water conveyance is an important way to promote the restoration of degraded ecosystems in arid watersheds. However, there are few previous research results on how to quantitatively evaluate the effect of ecological water conveyance on ecological restoration. In this regard, this paper selects the Tarim River Basin as a typical area, analyzing the changes of desert riparian vegetation and hydrological elements, constructing a watershed ecological environment quality evaluation system, and comprehensively evaluating the ecological water conveyance effect of the damaged desert forest ecosystem. The conclusion showed that the proportion of the pixel area with an upward trend of Fractional Vegetation Cover (FVC) from 2000 to 2021 is as high as 84.3%. The plant diversity index in the ecological water conveyance area showed the characteristics of first obvious increase and then stable. The main body of groundwater depth showed an upward trend, and the Temperature Vegetation Dryness Index (TVDI) showed a downward trend of pixel area accounting for 57.0%, which indicated that ecological water conveyance had played a positive role in groundwater recharge and ecological restoration along the Tarim River. The ecological environment quality of the river basin showed a trend of transition from low-grade to high-grade, and the area with excellent ecological quality had increased from 4,635.50 km2 in 2000 to 12,335.0 km2 in 2021. The above research provides important scientific reference for the protection and restoration of vegetation degradation in arid watersheds.
Desert riparian forests are widely distributed on both sides of inland river basins in arid areas. It is a forest ecosystem with relatively single species in desert environment. They play an important role in wind prevention and sand fixation and maintaining the balance and stability of ecosystems in arid areas (Keyimu et al., 2018; Sun et al., 2022). Water is the most important environmental factor to ensure the structural integrity and functional stability of ecosystem in arid areas. However, due to the disturbance of global climate change and human activities, the shortage of water resources has become an important factor affecting the ecosystem in arid areas, which directly restricts the development and evolution of the desert riparian forest ecosystem (Adam et al., 2009; Allen and Ingram, 2012; Deng and Chen, 2017; Wang and Qin, 2017; Ni et al., 2022). In addition, the ability of desert riparian forest ecosystems to resist external disturbances and self-repair is low, exacerbating various ecological problems such as land degradation, desertification, pests and diseases, and biodiversity damage. To this end, based on the purpose of ecological protection and restoration, in order to curb the degradation of natural vegetation, ecological water conveyance work has been carried out in many regions around the world (Chen et al., 2010; Zeng et al., 2016; Zhao et al., 2020). Therefore, after ecological water conveyance, understanding the restoration status of damaged desert forest ecosystems and the effect of ecological water conveyance has become a hot topic in the research on ecosystem restoration and protection in arid areas.
Desert riparian forests are mainly distributed in Central Asia, the Murray-Darling Basin in Australia, the Colorado River Basin in the western United States and northwestern China (Ding et al., 2017; Zhang et al., 2018). A large number of studies have shown that groundwater and soil moisture are the key factors to maintain the normal growth and development of desert riparian forests. The change of groundwater level directly affects the development of natural vegetation communities in desert riparian forests, and further affects the stability of desert ecosystems in arid areas. Drought stress will not only wilt plants, but also weaken the physiological functions and disease resistance of plants (Doble et al., 2006; Chui et al., 2011). The ecological water conveyance project can effectively raise the groundwater level and increase the soil water content. Therefore, it is very important to study the temporal and spatial variation of the groundwater level and soil drought for the protection and restoration of desert riparian forest vegetation (Halik et al., 2019; Ling et al., 2020). The species of desert riparian forest vegetation is relatively poor, the structure is relatively simple, the main feature is low species diversity, and ecological water conveyance can form a favorable environment for their survival. The study of species diversity in the process of vegetation restoration not only helps to correctly understand the process of vegetation restoration, but also helps to understand the dynamic succession process of the ecosystem (Runyan and D'Odorico, 2010; Kopec et al., 2013). The ecological water conveyance is mainly carried out along the river course. The farther away from the river course, the lower the fractional vegetation cover and the smaller the area of vegetation restoration. Therefore, the research on the degree of increase in fractional vegetation cover and the area of vegetation restoration is also an important indicator for evaluating the degree of vegetation restoration (Guo et al., 2017; Huang F. et al., 2020). At present, with the implementation of the ecological water conveyance project, the ecological deterioration in the water conveyance area has been curbed. However, there are few previous research results on how to quantitatively evaluate the effect of ecological water conveyance. It is of great practical significance to comprehensively evaluate the overall ecological environment quality changes in the basin to promote the vegetation restoration in the arid area.
The Tarim River Basin, located in the Tarim Basin in northwestern China, is one of the most representative desert riparian forest distribution areas in China and even the world (Hao et al., 2010; Ling et al., 2017). In 2001, the Chinese government implemented an ecological water conveyance project in the lower reaches of the Tarim River. Therefore, this study selected the Tarim River Basin as a typical area. However, there are few long-term studies on the changes of vegetation belts in the Tarim River Basin, soil drought condition, and changes in the ecological quality of the whole basin after ecological water conveyance. Based on remote sensing data and field survey data, this study focuses on the changes of the desert riparian forest vegetation belt and hydrological conditions in the Tarim River Basin in the past 22 years. A quality evaluation system for the ecological environment of the Tarim River Basin was constructed to comprehensively evaluate the restoration of damaged desert forest ecosystems and the effectiveness of ecological water conveyance, in order to provide decision-making references for ecological conservation and sustainable development of inland river basins in arid regions.
The Tarim River Basin is located in the hinterland of Eurasia, and is located in the south of Xinjiang Uygur Autonomous Region (34°55 ′-43°08 ′ N, 73°10 ′-94°05 ′ E). It is the largest inland river in China. It is connected with Pakistan in South Asia and India, Afghanistan in West Asia, Tajikistan in Central Asia and Kyrgyzstan, and the basin area reaches 1.027 million km2. The study area has a hot, dry climate, and water resources are scarce. The climate is classified as warm temperate extreme arid. The annual average precipitation is less than 50 mm and the annual average evaporation is more than 2,500 mm. The Tarim River Basin is one of the most fragile regions in China, and even the world. Among them, the main stream of Tarim River is composed of Aksu River, Hotan River, Yarkant River and other rivers, starting from Xiaojiake, and finally into Taitema Lake. Arbor–shrub–grass vegetation belts mainly comprising Populus euphratica, Tamarix ramosissima, Lycium ruthenicum, Phragmites communis, and Apocynum venetum are present on both sides of the river. After the completion of the Daxihaizi Reservoir in 1972, the incoming water in the middle and upper reaches was completely intercepted, resulting in the complete disconnection of the lower reaches of the Tarim River and the drying up of the Taitema Lake. Large areas of natural vegetation have been degraded and the groundwater level has decreased, and thus, the ecological environment has been severely damaged. In 2001, the Chinese government invested 10.7 billion yuan to implement comprehensive management of the Tarim River Basin with the fundamental aim of restoring the downstream ecosystems. In order to further improve the effect of comprehensive management, since 2016, the autonomous region government launched a special action for ecological protection of Populus euphratica forest in the Tarim River Basin, using ecological sluices and water conveyance channels to introduce water into forest areas (see Figures 1A,B), and promote the recovery of Populus euphratica forest ecosystem through overflow interference. At present, the special action for ecological protection of Populus euphratica has been carried out for 6 years, and the comprehensive management of the Tarim River Basin has been carried out for 22 years. The accumulated ecological water conveyance in the lower reaches of Tarim River is 8.793 billion m³, and the average annual water conveyance is 400 million m³. The degradation of the ecological environment in the Tarim River Basin has been effectively halted. The long-term disconnection of the downstream river has improved and the green vegetation in the riparian zone is characterized by positive physiological and ecological responses. Therefore, the Tarim River is not only the area with the most serious damage to the ecological environment caused by artificial interference, but also the most successful typical case of human intervention in promoting ecological restoration.
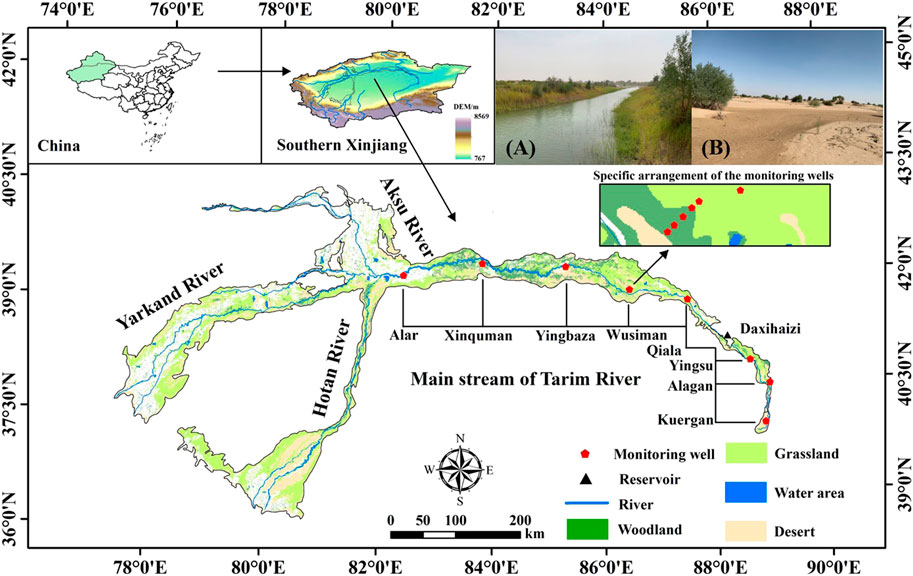
FIGURE 1. Overviewof the study area.(A) is river course water conveyance, (B) is natural overflow.
Table 1 lists the all the data sets used in our study. Images of Normalized Difference Vegetation Index (NDVI) were used to calculate the Fractional Vegetation Cover (FVC) and the Temperature Vegetation Dryness Index (TVDI). There are now more 100 vegetation indexes. NDVI, the Ratio Vegetation Index (RVI), Enhanced Vegetation Index (EVI) and the Soil Adjusted Vegetation Index (SAVI) are widely mentioned or used. Yet each vegetation index has strength and weakness. RVI does not perform well when the FVC is <50% (Jackson, 1983), which rules RVI out when quantifying the vegetation in the desert ecosystems. Defect of NDVI comes from its saturation when measuring dense vegetation. SAVI and EVI are both modified NDVI with adjustment from the effects of soil brightness in the background and improved sensitivity to dense vegetation (Huete, 1988; Matsushita et al., 2007). Despite the adjustment and improvement of SAVI and EVI, NDVI is the one that is most widely used. And it is also generally agreed that NDVI is sensitive in low to moderate dense vegetation such as semi-arid areas (Tucker, 1986; Diallo et al., 1991; Xue and Su, 2017). In addition, high-quality time series NDVI are readily available from data sets of MODIS NDVI, SPOT NDVI and GIMMS NDVI. That’s why NDVI was selected in this study. 16-day composited NDVI images were derived from the MODIS MOD13Q1 product, Savitzky-Golay filtering was performed to the NDVI time series to smooth out noise caused by poor atmospheric conditions (Chen et al., 2004). And The MVC was applied to produce yearly NDVI, which would further improve the quality of the NDVI images by reducing noise caused by poor atmospheric conditions (Holben, 1986).
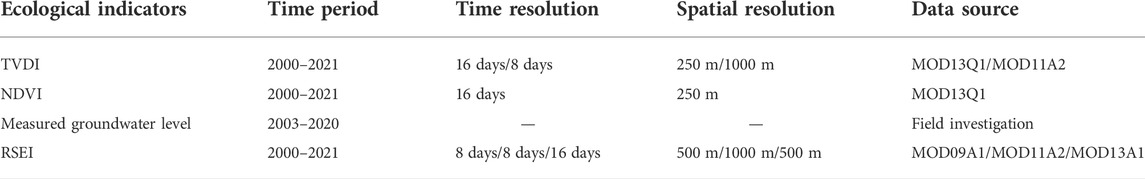
TABLE 1. Data and sources used by the institute.
16-day composited images of Land Surface Temperature (LST) of daytime, together with NDVI, were used to calculate TVDI. The time series LST images were derived from MODIS MOD11A2 product. LST images were averaged to get yearly LST.
The groundwater depth data were proved by the Tarim River Basin Administration bureau. And the date set were collected from six typical monitoring sections set along the main stream of Tarim River, namely, Alar, Wusiman, Qiala, Yingsu, Alagan and Kuergan (see Figure 1).
Quadrat sampling method was used to collect the number of vegetation species and plants. From 2015 to 2021, sampling was carried out in the Shaya Populus euphratica Forest Park in the upper reaches of the main stream of Tarim River and the Luntai Populus euphratica Forest Park in the middle reaches of the main stream of Tarim River. Three 25 m × 25 m fixed monitoring quadrats were set at each sampling point.
The TVDI was used to characterize the soil moisture, and it was calculated based on the NDVI and LST with the following formula:
where LST is the surface temperature of any pixel,
The Fractional Vegetation Cover (FVC) is an important indicator for measuring the surface fractional vegetation cover in a region, and it has a strong positive correlation with NDVI. Based on the pixel dichotomy model and NDVI data, the fractional vegetation cover was calculated using the inversion model with the following formula:
where FVC is the fractional vegetation cover, and
In order to analyze the changes in the diversity indices for vegetation after ecological water conveyance, the Simpson and Shannon–Wiener indices were calculated for vegetation in the samples as follows.
where Pi is the frequency of occurrence for the i-th species, Pi = Ni/N, N is the total number of individuals in the quadrat, and Ni is the number of individuals for the i-th species.
The Google Earth Engine platform can rapidly screen out the images with the best quality by directly accessing the data set and using the cloud mask algorithm, thereby avoiding the inefficiency of local download, storage, and preprocessing. In this study, based on the Google Earth Engine platform, MOD09A1, MOD13A1, and MOD11A2 data were used to calculate the humidity, greenness, dryness and heat indices for each year. Principal component analysis was then conducted to construct the remote sensing ecological index. It should be noted that each index has different units and numerical ranges, so the four indices were normalized with the following formula (Chen et al., 2019; Zhang et al., 2021).:
where
Principal component analysis was performed with ENVI software, where the four normalized index bands were combined into new images to obtain relevant statistical results. After positive and negative values for principal component 1 (PC1) were transferred and normalized, the remote sensing-based ecological index (RSEI) was obtained as:
where RSEI is the remote sensing ecological index value and the ecological quality is better when the value is closer to 1, and
The Mann-Kendall statistical test obtained the trends of TVDI, FVC and RSEI and test the significance of the changes. The Mann-Kendall statistical test is a non-parametric test method. The time series X1, X2, X3… Xn are successively compared, and the results are represented by
The calculated result of the Mann-Kendall statistic is:
where xk and xi are random variables and n is the length of the selected data series. The test statistic Zc is:
where |Zc|≥1.96 indicates that at the 0.05 significance level, the sample sequence has a significant trend. Positive Zc indicates an upward trend, and negative Zc indicates a downward trend.
The annual average TVDI in the Tarim River Basin mostly ranges from 0.69 to 0.76, with obvious spatial differences (see Figure 2A). The areas with relatively high degree of soil drought were mainly distributed in the lower reaches of the main stream of Tarim River, and in Moyu County and Luopu County in the Hotan River Basin. The areas with relatively low soil aridity are mainly distributed near Alar in the Aksu River Basin, the Hotan River, and the upper reaches of the Yarkand River. The proportion of moderate drought in the whole basin is as high as 31.7%, followed by severe drought, reaching 27.7%. The proportion of light drought and extreme drought is equivalent, which are 18.4% and 20.5% respectively, and the proportion of drought free is the lowest, only 1.6%. From the results, the Tarim River Basin was still moderate drought.
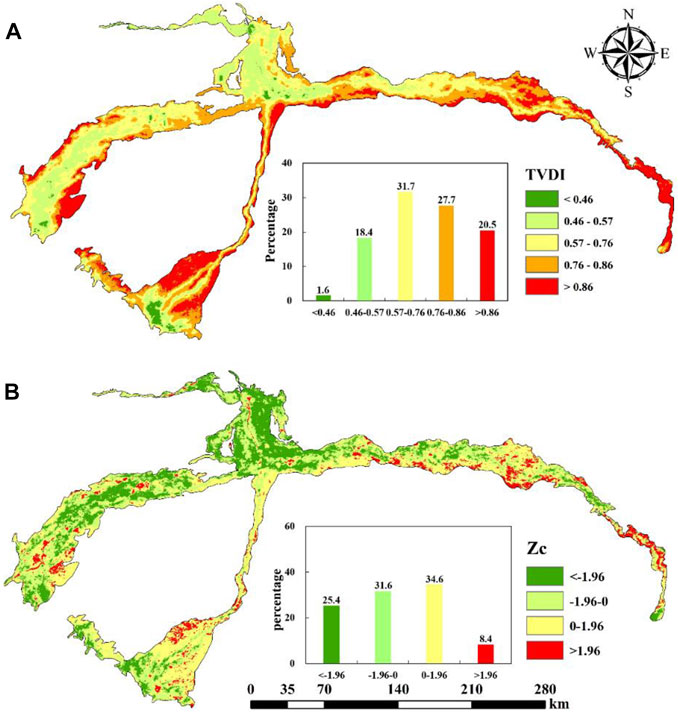
FIGURE 2. Spatial distribution (A) of annual average TVDI and spatial distribution (B) of TVDI variation trend in Tarim River Basin from 2000 to 2021.
From 2000 to 2021, the area of pixels with a downward trend in TVDI in the Tarim River Basin (Zc < 0) accounted for 57.0%, which was higher than that of TVDI with increasing trend (Zc > 0), indicating that the soil in the Tarim River Basin has a stronger trend of humidification than that of aridity (see Figure 2B). Among them, the areas with a downward trend in TVDI (Zc < 0) are mainly located in most areas of the Aksu River Basin, the upper reaches of the main stream of Tarim River, and the middle and lower reaches of the Yarkand River Basin. The areas with an upward trend in TVDI (Zc > 0) are mainly located in Moyu County and Luopu County in the Hotan River Basin. In the whole basin, TVDI showed a significant decreasing trend (Zc < -1.96), and the pixel area accounted for 25.4%, mainly distributed in most areas of Aksu River Basin and the middle reaches of Yarkand River Basin. The proportion of pixel area of TVDI with non-significant increasing trend (0 < Zc < 1.96) and non-significant decreasing trend (-1.96 < Zc < 0) is equivalent, which is 34.6% and 31.6%, respectively. The proportion of pixel area with significant increasing trend of TVDI (Zc > 1.96) is the lowest, which is only 8.4%. It shows that the soil in Tarim River Basin has a tendency of wetting after ecological water conveyance.
According to Figure 3, From 2003 to 2020, the groundwater depth of the main stream of the Tarim River showed a trend of gradual uplift. Among the monitoring sections where the buried depth of groundwater is showed uplifted, the groundwater section in the lower reaches of the main stream of Tarim River has a significant rising trend, with the highest lifting rate of 0.0348 m/month in Kuergan, 0.0148 m/month in Yingsu and 0.0142 m/month in Alagan. In addition, the monthly average uplift values of groundwater depth in Alar and Qiala are 0.0040 m/month, 0.0007 m/month, and 0.0118 m/month respectively. In recent 20 years, the lower reaches of the main stream of Tarim River as a key ecological water conveyance area, groundwater uplift significantly, indicating that ecological water conveyance along the Tarim River has played a positive role in groundwater recharge and ecological restoration, and created good hydrological conditions for vegetation growth.
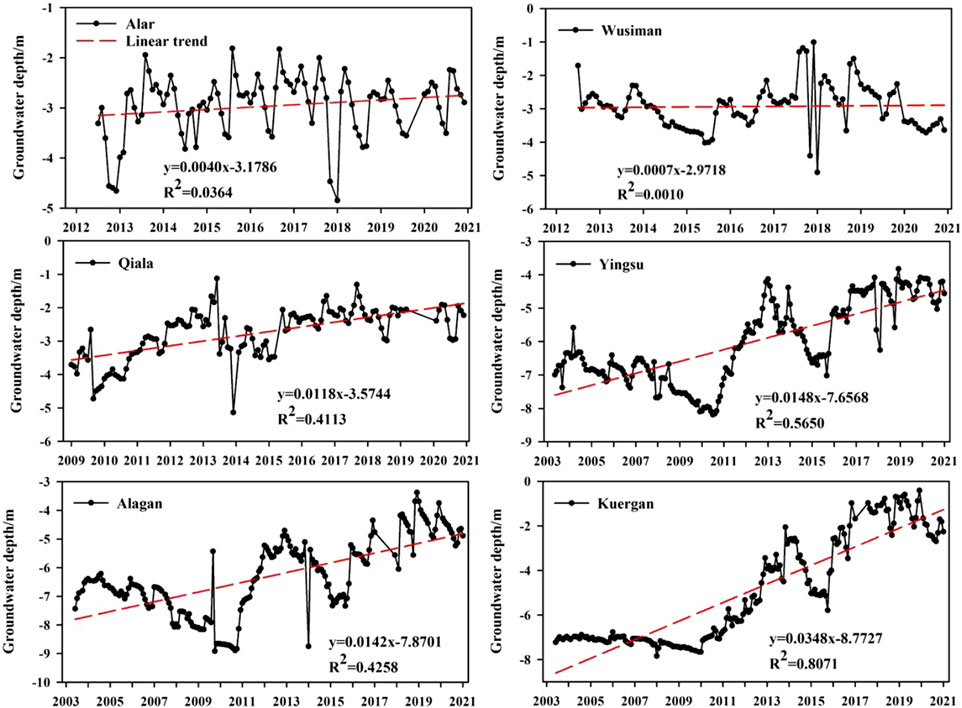
FIGURE 3. The variation process of groundwater depth in each section of the main stream of Tarim River month by month.
It can be seen from Figure 4A that the annual average FVC in the Tarim River Basin is mostly between 20% and 30%, and the spatial differences are also obvious. The areas with higher fractional vegetation cover are mainly distributed in the upper and middle reaches of the Yarkand River Basin, the Aksu River Basin, the upper reaches of the Hotan River Basin and the upper reaches of the main stream of Tarim River, and the areas with lower fractional vegetation cover are mainly distributed in the middle and lower reaches of the Hotan River Basin and the lower reaches of the main stream of Tarim River. In the space, high fractional vegetation cover (FVC>20%) accounted for up to 42.0% in the whole basin, followed by extremely low fractional vegetation cover (FVC≤5%), reaching 30.9%. The proportions of low fractional vegetation cover (5% < FVC≤10%) and medium fractional vegetation cover (10% < FVC≤20%) were equivalent, which were 13.4% and 13.7%, respectively.
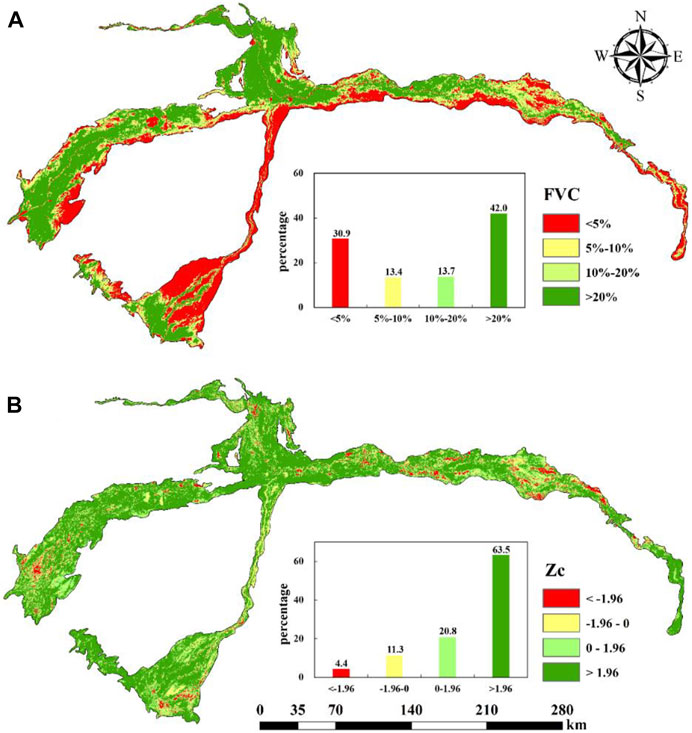
FIGURE 4. Spatial distribution (A) of annual average FVC and spatial distribution (B) of FVC variation trend in Tarim River Basin from 2000 to 2021.
It can be seen from Figure 4B that the area of pixels with an upward trend in FVC (Zc > 0) in the Tarim River Basin from 2000 to 2021 accounted for 84.3%, which is much higher than the area of pixels with a downward trend in FVC (Zc < 0), indicating that after the ecological water conveyance, the fractional vegetation cover showed an obvious improvement trend. Among them, the area with an upward trend of FVC (Zc > 0) is widely distributed in the whole basin, and the area of pixels with a downward trend (Zc < 0) only accounts for 15.7%, which is scattered in the main stream of Tarim River and part of the Hotan River Basin. The pixel area with a significant upward trend in FVC (Zc > 1.96) in the whole basin accounted for 63.5%, and the pixel area with a non-significant upward trend in FVC (0 < Zc < 1.96) accounted for 20.8%. The proportions of non-significant decreasing trend (-1.96 < Zc < 0) and significant decreasing trend (Zc < -1.96) were very small, accounting for 11.3% and 4.4% respectively.
According to the sample plot monitoring results, the average diversity index values in the vegetation survey plots were used to measure the species diversity. It can be seen from Figure 5, in the Shaya Populus euphratica Forest Park, the Simpson index and Shannon–Wiener index (Shannon index) values were significantly lower in 2015 than 2017, 2018, and 2021, and thus the riparian vegetation was gradually restored after ecological water conveyance. The Simpson index of Luntai Populus Euphratica Forest Park in the middle reaches of the Tarim River increased significantly and then decreased slightly. The Shannon-Wiener index of Luntai Populus Euphratica Forest Park in 2015 was significantly lower than that in 2017, 2018 and 2021, which indicated that the community species diversity level increased significantly after the water conveyance was more than 2 years, but with the increase of water conveyance frequency, the diversity level began to decline and then stabilized. On the whole, under the current normalized water conveyance mode, the ecological environment of the study area has been improved, and the level of species diversity tends to be stable during changes.
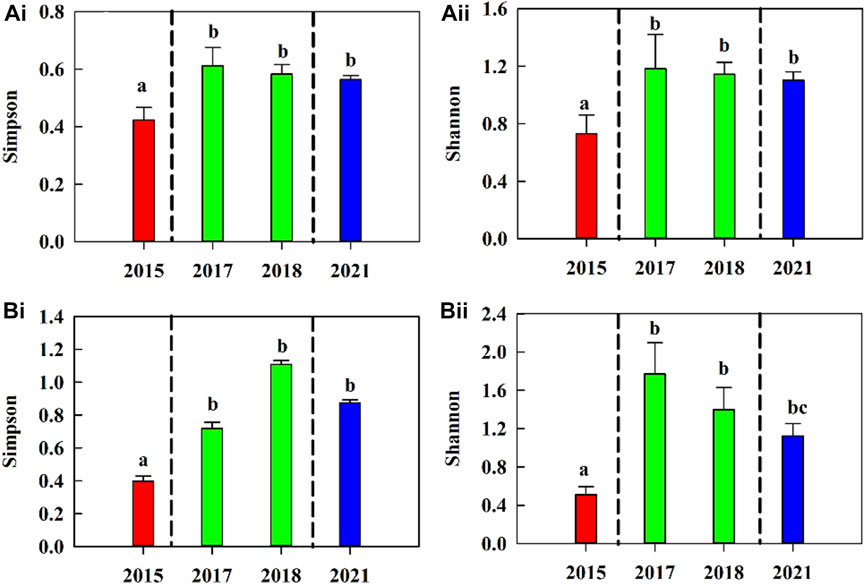
FIGURE 5. Temporal and spatial variation characteristics of species diversity in the upper and middle reaches of the main stream of the Tarim River. (Ai, Aii) is Shaya Populus euphratica Forest Park, (Bi, Bii) is Luntai Populus euphratica Forest Park.
It can be seen from Figure 6A, the annual average RSEI in the Tarim River Basin is mostly between 0.33 and 0.39, with significant spatial differences. The areas with good ecological quality are mainly distributed in parts of the Aksu River Basin, the main stream of the Tarim River, the Hotan River Basin and the upper reaches of the Yarkand River Basin, while the areas with poor ecological quality are mainly distributed in the middle and lower reaches of the main stream of the Tarim River and the lower reaches of the Hotan River Basin. The pixel area with excellent ecological quality (RSEI>0.6) in the whole basin accounted for the lowest proportion, only 8.1%, and the pixel area with good ecological quality (0.4 < RSEI≤0.6) accounted for 31.2%. The pixel area with moderate ecological quality (0.2 < RSEI≤0.4) accounted for the highest proportion, reaching 37.3%, and the pixel area with poor ecological quality (RSEI≤0.2) accounted for 23.4%. From the results, the ecological environment quality of Tarim River Basin is moderate.
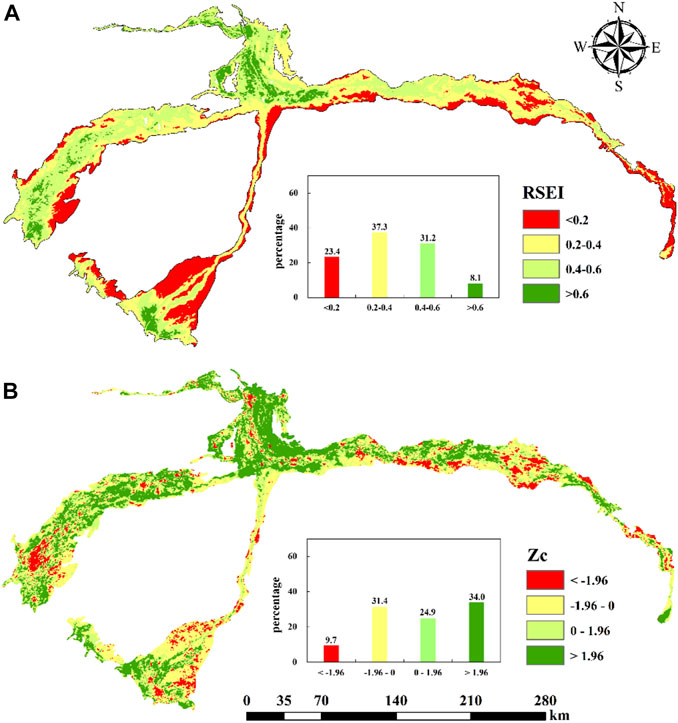
FIGURE 6. Spatial distribution (A) of annual average RSEI and spatial distribution (B) of RSEI variation trend in Tarim River Basin from 2000 to 2021.
It can be seen from Figure 6B that the area of pixels with an upward trend in RSEI (Zc > 0) in the Tarim River Basin from 2000 to 2021 accounted for 58.9%, which is higher than the area of pixels with a downward trend in RSEI (Zc < 0). It indicated that the ecological quality of the Tarim River Basin showed a trend of improvement after ecological water conveyance. Among them, the areas with an upward trend in RSEI (Zc > 0) are mainly distributed in the Aksu River Basin, the upper and lower reaches of the main stream of the Tarim River, the upper and middle reaches of the Yarkand River Basin and the upper reaches of the Hotan River Basin. The areas with decreasing trend (Zc < 0) are mainly distributed in the middle and lower reaches of the Hotan River Basin. The pixel area of RSEI in the whole basin showed a significant upward trend (Zc > 1.96 ), accounting for up to 34.0%. The pixel area of RSEI showed a non-significant upward trend (0 < Zc < 1.96) and a non-significant downward trend (-1.96 < Zc < 0), which were 24.9 % and 31.4%, respectively. The pixel area of RSEI showed a significant downward trend (Zc < -1.96), which was the smallest, accounting for only 9.7%.
In order to further explore the changes in the ecological quality level of the Tarim River Basin over the past 22 years, the RSEI data of the Tarim River Basin in 2000 and 2021 were analyzed with the help of ArcGIS 10.7 spatial analysis function. It can be seen from Table 2 that the ecological environment quality level of the Tarim River Basin shows a trend of transition from low grade to high grade, and the area with excellent ecological quality has increased from 4,635.50 km2 in 2000 to 12,335.00 km2 in 2021, mainly concentrated in the upper reaches of the main stream of the Tarim River, the upper reaches of the Hotan River Basin, the Aksu River Basin and the Yarkand River Basin, the area with moderate ecological quality decreased from 41,307.00 km2 in 2000 to 30,075.25 km2 in 2021, while the area with poor and good ecological quality did not change much. In general, after more than 20 years of ecological water conveyance project implementation, the ecological condition of the study area has been improved, and the effect is relatively obvious.
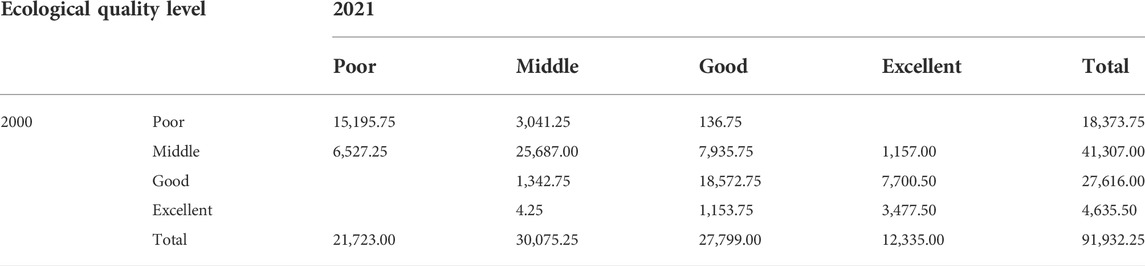
TABLE 2. Area transfer matrix of different ecological quality grades in Tarim River Basin from 2000 to 2021 Unit/km2.
It can be seen from Figure 7, during the period of ecological water conveyance from 2000 to 2021, the drought degree of the Tarim River basin gradually decreased, while the fractional vegetation cover increased year by year, and the ecological quality of the Tarim River basin gradually improved. The ecological water conveyance provided a positive role for the ecological restoration of the Tarim River Basin.
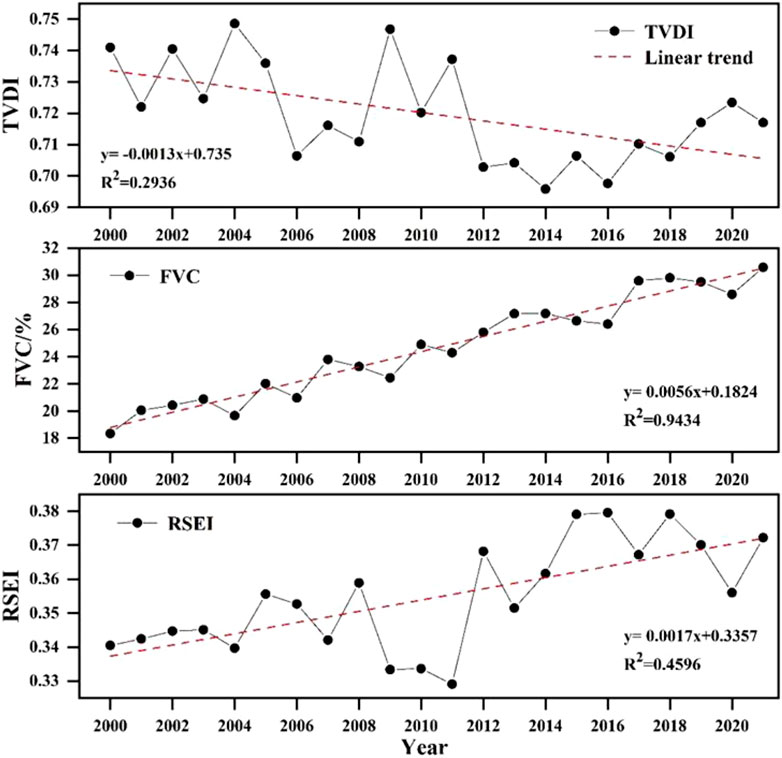
FIGURE 7. Variation trends of annual average TVDI, annual average FVC, and annual average RSEI in the Tarim River Basin from 2000 to 2021.
It can be seen from Figure 8 that the FVC and TVDI of the main stream of the Tarim River, Aksu River, Yarkang River and Hotan River were all significantly negatively correlated at the p = 0.01 level. The correlation coefficients were −0.725, −0.587, −0.758 and −0.689, respectively. In general, the higher the degree of soil drought, the more the vegetation growth would be inhibited, and the smaller the FVC would be. With the progress of ecological water conveyance, the soil drought of the main stream of Tarim River, Aksu River, Yarkand River and Hotan River had been alleviated, creating favorable conditions for the growth of natural vegetation.
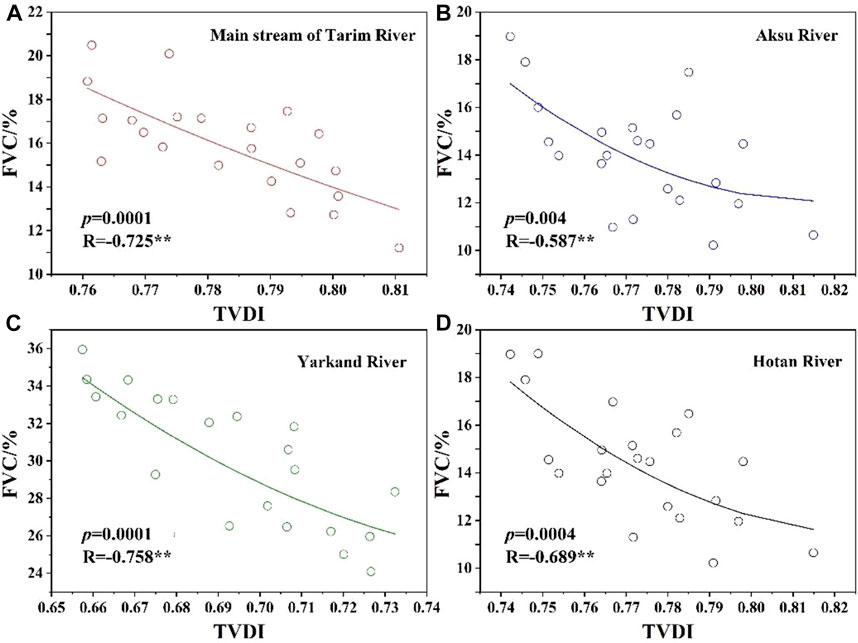
FIGURE 8. Correlation analysis of FVC andTVDI.(A) is main stream of Tarim River, (B) is Aksu River, (C) is Yarkand River, (D) is Hotan River.
It can be seen from Figure 9 that the annual average value of groundwater depth in the Qiala-Yingsu and Yingsu-Taitema Lake reaches from 2003 to 2020 was significantly positively correlated with FVC at the p = 0.01 level. The correlation coefficients were 0.942 and 0.957, respectively. In arid and semi-arid regions, the groundwater level was a key limiting factor affecting vegetation growth in the Tarim River Basin due to the hot and dry climate and scarce precipitation. Ecological water conveyance greatly raised the groundwater level and provided good hydrological conditions for vegetation growth. From the results, the shallower the groundwater depth, the greater the FVC value, the better the growth of vegetation.
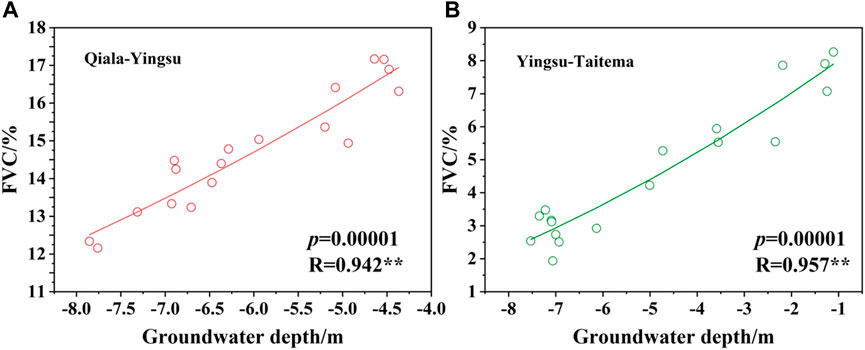
FIGURE 9. Correlation analysis of FVC and groundwater depth. (A) is Qiala-Yingsu, (B) is Yingsu-Taitema.
It can be seen from Figure 10 that the FVC of the main stream of the Tarim River, the Aksu River, the Yarkang River and the Hotan River were significantly positively correlated with the RSEI at the p = 0.01 level, and the correlation coefficients were 0.658, 0.877, 0.738 and 0.573, respectively. After ecological water conveyance, the groundwater level in the water conveyance area increased significantly, the soil drought was alleviated, the ecological quality of the whole basin was improved, and the limiting factors for vegetation growth were also weakened. Therefore, in general, the higher the ecological quality of the region, the better the vegetation growth, FVC would be greater.
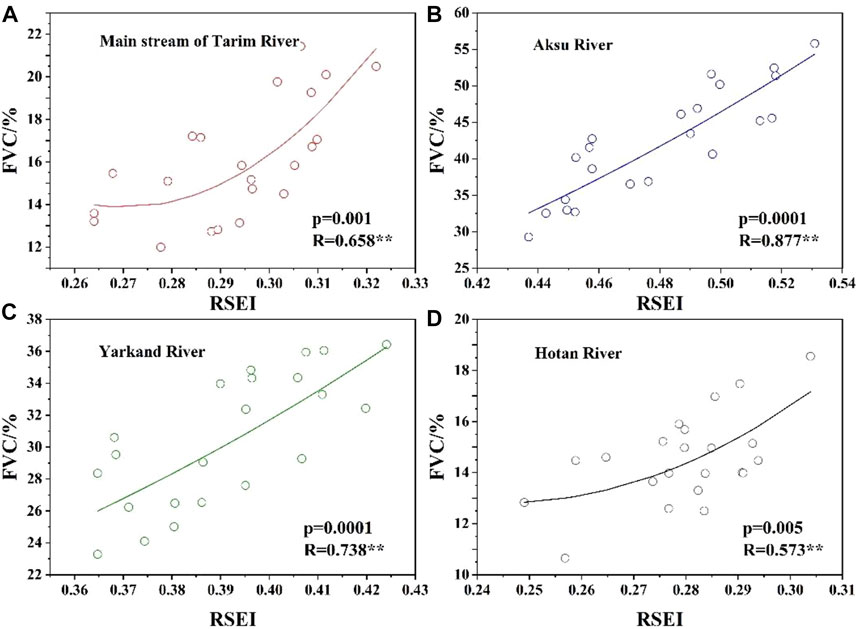
FIGURE 10. Correlation analysis of FVC and RSEI.(A) is main stream of Tarim River, (B) is Aksu River, (C) is Yarkand River, (D) is Hotan River.
This study discussed the correlation between vegetation factors and soil drought status, annual variation process of groundwater depth, and overall ecological quality status in the Tarim River Basin from 2000 to 2021. Compared with other studies, this study had a longer period, more indexes were selected, and was more representative and dynamic. However, there were still many shortcomings. For the change of vegetation factors after ecological water conveyance, the influence of climate factors and human activities was not taken into account. For the change of soil drought, although the rainfall of Tarim River Basin was less than 50 mm, the effect of meteorological factors was small, but still could not be ignored (Deng et al., 2022a).
Ecological water conveyance is an important way to promote the restoration of degraded ecosystems in arid areas. From 1972 to 2000, the integrity of the surface hydrological process was lost due to the cutoff of the lower reaches of the Tarim River. During this period, the overall plant community showed extreme decline in growth and lack of species. After ecological water conveyance, this situation had changed significantly, and the flooding disturbance had a very significant effect on the increase of biodiversity in the water conveyance area (Keram et al., 2019; Ling et al., 2019; Bai et al., 2021; Deng et al., 2022b). In arid and semi-arid regions, some of the seeds produced by vegetation are characterized by dormancy and strong resistance to drought and high temperatures, and thus they could survive for a long time. Ecological water conveyance can create conditions for germination and growth of plant seeds by changing the surface soil water content through the action of surface water (Casanova and Brock, 2000; Cavin et al., 2013). At the same time, some seeds were spread along the direction of water flow to other areas, where they could reproduce and grow quickly when they meet the suitable environmental conditions. The surface runoff formed by ecological water conveyance could effectively reduce the groundwater salinity in the water conveyance area. The groundwater salinity within 1 km along the two sides of the river decreases from about 4 to 11 g L−1 before water conveyance to 1–5 g L−1 on average, and the osmotic stress of vegetation was alleviated. The ecological water conveyance project had been carried out for 22 years, providing a suitable ecological water level for the natural vegetation. The desert riparian forest with Populus euphratica, Tamarix ramosissima, Alhagi sparsifolia and Phragmites australi as the main groups had been rejuvenated in the ecological water conveyance area (Deng et al., 2015; Garssen et al., 2015). The ecological environment of the whole study area began to improve, and the low and extremely low fractional vegetation cover in the study area gradually changed to medium and high fractional vegetation cover, indicating that the fractional vegetation cover showed an improvement trend after the ecological water conveyance.
In the past 20 years, the ecological water conveyance in the Tarim River Basin had been mainly through four ways: River course water conveyance, Ecological sluice water conveyance, Natural overflow and Agricultural sluice diversion (Chen et al., 2008; Piao et al., 2011). At present, river course water conveyance is the main way, which can effectively raise the groundwater level on both sides of the river, and has a significant effect on the growth and rejuvenation of the existing natural vegetation near the river. However, at present, the water conveyance mode along the natural river only affects the natural vegetation near the river bank, and the restoration scope is very limited, making it difficult to restore the herbaceous plants on both sides of the river bank in a large area (Xu et al., 2008; Sims and Colloff, 2012). In terms of the groundwater uplift amplitude on both sides of the river, the groundwater uplift amplitude of the main stream of the Tarim River has slowed down in recent years. The groundwater level of the Qiala, Yingsu, Alagan and Kurgan sections gradually tended to balance. As for how to expand the effect of ecological restoration, according to the water requirements of desert riparian forest ecosystem, through the regulation of ecological water conservancy projects, we can build a planar water conveyance mode and expand the scope of the water receiving area of ecological water conveyance. We need to ensure that the groundwater level within 2 km away from the river is maintained at a depth of 4–6 m, which can not only meet the water requirements for Poplar floating, germination and growth, but also prevent soil secondary salinization (Zalewski, 2002). Ecological water conveyance is mainly carried out from June to September when the water inflow of the Tarim River is relatively large. The use of planar water conveyance can greatly improve the vegetation habitat conditions and improve the stability and sustainability of the ecological protection and restoration system (Ling et al., 2015).
This study discussed the temporal and spatial changes of soil drought, the monthly change process of groundwater depth, the change of fractional vegetation cover and the change of overall ecological quality in the Tarim River Basin from 2000 to 2021, and comprehensively evaluated the restoration of damaged desert forest ecosystem and the effectiveness of ecological water conveyance. The following conclusions are obtained:
From 2000 to 2021, the pixel area with a downward trend of TVDI (Zc < 0) in the Tarim River Basin accounted for 57.0%, which was higher than the pixel area with an upward trend of TVDI (Zc > 0). The soil in the study area showed a wetting development trend. Among the monitoring sections with rising groundwater depth, the groundwater section in the lower reaches of the Tarim River has a significant lifting trend, and the Kurgan has the largest lifting rate of 0.0348 m/month. From 2000 to 2021, the pixel area of FVC in Tarim River Basin with an upward trend (Zc > 0) accounted for 84.3%, which was much higher than the pixel area of FVC with a downward trend (Zc < 0). Among them, FVC with a no significant downward trend (-1.96 < Zc < 0) and a significant downward trend (Zc < −1.96) accounted for a small proportion, which were 11.3% and 4.4% respectively. From 2000 to 2021, the pixel area with an upward trend (Zc > 0) of RSEI in the Tarim River Basin accounted for 58.9%, of which the pixel area with a significant upward trend (Zc > 1.96) accounted for as much as 34.0%, which was mainly distributed in the Aksu River Basin, the upper reaches of the mainstream of the Tarim River, the upper and middle reaches of the Yarkand River Basin and the upper reaches of the Hotan River Basin. In the past 20 years, the ecological quality of the Tarim River Basin has improved to a certain extent. From 2000 to 2021, the FVC of the main stream of the Tarim River, the Aksu River, the Yarkand River and the Hotan River had a significant correlation with TVDI and RSEI at the p = 0.01 level. From 2003 to 2020, the FVC of the Qiala-Yingsu and Yingsu-Taitema Lake reaches was significantly positively correlated with groundwater depth at the p = 0.01 level.
The original contributions presented in the study are included in the article/Supplementary Material, further inquiries can be directed to the corresponding author.
The authors undertook different tasks for this article. AJ. Data processing and wrote the paper. AJ, WW and XD. Analyzed the data. HL, JY and FC provided direction for the research work. HL. Designed the research and revised the article. All authors have read and agreed to the published version of the manuscript.
This research was funded by the National Natural Science Foundation of China (52179028), the West Light Foundation of Chinese Academy of Sciences (2019-XBQNXZ-A-001), and the Xinjiang Water Conservancy Science and Technology Special Fund Project (XSKJ-2022-10).
The authors declare that the research was conducted in the absence of any commercial or financial relationships that could be construed as a potential conflict of interest.
All claims expressed in this article are solely those of the authors and do not necessarily represent those of their affiliated organizations, or those of the publisher, the editors and the reviewers. Any product that may be evaluated in this article, or claim that may be made by its manufacturer, is not guaranteed or endorsed by the publisher.
Adam, J. C., Hamlet, A. F., and Lettenmaier, D. P. (2009). Implications of global climate change for snowmelt hydrology in the twenty-first century. Hydrol. Process. 23, 962–972. doi:10.1002/hyp.7201
Allen, M. R., and Ingram, W. J. (2012). Erratum: Corrigendum: Constraints on future changes in climate and the hydrologic cycle. Nature 489, 590. doi:10.1038/nature11456
Bai, Y., Liu, Y., Kueppers, L. M., Feng, X., Yu, K., Yang, X., et al. (2021). The coupled effect of soil and atmospheric constraints on the vulnerability and water use of two desert riparian ecosystems. Agric. For. Meteorol. 311, 108701. doi:10.1016/j.agrformet.2021.108701
Casanova, M. T., and Brock, M. A. (2000). How do depth, duration and frequency of flooding influence the establishment of wetland plant communities? Plant Ecol. 147 (2), 237–250. doi:10.1023/A:1009875226637
Cavin, L., Mountford, E. P., Peterken, G. F., and Jump, A. S. (2013). Extreme drought alters competitive dominance within and between tree species in a mixed forest stand. Funct. Ecol. 27 (6), 1424–1435. doi:10.1111/1365-2435.12126
Chen, J., Jonsson, P., Tamura, M., Gu, Z. H., Matsushita, B., and Eklundh, L. (2004). A simple method for reconstructing a high-quality NDVI time-series data set based on the Savitzky-Golay filter. Remote Sens. Environ. 91, 332–344. doi:10.1016/j.rse.2004.03.014
Chen, W., Huang, H. P., Tian, Y. C., and Du, Y. Y. (2019). Monitoring and assessment of the eco-environment quality in the sanjiangyuan region based on Google Earth engine. J. Geo-information Sci. 21 (09), 1382–1391. doi:10.12082/dqxxkx.2019.190095
Chen, Y., Chen, Y., Xu, C., Ye, Z., Li, Z., Zhu, C., et al. (2010). Effects of ecological water conveyance on groundwater dynamics and riparian vegetation in the lower reaches of Tarim River, China. Hydrol. Process. 24, 170–177. doi:10.1002/hyp.7429
Chen, Y. J., Li, W. H., Liu, J. Z., and Li, J. Q. (2008). Analysis on the effects of water conveyance embankments on the ecological conservation in the middle reaches of the Tarim River. Arid. Zone Res. 25 (4), 550–555. doi:10.13866/j.azr.2008.04.017
Chui, T. F. M., Low, S. Y., and Liong, S. Y. (2011). An ecohydrological model for studying groundwater-vegetation interactions in wetlands. J. Hydrol. X. 409, 291–304. doi:10.1016/j.jhydrol.2011.08.039
Deng, H., Chen, Y., and Chen, X. (2022b). Driving factors and changes in components of terrestrial water storage in the endorheic Tibetan Plateau. J. Hydrol. X. 612, 128225. doi:10.1016/j.jhydrol.2022.128225
Deng, H. J., and Chen, Y. J. (2017). Influences of recent climate change and human activities on water storage variations in Central Asia. J. Hydrol. X. 544, 46–57. doi:10.1016/j.jhydrol.2016.11.006
Deng, H., Pepin, N. C., Chen, Y., Guo, B., Zhang, S., Zhang, Y., et al. (2022a). Dynamics of diurnal precipitation differences and their spatial variations in China. J. Appl. Meteorol. Climatol. 61 (8), 1015–1027. doi:10.1175/jamc-d-21-0232.1
Deng, X. Y., Xu, H., Ye, M., Li, B., Fu, J., Li, B., et al. (2015). Impact of long-term zero-flow and ecological water conveyance on the radial increment of Populus euphratica in the lower reaches of the Tarim River, Xinjiang. China. Reg. Environ. Change 15 (1), 13–23. doi:10.1007/s10113-014-0603-2
Diallo, O., Diouf, A., Hanan, N. P., Ndiaye, A., and Prévost, Y. (1991). AVHRR monitoring of savanna primary production in Senegal, west africa: 1987–1988. Int. J. Remote Sens. 12 (6), 1259–1279. doi:10.1080/01431169108929725
Ding, J., Zhao, W., Daryanto, S., Wang, L., Fan, H., Feng, Q., et al. (2017). The spatial distribution and temporal variation of desert riparian forests and their influencing factors in the downstream Heihe River basin, China. Hydrol. Earth Syst. Sci. 21, 2405–2419. doi:10.5194/hess-21-2405-2017
Doble, R., Simmons, C., Jolly, I., and Walker, G. (2006). Spatial relationships between vegetation cover and irrigation-induced groundwater discharge on a semi-arid floodplain, Australia. J. Hydrol. X. 329, 75–97. doi:10.1016/j.jhydrol.2006.02.007
Garssen, A. G., Baattrup-Pedersen, A., Voesenek, L., Verhoeven, J. T. A., and Soons, M. B. (2015). Riparian plant community responses to increased flooding: A meta-analysis. Glob. Chang. Biol. 21 (8), 2881–2890. doi:10.1111/gcb.12921
Guo, H., Jiapaer, G., Bao, A., Li, X., Huang, Y., Ndayisaba, F., et al. (2017). Effects of the Tarim River's middle stream water transport dike on the fractional cover of desert riparian vegetation. Ecol. Eng. 99, 333–342. doi:10.1016/j.ecoleng.2016.10.074
Halik, U., Aishan, T., Betz, F., Kurban, A., and Rouzi, A. (2019). Effectiveness and challenges of ecological engineering for desert riparian forest restoration along China's largest inland river. Ecol. Eng. 127, 11–22. doi:10.1016/j.ecoleng.2018.11.004
Hao, X. M., Li, W. H., Huang, X., Zhu, C. G., and Ma, J. X. (2010). Assessment of the groundwater threshold of desert riparian forest vegetation along the middle and lower reaches of the Tarim River, China. Hydrol. Process. 24 (2), 178–186. doi:10.1002/hyp.7432
Holben, B. N. (1986). Characteristics of maximum-value composite images from temporal AVHRR data. Int. J. Remote Sens. 7, 1417–1434. doi:10.1080/01431168608948945
Huang, F., Ochoa, C. G., Chen, X., Cheng, Q., and Zhang, D. (2020). An entropy-based investigation into the impact of ecological water diversion on land cover complexity of restored oasis in arid inland river basins. Ecol. Eng. 151, 105865. doi:10.1016/j.ecoleng.2020.105865
Huang, J., Zhang, Y., Wang, M. X., Wang, F., Tang, Z., and He, H. (2020). Spatial and temporal distribution characteristics of drought and its relationship with meteorological factors in Xinjiang in last 17 years. Acta eco. Sin. 40 (03), 1077–1088. doi:10.5846/stxb201810302341
Huete, A. R. (1988). A soil-adjusted vegetation index (SAVI). Remote Sens. Environ. 25 (3), 295–309. doi:10.1016/0034-4257(88)90106-X
Jackson, R. D. (1983). Spectral indices in N-Space. Remote Sens. Environ. 13 (5), 409–421. doi:10.1016/0034-4257(83)90010-x
Keram, A., Halik, U., Keyimu, M., Aishan, T., Mamat, Z., and Rouzi, A. (2019). Gap dynamics of natural Populus euphratica floodplain forests affected by hydrological alteration along the Tarim River: Implications for restoration of the riparian forests. For. Ecol. Manage. 438, 103–113. doi:10.1016/j.foreco.2019.02.009
Keyimu, M., Halik, U., Betz, F., and Dulamsuren, C. (2018). Vitality variation and population structure of a riparian forest in the lower reaches of the Tarim River, NW China. J. For. Res. (Harbin). 29, 749–760. doi:10.1007/s11676-017-0478-4
Kopec, D., Michalska-Hejduk, D., and Krogulec, E. (2013). The relationship between vegetation and groundwater levels as an indicator of spontaneous wetland restoration. Ecol. Eng. 57, 242–251. doi:10.1016/j.ecoleng.2013.04.028
Ling, H. B., Zhang, P., Xu, H. L., and Zhao, X. F. (2015). How to regenerate and protect desert riparian Populus euphratica forest in arid areas. Sci. Rep. 5, 15418. doi:10.1038/srep15418
Ling, H., Guo, B., Yan, J., Deng, X., Xu, H., and Zhang, G. (2020). Enhancing the positive effects of ecological water conservancy engineering on desert riparian forest growth in an arid basin. Ecol. Indic. 118, 106797. doi:10.1016/j.ecolind.2020.106797
Ling, H., Xu, H., Guo, B., Deng, X., Zhang, P., and Wang, X. (2019). Regulating water disturbance for mitigating drought stress to conserve and restore a desert riparian forest ecosystem. J. Hydrol. X. 572, 659–670. doi:10.1016/j.jhydrol.2019.03.049
Ling, H., Zhang, P., Guo, B., Xu, H., Ye, M., and Deng, X. (2017). Negative feedback adjustment challenges reconstruction study from tree rings: A study case of response of Populus euphratica to river discontinuous flow and ecological water conveyance. Sci. Total Environ. 574, 109–119. doi:10.1016/j.scitotenv.2016.09.043
Matsushita, B., Yang, W., Chen, J., Onda, Y., and Qiu, G. (2007). Sensitivity of the enhanced vegetation index (EVI) and normalized difference vegetation index (NDVI) to topographic effects: A case study in high-density cypress forest. Sensors (Basel). 7, 2636–2651. doi:10.3390/s7112636
Ni, Z., Zhang, E., Sun, W., Meng, X., Ning, D., Jiang, Q., et al. (2022). Response of the chironomid community to late Holocene climate change and anthropogenic impacts at Lake Ulungur, arid Central Asia. Quat. Int. 613, 91–100. doi:10.1016/j.quaint.2021.08.007
Piao, S. L., Wang, X. H., Ciais, P., Zhu, B., Wang, T., and Liu, J. (2011). Changes in satellite-derived vegetation growth trend in temperate and boreal Eurasia from 1982 to 2006. Glob. Chang. Biol. 17, 3228–3239. doi:10.1111/j.1365-2486.2011.02419.x
Runyan, C. W., and D'Odorico, P. (2010). Ecohydrological feedbacks between salt accumulation and vegetation dynamics: Role of vegetation-groundwater interactions. Water Resour. Res. 46, W11561. doi:10.1029/2010wr009464
Sims, N. C., and Colloff, M. J. (2012). Remote sensing of vegetation responses to flooding of a semi-arid floodplain: Implications for monitoring ecological effects of environmental flows. Ecol. Indic. 18, 387–391. doi:10.1016/j.ecolind.2011.12.007
Sun, H., Wang, P., Chen, Q., Zhang, D., and Xing, Y. (2022). Coupling the water use of Populus euphratica and Tamarix ramosissima and evapotranspiration partitioning in a desert riparian forest ecosystem. Agric. For. Meteorol. 323, 109064. doi:10.1016/j.agrformet.2022.109064
Tucker, C. J. (1986). Cover Maximum normalized difference vegetation index images for sub-Saharan Africa for 1983-1985. Int. J. Remote Sens. 7 (11), 1383–1384. doi:10.1080/01431168608948941
Wang, Y-J., and Qin, D-H. (2017). Influence of climate change and human activity on water resources in arid region of Northwest China: An overview. Adv. Clim. Change Res. 8, 268–278. doi:10.1016/j.accre.2017.08.004
Xu, H. L., Ye, M., and Li, J. M. (2008). The water transfer effects on agricultural development in the lower Tarim River. Xinjiang of China. Agric. Water Manag. 95 (1), 59–68. doi:10.1016/j.agwat.2007.09.004
Xue, J., and Su, B. (2017). Significant remote sensing vegetation indices: A review of developments and applications. J. Sens. 2017, 1–17. doi:10.1155/2017/1353691
Zalewski, M. (2002). Ecohydrology—The use of ecological and hydrological processes for sustainable management of water resources / ecohydrologie—La prise en compte de processus écologiques et hydrologiques pour la gestion durable des ressources en eau. Hydrological Sci. J. 47 (5), 823–832. doi:10.1080/02626660209492986
Zeng, Y., Xie, Z., Yu, Y., Liu, S., Wang, L., Jia, B., et al. (2016). Ecohydrological effects of stream-aquifer water interaction: A case study of the heihe river Basin, northwestern China. Hydrol. Earth Syst. Sci. 20, 2333–2352. doi:10.5194/hess-20-2333-2016
Zhang, H., Song, J. Y., Li, M., and Han, W. H. (2021). Eco-environmental quality assessment and cause analysis of Qilian Mountain National Park based on GEE. Chin. J. Ecol. 40 (06), 1883–1894. doi:10.13292/j.1000-4890.202106.034
Zhang, M., Wang, S., Fu, B., Gao, G., and Shen, Q. (2018). Ecological effects and potential risks of the water diversion project in the Heihe River Basin. Sci. Total Environ. 619, 794–803. doi:10.1016/j.scitotenv.2017.11.037
Keywords: ecological water conveyance, desert riparian vegetation, ecological environment quality, ecological restoration, Tarim River Basin
Citation: Jiao A, Wang W, Ling H, Deng X, Yan J and Chen F (2022) Effect evaluation of ecological water conveyance in Tarim River Basin, China. Front. Environ. Sci. 10:1019695. doi: 10.3389/fenvs.2022.1019695
Received: 15 August 2022; Accepted: 26 August 2022;
Published: 14 September 2022.
Edited by:
Haijun Deng, Fujian Normal University, ChinaReviewed by:
Huaiwei Sun, Huazhong University of Science and Technology, ChinaCopyright © 2022 Jiao, Wang, Ling, Deng, Yan and Chen. This is an open-access article distributed under the terms of the Creative Commons Attribution License (CC BY). The use, distribution or reproduction in other forums is permitted, provided the original author(s) and the copyright owner(s) are credited and that the original publication in this journal is cited, in accordance with accepted academic practice. No use, distribution or reproduction is permitted which does not comply with these terms.
*Correspondence: Hongbo Ling, bGluZ2hiQG1zLnhqYi5hYy5jbg==; Xiaoya Deng, bGlseTgwODc2QDE2My5jb20=
Disclaimer: All claims expressed in this article are solely those of the authors and do not necessarily represent those of their affiliated organizations, or those of the publisher, the editors and the reviewers. Any product that may be evaluated in this article or claim that may be made by its manufacturer is not guaranteed or endorsed by the publisher.
Research integrity at Frontiers
Learn more about the work of our research integrity team to safeguard the quality of each article we publish.