 Yuxuan Zhang1,2
 Xueqin Gao
95% of researchers rate our articles as excellent or good
Learn more about the work of our research integrity team to safeguard the quality of each article we publish.
Find out more
ORIGINAL RESEARCH article
Front. Environ. Sci. , 25 October 2022
Sec. Conservation and Restoration Ecology
Volume 10 - 2022 | https://doi.org/10.3389/fenvs.2022.1017605
This article is part of the Research Topic Water and Ecological System: Response, Management, and Restoration View all 15 articles
Bioretention cells are an important facility to solve the hydrological and non-point pollution problems in urban areas, especially phosphorus. In this paper, ceramsite composite was made from coal ash and modified by nano-iron through coprecipitation and reduction, which was used to remove the phosphorus in the water. The results of the characteristics of the ceramsite composite using scanning electron microscope showed that the surface of the ceramsite loaded with nano-iron became rougher and the iron nanoparticles were uniformly distributed on the surface, and there was no obvious agglomeration of nano-iron particles. The loading effect was good and the activity of the ceramsite was greatly improved. The results from the static and dynamic continuous experiments indicated that the modified ceramsite with nano-iron had a good removal effect on phosphorus, and the removal rate reached over 99%. The results of this study can provide a new way for the resource utilization of coal ash, and also inspires a new idea for the improvement of filler in bioretention facilities.
The increases in impervious underlying surface in the process of urbanization have resulted in frequent urban waterlogging and a rapid increase in surface rainwater runoff (Solpuker et al., 2014; Xu et al., 2015). There are a large number of nutrients such as nitrogen (N) and phosphorus (P) from municipal garbage, waste water and atmospheric deposition in rainwater runoff, which aggravate the surface rainwater runoff pollution (Djukic et al., 2016; Chen et al., 2022). When these N and P pollutants entered the natural water body with rainwater runoff, they can cause eutrophication of water body (Kabenge et al., 2016; L. Li et al., 2021a; Wu et al., 2020). At the same time, surface runoff pollutants are characterized by strong randomness, wide sources, complex components and a wide range of pollution, making the pollution problem difficult to deal with. How to control the runoff pollutants effectively in the urban area has become a hot research pot for protecting the water environment.
In recent years, the investigation of urban surface runoff pollution in China shows that phosphorus pollution in urban surface runoff is becoming increasingly serious (Luo et al., 2012). A series of low-impact development measures in the sponge city construction, such as the permeable pavement, constructed wetland, filtration system and bioretention cells, integrate flood peak flow regulation and runoff reduction as a whole, which can not only purify water quality and regulate rainwater runoff but also serve as urban landscape facilities to beautify the urban environment. Such measures are mainly based on the absorption and filtration of phosphorus from wastewater through plants, soil and filler. The composition and properties of fillers are the key factors in determining the phosphorus removal efficiency of surface runoff treatment facilities. However, the widely used filler is mainly sand and soil with low carbon content, and the filler layer’s water purification effect is insignificant. Therefore, the optimization study of the filler layer is of great significance for the purification of surface runoff pollution (M. Zheng et al., 2022; Y. Zheng and Zhang, 2020).
Coal ash is a waste produced by coal-fired power generation in thermal power plants, which has a low recycling rate and will have an impact on the environment if no measures are taken to treat it (Z. Li et al., 2021b). However, research in recent years has found that coal ash has good phosphorus removal properties. Therefore, ceramsite sintered by coal ash to form a strong, non-clogging, easily recyclable, large particle material to remove phosphorus from wastewater has become a new method to use waste coal ash to remove P from surface runoff pollution. Compared with common phosphorus removal materials, nano-iron have the advantages of better phosphorus removal performance, high reaction efficiency and low-cost effectiveness, so the phosphorus removal effect of ceramsite made by coal ash can be further improved by loading nano-iron (Maamoun et al., 2018). However, the existence of large magnetic and van der Waals forces between the nano-iron makes it easy to agglomerate, and the small particle size of the nano-iron particles makes the material easy to be lost and difficult to be recovered in liquid, these problems and defects make it difficult to promote nano-iron in practical environmental engineering (Phenrat et al., 2007).
This work intends to further study the loading of nano-iron on the surface or well-developed pore structure of the ceramsite made by coal ash to avoid the agglomeration of nano-iron while increasing the contact area between nano-iron and pollutants, to improve the reactivity. And then, this paper intends to determine the phosphorus removal performance of modified coal ash ceramsite loaded with nano-iron and the effect of different laying thicknesses on the phosphorus removal effect through static and dynamic continuous experiments. On this basis, it is also investigated the mechanism of phosphorus removal by modified ceramsite.
This work proposes a new way for the utilization of coal ash and provides a new idea for the improvement of fillers in the treatment of surface rainwater runoff in sponge city construction.
Coal ash sintered ceramsite is made of coal ash as the main raw material, bentonite as binder and pulverized coal as pore-making agent sintered at high temperature. It is a large particle material with high strength, not easy to block, easy to recover, and can be recycled. In this study, the reasonable dosage ranges of coal ash, bentonite and pulverized coal are 140–180 g, 120–160 g, and 30–50 g, respectively. On this basis, orthogonal experimental design was used to optimize the ratio scheme of coal ash, bentonite and pulverized coal. Finally, the ratio of the three materials was determined as 50% of coal ash, 37.5% of bentonite and 12.5% of pulverized coal respectively. According to the proportioning scheme, coal ash, bentonite and pulverized coal are mixed evenly, and then a certain amount of water is added according to the solid-water ratio of 3:1 to stir into a uniform liquid shape, which is then put into a small granulator to form particles with a diameter of 2–3 mm and a length of about 5–10 mm. The formed ceramite was air dried in natural state for 2 h and then put into Muffle furnace for preheating at 400°C for 15 min and sintering at 1,000°C for 45 min. After natural cooling in the furnace, the pulverized coal ash ceramite needed in this study was obtained.
The coal ash ceramsite was modified by hydrochloric acid, sodium hydroxide, ferric chloride, sulfuric acid and loaded nano iron. It was found that the adsorption and phosphorus removal effect of the ceramic particles modified by sodium hydroxide was not good, and the effect of the ceramic particles modified by loaded nano iron was the best. The main methods for the preparation of loaded iron nanoparticles are gas-phase reduction, liquid-phase reduction, sol-gel method and thermal decomposition carbonyl iron method. Among them, the liquid-phase reduction method and the pyrolysis carbonyl iron method are the most widely used. In addition, the liquid phase reduction method has the advantages of lower cost, higher yield, good loading effect and easy application. Therefore, this experiment used the liquid-phase reduction method to modify the coal ash ceramic pellets with loaded iron nanoparticles. The liquid-phase reduction method is to reduce the low-valent iron salts by strong reducing agents and reduce the iron ions to iron monomers loaded on the solid particles.
The experimental loaded iron nanomodified ceramic pellets were prepared as follows: FeSO4•7H2O with concentrations of 0.04 mol/L, 0.05 mol/L, 0.06 mol/L, 0.07 mol/L, 0.08 mol/L, 0.09 mol/L, and 0.1 mol/L (seven concentration gradients) and 1 g of ascorbic acid as a stabilizer were added to seven beakers filled with 100 ml distilled water. Then, NaBH4 solution was dropped into the beaker through a constant pressure funnel to reduce iron ions, the dropping rate was controlled at about 2 drops/sec, the boron/iron (B/Fe) mass ratio was required to be 3:1, and the glass rod was used for continuous stirring during the reaction. After the dropwise addition of the NaBH4 solution is completed, continue to stir the mixed solution for 5 min to complete the reaction. Then, the product was washed 3 times with anhydrous ethanol, and the resultant product was ceramsite loaded with nano-iron.
The modified ceramsite was used to remove phosphorus from simulated wastewater, and the adsorption capacity of modified coal ash ceramsite for phosphorus was compared to determine the optimum modification concentration of the modifier. A conical flask was filled with 150 ml of simulated wastewater containing phosphorus with 1 mg/L, and 5 g of coal ash ceramsite modified by different concentrations. 7 conical flasks were placed in a constant temperature oscillator and allowed to oscillate at a constant temperature of 25°C and an oscillation speed of 250 r/min for 4 h. After the reaction was completed, the solution containing phosphorus was aspirated with a syringe. The phosphorus concentration in the solution was measured after the solution containing phosphorus was filtered through a filter membrane, and the phosphorus removal rate was calculated by Eq. 1.
where
The results showed that when the ceramic pellets were modified with iron nanoparticles loaded with ascorbic acid as a stabilizer, the removal rates were all stable above 99%.
In this study, a cylindrical experimental device was used to explore the phosphorus removal effect of loaded nano-iron ceramsite as medium filler. The experimental device consisted of four parts: digital peristaltic pump, water tank, experimental column and rubber tube. The experimental column was a glass column with 30 cm height, 5 cm inner diameter and 0.5 cm wall thickness. The bottom of the experimental column is provided with a water inlet, and the top is provided with a water outlet. The water tank, peristaltic pump and experimental column are connected by rubber tubing. The experimental setup is shown in Figure 1.
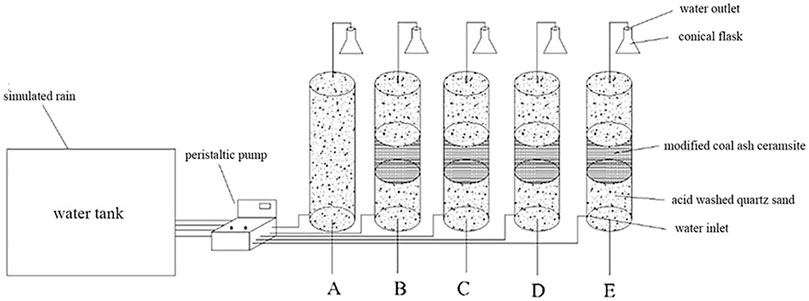
FIGURE 1. Diagram of the cylindrical experimental setup.
To study the phosphorus removal effect of nano-iron ceramsite loaded with different thicknesses, nano-iron ceramsite loaded with different thicknesses was added to the experimental columns numbered A, B, C, and D, respectively. The test column A was set as the blank control group, in which only three layers of acid-washed quartz sand were added, 300 g for each layer. Test column B was successively added with 375 g pickling quartz sand, 83 g loaded nano-iron ceramsite and 375 g pickling quartz sand, in which the thickness of the loaded nano-iron ceramsite was 5 cm. Test column C was successively added with 300 g pickling quartz sand, 167 g loaded with nano-iron ceramsite and 300 g pickling quartz sand, in which the thickness of the loaded nano-iron ceramsite was 10 cm. Test column D was successively supplemented with 150 g pickling quartz sand, 334 g nano-iron ceramsite and 150 g pickling quartz sand, in which the thickness of nano-iron ceramsite loaded was 20 cm. A peristaltic pump was used to feed self-prepared simulated wastewater with phosphorus concentration of 1 mg/L into the lower part of the cylindrical tube at the speed of 10 ml/min. The experimental solution was obtained from the upper outlet at 0.5, 1, 1.5, 2, 4, 6, 8, 10, 12, 14, 16, 18, 20, 22, and 24 h elapsed time. The phosphorus ion concentration in the solution was measured, and the phosphorus removal rate was calculated by Eq. 1, to explore the changing trend of phosphorus removal rate with time of nano-iron ceramsite loaded with different thicknesses.
The adsorption isotherm model and adsorption kinetics model were used to fit the adsorption process of phosphorus on the ceramsite loaded with nano-iron and judge the adsorption type and the maximum adsorption capacity. Field emission scanning electron microscope (SEM) (JEOL, Japan) was used and the energy spectrum analysis was performed, to further analyze and explain the loading effect of coal ash ceramsite and the main reaction mechanism of phosphorus removal of coal ash ceramsite loaded with nano-iron.
Six conical bottles were taken out, and 150 ml phosphorus-containing wastewater with concentrations of 2 mg/L, 4 mg/L, 6 mg/L, 8 mg/L, 10 mg/L, and 12 mg/L was added to each conical bottle, then 2 g ceramsite loaded with nano-iron were added respectively. The six conical bottles were put into a thermostatic shaking chamber, and the conical bottles were kept at a constant temperature of 25°C. The oscillation speed was 250r/min for 24 h. After the reaction, the concentration of residual phosphorus in the solution was determined, and the adsorption capacity of phosphorus on the ceramsite loaded with nano-iron was calculated. After the reaction, the equilibrium concentration of phosphorus (
Where
The Langmuir isothermal adsorption model and Freundlich isothermal adsorption model were used to fit the equilibrium concentration (
Where
In the experiment, ceramsite loaded with nano-iron was used as adsorbent. Nine conical bottles were taken out, and 150 ml phosphorus-containing wastewater with a concentration of 2 mg/L was added to each conical bottle, and then 2 g ceramsite loaded with nano-iron were added respectively. The 9 conical bottles were put into a constant temperature oscillation chamber, and the conical bottles were allowed to oscillate at a constant temperature of 25°C and an oscillation speed of 250r/min. The conical flask was removed at the oscillation adsorption time of 10 min, 30 min, 1, 1.5, 2, 4, 6, 8 , and 24 h, respectively, and the phosphorus-containing solution was aspirated with a syringe and filtered through a filter membrane to determine the phosphorus concentration
Where
The pseudo-first-order kinetic model, pseudo-second-order kinetic model, and Elovich kinetic model were used to fit the data according to the adsorption quantity
Where
After confirming the feasibility of ceramsite loaded with nano-iron as filler, a field emission scanning electron microscope was used to obtain the scanning electron microscope images of the coal ash ceramsite unloaded with nano-iron and the coal ash ceramsite loaded with nano-iron before and after the adsorption of phosphorus, and the energy spectrum analysis was performed, to further analyze and explain the loading effect of coal ash ceramsite and the main reaction mechanism of phosphorus removal of coal ash ceramsite loaded with nano-iron.
Based on the phosphorus concentration
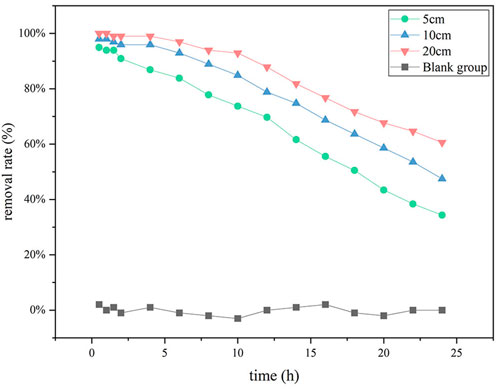
FIGURE 2. Dynamic phosphorus removal effect of ceramsite loaded with nano-iron of different thickness.
According to the concentration of residual phosphorus in the solution measured after the reaction of wastewater containing phosphorus of different concentrations, the adsorption capacity of ceramsite loaded with nano-iron on phosphorus was calculated as shown in Table 1 and Figure 3 was drawn according to Table 1.
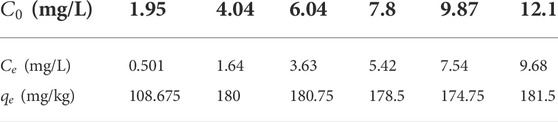
TABLE 1. Results of isothermal adsorption experiment.

FIGURE 3. Adsorption isotherms of phosphorus on ceramsite loaded with nano-iron.
As can be seen from Figure 3, with the progress of adsorption, the active sites in the adsorbent are occupied, the active sites in the adsorbent are occupied and it becomes more difficult for the adsorbent molecules to contact the active sites on the surface, and the adsorption thus gradually tends to equilibrium. Langmuir isothermal adsorption model and Freundlich isothermal adsorption model were used to fit the adsorption isotherms respectively, and the fitting results were shown in Figure 4 and Table 2.
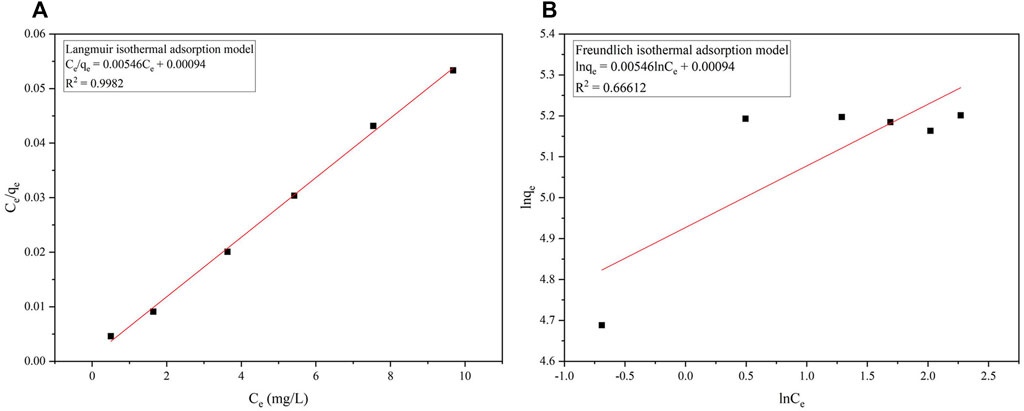
FIGURE 4. Fitting of the isothermal adsorption models. (A) the Langmuir isothermal adsorption model; (B) the Freundlich isothermal adsorption model.
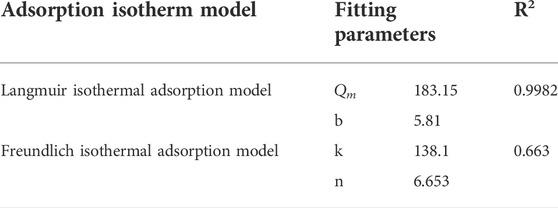
TABLE 2. Fitting results of adsorption isotherm model.
It can be seen from Figure 4 that the determination coefficient of 0.99 fitted by the Langmuir isothermal adsorption model is much higher than that fitted by the Freundlich isothermal adsorption model of 0.66, indicating that the Langmuir isothermal adsorption model can better describe the process of phosphorus adsorption by ceramsite loaded with nano-iron and that the adsorption of phosphorus on the surface of ceramsite loaded with nano-iron is single-layer adsorption. Surface adsorption plays a leading role in the adsorption process.
According to the concentration of phosphorus in the solution measured at different time points in the oscillating adsorption process, the adsorption capacity of phosphorus on the ceramsite loaded with nano-iron at different adsorption times was calculated as shown in Table 3.
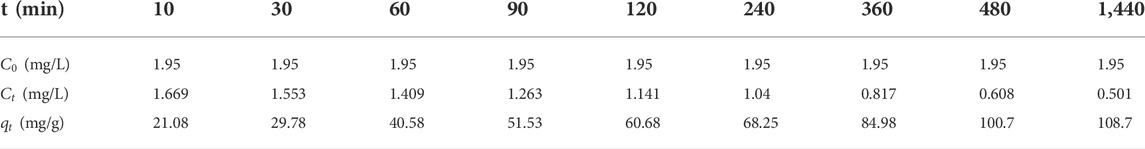
TABLE 3. The adsorption capacity of phosphorus on ceramsite loaded with nano-iron by different adsorption time.
The experimental results were fitted with the quasi-first-order kinetic model, quasi-second-order kinetic model and Elovich model respectively, and the fitting results were shown in Figure 5 and Table 4.
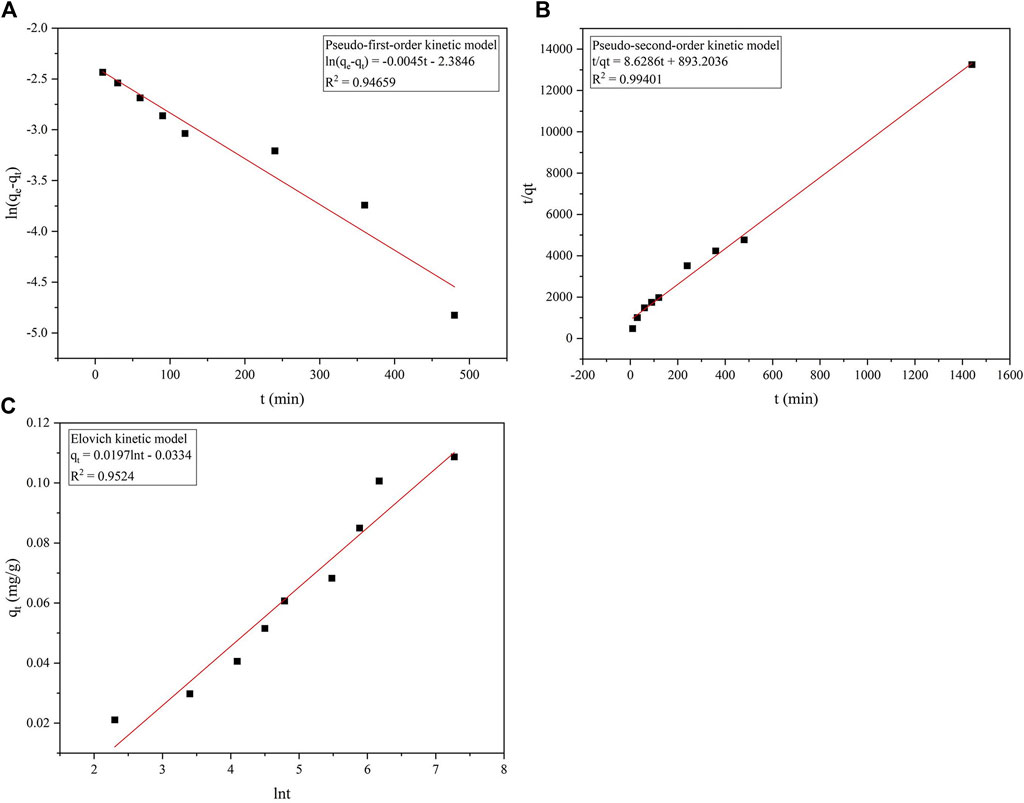
FIGURE 5. Fitting of the adsorption kinetic model of phosphorus on the ceramsite loaded with nano-iron. (A) the pseudo-first-order kinetic model; (B) the pseudo-second-order kinetic model; (C) the Elovich kinetic model.
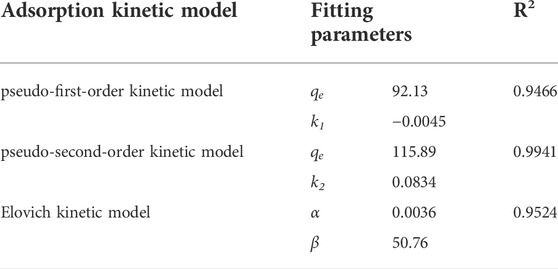
TABLE 4. Fitting results of adsorption kinetic model.
According to Figure 5A, the determination coefficient R2 of quasi-first-order kinetic model fitting is 0.947. The equilibrium adsorption capacity calculated from the equation intercept is 92.13 mg/kg, while the experimentally measured equilibrium adsorption capacity is 108.68 mg/kg, there is a certain gap between the two. Therefore, the quasi-first-order kinetic model is not applicable to fit the adsorption of phosphorus by ceramsite loaded with nano-iron in this experiment. Figure 5B shows that the determination coefficient of the quasi-second-order kinetic model is as high as 0.994. The equilibrium adsorption capacity of ceramsite loaded with nano-iron simulated by the quasi-second-order dynamics model is 115.89 mg/kg, which has a small difference from the experimental equilibrium adsorption capacity of 108.86 mg/kg, indicating that the quasi-second-order kinetic model can be used to estimate the equilibrium adsorption capacity of ceramsite loaded with nano-iron to phosphorus. The model shows that the adsorption process of phosphorus on the ceramsite loaded with nano-iron is monolayer chemisorption. It can be seen from Figure 5C that the determination coefficient of the Elovich model is 0.952, and the correlation is between the quasi-second-order kinetic model and the quasi-first-order kinetic model.
In summary, it is concluded that the quasi-second-order kinetic model has the best correlation, and the equilibrium adsorption calculated according to the fitted straight line is the closest to the measured value in the experiment, indicating that the adsorption process of the ceramsite loaded with nano-iron for phosphorus is the most suitable for use. According to the quasi-second-order kinetic model, the adsorption rate of phosphorus on the ceramsite loaded with nano-iron is proportional to the square of the unoccupied active sites on its surface.
The comparison of scanning electron microscope before and after phosphorus adsorption is illustrated in the following image.
As can be seen from Figure 6, the surface of the coal ash ceramsite was flat, smooth and dense when they were not loaded with nano-iron. After the coal ash ceramsite was loaded with nano-iron, the surface of the ceramsite became rough, and the nano-iron particles were uniformly loaded on the surface of the ceramsite with a particle size of about 20–50 nm. There was no obvious agglomeration phenomenon of nano-iron, and the loading effect is good, which improved the material activity. The comparison shows the changes in the ceramsite loaded with nano-iron after the adsorption of phosphorus. With the adsorption of phosphorus by ceramsite loaded with nano-iron, the morphology of nano-iron changed greatly, some nano-iron particles disappeared and many amorphous precipitates appeared, which are supposed to be Fe(OH)2 and Fe(OH)3 produced by zero-valent iron during the reaction process.

FIGURE 6. Comparison of scanning electron microscope before and after phosphorus adsorption (A) coal ash ceramsite unloaded with nano-iron (1 μm); (B) coal ash ceramsite unloaded with nano-iron (500 nm); (C) coal ash ceramsite loaded with nano-iron before the adsorption of phosphorus (1 μm); (D) coal ash ceramsite loaded with nano-iron before the adsorption of phosphorus (500 nm); (E) coal ash ceramsite loaded with nano-iron after the adsorption of phosphorus (1 μm); (F) coal ash ceramsite loaded with nano-iron after the adsorption of phosphorus (500 nm).
It can be seen from Figure 7 that the main elements in the coal ash ceramsite are oxygen (O), aluminum (Al) and silicon (Si). The iron element in the ceramsite increased after the loading of nano-iron, indicating that nano-iron was loaded on the ceramsite. By comparison, it can be seen that the O and P elements in the ceramsite loaded with nano-iron increased after the adsorption of phosphorus, indicating that the ceramsite loaded with nano-iron has an obvious adsorption effect on phosphorus.
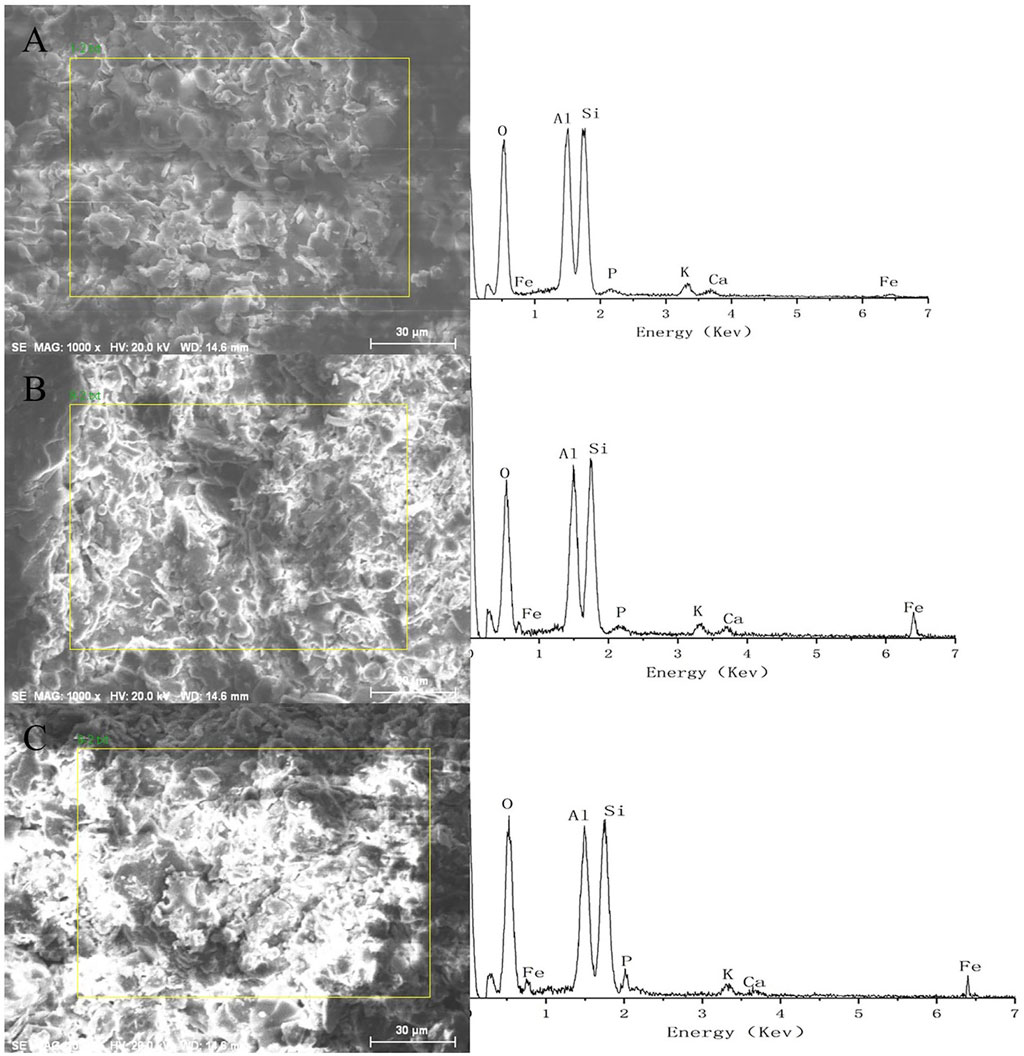
FIGURE 7. Comparison of energy spectrum analysis diagram before and after phosphorus adsorption (A) coal ash ceramsite unloaded with nano-iron; (B) coal ash ceramsite loaded with nano-iron before the adsorption of phosphorus; (C) coal ash ceramsite loaded with nano-iron after the adsorption of phosphorus.
The elemental fractions of iron in the complete spectrum were amplified by X-viewer software to obtain the spectrum of iron in ceramsite loaded with nano-iron before and after the adsorption of phosphorus, as shown in Figures 8, 9.
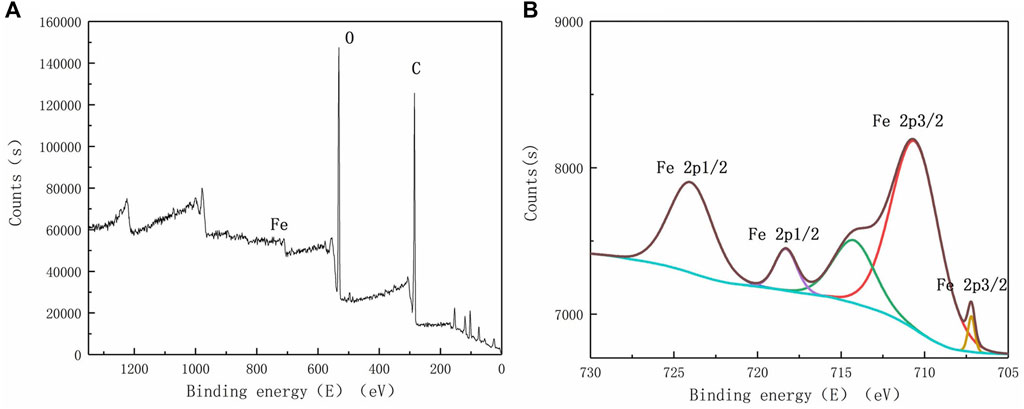
FIGURE 8. X-ray photoelectron spectroscopy before phosphorus adsorption (A) complete spectrum; (B) enlarged spectrum of Fe.
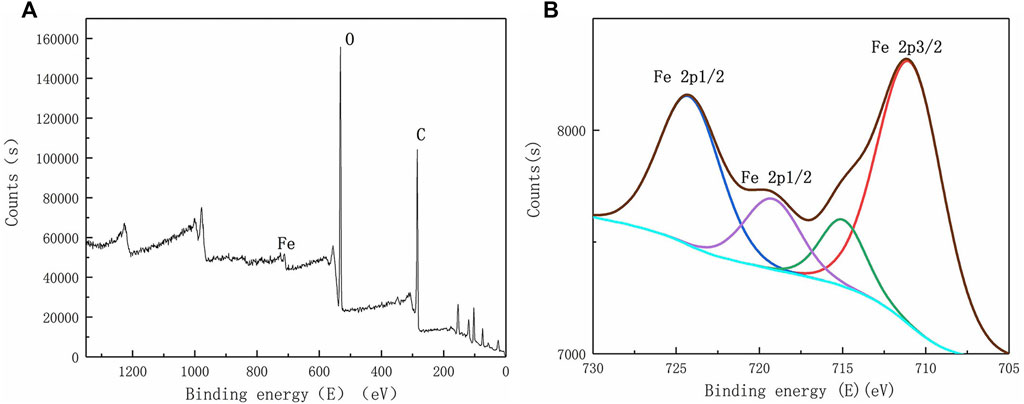
FIGURE 9. X-ray photoelectron spectroscopy after phosphorus adsorption (A) complete spectrum; (B) enlarged spectrum of Fe.
As can be seen from Figure 8, the main elements contained in the coal ash ceramsite loaded with nano-iron are carbon (C) and oxygen (O). In addition, the iron element is also observed, which is not prominent in the complete spectrum. The iron element mainly contains five peaks, among which the characteristic peaks of 707.20eV and 718.30eV correspond to electron binding energy of Fe2p3/2 and Fe2p1/2, characteristic peaks of 710.60eV correspond to the electron binding energy of Fe3O4, and characteristic peaks of 714.23eV and 724.00eV correspond to electron binding energy of Fe(III) Fe2p3/2 and Fe2p1/2, inferring that there are iron oxides in the coal ash ceramsite loaded with nano-iron.
By comparing Figures 8, 9, it can be found that the photoelectronic characteristic peak near 707.20eV disappears, and the position of the binding energy of other peaks changes, indicating that nano-iron reacted to produce other substances. X-ray photoelectron spectroscopy scanning of ceramsite loaded with nano-iron showed that it was partially oxidized to produce iron oxide, and the nano-iron loaded on the ceramsite adsorbed phosphorus to produce FeOOH, FePO4, Fe(OH)3 and so on. It can be inferred that the main reactions that occurred in the removal of phosphorus by ceramsite loaded with nano-iron were chemical precipitation, adsorption and co-precipitation.
In this paper, different modifiers were used to modify the coal ash ceramsite at different concentrations to compare their static adsorption capacity of phosphorus and to determine the optimum modification concentration of the modifiers. Then the dynamic removal effect of coal ash ceramsite modified by different modifiers and ceramsite loaded with nano-iron of different thicknesses was studied by dynamic cylinder experiments. Scanning electron microscope (SEM) and X-ray photoelectron spectroscopy (XPS) were used to characterize and analyze the material, so as to analyze the phosphorus removal mechanism of ceramsite loaded with nano-iron. The main conclusions of this paper are as follows:
(1) The most effective modification method for coal ash ceramsite is the loading of nano-iron for modification, and the removal rates of phosphorus were all stable at over 99% when ascorbic acid was used as the stabilizer.
(2) The maximum removal rate of phosphorus by ceramsite loaded with nano-iron was 98.0% after 0.5 h from the beginning of the dynamic continuous experiment. As time increased, phosphorus’s removal effect decreased, and the removal rate decreased to 47.5% after 24 h of the experiment. Under the condition of ceramsite loaded with different thicknesses of nano-iron, the phosphorus removal rates decreased gradually with time, and the decreasing slope of removal rate decreased with the increase of thickness.
(3) The adsorption process of the ceramsite loaded with nano-iron to phosphorus belongs to the uniform monomolecular layer of chemical adsorption on the surface. And the adsorption rate of the ceramsite loaded with nano-iron to phosphorus is proportional to the square of the unoccupied adsorption sites on the iron powder. The nano-iron particles were uniformly loaded on the surface of the coal ash ceramsite and no obvious agglomeration phenomenon was observed. With the adsorption of phosphorus by ceramsite loaded with nano-iron, some nano-iron particles disappeared and many amorphous precipitates appeared. At the same time, iron-nanoparticles were partially oxidized before adsorption to generate iron oxides, which produced FePO4, FeOOH, Fe(OH)3 and so on after adsorption of phosphorus. It can be inferred that the main reactions that occurred in the removal of phosphorus by ceramsite loaded with nano-iron were chemical precipitation, adsorption and co-precipitation.
If the loaded nano-iron ceramsite is applied to practical applications, we still need to consider some problems, such as further improving the load rate and load strength of nano-iron, expanding the study of material laying, material recovery, material recycling and reducing secondary pollution.
The original contributions presented in the study are included in the article/Supplementary Material, further inquiries can be directed to the corresponding authors.
XG contributed to the conception of the study and provided financial support. YZ and SH performed the experiment and the data analyses. YZ and LZ contributed significantly to the analysis and manuscript preparation. YZ wrote the manuscript. All authors approved the final draft.
This study was funded by the Major Scientific and Technological Special Program of Sichuan Province, China (2018SZDZX0027 and 2019-YF09-00081-SN).
The authors declare that the research was conducted in the absence of any commercial or financial relationships that could be construed as a potential conflict of interest.
All claims expressed in this article are solely those of the authors and do not necessarily represent those of their affiliated organizations, or those of the publisher, the editors and the reviewers. Any product that may be evaluated in this article, or claim that may be made by its manufacturer, is not guaranteed or endorsed by the publisher.
Chen, X., Wang, Y., Bai, Z., Ma, L., Strokal, M., Kroeze, C., et al. (2022). Mitigating phosphorus pollution from detergents in the surface waters of China. Sci. Total Environ. 804, 150125. doi:10.1016/j.scitotenv.2021.150125
Djukic, A., Lekic, B., Rajakovic-Ognjanovic, V., Veljovic, D., Vulic, T., Djolic, M., et al. (2016). Further insight into the mechanism of heavy metals partitioning in stormwater runoff. J. Environ. Manage. 168, 104–110. doi:10.1016/j.jenvman.2015.11.035
Kabenge, M., Wang, H., and Li, F. (2016). Urban eutrophication and its spurring conditions in the murchison bay of Lake victoria. Environ. Sci. Pollut. Res. 23, 234–241. doi:10.1007/s11356-015-5675-0
Largitte, L., and Pasquier, R. (2016). A review of the kinetics adsorption models and their application to the adsorption of lead by an activated carbon. Chem. Eng. Res. Des. 109, 495–504. doi:10.1016/j.cherd.2016.02.006
Li, L., Wu, L., Yang, L., Liu, C., Li, J., and Li, N. (2021a). Combined impact of organic matter, phosphorus, nitrate, and ammonia nitrogen on the process of blackwater. Environ. Sci. Pollut. Res. 28, 32831–32843. doi:10.1007/s11356-021-13050-1
Li, W., Luo, S., Ma, H., Yi, F., Li, Z., Guo, W., et al. (2020). Adsorption kinetics and isothermal adsorption model of crystal violet on modified red mud. IOP Conf. Ser. Earth Environ. Sci. 508, 012151. doi:10.1088/1755-1315/508/1/012151
Li, Z., Qian, W., Chen, Y., Xu, P., Li, J., and Yang, J. (2021b). A new treasure in industrial solid waste—Coal fly ash for effective oil/water separation. J. Taiwan Inst. Chem. Eng. 118, 196–203. doi:10.1016/j.jtice.2020.12.026
Luo, Z., Wang, T., Gao, M., Tang, J., and Zhu, B. (2012). Stormwater runoff pollution in a rural township in the hilly area of the central Sichuan Basin, China. J. Mt. Sci. 9, 16–26. doi:10.1007/s11629-012-2189-9
Maamoun, I., Eljamal, O., Khalil, A. M. E., Sugihara, Y., and Matsunaga, N. (2018). Phosphate removal through nano-zero-valent iron permeable reactive barrier; column experiment and reactive solute transport modeling. Transp. Porous Media 125, 395–412. doi:10.1007/s11242-018-1124-0
Phenrat, T., Saleh, N., Sirk, K., Tilton, R. D., and Lowry, G. V. (2007). Aggregation and sedimentation of aqueous nanoscale zerovalent iron dispersions. Environ. Sci. Technol. 41, 284–290. doi:10.1021/es061349a
Solpuker, U., Sheets, J., Kim, Y., and Schwartz, F. W. (2014). Leaching potential of pervious concrete and immobilization of Cu, Pb and Zn using pervious concrete. J. Contam. Hydrol. 161, 35–48. doi:10.1016/j.jconhyd.2014.03.002
Tan, K. B., Vakili, M., Horri, B. A., Poh, P. E., Abdullah, A. Z., and Salamatinia, B. (2015). Adsorption of dyes by nanomaterials: Recent developments and adsorption mechanisms. Sep. Purif. Technol. 150, 229–242. doi:10.1016/j.seppur.2015.07.009
Wu, L., Liu, C., Hu, Y., Tan, B., He, Y., and Li, N. (2020). Dephosphorization using ceramsites modified by coprecipitation with FeSo4 and KMnO4 and high-temperature combustion. J. Water Process Eng. 34, 101162. doi:10.1016/j.jwpe.2020.101162
Xu, H., Chen, L., Zhao, B., Zhang, Q., and Cai, Y. (2015). Green stormwater infrastructure eco-planning and development on the regional scale: A case study of shanghai lingang new city, east China. Front. Earth Sci. 10, 366–377. doi:10.1007/s11707-015-0516-5
Zheng, M., Chen, W., Gao, Q., Liu, S., Deng, C., Ma, Y., et al. (2022). Research on the reduction performance of surface runoff pollution through permeable pavement with different structures. Water Air Soil Pollut. 233, 147. doi:10.1007/s11270-022-05619-4
Keywords: bioretention cells, coal ash, modified ceramsite, nano-iron particles, phosphorus removal
Citation: Zhang Y, Gao X, Zhang L and He S (2022) Study on coal ash loaded nano iron filler to improve the efficient phosphorus removal of biological detention facility. Front. Environ. Sci. 10:1017605. doi: 10.3389/fenvs.2022.1017605
Received: 12 August 2022; Accepted: 13 October 2022;
Published: 25 October 2022.
Edited by:
Chunhui Li, School of Environment, Beijing Normal University, ChinaReviewed by:
Leilei Bai, Nanjing Institute of Geography and Limnology (CAS), Nanjing, ChinaCopyright © 2022 Zhang, Gao, Zhang and He. This is an open-access article distributed under the terms of the Creative Commons Attribution License (CC BY). The use, distribution or reproduction in other forums is permitted, provided the original author(s) and the copyright owner(s) are credited and that the original publication in this journal is cited, in accordance with accepted academic practice. No use, distribution or reproduction is permitted which does not comply with these terms.
*Correspondence: Lulu Zhang, emhhbmdsdWx1QHNjdS5lZHUuY24=; Xueqin Gao, Z2FveHVlcWluQHNjdS5lZHUuY24=
Disclaimer: All claims expressed in this article are solely those of the authors and do not necessarily represent those of their affiliated organizations, or those of the publisher, the editors and the reviewers. Any product that may be evaluated in this article or claim that may be made by its manufacturer is not guaranteed or endorsed by the publisher.
Research integrity at Frontiers
Learn more about the work of our research integrity team to safeguard the quality of each article we publish.