 Wenqi Wang
 Ayong Jiao
 Qianjuan Shan
 Zikang Wang1,2
 Hongbo Ling
95% of researchers rate our articles as excellent or good
Learn more about the work of our research integrity team to safeguard the quality of each article we publish.
Find out more
ORIGINAL RESEARCH article
Front. Environ. Sci. , 28 September 2022
Sec. Atmosphere and Climate
Volume 10 - 2022 | https://doi.org/10.3389/fenvs.2022.1015543
This article is part of the Research Topic Climate Change and Adaptive Capacity Building View all 15 articles
Lakes are important guarantees of regional economic development and ecological security. Previous studies focused on trends of surface area and water level of lakes in Xinjiang, but paid less attention to nonlinear change and driving mechanisms of lake areas at annual and monthly scales. To address this issue, this study used a remote-sensing Big Data cloud platform and mathematical statistical methods to investigate the change in typical lakes and its attribution in Xinjiang during 1986–2020. The results showed that: 1) there was a significant linear trend in Xinjiang lakes: except for Jili Lake, the plains lakes showed an insignificant (p > 0.1) expansion trend, while the mountain lakes showed an significant expansion trend (p < 0.01). 2) There was a significant nonlinear trend in Xinjiang lakes: most of the plains lakes showed periodicity at 14 and 21 years, however most of the mountain lakes showed periodicity at 17 and 21 years. Most of the mutation trends of plains lakes were not significant, yet the mutation trends of mountain lakes showed significant expansion. 3) Human activities were the dominant factor leading to changes in the plains lakes: among the anthropogenic factors, farmland area, GDP, and population had significant effects on lake area (p < 0.1), and lake expansion was closely related to population and farmland area. Among climatic elements, precipitation mainly affected the changes in plains lakes. 4) Climate change was the dominant factor leading to changes in mountain lakes. The effects of temperature change on mountain lakes were all significantly positive (p < 0.05). In the future, it will be necessary to build lake protection schemes that adapt to climate change and human disturbances. This study can provide an important scientific basis for the rational development and utilization of lakes in Xinjiang.
Lakes are an important part of the terrestrial hydrosphere and are particularly sensitive to climate and environmental change. They can record the impact of climate change and human activities on regional hydrological processes at different time scales, especially for inland areas with less precipitation. They are important information carriers to reveal global climate change and regional responses (Zhang et al., 2011; Tao et al., 2015). Lakes are important reservoirs of water resources in arid areas and an important part of the water cycle in arid areas (Song et al., 2013; Song et al., 2013; Kaplan and Avdan, 2017). They are among the most sensitive geographical units in response to global climate change and are also affected by human activities (Jing et al., 2018). In recent decades, inland lakes have undergone drastic changes due to natural environmental changes and human activities (Feng et al., 2016; Deng and Chen, 2017; Deng et al., 2022). However, on a global scale, no consistent trend of lake water level has been found (Wu et al., 2008). In the mountain regions of Asia, mountain glaciers have been shrinking due to rising temperature and increasing precipitation, which has accelerated the expansion of glacial lakes in recent decades (Song et al., 2016; Liu et al., 2019; Huang et al., 2021). Although lakes at high latitudes are expanding, most lakes in arid subtropical regions are shrinking due to the multiple effects of climate warming, population increase, irrigation area expansion and water demand increase caused by economic development (Chaudhari et al., 2018; Wang et al., 2020). There is high vulnerability of water resources in Northwest China. With global warming, increased glacial meltwater have led to rapid increases in lake area on the Tibetan Plateau and Xinjiang (Yao et al., 2022). In addition, the role of lake water resources as a key strategic resource should not be ignored (Qin et al., 2020; Yu et al., 2020). The natural climate characteristics of drought, little rainfall, and strong evaporation has made Xinjiang a restricted water-short environment for a long time. As a natural reservoir and ecological barrier, lakes play an important role in coordinating the space-time balance of water resources, maintaining regional ecological health, and optimizing the human living environment in Xinjiang. Therefore, monitoring and analyzing dynamic changes in lakes, exploring the temporal and spatial evolution of lakes, and implementing lake protection and restoration are hotspots of current ecological environment research (Yu et al., 2020).
Xinjiang is an extremely arid region in China, located in the center of Eurasia and far from the sea (Li et al., 2011). At the same time, Xinjiang is also one of the important distribution areas of lakes in China, with diverse types and wide distribution. However, since the mid-20th Century, due to climate change and unsustainable human economic activities (Zhang et al., 2013), lakes in Xinjiang have changed, which has attracted the attention of many experts and researchers. Remote-sensing images, such as those from Landsat series satellites (MSS, TM, ETM+), SPOT, PlanetScope, and hyperspectral data, have frequently been used to study dynamic changes in lakes (Riaza and Müller, 2010; Song et al., 2013; Revelles and Van Geel, 2016; Cooley et al., 2017). Methods of lake water extraction include the single-band threshold method, the water quality index method, the spectral classification method (Lira, 2006; Ouma and Tateishi, 2006; Gautam et al., 2015), and others. However, most of these studies focused only on linear changes in water area and water volume. Changes in the number and area of lakes are a major problem in the field of lake research. In addition, the interaction between lakes and climate factors may be uneven in altitude zones, basins, and landscapes. So far, the dynamic response of lakes to different altitude gradients and different basin climatic factors has been unclear, which limits our understanding of the interaction between water resources and climate and affects the rational utilization of regional water resources (Zheng et al., 2021). In addition, there are still few detailed analyses of changes in different lakes and the quantitative impact of local climate and human activities (Yu et al., 2020). The lakes in Xinjiang show different change trends at different altitudes (Jing et al., 2018); with the influence of complex topographic and geomorphic conditions, the types of lakes in the region are diverse. Lakes are distributed in different geomorphic types such as plains (altitude <1,500 m), mountains (1,500 m <altitude <3,500 m), and plateaus (altitude >3,500 m). For example, the water supply of plains Lake Ebinur is provided by seasonal snowmelt water and rainfall, which is affected by climate change (Jing et al., 2018). Its shrinkage is also related to rapid land reclamation and ecological environment deterioration (Zhang et al., 2015a). Therefore, further research is needed to determine the changes in different types of lakes and their influencing factors. Water resources are the key to social and economic development and river basin construction in Xinjiang, but research on changes in water resources in Xinjiang is limited, especially in terms of long-term sequences and large spatial scale (Wufu et al., 2020).
Previous studies only focused on the linear changes of lake area, and ignored the nonlinear changes. In addition, previous studies only considered the possible influencing factors of lake area change, and the impact degree of different influencing factors was rarely explored. Therefore, using remote-sensing images, this study investigated three important issues through discussion of the linear and nonlinear variation of lake area at annual and monthly scales, construction of structural equation models, and analysis of the driving mechanism of lake area changes. The three issues are as follows: 1) to summarize the linear change rules of the interannual trend of lake area in Xinjiang based on remote-sensing images; 2) to explore periodic change rules and abrupt-change event diagnosis of lakes in Xinjiang and the intra-year non-linear change rules; and 3) attribution and problems of the evolution of typical lakes in Xinjiang. The overall research process is shown in Figure 1.
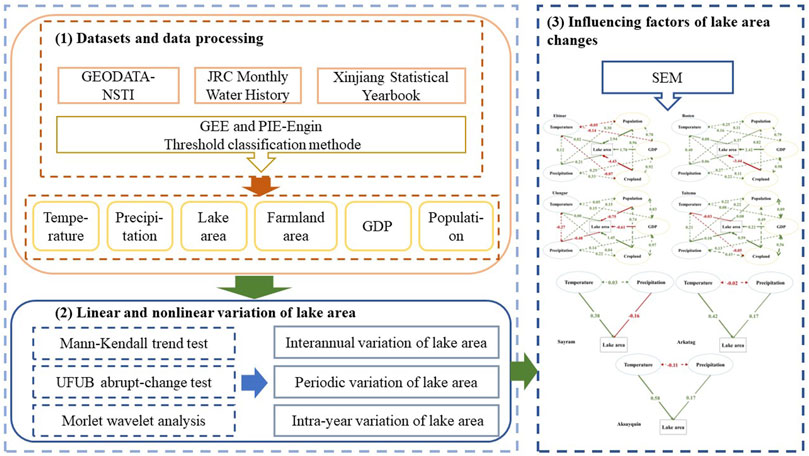
FIGURE 1. The overall framework of the study.
Xinjiang is located in the arid area of northwest China (73°20'∼ 96°25'E, 34°15'∼49°10'N) and is one of the most important places of lake distribution in China. The areas of 110 natural lakes are more than 1 km2, and the water area is about 6,236.44 km2 (Yang et al., 2019). Some of the lakes are terminal lakes and legacies of the ancient Mediterranean Sea. Because Xinjiang is located at a middle latitude in the center of Eurasia, moist water vapor from the ocean has difficulty reaching it. Annual precipitation in Xinjiang is less than 200 mm (Wang et al., 2012), and the spatial distribution is uneven. At the same time, the Tarim Basin, the largest basin in China, and numerous mountains are distributed in Xinjiang, including the Altai Mountains in the north, the Kunlun Mountains in the south, and the Tianshan Mountains that span the whole province. Xinjiang has complex topographic and geomorphic conditions and various types of lakes, including 53 plateau lakes (altitude >3500 m), 23 alpine lakes (1,500 m < altitude <3,500 m), and 45 plains lakes (<1,500 m) (Bai et al., 2011). The spatial distribution of lakes in Xinjiang is extremely uneven, which is an important reason for spatial differences in regional water resources. From a quantitative standpoint, about 40% of the lakes are concentrated in the surrounding Tianshan Mountains, about 30% in the southern Qiangtang Plateau, about 21% in the southern foothills of the Altai Mountains, and relatively few in the Tarim and Junggar Basins.
The total number of lakes in Xinjiang has been increasing at an average rate of five per year, and the number of large lakes (over 50 km2) has increased significantly (Zheng et al., 2021). Therefore, ten large lakes (over 100 km2) in Xinjiang (Li et al., 2015) were selected in this study and divided into two types: plains lakes (altitude <1,500 m) and mountain lakes (altitude >1,500 m) to analyze the evolution of and protection strategies for major lakes in Xinjiang (Figure 2). Among these, Lakes Ebinur, Bosten, Ulungur, Jili, and Taitema are plains lakes (altitude <1,500 m), and Lakes Sayram, Aqqikkol, Ayakkum, Arkatag, and Aksayquin are mountain lakes (altitude >1,500 m). The plains Lakes Ebinur, Bosten, Ulungur, Jili, and Taitema are all located in the basin area and belong to a temperate continental arid climate with little precipitation and large evaporation. Rivers within the basin are the main source of replenishment for lakes. The largest area of lakes generally occurs in spring, and the smallest area generally occurs in summer and autumn. The mountain Lake Sayram is located in the Junggar Basin, and Lakes Aqqikkol, Ayakkum, Arkatag, and Aksayquin are located in the Kunlun Mountains, which belong to a continental arid climate, where the lakes are mainly replenished by precipitation and meltwater ice and snow. The largest area of lakes generally occurs in autumn, and the smallest area generally occurs in winter and spring.
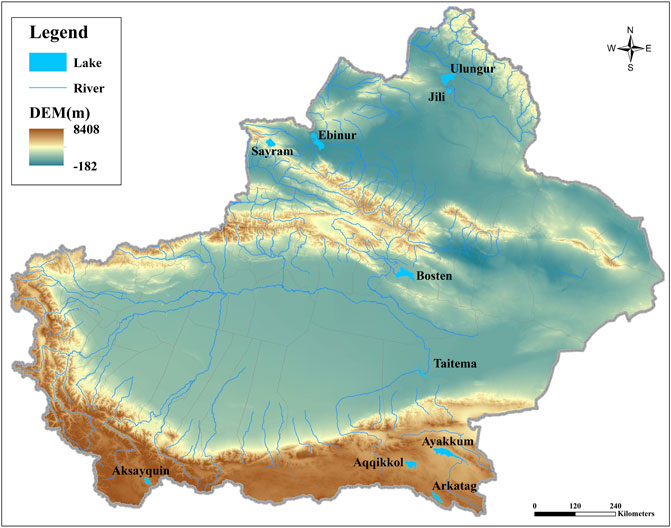
FIGURE 2. Distribution of typical lakes in Xinjiang.
To study the influence of climatic factors on the number and area changes of lakes, this study used a monthly average temperature and precipitation dataset (http://www.geodata.cn/) for China with a spatial resolution of 1 km from January 1901 to December 2020. The data are based on global climate data with a spatial resolution of 0.5° released by CRU (Climatic Research Unit) and on global high-resolution climate data released by WorldClim through the Delta spatial downscaling scheme in the region of China. The temperature unit is 0.1°C, and the precipitation unit is 0.1 mm. To study the influence of human factors on lake volume and area changes, this study used the farmland area (km2), GDP (ten thousand yuan) and population (ten thousand) of each lake basin from 1988 to 2020 as obtained from the Xinjiang Statistical Yearbook (xinjiang.gov.cn) from 1988 to 2020.
To improve the efficiency and accuracy of lake water extraction, this study was based on the Google Earth Engine (GEE) (https://code.earthengine.google.com) and the Pixel Information Expert Engine (PIE-Engine), which are two remote-sensing Big Data and cloud computing platforms, to efficiently process massive remote-sensing images.
The JRC Monthly Water History (V1.3) dataset contains maps of the spatial and temporal distribution of surface water from 1984 to 2020 and provides statistics on the extent and variation of water bodies at a spatial resolution of 30 m (Pekel et al., 2016). This dataset has only one band and three values: 0, 1, and 2, where 0 means no data; 1 means that there are data, but not for water; and 2 means that there are data for a water body.
The threshold classification method is a classical image segmentation algorithm. It uses the difference between the target object of interest and the non-target object of a certain image feature of a remote-sensing image to divide the image into several classes by setting the threshold, which achieves the separation of target and non-target objects. This study evaluated each raster point in the image and determined whether the raster point belonged to the water body based on the band characteristics of the JRC Monthly Water History dataset, which can be expressed by a mathematical formula as follows:
where f (x, y) is the original image and g (x, y) is the segmented image. By counting the number of grid cells within the study area and multiplying by the area of each grid cell, the water area within the study region can be obtained.
Based on long-time-series lake area data, linear regression and nonparametric tests were performed using the Mann-Kendall trend test (Mann, 1945; Kendall, 1948) to calculate the rate of change in lake area from 1986 to 2020 and to test its significance. The Mann-Whitney mutation test (Odeh, 1972; Whitney, 1997) obtained the year of abrupt lake area change in the study region and determined the time period causing the abrupt change in lake area. The influence of climate change and human activities on lake area change was clarified by correlation analysis, and the main research method to clarify the cause of lake area change was the Mann-Kendall trend test.
The Mann-Kendall statistical test is a non-parametric test method. The time series X1, X2, X3..., Xn are successively compared, and the results are represented by
The calculated result of the Mann-Kendall statistic is:
where xk and xi are random variables and n is the length of the selected data series. The test statistic Zc is:
where |Zc|≥1.96 indicates that at the 0.05 significance level, the sample sequence has a significant trend, and |Zc|>2.58 indicates that at the 0.01 significance level, the sample sequence has a significant trend. Positive Zc indicates an upward trend, and negative Zc indicates a downward trend.
For the time series Xi (i = 1,2,……,n), an order Sk, which represents the cumulative number of Xi > Xj (1 ≤ j ≤ i) in the ith sample, is then constructed. The expression is:
Under the assumption that the time series are independent and random,
Then the statistic UFk is defined as
UF is the standard normal distribution, given the level of significance. If |UFk|>Ua, this indicates an obvious trend in the time series. UF greater than zero indicates an upward trend, whereas UF less than zero indicates a downward trend. The next step is to plot UF as a curve on the time axis and then inversely arrange the time series into a series xn, xn-1,……,x1 according to the above method to make a reverse statistic UBk curve. Then the Uk series is tested, given the significance level a = 0.05. If there is an intersection of two curves in the confidence interval |U|≤1.96, the time corresponding to that point is the point in time when the sequence suddenly changed.
In this study, the Morlet wavelet analysis method was used to study the periodic changes of temperature and precipitation in the lake area. For the time series function f(t), the wavelet variation is defined as
where
The wavelet squared difference is
Wavelet variance represents the intensity of periodic fluctuations of time series within this scale (Gao and Li, 1993). The scale of the corresponding peak is the main period of the sequence. The wavelet coherence spectrum is used to measure the strength of local correlation between two time series in time-frequency space. The wavelet coherence spectra of two time series X and Y are defined as follows:
where
where
A structural equation model (SEM) is a comprehensive data statistical and analysis method based on the variable covariance matrix to analyze the relationship between multivariate data (Garrido et al., 2022). According to the prior knowledge of researchers, the dependence relationship between factors in the system is preset. This information can distinguish the relationship strength of each factor. The variables selected in this study include temperature and precipitation at plains and mountain lakes, basin farmland area, GDP, and population. In SEM, the “dependence” relationship between variables is used to replace the “causality” relationship. In the SEM graphical framework, this “dependence” relationship is usually represented by a one-way arrow pointing to the response variable, with the starting point of the arrow indicating the predictor variable. When the “cause” and “effect” relationship between variables cannot be accurately judged according to current cognition, or when the variables are causal to each other, two-way arrows are used to link related variables. Green, red, and dashed arrows indicate significant positive, significant negative, and insignificant path relationships respectively. The value is the normalized path coefficient, and the arrow thickness represents the relative magnitude of the normalized path coefficient. A structural equation model is then fitted by the Lavaan package in the R language.
Except for Lake Jili, all plains lakes showed an insignificant (p > 0.1) expansion trend. Lake Jili showed a significant expansion trend (p < 0.05). The areal expansion of Lake Taitema was significant (p < 0.01), and the annual growth rate of Lake Taitema was the highest (8.17 km2), followed by Lake Ebinur.
From 1986 to 2020, the areas of Lakes Ebinur and Bosten both showed an “expansion-shrinkage-expansion” trend (as shown in Figure 3). Before 2,000, the area of Lake Ebinur was relatively stable, and Lake Bosten showed a steady increasing trend. From 2002 to 2008 and from 1996 to 2006, the area of these two lakes both exceeded the multi-year average area (593.61 km2 and 976.11 km2). The largest areas of Lakes Ebinur and Bosten appeared at the beginning of the 21st Century, at 810.38 km2 and 1,071.32 km2 respectively. The smallest areas appeared after 2010, at 417.30 km2 and 904.93 km2 respectively. The main area where Lake Ebinur changed was the northwest entrance to the lake; the expansion area of Lake Bosten in 2002 was mainly in the north and southeast parts of the lake. In 2013, the lake contracted inward as a whole, after which the lake began to expand (as shown in Figure 3). Lake Ulungur was connected with Lake Jili, but the water storage capacity of Lake Jili was much smaller than that of Lake Ulungur. Under the inflow conditions of the same period, the changes in Lake Jili were more complex. From 1988 to 2020, the multi-year average area of Lake Ulungur was 849.14 km2, which was 680.08 km2 larger than that of Lake Jili. Lake Jili showed a significant expansion trend (p < 0.05), whereas Lake Ulungur showed an insignificant expansion trend (p > 0.1). From the perspective of spatial distribution, the area of Lake Ulungur was relatively stable, but the entrance to Lake Jili and the southeast part changed significantly (as shown in Figure 3). Due to the great impact of ecological water conveyance, the area of Lake Taitema changed significantly from 1988 to 2020. The multi-year average lake area was 84.82 km2, and the annual growth rate was 8.17 km2 a−1. The expansion trend was significant (p < 0.01). From 1986 to 2020, the largest area was 402.12 km2 in 2017, whereas the smallest area was almost zero because the lake dried up. Lake Taitema expanded from the center of the lake to the surrounding areas, and the lake area increased as a whole (as shown in Figure 3).
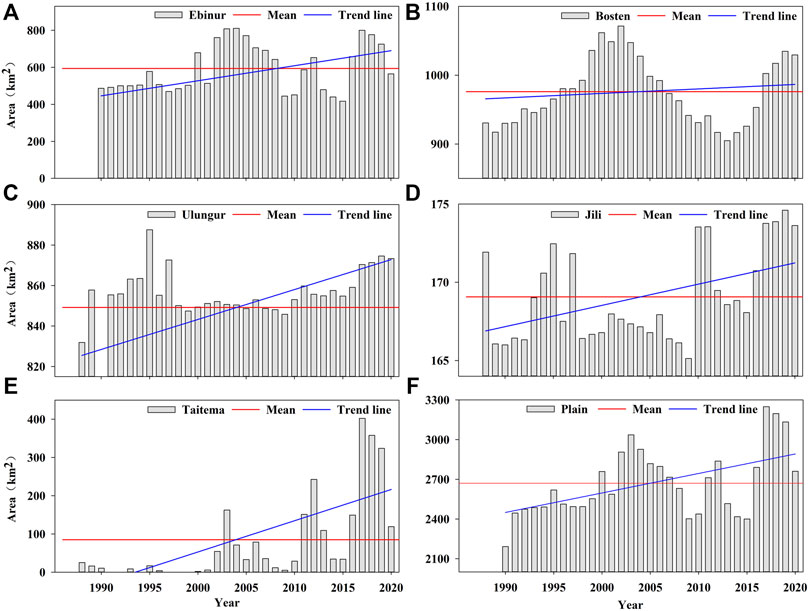
FIGURE 3. Area changes of typical plains lakes in Xinjiang from 1986 to 2020 (A) Lake Ebinure; (B) Lake Bosten; (C) Lake Ulungur; (D) Lake Jili; (E) Lake Taitema; (F) the plains lakes.
The mountain lakes showed an significant expansion trend (p < 0.01), among which the growth rate of Lake Sayram was the lowest, only 0.2 km2 a−1, and the growth rate of Lake Ayakkum was the highest, at 17.32 km2 a−1.
Before 2000, the annual growth rate of Lake Sayram was 0.20 km2 a−1, and the area was smaller than its multi-year average area of 461.52 km2, with the smallest area of 459.86 km2 occurring in 1998. After 2000, the areal growth rate was 0.14 km2 a−1, which was less than before 2000, and the area became larger than the multi-year average area. From 2004 to 2020, the area stably changed between 463 km2 and 465 km2, and the lake area was 464.77 km2 in 2020. From a spatial point of view, the changes to this water body happened mainly at the peripheral boundary (as shown in the figure). The areas of Lakes Aqqikkol, Ayakkum, and Arkatag increased significantly (p < 0.01), and their areas in 2020 were 1.78, 1.91, and 2.59 times those before 2000. The multi-year average area of Lake Aqqikkol was 444.91 km2. After 2005, the area was larger than the multi-year average area. The minimum area was 331.43 km2, and the maximum was 588.5 km2. From 1986 to 2020, the area of Lake Ayakkum expanded from 556.82 km2 to 1,062.62 km2. The expansion rate of its lake area was the fastest among all mountain lakes, with a growth rate of 17.32 km2 a−1. The multi-year average area of Lake Arkatag was 218.94 km2. In 1987 and 1988, the area of Lake Arkatag was 228.47 km2 and 252.6 km2 respectively. It then plummeted to 166.05 km2 in 1989 and continued to decline to 112.46 km2 in 1990, after which it gradually increased in a fluctuating pattern. From 1989 to 2004, the lake area was smaller than its multi-year average. In 2005 and later, the area of Lake Arkatag showed a significant upward trend. In 2020, the largest lake area was 290.90 km2. Before 2005, the area of Lake Aksayquin was 198.10 km2, which was smaller than its multi-year average, and the smallest area (160.27 km2) appeared in 2002. Before 2005, the annual growth rate of Lake Aksayquin was 0.96 km2 a−1, but after 2005, the annual growth rate became 2.32 km2 a−1. The lake area has exceeded 200 km2 since 2006 and has been on the rise, reaching a maximum in 2020. From the perspective of spatial changes in the lake, the East and west parts of Lake Aqqikkol, the entrance to Lake Ayakkum, and the southeast part of Lake Arkatag increased significantly. The water body of Lake Aksayquin expanded significantly at the southeast entrance, and the lake size increased as a whole (as shown in Figure 4).

FIGURE 4. Area changes of typical mountain lakes in Xinjiang from 1986 to 2020 (A) Lake Sayram; (B) Lake Aqqikkol; (C) Lake Ayakkum; (D) Lake Arkatag; (E) Lake Aksayquin; (F) the mountain lakes.
The abrupt-change test results showed that (as shown in Figure 5), except for Lakes Jili and Taitema that had only one mutation year, there were two mutation years in plains lake area from 1986 to 2020, and the abrupt-change trends were mostly insignificant. Lake Ebinur showed abrupt shrinkage in 2008 and 2017; the former was a significant change (p < 0.05), but the latter was insignificant. The average lake area increased by 4.2% after the transition year 2017. There was an significant expansion mutation in 1991 in Lake Bosten (p < 0.01), in which the average area increased by 7.4%. In 2009, an insignificant shrinkage mutation occurred, and the average area decreased by 3.5%. The area of Lake Ebinur showed periodicity at 7, 12, and 21 years, and that of Lake Bosten showed periodicity at 9, 14, and 21 years (Figure 6). In these cases, the wavelet variance at 13 and 14 years was the largest respectively (Figure 6), indicating that the main periodicity of area change for Lakes Ebinur and Bosten was 13 and 14 years respectively. The 12-years cyclic oscillation of Lake Ebinur after 2007 was significantly greater than before 2007, whereas the 12-years cyclic oscillation of Lake Bosten was relatively stable. Lake Ulungur had a significant shrinkage mutation in 1995 (p < 0.05) and an insignificant expansion mutation in 2018, in which the average area increased by 3.4%. Lake Jili had an significant expansion mutation in 2016 (p < 0.01), in which the average area increased by 3.4%. The area of Lake Ulungur showed periodicity at 9, 17, and 21 years and that of Lake Jili at 11, 14 and 21 years (Figure 6), with a main period of 21 years. For the 21-years cycle, the negative-positive phase change of Lakes Ulungur and Jili occurred in 2001, indicating that Lakes Ulungur and Jili showed a shrinking trend before 2001 and an expanding trend after 2001. This was consistent with the analysis results of the mutation test. After 2000, the 11-years and 14-year periodic oscillations of Lake Ulungur were significantly smaller than before 2000, whereas the periodic oscillations of Lake Bosten were relatively stable. Lake Taitema showed an significant expansion mutation in 2009 (p < 0.01), in which the average area increased by 6.2%. The lake area showed periodicity at 8, 17, and 21 years, with a main period of 21 years.
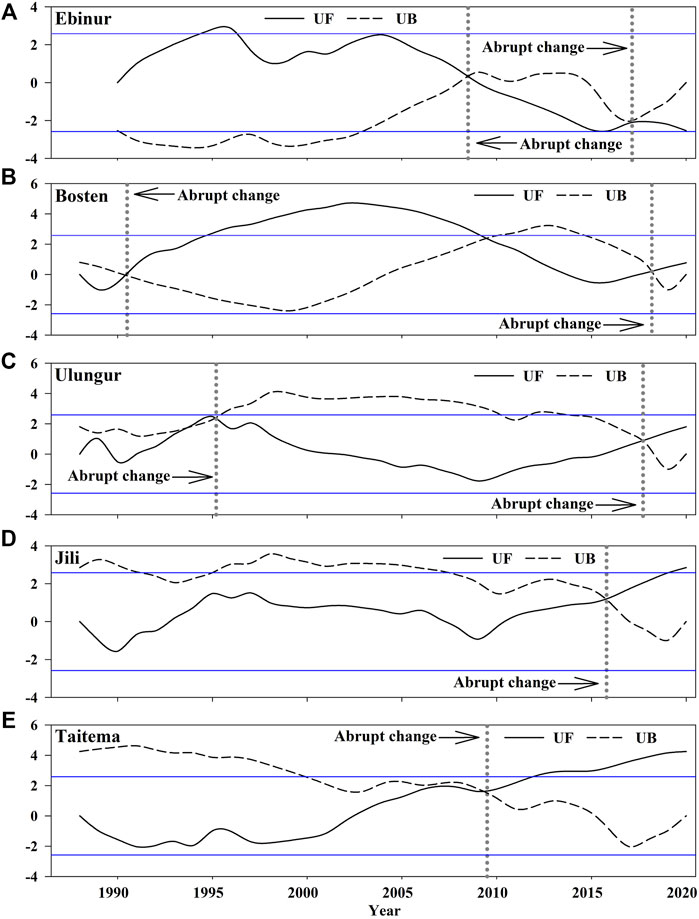
FIGURE 5. Results of the abrupt-change test of typical plains lakes area in Xinjiang from 1986 to 2020 (A) Lake Ebinure; (B) Lake Bosten; (C) Lake Ulungur; (D) Lake Jili; (E) Lake Taitema.
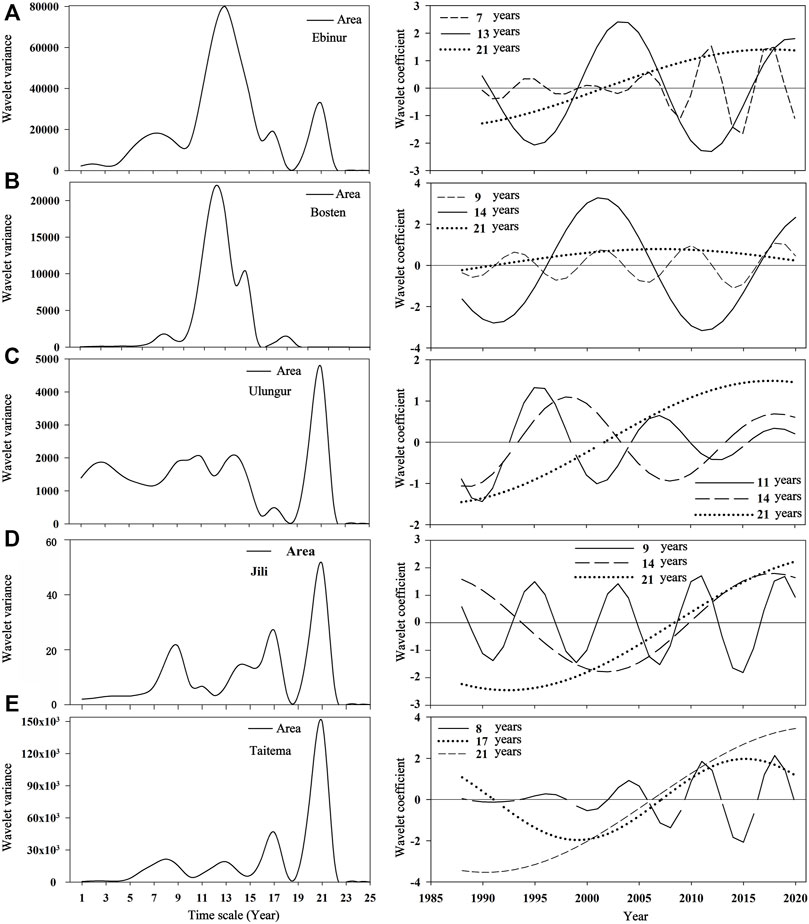
FIGURE 6. Results of wavelet analysis of typical plains lakes area in Xinjiang from 1986 to 2020 (A) Lake Ebinure; (B) Lake Bosten; (C) Lake Ulungur; (D) Lake Jili; (E) Lake Taitema.
Compared with plains lakes, the periodic change rule of mountain lakes was relatively simple. The abrupt-change test results showed that (as shown in Figure 7) significant mutations had occurred in mountain lakes (p < 0.01), and the mutation years were mainly concentrated around 2009. Lakes Sayram, Aqqikkol, Ayakkum, Arkatag, and Aksayquin had significant expansion mutations in 2009, 2008, 2008, 2011, and 2012 respectively. From 2009 to 2020, the areas of Lakes Ayakkum and Aqqikkol increased by 46.3% and 35.9% respectively, whereas the area of Lake Sayram increased by only 0.9% from 2010 to 2020. The main periodicity of lake area change in mountain lakes was 21 years (Figure 8). The area of Lake Sayram showed periodicity at 7, 17, and 21 years. Lakes Aqqikkol and Arkatag showed periodicity at 13, 17, and 21 years. Lakes Ayakkum and Aksayquin showed periodicity at 17 and 21 years. The 7-years cycle oscillation (Figure 8) of Lake Sayram showed an increasing trend before 2003 and a weakening trend after 2003. The decadal changes showed that the area of mountain lakes showed a downward trend before 2003–2006 and an upward trend afterwards. This was consistent with the analysis results of the mutation test.
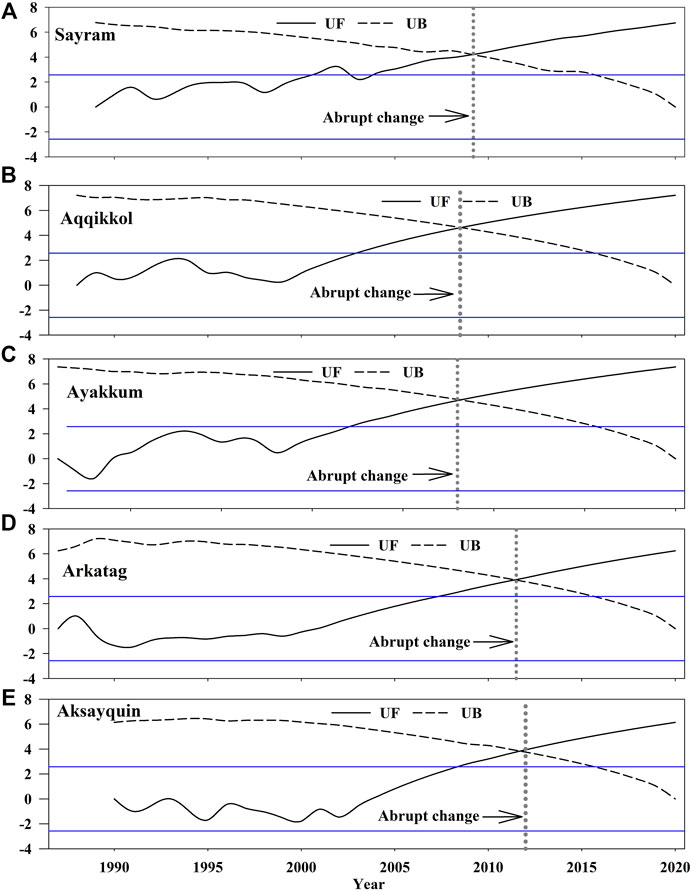
FIGURE 7. Results of the abrupt-change test of typical mountain lake areas in Xinjiang from 1986 to 2020 (A) Lake Sayram; (B) Lake Aqqikkol; (C) Lake Ayakkum; (D), Lake Arkatag; (E) Lake Aksayquin.
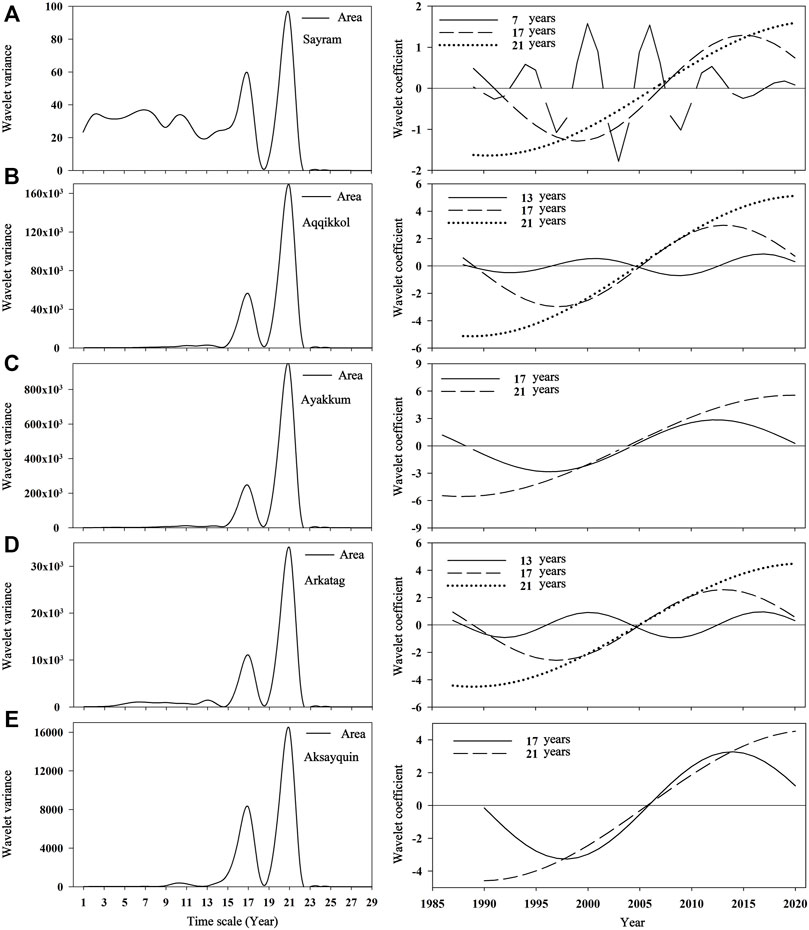
FIGURE 8. Results of the wavelet analysis of typical mountain lake areas in Xinjiang from 1986 to 2020 (A) Lake Sayram; (B) Lake Aqqikkol; (C) Lake Ayakkum; (D) Lake Arkatag; (E) Lake Aksayquin.
Due to the influence of winter snow cover, this study selected the change in lake area from May to October to analyze changing lake area at a monthly scale. The change in plains lake area had obvious seasonality (as shown in Figure 9). The multi-year average area of Lake Ebinur shrank from May to October, with a maximum of 493.24 km2 in May and a minimum of 423.41 km2 in October. On the contrary, Lake Bosten showed an overall expansion trend, with a smaller lake area from May to August and a larger lake area in September and October. The variation trend of the monthly-scale standard deviation of the areas of Lakes Ebinur and Bosten was also opposite: the standard deviation of the area of Lake Ebinur increased from May to October (a minimum of 21.86 km2 in May, a maximum of 61.77 km2 in July), whereas the standard deviation of the area of Lake Bosten showed a decreasing trend (a maximum of 99.10 km2 in May, a minimum of 54.24 km2 in October). This showed that from May to October, the area of Lake Ebinur shrank and fluctuated greatly, whereas the area of Lake Bosten expanded and stabilized. The areas of Lakes Ulungur and Jili reached a maximum in May (860.78 km2 and 167.67 km2 respectively), and the overall lake area decreased sequentially through spring, summer, and autumn. In addition, the standard deviation of the area of Lake Ulungur increased from May to October, showing a trend of first increasing, then decreasing, and then increasing again. The standard deviation fluctuated between 11.03 km2 and 86.86 km2. The standard deviation was the largest and the average area was the smallest (821.40 km2) in July. Abnormally small areas occurred mostly in July. The standard deviation of Lake Jili’s area was small from May to October, with a maximum in May (9.40 km2) and a minimum in October, only 3.61 km2. Therefore, the area of Lake Ulungur was larger, and the monthly-scale variation fluctuated greatly, whereas the area of Lake Jili was one-fifth that of Lake Ulungur, and the monthly-scale variation in lake area was stable. The overall area of Lake Taitema shrank from May to June, with a minimum (110.53 km2) in June, and then expanded month by month, reaching a maximum (181.47 km2) in October. The multi-year average monthly area of Lake Taitema was 47.08 km2 smaller than that of Lake Jili, but the area change in Lake Taitema was greatly affected by runoff and human disturbances. Therefore, the average standard deviation of Lake Taitema was 135.94 km2 larger than that of Lake Jili and was the largest among the plains lakes.
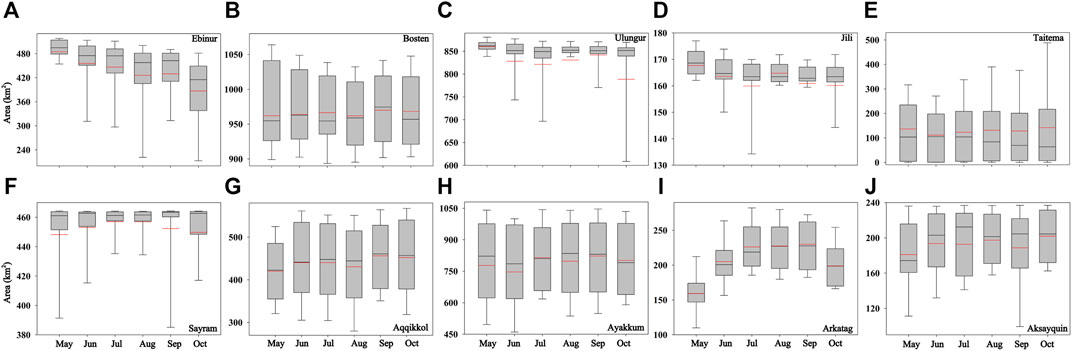
FIGURE 9. Areal changes of typical lakes in Xinjiang in different months from 1986 to 2020 (A) Lake Ebinure; (B) Lake Bosten; (C) Lake Ulungur; (D) Lake Jili; (E) Lake Taitema; (F) Lake Sayram; (G) Lake Aqqikkol; (H) Lake Ayakkum; (I) Lake Arkatag; (J) Lake Aksayquin.
Compared with plains lakes, mountain lakes had less obvious seasonality and smaller monthly-scale standard deviations. The multi-year average area of Lake Sayram showed a trend of decreasing, increasing, and then decreasing again: the multi-year annual average area reached a maximum in September (462.64 km2), and the standard deviation was the smallest, only 1.72 km2; the area in June was the smallest (453.02 km2), with the largest standard deviation (18.92 km2). Excluding factors such as ice and snow coverage and lake freezing, the change in Lake Sayram area was relatively stable. The multi-year average area and standard deviation of Lakes Aqqikkol and Ayakkum showed a trend of first decreasing, then increasing, and then decreasing again. In summer, ice and snow melt water made the lake expand, the area fluctuated greatly, and the lake area and standard deviation reached their maximum values (the area was 456.12 km2 and 825.33 km2 respectively; the standard deviation was 94.42 km2 and 180.80 km2 respectively). From May to October, the rates of change in the areas of Lakes Aqqikkol and Ayakkum were 7.60% and −1.20% respectively. It is clear that the area of Lake Aqqikkol fluctuated more obviously. The overall area of Lake Arkatag increased from spring to autumn, with the smallest area in May (159.26 km2), the largest area in September (229.94 km2), and an area rate of change of 24.92%. The standard deviation of the area of Lake Arkatag reached a minimum of 30.7994 km2 (May) and a maximum of 36.8794 km2 (September). Among Lakes Aqqikkol, Ayakkum, and Arkatag, Lake Arkatag had the smallest area and was most affected by meltwater, and hence the area fluctuated greatly. The multi-year average area of Lake Aksayquin increased month by month. The lake area was the smallest in May (181.04 km2) and the largest in September (229.94 km2). The rate of change in lake area was 11.54%, with the standard deviation showing a decreasing trend and the area fluctuating greatly.
Human activities were frequent in the plains lake basins. Domestic water and agricultural irrigation affected the changes in lake water volume and area (Chai et al., 2013; Wufu et al., 2020). Therefore, this study mainly analyzed the relationship between lake area change and human activities in the plains area. By identifying changes in population, farmland area, and GDP in the plains lake basins, the influence of human activities on changes in lake area was elucidated.
From the analysis results of the structural equation model (Figure 10), among the human activity factors, the farmland area and population of the Lake Ebinur basin had significant (p < 0.1) negative and positive effects on lake area respectively (path coefficients of −4.43 and 2.94 respectively). Compared with the impact of climatic factors, the main reason for the reduction in Lake Ebinur area was interception of surface runoff. Since the early 1950s, the area of Lake Ebinur had changed with the population and farmland area of the basin (Zhang et al., 2015b; Zhang et al., 2017; Zhang et al., 2021): from the early 1970s to the mid-1990s, population and farmland growth was slow, the lake area changed slightly, and the lake area was basically maintained at about 600 km2 except for dry years. At the beginning of the 21st Century, the population and farmland area increased significantly, resulting in a continuous degradation trend of the lake area, which reached its lowest value of 417.29 km2 in 2015. In recent years, the farmland area and population stabilized, and the lake area began to revert and remained at about 600 km2. The changes in farmland area, GDP, and population in the Lake Bosten basin had significant negative, positive, and positive effects on lake area (p < 0.01) respectively (path coefficients of −3.44, 2.42, and 0.37 respectively). Since 1993, the farmland area, GDP, and population of Bortala Mongol Autonomous Prefecture have shown an increasing trend. This was inconsistent with the overall trend of changes in lake area, which was mainly due to direct correlation between the inflow and outflow of Lake Bosten. For example, from 2000 to 2017, the water storage capacity of Lake Bosten and the changes in lake area showed obvious consistency changes. Since 2015, the slowdown in the growth rates of population and farmland in this region contributed to lake expansion. Population changes in the Lake Ulungur basin had a significant (p < 0.1) negative effect on lake area (path coefficient of -0.75). Population and farmland in this region had been increasing for a long time. The shrinkage in lake area after the 1990s was mainly due to increasing farmland area, extensive agricultural water use, and a population surge. After 2009, even though the area of farmland and the population continued to increase, the lake area gradually reverted under the influence of water-saving irrigation practices and ecological water diversion in recent years. Lake Jili is replenished by the Ulungur River, which belongs to the freshwater lake with water intake and output. Its change pattern was basically the same as that of the Lake Ulungur area. Human activities amplified the fluctuations in lake area caused by climate change. We want to emphasize that the findings that the unbalanced changes might be attributed to different reasons (i.e., climate change and human activities) are based on limited evidence and therefore preliminary. Indeed, human activities such as agricultural irrigation also played a role in affecting the lakes (Ma et al., 2010). In view of changes in farmland area, GDP, and population, strengthening research into the carrying capacity of water resources in plains lake basins, strictly controlling population, and strengthening comprehensive management of water resources are the fundamental components of ecological protection of plains lakes. The main amount of water in Lake Taitema came from the discharge of the Daxihaizi Reservoir and the replenishment of the Cherchen River. In the 1970s, Lake Taitema was once dried up by human activities. Since 2000, the ecological environment downstream of the Tarim River and Lake Taitema has been restored through ecological water conveyance. The area of Lake Taitema from 2000 to 2020 was affected by the inflow and outflow of the Tarim River. The cumulative water inflow of the Tarim River was 2.081 billion cubic meters, with an average annual water inflow of 94 million cubic meters. The lake area reached its maximum in 2017 and had been decreasing in recent years with a decrease in the amount of water discharged. For Lake Taitema, in the case of a high flow year, the current complete ecological reservoir (Daxihaizi Reservoir) control system and the ecological gates of each section had to be manually regulated and operated to avoid all the ecological water flowing into Lake Taitema at one time. It is necessary to formulate a further and more reasonable water resource regulation plan according to the relationship between the discharge volume and the lake area and to use the ecological gates of the sections below and at the Daxihaizi Reservoir to regulate the inflow to the lake during flood periods. The intent is to avoid large wastage of water under local high-intensity evaporation conditions.
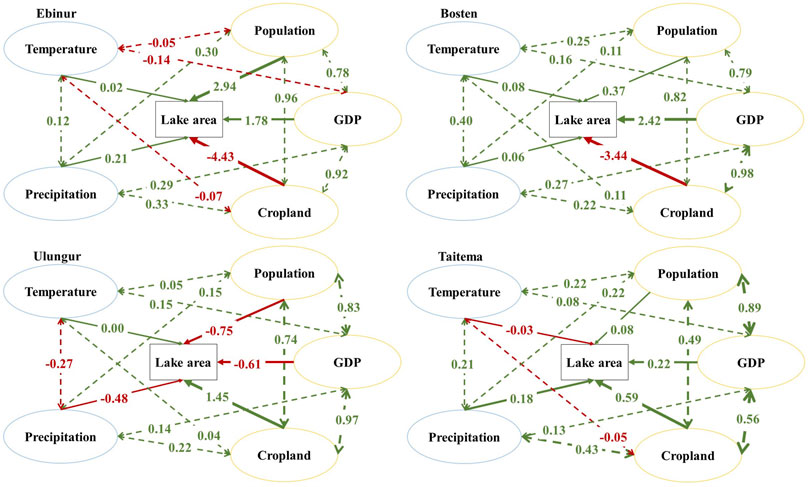
FIGURE 10. Results of structural equation model analysis of the influencing factors of typical plains lake area changes in Xinjiang.
The variation characteristics of temperature and precipitation of lake basins in Xinjiang were tested by Mann-Kendall trends. Because Lakes Ulungur and Jili operate as a unit, this subsection discusses them as the Ulungur River Basin as a whole.
Rising temperatures must be compensated for by precipitation to maintain lake area. The temperature and precipitation of plains lakes were generally increasing during the study period. If precipitation did not compensate for the loss of lake area, the temperature rise would lead to a decrease in lake area. From 1985 to 2020, the annual average temperature of the plains lake basins showed an significant upward trend (p < 0.01), with growth rates of 0.03, 0.05, 0.04, and 0.03, respectively, and mutation years of 1996, 1994, 1994, and 1997, respectively. The temperature of plains lakes showed periodicity at 9, 17, and 21 years, with the main period being 21 years. For the 21-years cycle, the negative-positive phase change in temperature occurred in 1999, 1998, 2001, and 2000, indicating that the temperature of the plains lakes was declining before 2000 and rising after 2000. This was consistent with the mutation years around 2000 and the significant upward mutation trends. The basins of Lakes Ebinur and Bosten had less precipitation and stronger evaporation, which was mainly supplied from river flow. Rising temperature caused evaporation and had an impact on lake area (Jing et al., 2020). The structural equation model results (Figure 10) showed that the effect of temperature change on the areas of Lakes Ebinur and Bosten constituted an insignificant (p > 0.1) positive effect (path coefficients of 0.02 and 0.08 respectively), the effect of temperature change on the area of Lake Ulungur was almost zero, and the effect of temperature change on the area of Lake Taitema was insignificant (p > 0.1) (path coefficient of -0.03). These results showed that the effect of temperature change on the area of plains lakes was largely insignificant (p > 0.1).
Annual precipitation at plains lakes showed an insignificant increase (p > 0.1), with rates of change of 0.25, 0.85, 0.11, and 0.48, respectively. The mutation years were 1998, 1992, 1992, and 2018, and the mutation trends were insignificant (p > 0.1). The effect of very low precipitation at Lake Taitema on lake area was negligible. Therefore, the correlation between climate and the area of Lake Taitema was not further analyzed in this section. The precipitation at plains lakes mostly showed periodicities at 17 and 21 years, with main periods of 7, 6, 11, and 21 years respectively. The precipitation at Lake Ebinur decreased before 2002 and increased after 2002. Before 1998 and before 2010, precipitation at Lakes Bosten and Ulungur showed an increasing trend, but a decreasing trend after 1998 and after 2010. Precipitation at Lake Taitema showed a decreasing trend before 2011 and an increasing trend after 2011. The periodicity of precipitation changes at Lakes Ebinur and Taitema was relatively consistent with the mutation years and the significant mutation upward trend, whereas Lakes Bosten and Ulungur gave the opposite result. The effects of precipitation on the areas of Lakes Ebinur and Taitema were both insignificant (p > 0.1) positive effects (path coefficients of 0.21 and 0.18 respectively), whereas Lake Bosten had an insignificant positive effect (path coefficient of 0.06), and Lake Ulungur had an significant negative effect (path coefficient of −0.48). The results of the structural equation model showed that the precipitation increase for Lakes Ebinur and Taitema promoted the expansion of the lakes, but that the precipitation changes for Lakes Bosten and Ulungur had less impact on lake expansion and even led to shrinkage of the lakes under the influence of human activities (Jing et al., 2018).
At an intra-year scale, changes in temperature and precipitation led to a strong seasonality in plains lake areas. The problem of water resource development and distribution should be solved, and agricultural water consumption in plains lake basins should be adjusted in spring and summer to ensure ecological water utilization (Zheng et al., 2021).
Due to their geographical location, mountain lakes have been less affected by human activities, and therefore this study analyzed climate change as the main factor for changes in mountain lake area (Wufu et al., 2020). The Central Kunlun mountain lakes are composed of Lakes Arkatag, Ayakkumu, and Aqqikkol, and hence this study discussed all three as the Middle Kunlun Mountain Lakes.
From 1985 to 2020, the annual average temperature of mountain lake basins showed an significant increase (p < 0.001), with growth rates of 0.04, 0.03 and 0.06, respectively, and the significant mutation increase years were 1994, 2000, and 1998, respectively. The temperature of mountain lakes showed periodicity at 17 and 21 years, with a main period of 21 years. For the 21-years cycle, negative-positive phase changes in temperature occurred in 2001, 2001, and 2005, indicating that plains lakes temperature declined before the early 21st Century and then rose. This was consistent with the mutation years around 2000 and the significant upward mutation trend. The effects of temperature changes on mountain lake area were all significantly positive (p < 0.05) (path coefficients of 0.38, 0.42, and 0.58 respectively), of which the Middle Kunlun Mountain Lakes and Lake Aksayquin showed significant positive effects (p < 0.001) (Figure 11). This showed that the increase in temperature was closely related to increases in lake area in mountain basins (Yang et al., 2020; Liu et al., 2022). The temperature of mountainous areas increased significantly around 2000. The increase in lake inflow due to melting of ice and snow contributed to an increase in lake area around 2010, which also indicated that lake area has a certain lag phase for temperature changes.

FIGURE 11. Results of structural equation model analysis of the influencing factors of typical mountain lake area changes in Xinjiang.
From 1985 to 2020, annual precipitation in the mountain lake basins showed an insignificant increase (p > 0.1) with growth rates of 0.98, 0.05, and 0.05, and the significant mutation increase years were 2001, 2001, and 1988 respectively. The precipitation at Lake Sayram showed periodicity at 6 and 21 years, the Middle Kunlun Mountain Lakes at 13 and 21 years, and Lake Aksayquin at 5, 17, and 21 years. The main periods were 6, 13, and 5 years, respectively. Precipitation in the Lake Sayram basin and the Middle Kunlun Mountain Lakes basin showed a decreasing trend before the beginning of the 21st Century and then an increasing trend; precipitation in the Lake Aksayquin Basin showed an increasing trend before 1992, decreased from 1992 to 2008, and has increased since then. The effect of precipitation changes on mountain lake area was insignificant (p > 0.1), and there was even a negative effect (precipitation at Lake Sayram had a negative effect on lake area, with a path coefficient of −0.16), which was mainly caused by rainfall weakening the positive effect of temperature.
In mountain and plateau areas, which have been less affected by human activities, lake area changes were more closely related to climate change. Although both temperature and precipitation showed an overall upward trend from 1986 to 2020, the increase in temperature was more significant (p < 0.001), and lake expansion and contraction trends were more closely related to changes in temperature. This illustrated the sensitivity of mountain lakes to climate change. However, the impact of climate change on mountain lakes was also becoming more and more significant. In recent years, rising water level has brought about serious collapse of the lakeshore, causing harm to roads around the lake. The increase in precipitation has increased erosion of grasslands and the Earth’s surface, reducing the erosion resistance of soil, and large amounts of nitrogen, phosphorus, and organic nutrients have been integrated into the lake with rainwater, exacerbating lake eutrophication. Therefore, strengthening local ecological restoration and grassland recovery and comprehensively controlling sources of lake pollution are important tasks for ecological environmental protection in mountain lake basins.
Taking the top ten lakes in Xinjiang as examples, this study analyzed the temporal and spatial dynamics of lakes in Xinjiang from 1986 to 2020 by using lake area, climatic factors, and ecological and environmental factors. The main conclusions of the study are as follows:
1) Except for Lakes Jili and Taitema, the plains lakes showed an insignificant (p > 0.1) expansion trend. Lake Jili showed a significant expansion trend (p < 0.05), and Lake Taitema showed an significant expansion trend (p < 0.01). Most of the plains lakes showed periodicity at 14 or 21 years. Except for the area changes in Lakes Jili and Taitema, which had only one mutation year, the plains lakes had two mutation years of area change between 1986 and 2020, but the mutation trends were mostly insignificant.
2) The mountain lakes showed significant expansion trends (p < 0.01) and significant expansion mutations occurring in 2009, 2008, 2008, 2011, and 2012, respectively. Most mountain lakes showed periodicity at 17 or 21 years. The decadal change pattern revealed that the area of mountain lakes showed a downward trend before 2003–2006 and then an upward trend. This was in line with the results of the abrupt-change test.
3) Human activities were the leading factor influencing lake area changes in plains lake basins. Changes in temperature and precipitation did not have a significant effect on area changes in plains lake basins (p > 0.1). Among anthropogenic factors, farmland area, GDP, and population change had significant (p < 0.1) effects on lake area, and the slowing growth rates of population and farmland area contributed to lake expansion. Therefore, the protection strategy for plains lakes must adjust the development and allocation of water resources according to the dominant influencing factors of different lakes.
4) Due to their geographical location, mountain lakes have been less affected by human activities. Climate change was the dominant factor in changes in mountain lakes. The effects of temperature change on mountain lakes were all significantly positive (p < 0.05). When the temperature increased significantly, melting of ice and snow led to increasing inflow into the lake and increasing lake area. Rainfall weakened the positive effect of temperature. Therefore, for mountain lakes, ecological and environmental protection measures are needed against damage caused by rising water level and erosion of shores and soils by precipitation.
The original contributions presented in the study are included in the article/Supplementary Material, further inquiries can be directed to the corresponding author.
The authors undertook different tasks for this paper. WW performed data processing and wrote the paper. WW, AJ, ZW, and ZK analyzed the data. HL and XD provided direction for the research work, designed the research and revised the paper. All authors have read and agreed to the published version of the manuscript.
This research was funded by the National Natural Science Foundation of China (52179028), the West Light Foundation of Chinese Academy of Sciences (2019-XBQNXZ-A-001), and the Xinjiang Water Conservancy Science and Technology Special Fund Project (XSKJ-2022-10).
The authors declare that the research was conducted in the absence of any commercial or financial relationships that could be construed as a potential conflict of interest.
All claims expressed in this article are solely those of the authors and do not necessarily represent those of their affiliated organizations, or those of the publisher, the editors and the reviewers. Any product that may be evaluated in this article, or claim that may be made by its manufacturer, is not guaranteed or endorsed by the publisher.
The Supplementary Material for this article can be found online at: https://www.frontiersin.org/articles/10.3389/fenvs.2022.1015543/full#supplementary-material
Supplementary Figure S1 | Spatial distribution of area changes in typical years at typical lakes in Xinjiang from 1986 to 2020.
Supplementary Figure S2 | Variation of temperature and precipitation at typical lakes in Xinjiang from 1985 to 2020 (A) Lake Ebinure; (B) Lake Bosten; (C) Lake Ulungur; (D) Lake Taitema; (E) Lake Sayram; (F) Lake Arkatag; (J) Lake Aksayquin.
Supplementary Figure S3 | Results of wavelet analysis of temperature in typical plains lake basins in Xinjiang from 1985 to 2020 (A) Lake Ebinure; (B) Lake Bosten; (C) Lake Ulungur; (D) Lake Taitema.
Supplementary Figure S4 | Results of wavelet analysis of precipitation in typical plains lake basins in Xinjiang from 1985 to 2020 (A) Lake Ebinure; (B) Lake Bosten; (C) Lake Ulungur; (D) Lake Taitema.
Supplementary Figure S5 | Results of wavelet analysis of temperature in typical mountain lake basins in Xinjiang from 1985 to 2020 (A) Lake Sayram; (B) Lake Arkatag; (C) Lake Aksayquin.
Supplementary Figure S6 | Results of wavelet analysis of precipitation in typical mountain lake basins in Xinjiang from 1985 to 2020 (A) Lake Sayram; (B) Lake Arkatag; (C) Lake Aksayquin.
Bai, J., Chen, X., Li, J., Yang, L., and Fang, H. (2011). Changes in the area of inland lakes in arid regions of central Asia during the past 30 years. Environ. Monit. Assess. 178 (1), 247–256. doi:10.1007/s10661-010-1686-y
Chai, H., Cheng, W., Zhou, C., Zhao, S., and Liu, H. (2013). Climate effects on an inland alpine lake in Xinjiang, China over the past 40 years. J. Arid. Land 5 (2), 188–198. doi:10.1007/s40333-013-0156-0
Chaudhari, S., Felfelani, F., Shin, S., and Pokhrel, Y. (2018). Climate and anthropogenic contributions to the desiccation of the second largest saline lake in the twentieth century. J. Hydrol. X. 560, 342–353. doi:10.1016/j.jhydrol.2018.03.034
Cooley, S. W., Smith, L. C., Stepan, L., and Mascaro, J. (2017). Tracking dynamic northern surface water changes with high-frequency planet CubeSat imagery. Remote Sens. (Basel). 9 (12), 1306. doi:10.3390/rs9121306
Deng, H., Chen, Y., and Chen, X. (2022). Driving factors and changes in components of terrestrial water storage in the endorheic Tibetan Plateau. J. Hydrol. X. 612, 128225. doi:10.1016/j.jhydrol.2022.128225
Deng, H., and Chen, Y. (2017). Influences of recent climate change and human activities on water storage variations in Central Asia. J. Hydrol. X. 544, 46–57. doi:10.1016/j.jhydrol.2016.11.006
Feng, L., Han, X., Hu, C., and Chen, X. (2016). Four decades of wetland changes of the largest freshwater lake in China: Possible linkage to the Three Gorges Dam? Remote Sens. Environ. 176, 43–55. doi:10.1016/j.rse.2016.01.011
Gao, W., and Li, B. L. (1993). Wavelet analysis of coherent structures at the atmosphere-forest interface. J. Appl. Meteorol. Clim. 32 (11), 1717–1725. doi:10.1175/1520-0450(1993)032<1717:WAOCSA>2.0.CO;2
Garrido, M., Hansen, S. K., Yaari, R., and Hawlena, H. (2022). A model selection approach to structural equation modelling: A critical evaluation and a road map for ecologists. Methods Ecol. Evol. 13 (1), 42–53. doi:10.1111/2041-210X.13742
Gautam, V. K., Gaurav, P. K., Murugan, P., and Annadurai, M. J. A. P. (2015). Assessment of surface water Dynamicsin Bangalore using WRI, NDWI, MNDWI, supervised classification and KT transformation. Aquat. Procedia 4, 739–746. doi:10.1016/j.aqpro.2015.02.095
Huang, W., Duan, W., and Chen, Y. (2021). Rapidly declining surface and terrestrial water resources in Central Asia driven by socio-economic and climatic changes. Sci. Total Environ. 784, 147193. doi:10.1016/j.scitotenv.2021.147193
Jing, Y., Zhang, F., He, Y., Johnson, V. C., and Arikena, M. (2020). Assessment of spatial and temporal variation of ecological environment quality in Ebinur lake wetland national nature reserve, Xinjiang, China. Ecol. Indic. 110, 105874. doi:10.1016/j.ecolind.2019.105874
Jing, Y., Zhang, F., and Wang, X. (2018). Monitoring dynamics and driving forces of lake changes in different seasons in Xinjiang using multi-source remote sensing. Eur. J. Remote Sens. 51 (1), 150–165. doi:10.1080/22797254.2017.1413955
Kaplan, G., and Avdan, U. (2017). Object-based water body extraction model using Sentinel-2 satellite imagery. Eur. J. Remote Sens. 50 (1), 137–143. doi:10.1080/22797254.2017.1297540
Li, Q., Lu, L., Wang, C., Li, Y., Sui, Y., and Guo, H. (2015). MODIS-derived spatiotemporal changes of major lake surface areas in arid Xinjiang, China, 2000–2014. Water 7 (10), 5731–5751. doi:10.3390/w7105731
Li, X., Jiang, F., Li, L., and Wang, G. (2011). Spatial and temporal variability of precipitation concentration index, concentration degree and concentration period in Xinjiang, China. Int. J. Climatol. 31 (11), 1679–1693. doi:10.1002/joc.2181
Lira, J. (2006). Segmentation and morphology of open water bodies from multispectral images. Int. J. Remote Sens. 27 (18), 4015–4038. doi:10.1080/01431160600702384
Liu, H., Chen, Y., Ye, Z., Li, Y., and Zhang, Q. (2019). Recent lake area changes in Central Asia. Sci. Rep. 9 (1), 1–11. doi:10.1038/s41598-019-52396-y
Liu, Y., Ye, Z., Jia, Q., Mamat, A., and Guan, H. (2022). Multi-source remote sensing data for Lake change detection in Xinjiang, China. Atmos. (Basel). 13 (5), 713. doi:10.3390/atmos13050713
Ma, R., Duan, H., Hu, C., Feng, X., Li, A., Ju, W., et al. (2010). A half-century of changes in China's lakes: Global warming or human influence? Geophys. Res. Lett. 37 (24). doi:10.1029/2010GL045514
Odeh, R. E. (1972). Algorithm AS 55: The generalized mann-whitney U-statistic. Appl. Stat. 21 (3), 348–351. doi:10.2307/2346292
Ouma, Y. O., and Tateishi, R. (2006). A water index for rapid mapping of shoreline changes of five east african rift valley lakes: An empirical analysis using Landsat TM and ETM+ data. Int. J. Remote Sens. 27 (15), 3153–3181. doi:10.1080/01431160500309934
Pekel, J. F., Cottam, A., Gorelick, N., and Belward, A. S. (2016). High-resolution mapping of global surface water and its long-term changes. Nature 540 (7633), 418–422. doi:10.1038/nature20584
Qin, J., Ding, Y. J., Zhao, Q. D., Wang, S. P., and Chang, Y. P. (2020). Assessments on surface water resources and their vulnerability and adaptability in China. Adv. Clim. Change Res. 11 (4), 381–391. doi:10.1016/j.accre.2020.11.002
Revelles, J., and Van Geel, B. (2016). Human impact and ecological changes in lakeshore environments. The contribution of non-pollen palynomorphs in Lake Banyoles (NE Iberia). Rev. Palaeobot. Palynol. 232, 81–97. doi:10.1016/j.revpalbo.2016.05.004
Riaza, A., and Müller, A. (2010). Hyperspectral remote sensing monitoring of pyrite mine wastes: A record of climate variability (pyrite belt, Spain). Environ. Earth Sci. 61 (3), 575–594. doi:10.1007/s12665-009-0368-y
Song, C., Huang, B., and Ke, L. (2013). Modeling and analysis of lake water storage changes on the Tibetan Plateau using multi-mission satellite data. Remote Sens. Environ. 135, 25–35. doi:10.1016/j.rse.2013.03.013
Song, C., Sheng, Y., Ke, L., Nie, Y., and Wang, J. (2016). Glacial lake evolution in the southeastern Tibetan Plateau and the cause of rapid expansion of proglacial lakes linked to glacial-hydrogeomorphic processes. J. Hydrol. X. 540, 504–514. doi:10.1016/j.jhydrol.2016.06.054
Tao, S., Fang, J., Zhao, X., Zhao, S., Shen, H., Hu, H., et al. (2015). Rapid loss of lakes on the Mongolian Plateau. Proc. Natl. Acad. Sci. U. S. A. 112 (7), 2281–2286. doi:10.1073/pnas.1411748112
Wang, J., Cai, X., Chen, F., Zhang, Z., Zhang, Y., Sun, K., et al. (2020). Hundred-year spatial trajectory of lake coverage changes in response to human activities over Wuhan. Environ. Res. Lett. 15 (9), 094022. doi:10.1088/1748-9326/ab9db0
Wang, T., Yan, C. Z., Song, X., and Xie, J. L. (2012). Monitoring recent trends in the area of aeolian desertified land using Landsat images in China’s Xinjiang region. ISPRS J. Photogramm. Remote Sens. 68, 184–190. doi:10.1016/j.isprsjprs.2012.01.001
Whitney, J. (1997). Notes on methodology-Testing for differences with the nonparametric mann-whitney U test. J. WOCN 1 (24), 12–18. doi:10.1016/S1071-5754(97)90044-9
Wu, S., Bates, B., Zbigniew Kundzewicz, A. W., and Palutikof, J. (2008). Climate change and water. Geneva: Technical Paper of the Intergovernmental Panel on Climate Change.
Wufu, A., Wang, H., Chen, Y., Rusuli, Y., Ma, L., Yang, S., et al. (2020). Lake water volume fluctuations in response to climate change in Xinjiang, China from 2002 to 2018. PeerJ 8, e9683. doi:10.7717/peerj.9683
Yang, J., Ma, L., Li, C., Liu, Y., Ding, J., and Yang, S. (2019). Temporal-spatial variations and influencing factors of lakes in inland arid areas from 2000 to 2017: A case study in Xinjiang. Geomat. Nat. Hazards Risk 10 (1), 519–543. doi:10.1080/19475705.2018.1531942
Yang, L., Feng, Q., Yin, Z., Deo, R. C., Wen, X., Si, J., et al. (2020). Regional hydrology heterogeneity and the response to climate and land surface changes in arid alpine basin, northwest China. Catena 187, 104345. doi:10.1016/j.catena.2019.104345
Yao, J., Chen, Y., Guan, X., Zhao, Y., Chen, J., and Mao, W. (2022). Recent climate and hydrological changes in a mountain–basin system in Xinjiang, China. Earth. Sci. Rev. 226, 103957. doi:10.1016/j.earscirev.2022.103957
Yu, H., Tu, Z., Yu, G., Xu, L., Wang, H., and Yang, Y. (2020). Shrinkage and protection of inland lakes on the regional scale: A case study of hubei province, China. Reg. Environ. Change 20 (1), 4–14. doi:10.1007/s10113-020-01594-w
Zhang, F., Kung, H. T., and Johnson, V. C. (2017). Assessment of land-cover/land-use change and landscape patterns in the two national nature reserves of Ebinur Lake Watershed, Xinjiang, China. Sustainability 9 (5), 724. doi:10.3390/su9050724
Zhang, F., Tiyip, T., Johnson, V. C., Kung, H., Ding, J., Zhou, M., et al. (2015b). Evaluation of land desertification from 1990 to 2010 and its causes in Ebinur Lake region, Xinjiang China. Environ. Earth Sci. 73 (9), 5731–5745. doi:10.1007/s12665-014-3830-4
Zhang, F., Tiyip, T., Johnson, V. C., Kung, H. T., Ding, J. L., Sun, Q., et al. (2015a). The influence of natural and human factors in the shrinking of the Ebinur Lake, Xinjiang, China, during the 1972–2013 period. Environ. Monit. Assess. 187 (1), 1–14. doi:10.1007/s10661-014-4128-4
Zhang, G., Xie, H., Kang, S., Yi, D., and Ackley, S. F. (2011). Monitoring lake level changes on the Tibetan Plateau using ICESat altimetry data (2003–2009). Remote Sens. Environ. 115 (7), 1733–1742. doi:10.1016/j.rse.2011.03.005
Zhang, G., Xie, H., Yao, T., and Kang, S. (2013). Water balance estimates of ten greatest lakes in China using ICESat and Landsat data. Chin. Sci. Bull. 58 (31), 3815–3829. doi:10.1007/s11434-013-5818-y
Zhang, J., Zhou, J., Zhang, G., Ji, Y., Zeng, Y., Fan, W., et al. (2021). Climate-and human-driven variations in lake area and number in North Xinjiang, China. Int. J. Remote Sens. 42 (2), 469–485. doi:10.1080/01431161.2020.1809740
Keywords: xinjiang lakes, plains lakes, mountain lakes, climate change, human activities
Citation: Wang W, Jiao A, Shan Q, Wang Z, Kong Z, Ling H and Deng X (2022) Expansion of typical lakes in Xinjiang under the combined effects of climate change and human activities. Front. Environ. Sci. 10:1015543. doi: 10.3389/fenvs.2022.1015543
Received: 09 August 2022; Accepted: 23 August 2022;
Published: 28 September 2022.
Edited by:
Haijun Deng, Fujian Normal University, ChinaReviewed by:
Baofu Li, Qufu Normal University, ChinaCopyright © 2022 Wang, Jiao, Shan, Wang, Kong, Ling and Deng. This is an open-access article distributed under the terms of the Creative Commons Attribution License (CC BY). The use, distribution or reproduction in other forums is permitted, provided the original author(s) and the copyright owner(s) are credited and that the original publication in this journal is cited, in accordance with accepted academic practice. No use, distribution or reproduction is permitted which does not comply with these terms.
*Correspondence: Hongbo Ling, bGluZ2hiQG1zLnhqYi5hYy5jbg==; Xiaoya Deng, bGlseTgwODc2QDE2My5jb20=
Disclaimer: All claims expressed in this article are solely those of the authors and do not necessarily represent those of their affiliated organizations, or those of the publisher, the editors and the reviewers. Any product that may be evaluated in this article or claim that may be made by its manufacturer is not guaranteed or endorsed by the publisher.
Research integrity at Frontiers
Learn more about the work of our research integrity team to safeguard the quality of each article we publish.