 Zhe Cui
 Zhi-guo Wang
 Xue-rong Zhang
 Yu-yu Wang
 Miao Zhang1
- 1Economics and Management School, Nantong University, Nantong, China
- 2School of Management, University of Science and Technology of China, Hefei, China
With rapid population growth and productivity development, the contradiction between economic and social development and resource and environmental protection is becoming increasingly prominent, so it is important to study the regional environmental carrying capacity to protect the environment and promote high-quality economic development. This study takes the three major urban agglomerations of Beijing-Tianjin-Hebei, Yangtze River Delta and Pearl River Delta as the research objects, and uses the entropy-weighted topsis model and the obstacle diagnosis model to evaluate the comprehensive environmental carrying capacity levels of the three major urban agglomerations and analyse their main obstacle factors. The results show that: 1) the average environmental carrying capacity level scores of the three major urban agglomerations during the study period were Beijing-Tianjin-Hebei (0.23103) > Yangtze River Delta (0.17687) > Pearl River Delta (0.16); 2) the degree of synergy between subsystems affects the environmental carrying capacity level; 3) China has still not achieved harmony between the environment and economic growth, and economic development is the main influencing factor for the level of environmental carrying capacity. In the future, it is recommended that each city cluster adhere to the construction of ecological civilization and vigorously develop high-tech and green industries; at the same time, give full play to the radiation-driven role of the regional core cities, make use of the synergistic effect of resource agglomeration and maximize the efficiency of resource utilization, so as to ultimately achieve the coordinated development of economic society and regional resources and environment.
1 Introduction
The environment is a basic prerequisite for human survival and development, providing the necessary resources and conditions for our survival and development. However, with the rapid growth of population and the continuous development of productivity, resource consumption and pollution emissions have been increasing, and the natural ecological balance has been drastically impacted and damaged. As an inevitable product of the country’s new industrialization and new urbanization towards a higher stage of development, urban agglomerations also suffer from a series of problems such as excessive resource consumption, ecological damage and environmental pollution, and the contradiction between economic and social development and resource and environmental protection is becoming increasingly prominent, and they are areas where environmental problems are highly concentrated and exacerbated. Therefore, studying the environmental carrying capacity of urban agglomerations is an inevitable requirement for solving the problems facing the sustainable development of urban agglomerations.
Park & Burgess first applied the concept of ecological carrying capacity in the field of ecology in 1921, and this term was applied to the field of environmental science to form the concept of “environmental carrying capacity”, and since then, a large number of scholars have studied the environmental carrying capacity. We will then present a literature review of the current research from three perspectives.
In terms of research regions, different scholars have tested the environmental carrying capacity of different regions, such as economic zones, urban agglomerations, prefecture-level cities, etc. For example, based on the theory of coupled human-environment systems, Zou and Ma (2021) combined the pressure-state-response relationship to construct a theoretical framework of resource and environmental carrying capacity applicable to watershed economic zones. Peng et al. (2018) assessed and analyzed the per capita ecological carrying capacity of the Yangtze River urban agglomeration, Wang et al. (2018) developed a comprehensive evaluation model of the water resources distribution and urban carrying capacity of the Wuhan urban agglomeration, and Li and Zhou (2019) used the DPSIR conceptual model to evaluate the ecological carrying capacity of the Beijing-Tianjin-Hebei region, and found that the carrying capacity of the Beijing-Tianjin-Hebei region is characterized by “strong in the middle and north and weak in the south” through horizontal comparison and vertical analysis. In addition to the study of economic zones and urban agglomerations, other scholars have focused on prefecture-level cities. For example, Diao et al. (2019) used the entropy method, the integrated urban carrying capacity measurement model and the urban sustainable development model to measure the spatio-temporal integrated carrying capacity of Harbin City, Heilongjiang Province. Liu and Borthwick (2011) evaluated the environmental carrying capacity of Ningbo city by integrating natural resource capacity, environmental assimilation capacity, ecosystem service capacity and social support capacity, and showed that Ningbo city environment can withstand the pressure brought by human development. Jung et al. (2018) estimated an energy index to assess the environmental carrying capacity of the region considering the future energy demand of Jeju Island and found that its environmental carrying capacity had better results than Korea as a whole.
In terms of environmental carrying capacity evaluation and analysis methods, PSR model (Ma et al., 2021), entropy weight TOPSIS model (Li, 2021), linear programming model (Wang and Zeng, 2013), system dynamics (Lin and Chen, 2017) are widely used. Song et al. (2016) constructed an indicator system based on the PSR model for the assessment of the geological carrying capacity of the coastal zone, using the coastal area of Laizhou Bay in Shandong Province, China, as an example. Wu et al. (2021) used the entropy-weighted TOPSIS model to study the development of a green economy in the Guangdong-Hong Kong-Macao Greater Bay Area from the perspective of the integrated ecological carrying capacity. Using “tourism economy of scale” as an objective function and the constraints of resources and ecological environment as constraints, Han (2019) established a linear planning model for the environmental carrying capacity of low-carbon tourism and carried out research on the environmental carrying capacity of low-carbon tourism in coastal areas from the perspective of eco-efficiency. Sun and Yang (2019) has developed a system dynamics (SD) model to evaluate the carrying capacity of regional water resources in order to comprehensively evaluate the water resources carrying capacity of the Xiong’an New Area. Compared with the causality-based PSR model, the computationally complex linear programming model and the information feedback mechanism to establish a relatively complex system dynamics model, TOPSIS has a simpler and clearer calculation process and lower data requirements, and there does not need to be an inevitable causal relationship between indicators. And our entropy weighting method as the calculation method of weights excludes the influence of subjective factors and increases the objectivity of the TOPSIS model, thus reducing the bias of the results. Therefore, we chose the TOPSIS model based on the entropy weight method. In addition, the TOPSIS model only provides a preliminary ranking of the environmental carrying capacity level of the city, so we combined it with the barrier analysis model so as to achieve the purpose of better analyzing the main factors affecting the environmental carrying capacity.
With the development of society, the entry point of environmental carrying capacity research is constantly updated. In recent years, as buildings have shown the most significant potential for cost-effective decarbonization, some academics have taken the carbon emissions of buildings into account when studying environmental carrying capacity. Yan et al. (2022) have improved the analytical approach to assessing decarbonization of building operations, which helps the government to investigate the decarbonization potential of buildings and promote peak carbon schemes. Dong et al. (2022) examined the environmental regulation-human capital-pollution relationship and analyzed the mediating role of human capital on the environmental regulation-SO2 emissions relationship. Focusing on China and the US, Zhang et al. (2022a) assessed the CO2 reduction and carbon reduction efficiency in commercial building operations at different emission scales, mapped out the pathways for energy efficiency improvements in commercial buildings in China and the US, and contributed to the exploration of the best decarbonization strategies for buildings. Xiang et al. (2022) assessed progress in decarbonizing commercial building operations in 16 countries over the past 20 years by decomposing structural decomposition, taking into account socio-economic, technological, climatic and end-use factors. Zhang et al. (2022b) reviewed current models for improving the level of energy efficiency in commercial building operations to find the best way to decarbonize operations in practice, informing a step-by-step data analysis of the decarbonization potential of commercial building operations across different emission sources.
From the literature review, we found the following knowledge gaps in current research: 1) Most of such studies are conducted for a certain region, and rarely can multiple regions be combined together for comprehensive evaluation. 2) The methodology is relatively homogeneous and a single model is still difficult to achieve an overall measurement of the regional environmental carrying capacity. 3) Some studies only consider carbon emissions or SO2 emissions, and there are other polluting emissions that can damage the environment that are not taken into account.
To address the gaps in current research, this study aims to address the following issues: 1) this paper comprehensively examines the differences in the environmental carrying capacity level scores, rankings and their development trends of the Beijing-Tianjin-Hebei, Yangtze River Delta and Pearl River Delta urban agglomerations; 2) the TOPSIS model based on the entropy weighting method is chosen to evaluate the environmental carrying capacity in conjunction with the barrier diagnosis model, and the barrier factors affecting the environmental carrying capacity are studied in depth; 3) a wide range of pollutant emissions are considered and various pollutant emissions are included in the index system, such as SO2, industrial wastewater, industrial soot and so on.
The contribution of this study is that, on the one hand, it helps the government to take corresponding measures to improve the regional environmental carrying capacity and break through the obstructive factors limiting the environmental carrying capacity; on the other hand, the study of the environmental carrying capacity of the three major urban agglomerations is also of great significance to their coordinated economic development and resource environmental protection.
The remainder of this study is structured as follows. Section 2 presents the methodology and relevant materials; the empirical results and the analysis of the barriers are showed in Section 3 and Section 4 provides some discussion of the results; and finally, Section 5 concludes and makes relevant recommendations.
2 Methods and data
2.1 Construction of the indicator system
In the process of human production and life, natural resources will inevitably be consumed and environmental pollution will be produced. When the economic and social development exceeds the boundary of environmental carrying capacity, the environment will produce a counterforce and limit the economic and social development, so the study of regional environmental carrying capacity becomes an inevitable requirement to improve the regional environmental carrying capacity and promote the coordinated development of economic resources and environment. The environmental carrying capacity describes the threshold value of the environmental system’s ability to support human activities, which is the external expression of the environmental system’s function. When measuring the environmental carrying capacity, it is necessary to consider the possible influence of human activities on it. This paper takes economic development, social change, pollution emission and environmental support as the first-level indicators, and makes a comprehensive consideration of the environmental carrying capacity level of the three major urban clusters from these four perspectives.
From the height of sustainable development strategy and promoting the coordinated development of economy and resources and environment, the high or low regional resource and environmental carrying capacity is closely related to the development of regional economy, therefore, the level of economic development is the main factor affecting the high or low resource and environmental carrying capacity. Social change is the sum of all phenomena and processes of social development, progress, stagnation, and regression, etc. Wang et al. (2020) argued that the social change system is supported by economic development to provide material goods and funds for infrastructure construction, and it can improve pollution emission control and resource use efficiency to some extent. Resources and environment are the basis of human survival and development, and in Li (2021); Liao et al. (2020); Wang and Hu (2017) and other studies on environmental carrying capacity studies, the environmental subsystem was selected in addition to the economic and social subsystems. According to the different attributes of the indicators, this paper divides the environmental level indicators into environmental support with positive impact and pollution emission with negative impact, taking into account the consumption of natural resources by human beings and the discharge of a large amount of waste into the environmental system, while also incorporating the degree of utilization of each waste by people and environmental management, and focusing on the economic and social development status to ensure the systematic, comprehensive and relevant indicators.
In terms of economic development, according to Wang and Liu (2020) and Zhang et al. (2019), this study selected the share of tertiary GDP, GDP of each city, disposable income per capita and total fixed assets as secondary indicators to measure the level of economic development. In addition, Lin et al. (2019) pointed out in their study that fiscal education expenditure promotes green economic growth through human capital-intensive activities and plays an important role in improving national quality and promoting various economic production activities. Therefore, this paper chose the secondary indicator education expenditure to reflect government expenditure on education affairs.
Under the first level indicator of social change, this study identifies the land area of the city’s administrative area, the population density of the city, the number of employed people and hospital beds in each city as the second level indicators, which can fully reflect the social development and the living standard of the residents as well as the current social pressure. The administrative area land area refers to the total land area and water area within the jurisdiction, and the development of the city is closely related to the land area and the number of population, generally speaking, the larger the area, the denser the population, the faster the economic development, and the greater the pressure on the city and the surrounding environment (Wang et al., 2018). Therefore, in this paper, the land area of the city’s administrative area and the population density of the city are included in the secondary index of social change. Since human resources are the first resource for social development and the number of employed people in a city can reflect the scale and quality of human resources in a city, this study includes the number of employed people in each city into the social level subsystem as a way to reflect the population index. In addition, Wang et al. (2020) included the number of hospital beds in the social subsystem when studying the environmental carrying capacity of 41 mineral cities in China, so this paper selects the number of hospital beds as a secondary indicator of the social change subsystem to reflect the quality of life of residents.
From the perspective of environmental support, Zhang et al. (2019),Zhang et al. (2018) and Wang et al. (2020) used the two indicators of green coverage in built-up areas and parkland area per capita as important measures of the richness of greenery resources, respectively. Centralized wastewater treatment, harmless treatment of domestic waste and comprehensive utilization of industrial waste can not only reduce the environmental impact of waste and its derivatives, but also achieve the recycling of resources, and they are important calculation indicators in the studies of Li (2021) and Zou and Ma (2021). Whether it is the act of planting trees, expanding green areas, or taking various effective measures for pollution control to achieve sustainable development strategy, all are human efforts to improve the environmental carrying capacity, so this study has selected the green coverage rate of built-up areas, per capita park green areas, centralized treatment rate of sewage treatment plants, harmless treatment rate of domestic waste and comprehensive utilization rate of general industrial solid waste as the second level indicators of environmental support.
From the perspective of pollution emission, the amount of pollutant emission indicates the degree of influence of the production life and demand acquisition behavior of the region on the surrounding environment and resources, and is the direct cause of ecological changes. The quality of water and air, as the most important elements that make up life on earth, can profoundly affect the size of the environmental carrying capacity. In the studies of Wang et al. (2020), Zou and Ma (2021) and Li and Zhou (2019), industrial SO2 emissions, industrial soot emissions and industrial wastewater emissions were used as indicators to measure pollution emission intensity. In the experiments of Wang et al. (2019) and Li and Zhou (2019), PM2.5 and PM10 concentrations were added to measure the environmental carrying capacity, respectively. In this paper, industrial SO2 emissions, industrial wastewater emissions, industrial smoke (dust) emissions and the annual average concentration of fine particulate matter are included in the secondary indicators of pollution emissions, aiming to study the impact of pollution emissions on environmental carrying capacity.
In general, the selection of indicators in this study is based on relevant research results and follows the principles of scientificity, comprehensiveness, representativeness and accessibility, and finally determines four perspectives and a total of 18 secondary indicators to build the environmental carrying capacity evaluation system, and Table 1 explains each indicator.
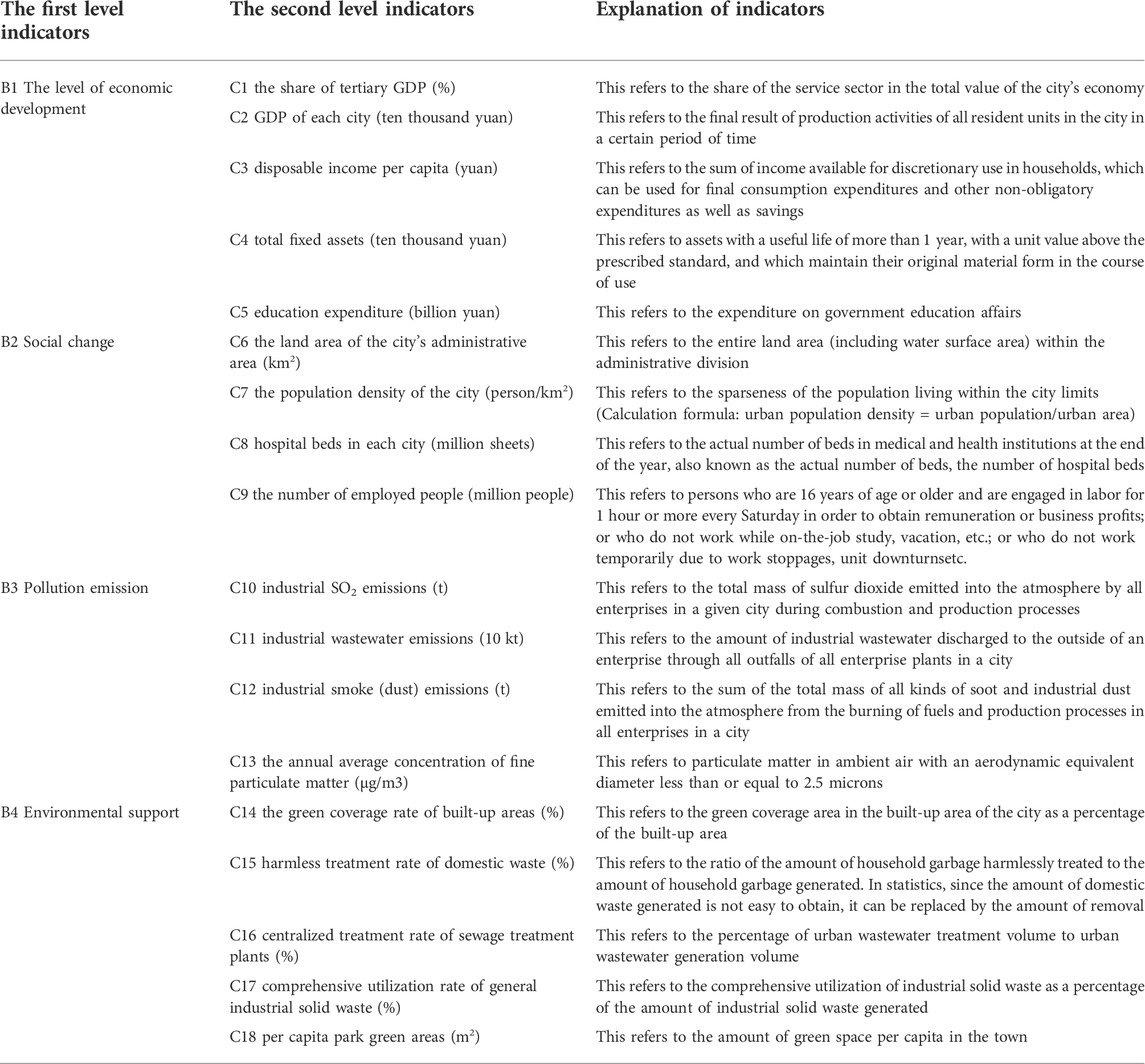
TABLE 1. The construction of indicator system and explanation of each indicator.
2.2 Study area and data sources
The BTH, the YRD and the PRD are the three regions with the largest population concentration, the highest innovation capacity and the strongest comprehensive strength in China. According to the National Statistical Yearbook, the combined GDP of the three major urban agglomerations will account for approximately 43% of the country’s total GDP in 2021. And as a coastal economic development region, the BTH, the YRD and the PRD have been highly valued by the state. The 14th Five-Year Plan for National Economic and Social Development of the People’s Republic of China and the Outline of Vision 2035, released in March 2021, clearly states that the development of urban agglomerations should be promoted as the key, the two horizontal and three vertical urbanization strategy pattern should be formed comprehensively, and the BTH, the YRD, the PRD and Chengdu-Chongqing urban agglomerations should be optimized and upgraded. In addition, due to the rapid development of urbanization, the three major urban agglomerations have inevitably encountered problems such as excessive consumption of resources and excessive emission of pollution, and the ecological balance has been greatly challenged; therefore, the BTH, the YRD and the PRD urban agglomerations are taken as the research objects in this paper. Figure 1 shows the geographical locations of the three major urban clusters.
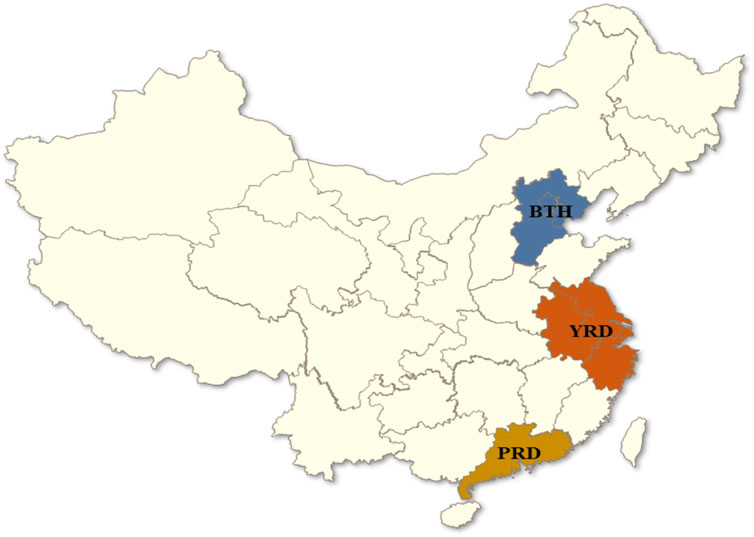
FIGURE 1. Location diagram of three major urban agglomerations.
In 2013, the Ministry of Environmental Protection and the State Council released the National Environmental Protection Standards “12th Five-Year” Development Plan, the Air Pollution Prevention and Control Action Plan and other policies, which may have a greater impact on the environmental carrying capacity; in 2016, the YRD was approved by the State Council to become a national urban agglomeration; in 2019, the Guangdong-Hong Kong-Macao Greater Bay Area was approved to become a national urban agglomeration. In addition, considering the availability and completeness of the data, we used 2013, 2016, and 2019 as time points for the study. The basic data of this study are mainly obtained from major national and provincial yearbooks, such as China City Statistical Yearbook and China Environment Yearbook, etc. Some of the environmental data are obtained through the calculation of mean and summation formulas, and the data sources have authenticity and reliability.
2.3 Introduction to research methodology
Multi-attribute decision making refers to preference selection over a certain number of alternatives, and its main applications are in two aspects: assessment and selection. In this paper, a comprehensive evaluation of the environmental carrying capacity of three major urban agglomerations is essentially an application of multi-attribute decision making. The TOPSIS Method (Technique for Order Preference by Similarity to an Ideal Solution Method) is one of the most widely used methods for multi-attribute decision making. It is flexible and easy to use because there is no strict limitation on data distribution, sample size and number of indicators (Lai et al., 1994). Of course, before using TOPSIS Method for evaluation, we must first solve the important problem of determining the indicator weights in multi-attribute decision making. The methods of determining the indicator weights are mainly divided into two kinds of subjective assignment method and objective assignment method, and this study adopts the EWM in the objective assignment method to determine the weights of each indicator, which excludes the influence of subjective factors on the indicator weights and can reflect the influence of the indicators on the evaluation of environmental carrying capacity level more realistically. Finally, we conducted barrier analysis on each evaluation index to find the main barrier factors affecting the environmental carrying capacity level of the three major urban clusters.
2.3.1 The entropy weight method
The Entropy Weight Method is a method that uses entropy values to calculate the degree of influence of evaluation indicators on the merits of a program. The EWM has the following main steps:
Step 1 Normalized decision matrix
Construct a decision matrix with n evaluation objects and m evaluation indicators
where
Step 2 Calculate the contribution of the assessment object in the assessment index, as shown in Eq. 3:
Where,
Step 3 Calculate the entropy value of the n evaluation object and the jth indicator among the m evaluation indicators, as in Eq. 4:
Where, K =
Step 4 Calculate the information utility value of the jth indicator, as in Eq. 5:
Step 5 Determine the weights of environmental carrying capacity level evaluation indicators, as in Eq. 6:
2.3.2 The TOPSIS method
The TOPSIS Method was first proposed by Hwang and Yoon (1981), and its core is to select the optimal solution by judging the deviation of each candidate solution from the ideal solution.
The main steps of the TOPSIS Method are as follows (Zheng et al., 2020):
Step 1 The attribute values of the standardized environmental carrying capacity decision matrix, as in Eq. 7:
where
Step 2 Construct the environmental carrying capacity weighted decision matrix as in Eq. 8:
where
Step 3 Determine the positive ideal solution
where
Step 4 The Euclidean parametric measure of the distance
where
Step 5 Calculate the relative proximity of the feasible solution to the ideal solution
We define the environmental carrying capacity level as:
Where, the larger the value of
Step 6 Priority ranking
The ranking and calculation of the environmental carrying capacity level classes of the three major urban agglomerations are based on the calculated environmental carrying capacity level
where
2.3.3 Obstacle diagnosis model
This paper uses the Obstacle diagnosis model (Chen et al., 2020) as a tool to analyze the barrier factors of the indicator system in order to facilitate the development of targeted strategies and measures.
Where,
3 Result and analysis
3.1 Environmental carrying capacity assessment of three major urban agglomerations
3.1.1 Analysis of the overall environmental carrying capacity of urban agglomerations
Using the index system and evaluation model constructed above, we calculated and analyzed the environmental carrying capacity level scores of each city in the three major urban agglomerations in 2013, 2016 and 2019.
Figure 2 shows the 3-year average environmental carrying capacity level score Ci values of the three major urban agglomerations in 2013, 2016 and 2019, indicating that the average environmental carrying capacity level scores of the three major urban agglomerations ranked the BTH > the YRD > the PRD during the study period. Although the YRD has the highest economic strength, it is obvious that the overall environmental carrying capacity level of the BTH is much higher than the other two urban agglomerations, which also indicates to a certain extent that the economic strength affects the environmental carrying capacity level, but does not completely determine the environmental carrying capacity level. The overall environmental carrying capacity level of the BTH is higher probably because the BTH, as the urban agglomeration where the capital of China, Beijing, is located, has higher requirements and controls on the environment. The higher urbanization rate and more serious environmental pollution in the PRD cities may reduce the environmental carrying capacity level of the PRD urban agglomeration. In addition, the overall environmental carrying capacity level of the BTH urban agglomeration has not changed much during the study period, but unlike the other two urban agglomerations where the Ci value has been steadily increasing, the Ci value of the BTH urban agglomeration has been gradually decreasing. (As shown in Figure 3). This may be due to the fact that the development of Beijing, which plays a major driving role in the BTH, is politicized and its economic development is slightly inferior to that of the YRD and the PRD, while the negative effects such as urban diseases caused by the development of the city have intensified, thus leading to a decrease in the level of environmental carrying capacity. In addition, the huge development differences among cities within the Beijing-Tianjin-Hebei urban agglomeration may also be a reason for its declining environmental carrying capacity level. 2016 saw a significant rise in the environmental carrying capacity of the YRD, which may be related to its approval by the State Council to become a national urban agglomeration. 2019 In order to give full play to the comprehensive advantages of Guangdong, Hong Kong and Macao, deepen cooperation between the mainland and Hong Kong and Macao, and promote regional development, the Central Committee of the Communist Party of China The State Council issued the “Outline of the Development of Guangdong-Hong Kong-Macao Greater Bay Area”, which includes Hong Kong, Macau and nine cities in Guangdong Province, such as Guangzhou and Shenzhen, which may be one of the reasons why the environmental carrying capacity of the PRD has a large increase in 2019.
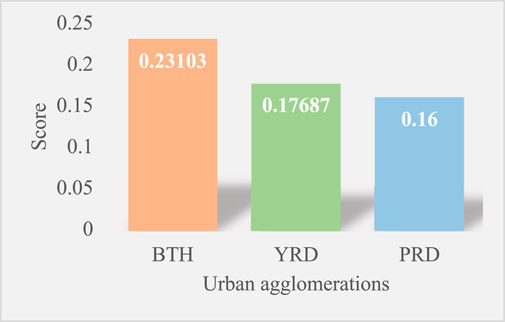
FIGURE 2. Three-year average environmental carrying capacity level scores for the three major urban agglomerations in 2013, 2016 and 2019.
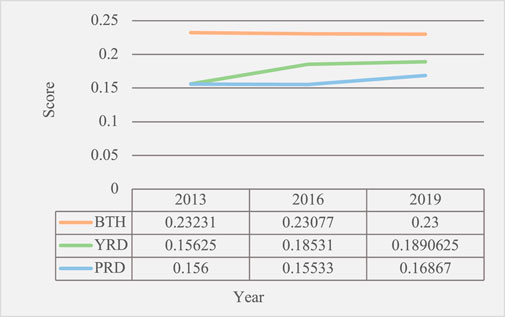
FIGURE 3. Average environmental carrying capacity level scores of the three major urban agglomerations for each year 2013, 2016 and 2019.
From the perspective of the environmental carrying capacity level of cities in the urban agglomerations, the number of Class I cities in the three urban agglomerations is roughly the same; the percentage of Class II cities in the BTH and the YRD is slightly higher than that in the PRD, although Hangzhou in the YRD jumped from Class II level to Class I in 2016; among Class III cities, due to the rise in the grade of some cities in the YRD, the percentage of the three major urban agglomerations in 2019 The ranking has changed. The three major urban agglomerations of the BTH, the YRD and the PRD all have two Class I cities, most of which are regional core cities, economic, service and science and technology innovation centers in the region, with strong logistics, human, capital and information flows, while their own emphasis on ecological and environmental quality improvement and environmental infrastructure construction drives their resource deployment capacity and environmental governance capacity, and thus have It has a high level of environmental carrying capacity. In addition, with the improvement of Hangzhou’s comprehensive strength, its environmental carrying capacity has also been strengthened, and Hangzhou has jumped from Level II level to Level I in 2016. In the list of Class II cities, although the number of cities in the BTH and the PRD is the same, both with two cities, and the YRD has six cities, the number of Class II level cities in the BTH and the YRD does not differ much in proportion to the total number of cities in this urban agglomeration, and the PRD is slightly lower, and the high number of Class II level cities in the YRD is mainly due to the higher total number of cities in the YRD. In 2013 and 2016, the ranking of the proportion of Class III level cities in the three major urban agglomerations was the YRD (75%) > the PRD (73.3%) > the BTH (69.2%), while the ranking of the proportion changed to the PRD (73.3%) >the YRD (71.9%) > the BTH (69.2%) due to the jump of Jiaxing level from Class III to Class II in the YRD in 2019, which to some extent indicates that the YRD may be more effective in promoting high-quality economic development. (As shown in Table 2).
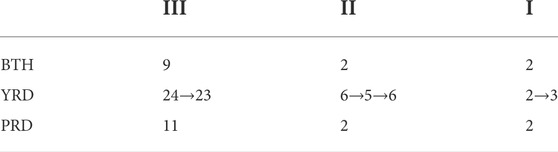
TABLE 2. Levels of overall environmental carrying capacity of the three major urban agglomerations.
3.1.2 Analysis of environmental carrying capacity within urban agglomerations
In order to better understand the level of environmental carrying capacity within urban agglomerations and their barrier factors, we have classified all cities according to urban agglomerations, and evaluated and analyzed them.
Figure 4 shows the environmental carrying capacity level scores of each city in the BTH in 2013, 2016 and 2019. Apparently, in the BTH, Beijing and Tianjin ranked first and second in overall environmental carrying capacity, and the environmental carrying capacity levels of both are less constrained by economic factors, while the cities in Hebei province ranked lower, which may be due to the fact that the economic development level of Beijing and Tianjin is much higher than that of Hebei province, and the strong economic strength can provide better economic support for the protection and management of the environment. Within Hebei Province, Tangshan ranks firmly in first place in terms of environmental carrying capacity, and although its environmental carrying capacity level score declined in 2016, it recovered to the 2013 level in 2019. This may be due to the fact that Tangshan has adjusted its economic structure in recent years while increasing comprehensive environmental improvement and law enforcement supervision, gradually accelerating the pace of transformation from a resource-based city to an innovative city and promoting the construction of a green city. Hengshui’s environmental carrying capacity level has been ranked at the bottom of Hebei Province (As shown in Table 3), and its environmental carrying capacity score shows a decreasing trend. This may be due to the fact that the stock of natural resources in Hengshui is not enough to support the resource consumption of local residents, and the accelerated urbanization and industrialization has brought great pressure on the ecological balance.

FIGURE 4. Environmental carrying capacity level scores of cities in the BTH in 2013, 2016 and 2019.
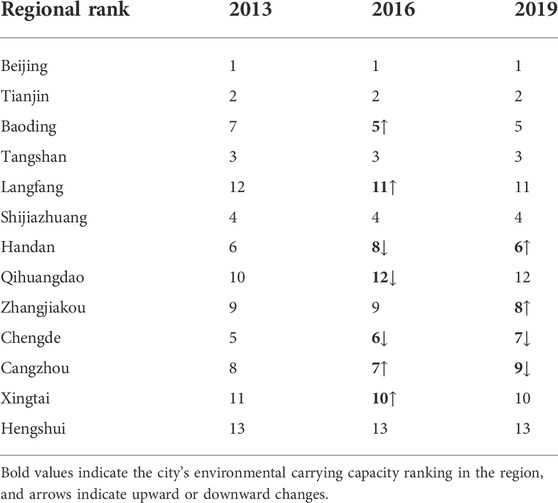
TABLE 3. Intra-regional ranking of environmental carrying capacity of BTH in 2013, 2016 and 2019.
Within the YRD, Shanghai, Suzhou, Hangzhou, and Nanjing are firmly in the top four in terms of overall environmental carrying capacity ranking, which is also more in line with their comprehensive strength. Although Anhui Province accounts for most of the cities with gradually rising ranking, the Ci value of Anhui Province is still generally low, and the ranking of each city is at the back of the whole urban agglomeration, and the environmental carrying capacity of Hefei, which is the highest ranking city in Anhui, is not very outstanding, which also reflects that there are someproblems in urban development in Anhui at present. In addition, Jiangsu province has a high percentage of cities with decreasing rankings, which reflects the relatively slow development of the environment in Jiangsu in recent years. Most of the cities have a stable ranking, however, Fuyang and Huzhou have a large change in their environmental carrying capacity ranking. (As shown in Figure 5). In addition, it is worth mentioning that Hangzhou’s environmental carrying capacity ranking has not changed, but the grade was upgraded from II to I in 2016, which also proves to some extent that the overall environmental carrying capacity of the YRD is gradually strengthening.
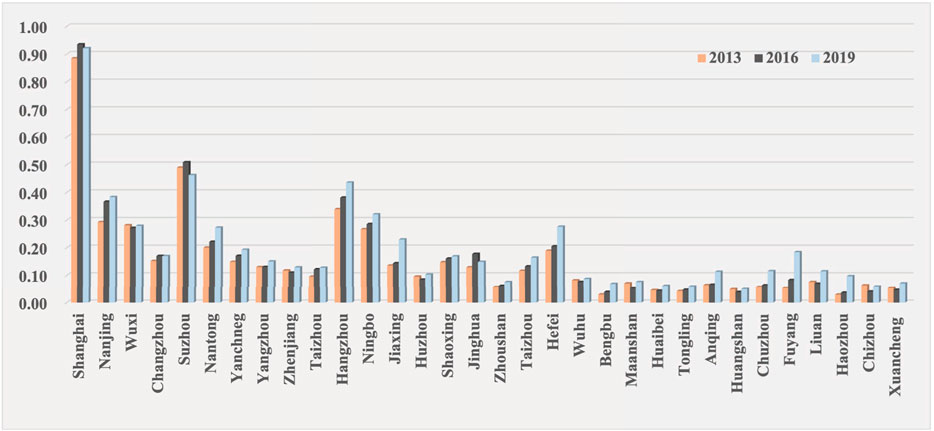
FIGURE 5. Environmental carrying capacity level scores of cities in the YRD in 2013, 2016 and 2019.
Figure 6 shows the environmental carrying capacity level scores of each city in the PRD urban agglomeration in 2013, 2016 and 2019. Within the PRD urban agglomeration, Shenzhen and Guangzhou are the two cities with the highest environmental carrying capacity. During the study period, the intra-regional ranking of Zhuhai and Yunfu in terms of environmental carrying capacity increased, and the intra-regional ranking of Huizhou, Foshan, Zhaoqing, Qingyuan, Shanwei, and Zhongshan decreased. Among the cities with decreasing rankings, only Zhongshan City’s environmental carrying capacity level score has continuously decreased, from 0.11 to 0.09. The decrease of Zhongshan City’s environmental carrying capacity may be related to the number of population, which covers an area of 1,783.67 square kilometers, the second lowest in Guangdong Province, but has a population of 4,418,100, ranking 10th in Guangdong Province, with a 10-year growth rate of 41.56%, Zhongshan ranks 4th in the province, after Shenzhen, Zhuhai, and Guangzhou. The huge population density has led to a surge in environmental pressure in and around Zhongshan, and the economic structure of Zhongshan’s economic development is not sufficient to provide sufficient financial support and rapid transformation for the surge in environmental pressure, resulting in a continuous decline in Zhongshan’s ranking.
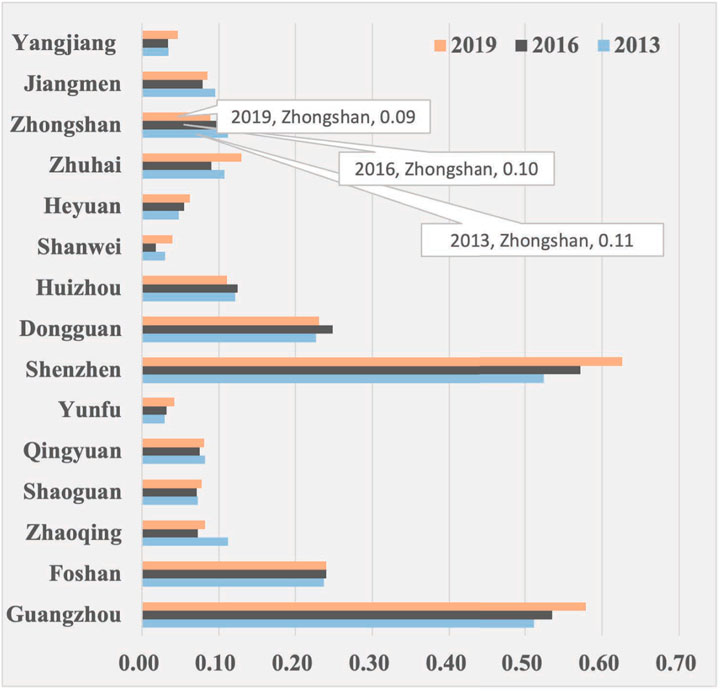
FIGURE 6. Scores of environmental carrying capacity of cities in the PRD in 2013, 2016 and 2019.
3.2 Barrier analysis
In order to dig deeper into the barrier factors affecting the level of urban environmental carrying capacity, we conducted diagnostic analysis of each index using a barrier diagnostic model.
From Figures 7–9, we can see that B1 is the main factor that hinders the development of environmental carrying capacity of the three major urban agglomerations, followed by B2, and B3 and B4 are less hindering to the environmental carrying capacity of the three major urban agglomerations. It is worth noting that most cities with higher comprehensive strength such as Shanghai, Beijing, Tianjin and Suzhou coordinate the layout of the three major functions of production, living and ecology, and promote the coordinated development of urban economy, society and environment; therefore, they have roughly the same degree of hindrance at the four levels of B1, B2, B3 and B4. With the change of time, the overall view is that the obstruction degree of economic development is increasing. Although the country strongly advocates the development of a high-quality economy, however, it takes some time for economic development to move toward high quality, and the current economic development process still requires sacrificing a certain amount of environment, which reflects the reality of the current development process. In contrast, as the national emphasis on green development has been increasing in recent years, pollution emissions have been significantly reduced and the hindrance of pollution emissions has been decreasing. In addition, the development of technology has improved the efficiency of pollutant treatment, which is also one of the reasons for the decreasing obstruction of pollution emission.
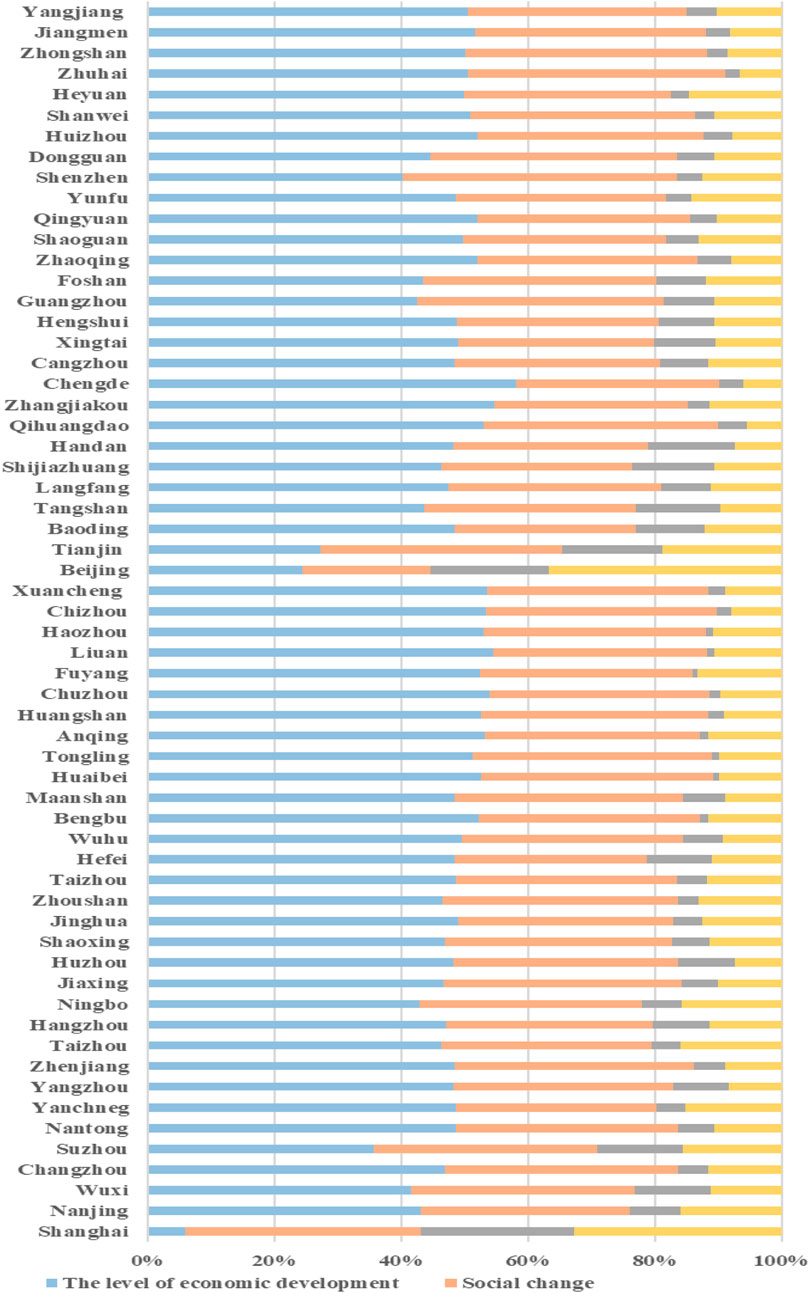
FIGURE 7. Barrier analysis map of the three major urban agglomerations in 2013.
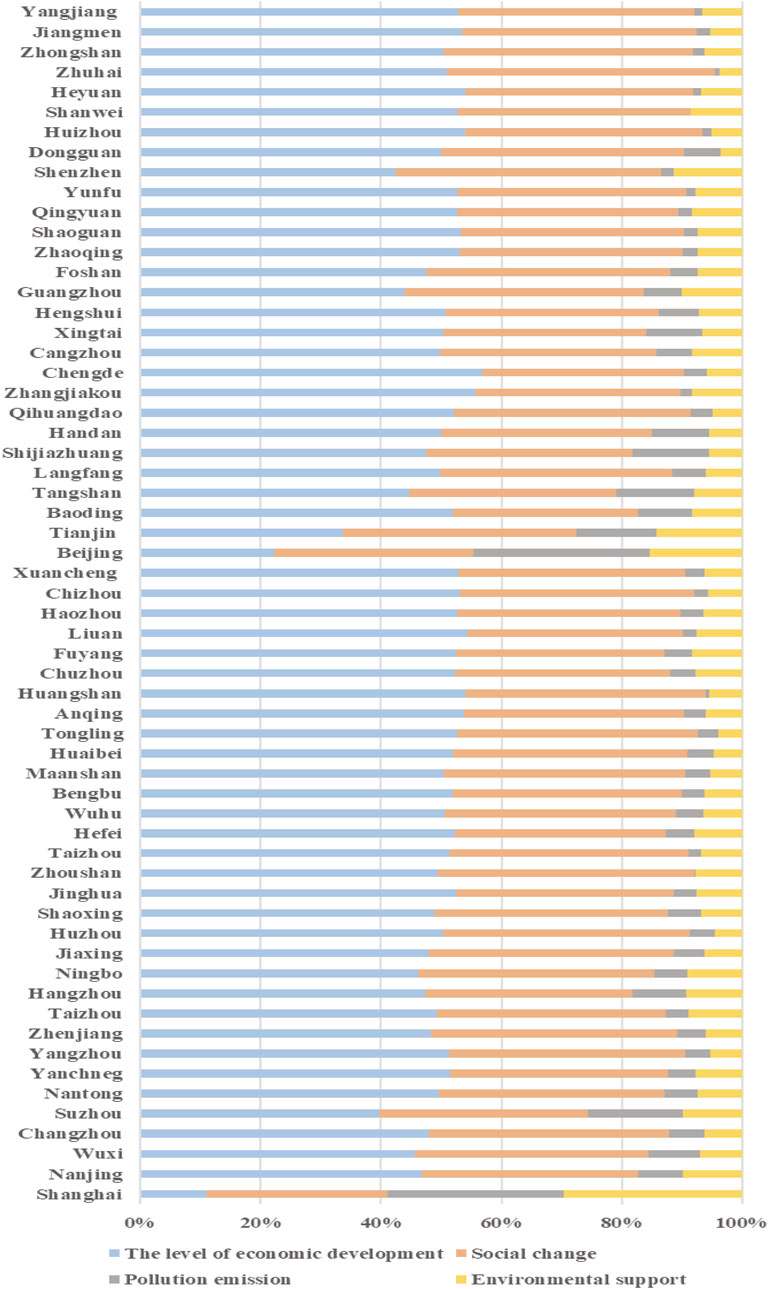
FIGURE 8. Barrier analysis chart for the three major urban clusters in 2016.
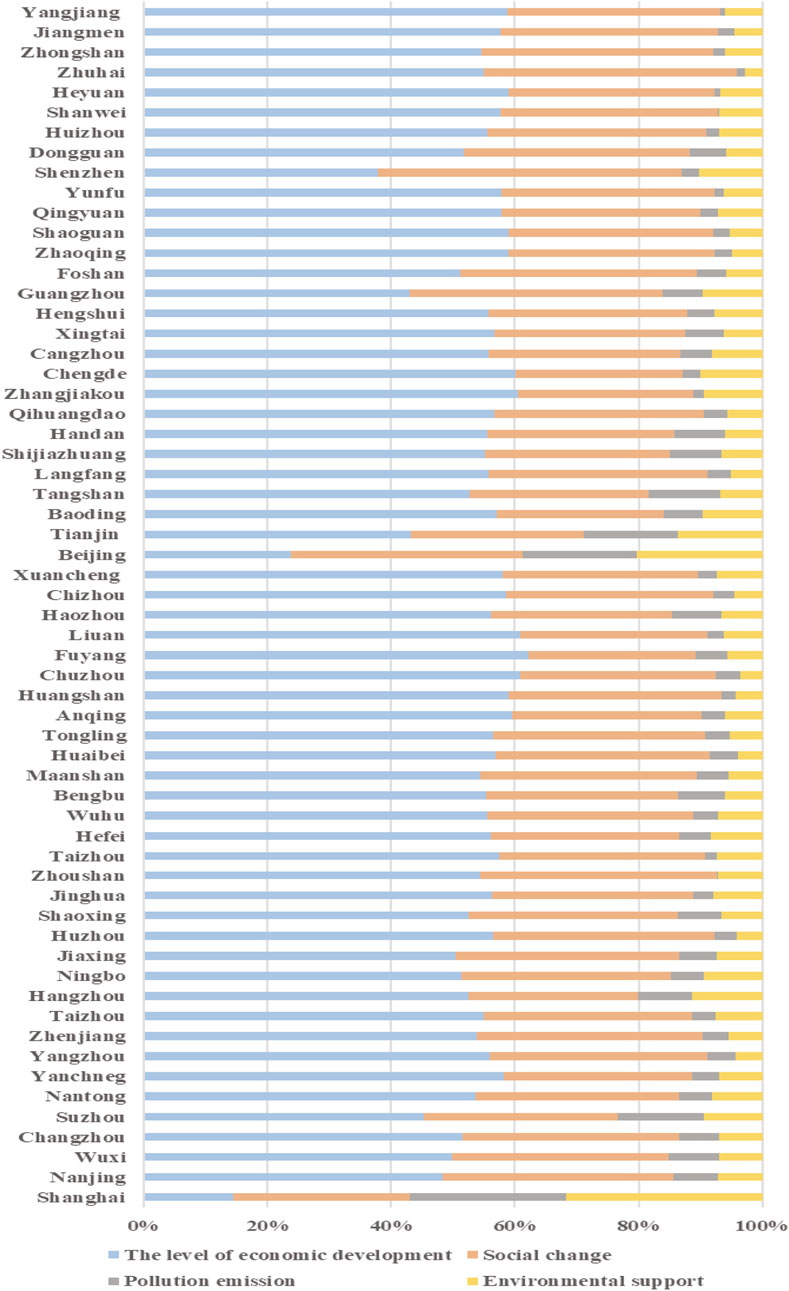
FIGURE 9. Barrier analysis chart of three major urban clusters in 2019.
Supplementary Appendix Table A3 indicating the top 5 obstacle factors for each city in 2013, 2016, and 2019, the study found that among the major urban clusters, C2 (with a total of 171 occurrences), C5 (with a total of 174 occurrences), C8 (with a total of 171 occurrences), and C9 (with a total of 173 occurrences) are the key factors limiting the improvement of the environmental carrying capacity level. Among them, C9 is the main obstacle to the development of environmental carrying capacity levels in most cities, and it shows relative stability in terms of the intensity of its hindrance to the development of environmental carrying capacity levels. It is worth mentioning that in 2013 and 2016, the most important obstacle factor in the three major urban agglomerations was C9, however, in 2019, the top-ranked obstacle factor in most cities changed to C2. Starting from 2015, two rounds of 3-year action plans for technological transformation of industrial enterprises were implemented in the PRD region to promote the transformation of industrial enterprises in Guangdong Province to digital, networked and intelligent technologies and accelerate the optimization and upgrading, the number of employment in each city decreased, and the degree of their barriers to environmental carrying capacity decreased, while the GDP of each city in the PRD showed a rapid upward trend during the period, which may be one of the reasons for the change of barrier factors in the PRD urban agglomeration.
4 Discussion
Sustainable development is multidimensional, and the sustainable development of cities involves many factors such as social stability, economic growth, and environmental quality (Gonzalez-Garcia et al., 2018). As the contradiction between economic development and environmental protection becomes more prominent, the lower level of environmental carrying capacity will, to a certain extent, limit the sustainable development of the regional economy, so improving the carrying capacity of the environment and coordinating the relationship between economic and social development and resource environmental protection are inevitable requirements for protecting resources and environment and promoting sustainable economic and social development.
Comparing our results with previous studies, we find a number of similarities and differences.
1) Our study found that economic development is the main influencing factor for the level of environmental carrying capacity, but it does not completely determine the level of environmental carrying capacity, Sun et al. (2020) study on the level of green development of cities in Northeast China shows that there is not a completely positive relationship between the level of economic development and the level of green development, which may be influenced by the environmental carrying capacity, and cities or regions with higher economic levels also have lower levels of green development in their environment, which is similar to the findings of our study. However, their study focuses on the north-eastern region of China, which differs from the analysis of 60 specific cities in China’s three major urban agglomerations.
2) Wu et al. (2021) finds that the improvement of comprehensive environmental carrying capacity also depends on the coordinated development of socio-economic and resource environment. Although we both use the entropy weighting method to calculate indicator weights and the TOPSIS model to measure the level of carrying capacity, our findings were less consistent. In our study, the 2019 per capita GDP of Zhuhai in this study is as high as US$25,400, which is located in the fourth place in China, and has surpassed the more economically developed cities such as Beijing, Shanghai and Guangzhou, and reached the internationally recognized threshold of developed economies. In addition, Zhuhai is rich in natural resources, with abundant marine resources, tourism resources and greening resources, and its greening coverage rate of built-up areas has been in the 2013–2019 It ranks in the top five in China, yet the study found that Zhuhai’s comprehensive environmental carrying capacity level score is not high, and during the study period, its score is only in the middle level of the three major urban agglomerations cities, and its environmental carrying capacity level has been III. This may be due to the fact that in their study they considered the coupled coordination between the economic-resource-environmental system and we only considered the impact of the four subsystems on the environmental carrying capacity without considering the degree of synergy between the subsystems, which is also in line with the findings of Wang et al. (2020) study on mineral resource cities: cities with high levels of development in all four dimensions - economic, social, resource and environmental - will have a lower overall carrying capacity due to a lower degree of synergy between the dimensions.
3) In the past few years, China has still not achieved a harmonious development between the environment and economic growth (Cheng et al., 2019). This is similar to our findings. We find that some cities still need to sacrifice a certain amount of environment in the process of economic development, focusing only on economic development at the expense of environmental protection. The country should continue to increase its focus on green development and improve the efficiency of pollutant treatment.
4) Unlike other studies, our study includes three urban agglomerations, the BTH, the YRD and the PRD, and discusses the differences among urban agglomerations as well as evaluates and analyzes the environmental carrying capacity within urban agglomerations, which is the first study among existing studies to evaluate and analyze the environmental carrying capacity of three urban agglomerations at the same time, covering a wider range of cities and having more reference significance.
5 Conclusion and recommendations
5.1 Conclusion
In order to better protect the environment and promote the sustainable development of the three major urban agglomerations of BTH, YRD and PRD, we have evaluated and analyzed the environmental carrying capacity of the three major urban agglomerations in 2013, 2016 and 2019, analyzed their change characteristics and their obstructive factors, and reached the following conclusions.
1) In general, during the study period, the average annual environmental carrying capacity scores of the YRD and the PRD both show an upward trend, from 0.15625 in 2013 to 0.18906 in 2019 for the YRD, and from 0.156 in 2013 to 0.16867 in 2019 for the PRD. The 3-year average score for the environmental carrying capacity of the BTH is significantly higher than that of the other two urban agglomerations and remains stable overall, but in contrast, its annual average environmental carrying capacity score tends to decline during the study period.
2) During the study period, each urban agglomeration had two Class I level cities, which are regional core cities that not only have high levels of environmental carrying capacity themselves, but also play a strong role in radiating the development of the region. In addition, compared to the other two urban agglomerations, the YRD has improved its level more rapidly, which to some extent indicates that the YRD may be more effective in promoting high-quality economic development.
3) In terms of the primary indicator, the main obstacle factor for the environmental carrying capacity level of most cities is economic development, and its obstacle level is increasing. From the secondary indicators, in 2013 and 2016, the number one obstacle factor for most cities was the employed person in each city, however, in 2019, the number one obstacle factor for most cities became the GDP of each city, which also reflects from the side that the degree of obstruction of economic development to the level of environmental carrying capacity is increasing. In addition, it is worth noting that cities with strong overall strength, such as Beijing, Shanghai and Suzhou, have roughly the same percentage of obstacle levels for the four tier one indicators of economic development, social change, pollution emissions and environmental support, but due to differences in the focus of their respective development, the specific obstacle factors for which they rank highest also differ.
Overall, this paper contributes to the existing literature and demonstrates the effectiveness of the entropy-weight based topsis model and obstacle diagnosis model in assessing environmental carrying capacity levels and diagnosing factors that are barriers to environmental carrying capacity. However, there are a number of issues that warrant further investigation. Firstly, due to limitations in data collection, this study was not able to include all 7 years of data from 2013 to 2019, and only those years that were representative for the three urban agglomerations studied and in which significant events occurred were examined, which may have some impact on the representativeness of the overall data, and future studies could take more years into account. Secondly, this study only considered the impact of the four sub-systems on the environmental carrying capacity without considering the degree of synergy between the sub-systems, and future studies can measure the level of environmental carrying capacity on the basis of the degree of synergy between the four sub-systems. Finally, the selection of indicators can be improved in future studies. The rapid economic development has led to a large amount of energy consumption, especially fossil fuels, which are the main source of carbon emissions. The power industry accounts for nearly 40% of China’s carbon emissions, and coal-fired power generation has become the main cause of global warming and climate change (Cui et al., 2021). Hence, indicators such as electricity generation and fossil fuel consumption could be included in the future measurement of environmental carrying capacity levels.
5.2 Recommendation
The coordinated development of economic society and resources and environment is the key to sustainable development. There are some similarities between the three major urban agglomerations in terms of environmental carrying capacity development, and through the analysis and conclusion of this study, we make the following recommendations.
In general, although economic development is the main obstacle factor of environmental carrying capacity level in most cities, it is not the decisive factor, and the obstacle degree of environmental carrying capacity influencing factors is more evenly distributed in some cities with stronger comprehensive strength, which largely reflects the importance of development balance. This balance is both the balance between ecological and economic development and the balance between the development of cities within the region. Therefore, all three major urban agglomerations should further enhance the integrity and synergy of development to promote sustainable economic development. In addition, the study found that all three major urban agglomerations have two Class I level cities, and these cities are regional core cities. Therefore, first of all, each city cluster should give full play to the role of radiation driven by the core cities, establish convenient and efficient transportation links, and accelerate the transfer and undertaking of industries in order to reduce the disparity between regions within the city clusters and balance the overall economic and social development of the city clusters and resource environmental protection. Secondly, each urban agglomeration should promote the cooperation of internal high-quality public service resources, support the orderly transfer and shared gathering of resources such as science and technology innovation centers, give full play to the role of resource clustering and synergy, optimize the allocation of resources to the maximum extent, improve the efficiency of resource utilization, and thus enhance their environmental carrying capacity. Thirdly, each urban agglomeration should vigorously promote the construction of ecological civilization, deepen ecological protection mechanisms, strengthen inter-city ecological and environmental cooperation, collaborate to tackle cross-regional and cross-basin environmental management problems, and improve environmental management capabilities. Finally, most cities are currently ranked first in terms of barriers to GDP, which shows that their industrial enterprises are promoting the city’s economic development while also suffering from environmental inefficiency, so it is important to vigorously develop high-tech and green industries, promote industrial and industrial structure upgrading, and facilitate economic development in the direction of high quality.
Different regions have different development priorities and regional characteristics, even though they have certain commonalities. Therefore, we have put forward some targeted suggestions, taking into account the study of this paper and the development characteristics of the three major urban agglomerations.
Our study shows that the 3-year average score of the environmental carrying capacity level of the BTH is on a downward trend, and one of the important reasons for this is the unbalanced regional development, therefore, the BTH should promote the construction of Xiong’an New Area, Binhai New Area and other comprehensive functional areas, give full play to their potential comparative and competitive advantages, accelerate the agglomeration of industries with special advantages, promote the integration of industries and cities and the construction of a new type of urbanization, improve the efficiency of resource utilization, improve the quality of the ecological environment, and make new contributions to maintaining the sustainable and healthy development of the national economy. In the YRD, the cities in Anhui Province are relatively slow to develop and their environmental carrying capacity levels are generally low. So the YRD should focus on the development of northern Anhui, enhance the attractiveness of northern Anhui in terms of talents, technology and policies, moderately expand the scale of cities, increase employment, accelerate the integration of northern Anhui into the YRD and narrow the gap between YRD cities. In addition, our study found that the problems in the PRD are mainly in the conflict between population and resources, and therefore, the PRD should vigorously develop and utilise new energy sources, explore new ways to improve energy efficiency and build a clean and efficient energy consumption system, while it will accelerate the development and utilisation of marine resources, integrate sea and land resources and develop high-end clean industries such as sea wind power generation and marine services.
Data availability statement
The raw data supporting the conclusions of this article will be made available by the authors, without undue reservation.
Author contributions
Conceptualization, ZC and Z-gW; methodology, ZC; software, Z-gW; validation, Y-yW, MZ and X-rZ; formal analysis, Y-yW; investigation, MZ and X-rZ; resources, MZ; data curation, X-rZ; writing—original draft preparation, Y-yW; writing—review and editing, ZC; visualization, Y-yW; supervision, ZC. All authors have read and agreed to the published version of the manuscript.
Funding
This research was funded by Jiangsu Education Department University Philosophy and Social Science Research Project (2021SJA1589) and Nantong University College Student Innovation Training Program (2,022,029).
Conflict of interest
The authors declare that the research was conducted in the absence of any commercial or financial relationships that could be construed as a potential conflict of interest.
Publisher’s note
All claims expressed in this article are solely those of the authors and do not necessarily represent those of their affiliated organizations, or those of the publisher, the editors and the reviewers. Any product that may be evaluated in this article, or claim that may be made by its manufacturer, is not guaranteed or endorsed by the publisher.
Supplementary material
The Supplementary Material for this article can be found online at: https://www.frontiersin.org/articles/10.3389/fenvs.2022.1015158/full#supplementary-material
References
Chen, Y., Zhu, M. K., Lu, J. L., Zhou, Q., and Ma, W. B. (2020). Evaluation of ecological city and analysis of obstacle factors under the background of high-quality development: Taking cities in the Yellow River Basin as examples : Taking cities in the Yellow River Basin as examples. Ecol. Indic. 118, 106771. doi:10.1016/j.ecolind.2020.106771
Cheng, S., Xie, J., and XiaoZhang, Y. (2019). Measuring the environmental efficiency and technology gap of PM2.5 in China's ten city groups: An empirical analysis using the EBM meta-frontier model. Int. J. Environ. Res. Public Health 16, 675. doi:10.3390/ijerph16040675
Cui, X., Zhao, T., and Wang, J. (2021). Allocation of carbon emission quotas in China’s provincial power sector based on entropy method and ZSG-DEA. J. Clean. Prod. 284, 124683. doi:10.1016/j.jclepro.2020.124683
Diao, S., Yuan, J., and Wu, Y. (2019). Performance evaluation of urban comprehensive carrying capacity of Harbin, Heilongjiang province in China. Chin. Geogr. Sci. 29, 579–590. doi:10.1007/s11769-019-1056-9
Dong, K., Zhao, J., Ren, X., and Shi, Y. (2022). Environmental regulation, human capital, and pollutant emissions: The case of SO2 emissions for China. J. Chin. Econ. Bus. Stud., 1–25. doi:10.1080/14765284.2022.2106539
Gonzalez-Garcia, S., Manteiga, R., Moreira, M. T., and Feijoo, G. (2018). Assessing the sustainability of Spanish cities considering environmental and socio-economic indicators. J. Clean. Prod. 178, 599–610. doi:10.1016/j.jclepro.2018.01.056
Han, J. (2019). Carrying capacity of low carbon tourism environment in coastal areas from the perspective of ecological efficiency. J. Coast. Res. 83, 199. doi:10.2112/si83-031.1
Hwang, C. L., and Yoon, K. (1981). Multiple attribute decision making methods and applications a state-of-the-art survey. Berlin, Heidelberg: F. Springer.
Jung, C., Kim, C., Kim, S., and Suh, K. (2018). Analysis of environmental carrying capacity with emergy perspective of Jeju Island. Sustainability 10, 1681. doi:10.3390/su10051681
Lai, Y. J., Liu, T. Y., and Hwang, C. L. (1994). Topsis for MODM. Eur. J. operational Res. 76, 486–500. doi:10.1016/0377-2217(94)90282-8
Li, J., and Zhou, Y. (2019). Comprehensive evaluation of the eco-environmental carrying capacity of beijing-tianjin-hebei urban agglomeration. IOP Conf. Ser. Earth Environ. Sci. 300, 032113. doi:10.1088/1755-1315/300/3/032113
Li, X. (2021). TOPSIS model with entropy weight for eco geological environmental carrying capacity assessment. Microprocess. Microsystems 82, 103805. doi:10.1016/j.micpro.2020.103805
Liao, S., Wu, Y., Wong, S. W., and Shen, L. (2020). Provincial perspective analysis on the coordination between urbanization growth and resource environment carrying capacity (RECC) in China. Sci. Total Environ. 730, 138964. doi:10.1016/j.scitotenv.2020.138964
Lin, W., and Chen, Y. (2017). The impact of urbanization on land carrying capacity in beijing-tianjin-hebei region. Agro Food Ind. Hi-Tech. 28, 3747–3751.
Lin, B., and Zhu, J. (2019). Fiscal spending and green economic growth: Evidence from China. Ener. Econ. 83, 264–271. doi:10.1016/j.eneco.2019.07.010
Liu, R. Z., and Borthwick, A. G. L. (2011). Measurement and assessment of carrying capacity of the environment in Ningbo, China. J. Environ. Manage. 92, 2047–2053. doi:10.1016/j.jenvman.2011.03.033
Ma, W., Zhou, S. S., and Liu, S. J. (2021). Research on the environmental carrying capacity of ecotourism in shijiazhuang city based on the pressure-state-response model. Fresenius Environ. Bull. 30, 10335–10340.
Nowak, A., Krukowski, A., and Rozanska-Boczula, M. (2019). Assessment of sustainability in agriculture of the European union countries. Agronomy-Basel 9. doi:10.3390/agronomy9120890
Peng, B., Wang, Y., Elahi, E., and Wei, G. (2018). Evaluation and prediction of the ecological footprint and ecological carrying capacity for Yangtze River urban agglomeration based on the grey model. Int. J. Environ. Res. Public Health 15, 2543. doi:10.3390/ijerph15112543
Song, D., Zang, L., Liu, C., Shi, X., and Wu, H. (2016). Evaluation of geologic bearing capacity of coastal zones taking coastal area of Laizhou Bay as an example. Ocean Coast. Manag. 134, 129–139. doi:10.1016/j.ocecoaman.2016.10.004
Sun, B., and Yang, X. (2019). Simulation of water resources carrying capacity in xiong’an new area based on system dynamics model. Water 11, 1085. doi:10.3390/w11051085
Sun, Y. S., Tong, L. J., and Liu, D. Q. (2020). An empirical study of the measurement of spatial-temporal patterns and obstacles in the green development of Northeast China. Sustainability 12, 10190. doi:10.3390/su122310190
Wang, D., Shi, Y., and Wan, K. (2020). Integrated evaluation of the carrying capacities of mineral resource-based cities considering synergy between subsystems. Ecol. Indic. 108, 105701. doi:10.1016/j.ecolind.2019.105701
Wang, L., and Liu, H. (2020). Quantitative evaluation of Tibet’s resource and environmental carrying capacity. J. Mt. Sci. 16, 1702–1714. doi:10.1007/s11629-018-5148-2
Wang, S., and Hu, Z.-h. (2017). Effect of regional ecological carrying capacity on economic transformation. J. Central South Univ. 24, 1522–1528. doi:10.1007/s11771-017-3556-z
Wang, W. Y., and Zeng, W. H. (2013). Optimizing the regional industrial structure based on the environmental carrying capacity: An inexact fuzzy multi-objective programming model. Sustainability 5, 5391–5415. doi:10.3390/su5125391
Wang, Y., Cheng, H., and Huang, L. (2018). Water resources carrying capacity evaluation of a dense city group: A comprehensive water resources carrying capacity evaluation model of wuhan urban agglomeration. Urban Water J. 15, 615–625. doi:10.1080/1573062x.2018.1529805
Wang, Z., Liang, L., Sun, Z., and Wang, X. (2019). Spatiotemporal differentiation and the factors influencing urbanization and ecological environment synergistic effects within the Beijing-Tianjin-Hebei urban agglomeration. J. Environ. Manage. 243, 227–239. doi:10.1016/j.jenvman.2019.04.088
Wu, M., Wu, J., and Zang, C. (2021). A comprehensive evaluation of the eco-carrying capacity and green economy in the Guangdong-Hong Kong-Macao Greater Bay Area, China. J. Clean. Prod. 281, 124945. doi:10.1016/j.jclepro.2020.124945
Xiang, X., Ma, M., Ma, X., Chen, L., Cai, W., Feng, W., et al. (2022). Historical decarbonization of global commercial building operations in the 21st century. Appl. Energy 322, 119401. doi:10.1016/j.apenergy.2022.119401
Yan, R., Xiang, X., Cai, W., and Ma, M. (2022). Decarbonizing residential buildings in the developing world: Historical cases from China. Sci. Total Environ. 847, 157679. doi:10.1016/j.scitotenv.2022.157679
Zhang, M., Liu, Y., Wu, J., and Wang, T. (2018). Index system of urban resource and environment carrying capacity based on ecological civilization. Environ. Impact Assess. Rev. 68, 90–97. doi:10.1016/j.eiar.2017.11.002
Zhang, R., Sun, J., Fan, H., and Yang, R. (2019). Quantitative method of agricultural land environmental bearing capacity under resource constraint. Ekoloji 28, 3183–3194.
Zhang, S., Ma, M., Li, K., Ma, Z., Feng, W., and Cai, W. (2022a). Historical carbon abatement in the commercial building operation: China versus the US. Energy Econ. 105, 105712. doi:10.1016/j.eneco.2021.105712
Zhang, S., Ma, M., Xiang, X., Cai, W., Feng, W., and Ma, Z. (2022b). Potential to decarbonize the commercial building operation of the top two emitters by 2060. Resour. Conservation Recycl., 185. doi:10.1016/j.resconrec.2022.106481
Zheng, G., Li, C., and Feng, Y. (2020). Developing a new index for evaluating physiological safety in high temperature weather based on entropy-TOPSIS model - a case of sanitation worker. Environ. Res. 191, 110091. doi:10.1016/j.envres.2020.110091
Keywords: urban agglomerations, environmental carrying capacity, entropy weight method, TOPSIS, obstacle indicators diagnosis
Citation: Cui Z, Wang Z-g, Zhang X-r, Wang Y-y and Zhang M (2022) Evaluation of regional environmental carrying capacity and its obstacle indicators diagnosis: Evidence from three major urban agglomerations in China. Front. Environ. Sci. 10:1015158. doi: 10.3389/fenvs.2022.1015158
Received: 09 August 2022; Accepted: 12 September 2022;
Published: 28 September 2022.
Edited by:
Kangyin Dong, University of International Business and Economics, ChinaCopyright © 2022 Cui, Wang, Zhang, Wang and Zhang. This is an open-access article distributed under the terms of the Creative Commons Attribution License (CC BY). The use, distribution or reproduction in other forums is permitted, provided the original author(s) and the copyright owner(s) are credited and that the original publication in this journal is cited, in accordance with accepted academic practice. No use, distribution or reproduction is permitted which does not comply with these terms.
*Correspondence: Zhe Cui, Y3VpLnpAbnR1LmVkdS5jbg==
†These authors have contributed equally to this work and share first authorship