 Dil B. Rahut
 Anjali Singh
 Tetsushi Sonobe
- 1Asian Development Bank Institute (ADBI), Tokyo, Japan
- 2Project Concern International, New Delhi, India
Improved WASH facilities are crucial for reducing infectious diseases such as diarrhoea, malaria, dengue, and worms, etc. However, a large proportion of households in developing countries lack basic WASH facilities. Therefore, the current paper uses the household data from 733,223 households in fourty two developing countries to explore the prevalence rate of basic WASH facilities. The result shows that access to basic drinking water is much better than access to other WASH facilities, such as basic sanitation and hygiene facilities. However, the prevalence of basic drinking water, basic sanitation, and basic hygiene vary across different regions and countries-low in Africa and South Asia. The multi-level regression model shows that households with better economic status and education and urban households are more likely to use basic WASH facilities. Further, women empowerment and already having one WASH practice are also positively associated with the adoption of other WASH facilities. The policy should aim at improving awareness about the benefit of WASH facilities through education, and it should also subsidize WASH facilities for poor households and those living in rural areas.
1 Introduction
“WASH” stands for three critical aspects for health, survival, and development: Water, Sanitation, and Hygiene. Access to improved water, sanitation, and hygiene practices contributes to a healthy life and is documented to benefit the economy. Realizing the importance of access to WASH facilities, in 2010, the United Nations General Assembly endorsed access to safe drinking water and sanitation as a fundamental human right (UN Assembly, 2010). Diarrhoeal diseases due to poor sanitation, poor hygiene, or unsafe drinking water were responsible for 9 percent of the deaths of children under five (484,000) (UNICEF, 2022). Children who live in inadequate WASH systems not only suffer from an increased risk of mortality but also experience severe nutritional deficiency (World Health Organization, 2015). The latest Global Nutrition report quoted that globally 45.4 million children aged 5 years and less are wasted (Global Nutrition Report, 2021). Adoption of good sanitation and hygiene practices is well established as a cost-effective, easy to practice, and most effective public health intervention in preventing infectious diseases like diarrhoea, cholera, hepatitis, etc. (Fewtrell et al., 2005). Therefore, Government in developing countries has been making a serious effort to meet Sustainable Development Goal 6 (SDG-6) and its sub-targets (Targets 6.1 and 6.2) under the 2030 Agenda for Sustainable Development.
Recent research shows that appropriate disposal of excreta, hand wash habits, and treated water reduce diarrhoeal cases from 48 percent to 17 percent (Cairncross et al., 2010). According to Wolfe et al. (2018), at 75 percent coverage, sanitation reduces diarrhoea risks by 25–30 percent, with a further 45 percent reduction when sanitation coverage exceeds 75 percent. Additionally, safely managed water, which is defined as the treatment of basic water alone, can considerably reduce diarrhoeal deaths (Fewtrell et al., 2005; Clasen et al., 2007). Studies also established that the practice of basic hygiene in households, i.e., using water and soap for hand-washing, prevents diarrhoea (44%) and pneumonia (25%) in children under age five (WHO, 2005). A study conducted in Nigeria found that about 17 percent of under-five deaths caused due to diarrhoea can be prevented through proper sanitation (Oloruntoba et al., 2014). Some deadly diseases like cholera and typhoid are also avoidable by exercising good sanitation and water treatment (Aiello et al., 2008; World Health Organization, 2015). There are enough shreds of evidence to support the fact that maternal health is also interlinked with WASH services-water, sanitation, and hygiene act as a catalyst in improving maternal health outcomes and postpartum. A systematic review conducted in 2014 found a significant association between poor WASH practice and maternal mortality (Benova, et al., 2014). Furthermore, the historical link between hygiene and childbirth and the effect of clean water accessibility on safe delivery is well recognized (Semmelweis and Semmelweis, 1983; Gould, 2010; Nalule, Y. et al., 2021). Therefore, improved WASH is crucial to promote health and sustainable development, as evidenced by the studies described above.
Through the combined efforts of public and private sector stakeholders, about 2.1 billion people have had access to improved sanitation facilities, and 2.6 billion people have been exposed to improved water sources globally since 1990 (UNICEF, 2016). During the same period, encouraging better sanitation practices deepened through sector programming and planning; the proportion of people who washed their hands with soap and water benefited, and the taboos to discuss defecation and menstrual hygiene weakened (UNICEF, 2016).
Despite several gains, the Millennium Development Goal (MDG) and its important targets were missed by a wide margin. Over 2 billion people lack drinking water that is readily available at home and free from contamination. Nearly 2 billion people lack access to basic water needs, which can be fetched within 30 min round trip, and almost 122 million people drink untreated water from surface sources like lakes, rivers, etc. (World Health Organization/United Nations Childrens’ Fund, 2021). Different regions observed different challenges regarding water services. The supply of a safely managed water source remains a challenge in the least developed countries, where an estimated 1.2 billion people depend on sources or systems with significant sanitation risks (Onda et al., 2012). In sub-Saharan Africa, approximately 25–40 percent of water sources were not functioning at any given time (Tincani et al., 2015). At the same time, globally, every third person does not have access to basic sanitation, defined as facilities for the safe disposal of human waste. According to the Joint Monitoring report (JMP), nearly half of the world’s population lacked safely managed sanitation services, and approximately 71 percent of population used water and soap after defecation (World Health Organization, 2021). Another study supports the previous arguments that, 502,000 diarrhoeal deaths were due to unsafe drinking water, 280,000 deaths were attributable to poor sanitation, and 297,000 were due to inadequate hand-washing practices (Prüss-Ustün et al., 2014).
The attention shifted from millennium development goals to sustainable development goals (SDG) with an ambitious vision to achieve global access to “safely managed water” and “basic sanitation facility,” and ¨hygiene¨ by 2030. The target defined under SDG 6 (6.1 and 6.2) ensures continuous and universal access to basic WASH resources, i.e., Water, Sanitation, and Hygiene, to address deficiencies prevalent among low- and middle-income countries (LMICs) and populations living in vulnerable situations (Nagabhatla et al., 2019). The approach from MDGs to SDGs has shifted from” “to achieve the set goals” to “growth for all”.
Against the backdrop of a lack of comparative analysis covering different countries and continents, this paper fills in the important research gap by examining the level of WASH services in 42 low and middle-income countries and the drivers of the adoption of WASH facilities. This paper also contributes to the literature as it uses multi-level logit modeling, which accounts for the country and regional level differences. Further, it sheds light on the nature of inequalities that exist in different settings and addresses challenges that still exist in ensuring that progress reaches all.
2 Data and methodology
2.1 Data sources
The study is based on recent Demographic Health Surveys (DHS) conducted between 2010 and 2020 in 42 developing countries from Asia, Sub-Saharan Africa, Latin America, and the Caribbean, Europe, and the Oceania region1. The total sample used in the study is 733,223 from 42 countries, and the sample size by country is provided in Supplementary Appendix 1, Supplementary Table A1. DHS, funded by U.S. Agency for International Development (USAID), is a nationwide survey collected every 5 years across low- and middle-income countries and employs stratified multi-stage sampling techniques to ensure national and sub-national representativeness. With the broad objective, the survey estimates core demographic indicators like fertility, mortality, and family planning and provides information on maternal and child health indicators such as immunization, skilled birth attendance, domestic violence, etc. A detailed description of the study design, sampling frame, survey implementation, weighting mechanism and quality of data collection, and corresponding non-sampling errors are published for each round of national reports (ICF International, 2012). The study used the household file to elicit inequality in access to water, sanitation, and hand-washing facilities across 42 developing countries. These files provide characteristics of the dwelling unit, e.g., source and access to water, sanitation, and hygiene, ownership of various durable goods, type of cooking fuel, materials used for house construction, etc. Permission to use the data set was sought from Measure DHS. The data set is publically available at the Measure DHS website and can be accessed on request from https://dhsprogram.com/data/available-datasets.cfm.
2.2 Empirical methodology
Multi-level logistic regression models was employed to elicit variations in coverage of basic WASH. Because of the hierarchal nature of the influence of households and communities on access to basic WASH services, three-level binary logistics regression was used for the analysis. DHS surveys in selected countries used a uniform multi-stage cluster sampling approach. This procedure introduces multi-level dependency among the observations, and the dependency issue often arises due to the hierarchical nature of data. In DHS survey research, clustered samples have several levels, e.g., cluster, community, and geographical regions. Besides using household socioeconomic factors as explanatory variables, including these geographical settings will control for other potential factors such as environment, development, and infrastructures that facilitate the utilization of basic WASH services.
Therefore, traditional logistic regression (single-level) in the nested setting invites errors on various fronts. Firstly, logistic regression requires the assumptions: 1) independence of the observations conditional on the explanatory variables and 2) uncorrelated residual errors, and these assumptions are not always met when analyzing nested data (Snijders, and Bosker, 2011; Goldstein, 2011). Secondly, due to heterogeneity at the regional level, a single-level model is no longer valid and reasonable and gives errors in estimating the model parameters. Hence to evaluate the differences offered by different layers of explanatory variables on the access to basic water, sanitation, and hygiene services and to measure the regional and country-level variations, multi-level binary regression model was adopted. This allows for the simultaneous examination of the effects of group-level (cluster and region) and household-level variations on outcomes, while accounting for the non-independence of observations within groups (Raudenbush and Bryk, 2002). The multi-level analysis facilitates the investigation of between-group and within-group variability and how variables at both the group and individual levels are related to the variability.
In multi-level analyses using pooled data (combining 42 countries), the household is considered at the first level, the country at the second level, and the region at the third level. Moreover, a two-level binary logistic regression model has been used to assess variations at the country level, where the household is at level one, and the region within the country is at level two. Thus, we can consider the effect of both sample clustering and unobserved factors at the community level. The formal econometric model used in the analysis is as follows;
Where, subscript
Both
2.3 Dependent and independent variable
To assess the progress in WASH services, WHO and JMP have developed a new ladder: Basic, Limited, and Unimproved/No facility. These have been updated and expanded to facilitate enhanced global monitoring of drinking water, sanitation, and hygiene. These modified ladders build on the previously defined improved/unimproved classification, thereby providing continuity with past monitoring and introducing new rungs with additional criteria relating to service levels. For this study, we concentrated on three dependent variables defined for the study population, which assign a value of 1 to households that use basic services (water, sanitation, and hygiene) and 0 to those households that use limited or unimproved services, and had no facility of hand-washing, practiced open defecation and used surface water for drinking. The definition of WASH indicators is given in Figure 1.
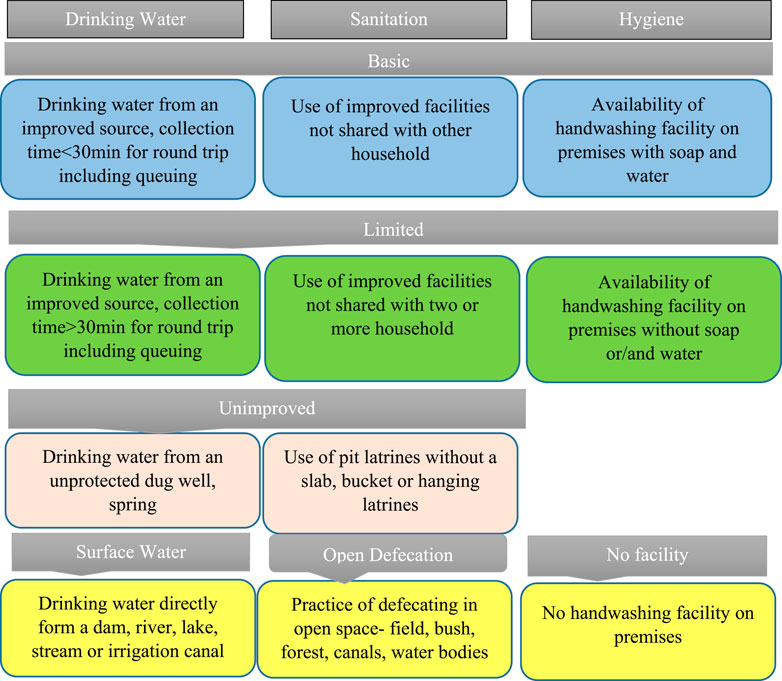
FIGURE 1. Definition of Water, Sanitation, and Hygiene facilities according to JMP (WHO) ladder.
Seven explanatory variables were used in the study, a dummy of the place of residence (rural versus urban), a dummy of the sex of the household head (male versus female), the age of the household head, the dummy for the education of household head (no education, primary, secondary, and higher), wealth index dummy (poorest, poorer, middle, richer, and richest), dummy of the sex composition of the household (three groups: number of males equals number of females; number of males > number of females; number of males < number of females), and women’s decision-making power. The decision-making power of women is a composite variable derived from three questions. We have recorded the composite variable into three categories: no decision-if all three answers to the questions on the decision are no; one or two decisions—if at least one or two responses are yes; three decisions-if answers of all three questions are yes. These variables were selected based on their significant association with the outcome variable and the literature review. Three dependent variables, i.e., basic drinking water facility (yes/no), basic sanitation facility (yes/no), and basic hygiene facility (yes/no), were also added to the regression analysis to examine if having one of the WASH facilities also influence the adoption of the other.
3 Results
3.1 Status of WASH facilities
Before delving into the detailed statistical explanation of models on how socioeconomic and demographic factors affect access to basic WASH services, this section presents the coverage of basic water, sanitation, and hygiene practices among the countries used in the study (see Supplementary Table A1; Supplementary Figures 1A–3A in Appendix 1). The selected countries from West Asia and European regions have the highest prevalence of basic drinking water services (see Figure 2). Almost all households in these regions have universal access to basic drinking water facilities (98%). The proportion of households with access to basic water services in the countries in this region ranges from 97% to 99.6%.
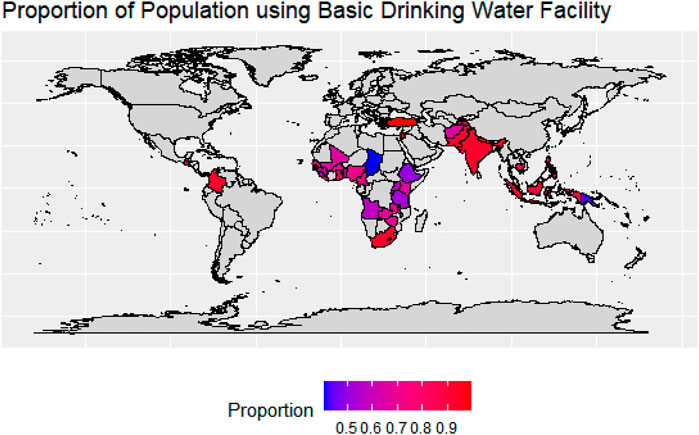
FIGURE 2. Proportion of population using basic drinking water facility in the study countries. Note: Proportion estimated as the share of sampled households using basic drinking water facility to the total sampled households by countries. Source: Authors estimation based on the DHS data.
In five of the nine countries (Bangladesh was dropped due to limited data) listed in the South and Southeast Asian region, more than 90 percent of households have access to basic drinking facilities; these six countries are India (92.7%), Indonesia (90%), Maldives (99.4%), Nepal (94.8%), Pakistan (91.6%), Philippines (95.2%). The region is ranked second in terms of access to basic drinking water facilities, with a prevalence rate of 91 percent. It is noteworthy to mention that there is wide variation between countries in the region—35 percent of households in Afghanistan still lack basic drinking water services, followed by Timor-Leste (25%) and Cambodia (17%). In Latin America and the Caribbean region, Colombia has the highest prevalence of basic drinking water (around 93 percent), followed by Guatemala (86%). In Haiti, 3 out of 10 households still did not have access to basic drinking water. Regional level prevalence shows that Latin America and the Caribbean region rank third with an 86 percent prevalence of basic water access.
In 23 Sub-Saharan African (SSA) countries, the prevalence of basic drinking water facilities is around 64 percent and ranges from 41 percent in Chad to 92 percent in Gambia and South Africa. Out of 23 countries, 16 had less than 70 percent basic drinking water coverage, and the rest seven countries with more than 70% coverage are Cameroon (71%), Gambia (92.3%), Ghana (83.7%), Liberia (74.7%), Nigeria (71.8%), Senegal (81.6%), South Africa (92.3%). Coverage of basic drinking water services was lowest in Papua New Guinea, nearly 57 percent of households still use limited or unimproved or surface water facilities.
Albania (97%), Turkey (96.6%), Jordan (98.2%), and Tajikistan (96.5%) seem to be doing well in terms of basic sanitation, with all most every household having access to basic sanitation (see Figure 3 and Supplementary Table A1; Supplementary Figures 1A–3A in Appendix 1); in contrast, in Armenia, only 77.6 percent had access to sanitation. Nearly half of the households in 10 South and Southeast Asian countries covered in this research still use limited/unimproved facilities or practice open defecation; these countries are Afghanistan (26.1%), Bangladesh (441%), Cambodia (46.11%), India (48.51%), Timor-Leste (51.81%). Among South and Southeast Asian countries listed in this research, the coverage of basic sanitation facilities was highest in Maldives (99.4%), whereas 11 out of 42 countries registered >70 percent coverage of basic sanitation services. The lowest coverage was recorded in two SSA countries, Chad and Ethiopia, where only 6 out of 100 households had access to basic sanitation facilities. Of the remaining 21 SSA countries, 13 had less than 40 percent coverage of basic sanitation facilities. In SSA countries, only 31 percent of households had access to basic sanitation services. West Asia, Latin America, and the Caribbean regions are the second-best regions, with 66 percent of households with access to basic sanitation facilities. After desegregating this prevalence at the country level, we found a skewed distribution ranging from 31.1 percent in Haiti to 84.4 percent in Columbia.
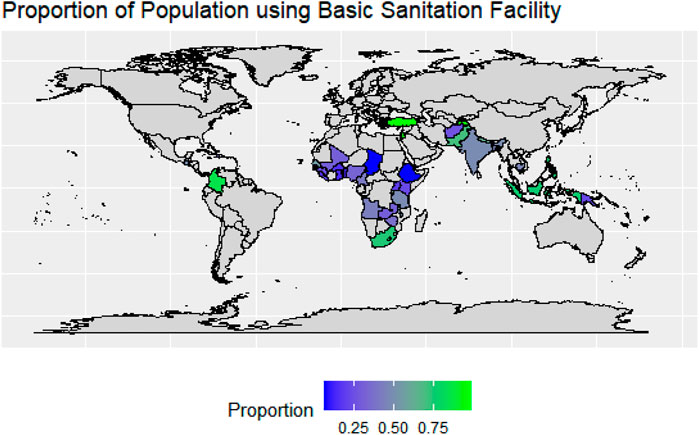
FIGURE 3. Proportion of population using basic sanitation facility in the study countries. Note: Proportion estimated as the share of sampled households using basic sanitation facility to the total sampled households by countries. Source: Authors estimation based on the DHS data.
Figure 4 and Supplementary Table A1; Supplementary Figures 1A–3A in Appendix 1 shows that 38 out of 42 countries had data to estimate the coverage of basic hygiene facilities. Due to a lack of data on hand-washing, four countries—Albania, Jordan, Turkey, and Columbia-were dropped from the analysis. Only 4 out of 38 countries had more than 90 percent coverage of basic sanitation facilities, of which three were from the South and Southeast Asia region (Indonesia, Maldives, and the Philippines) and one from West Asia (Armenia). Only 31 out of 100 households had hand-washing facilities with water and soap in the SSA region. The lowest coverage of basic hygiene practice was recorded in Burundi (5.3%), followed by Malawi (10.5%) and Gambia (12.5%). A large gap has been recorded between the two countries listed in Latin America and the Caribbean region; the prevalence of basic hygiene facilities was reported at 80.4 percent in Guatemala, while about 75 percent of households still lack basic hand-washing facilities in Haiti. With 62 percent coverage, the South and Southeast Asia region ranks third with regard to the availability of basic hygiene facilities. We found a skewed distribution in South and Southeast Asia-ranging from 28 percent in Timor-Leste to 97.8 percent in the Maldives. However, Indonesia, which shares its border with Timor-Leste, registered a 93 percent prevalence of basic hygiene practices. Less than half of the surveyed households had access to hand-washing facilities with soap and water in South Asian countries like Afghanistan (35.9%), Bangladesh (38.7%), and Nepal (47.1%) (see Supplementary Table A1; Supplementary Figures 1A–3A in Appendix 1).
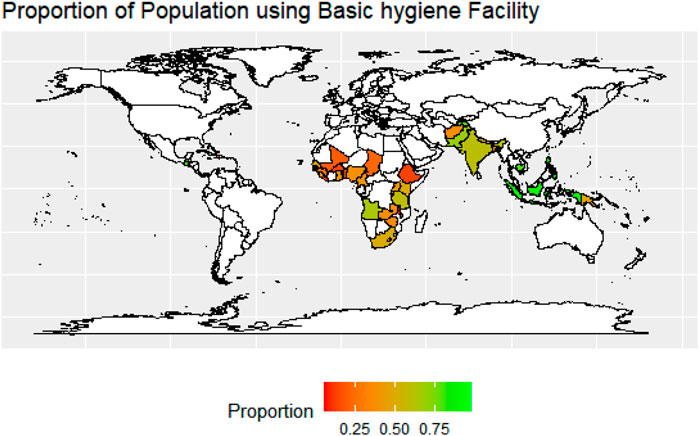
FIGURE 4. Proportion of population using basic hygiene facility in the study countries. Note: Proportion estimated as the share of sampled households using basic hygiene facility to the total sampled households by countries. Source: Authors estimation based on the DHS data.
Eliminating open defecation has been identified as a primary goal to achieve global equality in WASH services. It is explicitly referenced in SDG target 6.2 and is closely linked with wider efforts to end extreme poverty by 2030. Figure 5 depicts the proportion of households practicing open defecation. It is evident from the figure that all five countries listed under Central Asia, West Asia, and Europe have already eliminated open defecation (<1%), while the highest burdened countries with rates of more than 30 percent are from the SSA region. Regional analysis shows that South Asia has reported the highest prevalence (33%), followed by the SSA region (21%). However, it is important to mention that the highest prevalence of open defecation was reported in Chad, where 71 out of 100 households still practice open defecation. At the time of the survey, more than 50 percent of households in Burkina Faso and Benin (62% and 54%, respectively) used open defecation rather than any improved sanitation facilities. In 6 out of 10 South and Southeast Asian countries, at least >10 percent of households still defecate in open spaces, whereas except for Haiti, which recorded 25 percent prevalence, the rest of the two Latin American countries had reduced open defecation to below 6 percent.
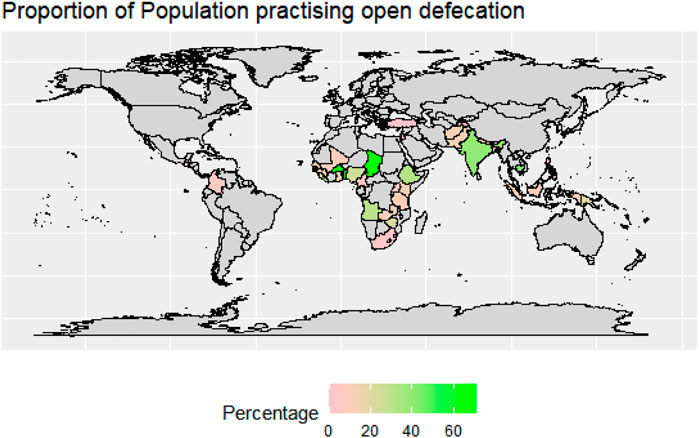
FIGURE 5. Proportion of population practicing open defecation in the study countries. Note: Proportion estimated as the share of sampled households practicing open defecation to the total sampled households by countries. Source: Authors estimation based on the DHS data.
3.2 Socioeconomic and demographic differentials of basic WASH services
Table 1 shows the descriptive statistics of the variable used in the empirical analysis of households’ access to basic drinking water, sanitation, and hygiene facilities for pooled data from 42 developing countries. Table 1 shows the existence of significant inequalities between urban and rural areas. Globally, coverage of all three basic WASH services (water, sanitation, and hygiene) was higher among urban households than rural households, but the degree of inequality varies. The highest rural-urban coverage gap was recorded for sanitation services at around 27 percentage points.
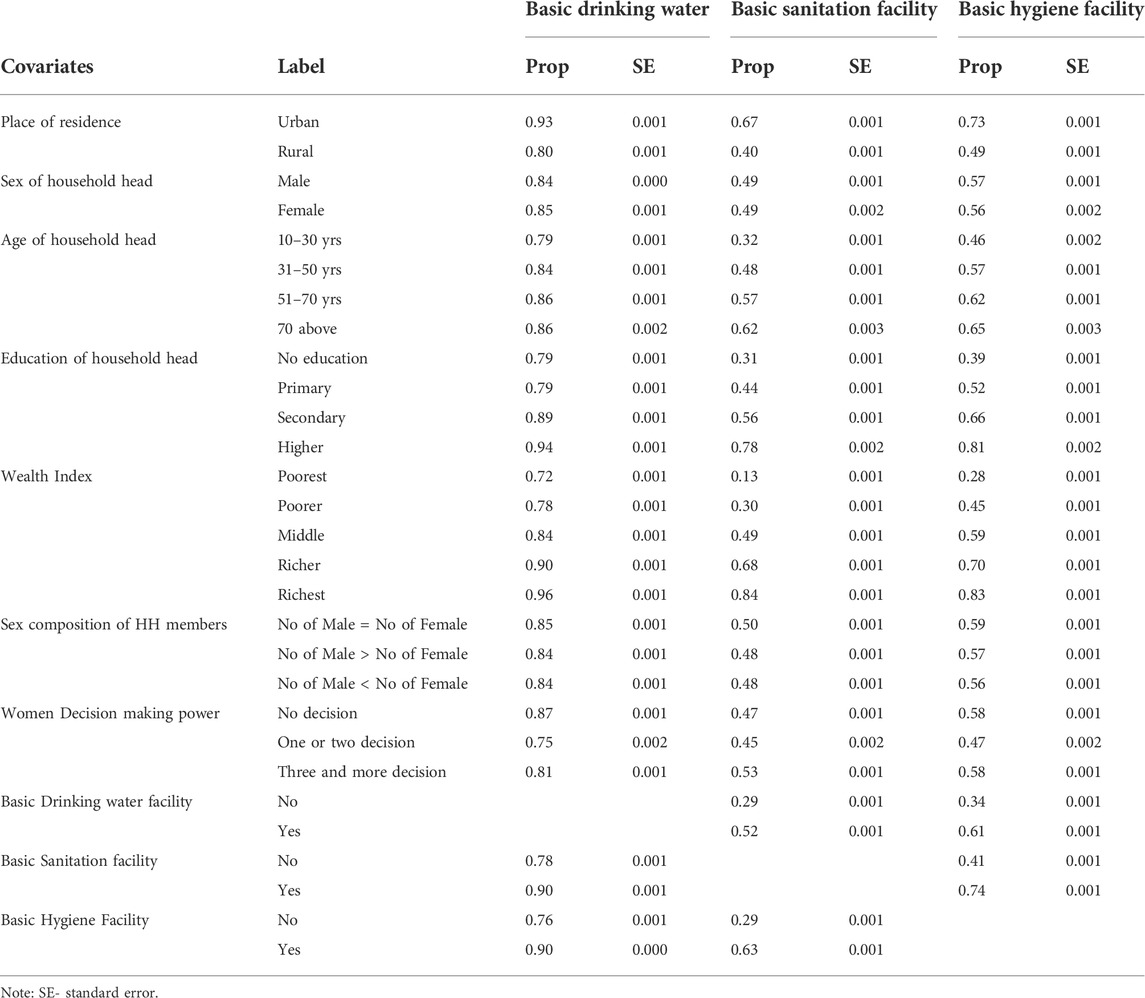
TABLE 1. Socioeconomic Indicators and Coverage of Basic WASH Services in 42 selected countries, 2010–2020.
Results show that access to basic WASH services was nearly identical in male and female-headed households. The sex of the household head and the sex composition of household members failed to explain the inequality in access to basic WASH services. As expected, the age and education of the household head show a significant association with access to basic WASH services. A monotonically increasing association was noted between education and the proportion of households using basic WASH services; access to basic WASH facilities was lowest for households with illiterate heads, which gradually increased with levels of education.
Further, with the increase in the age of household heads, the percentage of households using basic WASH services increases. For drinking water, coverage increased from 79 percent for households with heads in the age group 10–30 years to 86 percent for the age group >70 years. The difference between the household with head age group 10–30 years and >70 years was highest for sanitation facilities (30%), followed by hygiene facilities (19%). A similar direct and significant association also manifested between the household’s wealth status and coverage of basic WASH facilities. The percentage of households with access to WASH facilities increases with the family’s wealth. Analysis shows that 72 percent of the poorest household have access to basic drinking water services compared to 96 percent in the richest group. Significant gaps were observed across the income groups in the selected countries for the other two WASH components, such as sanitation and hygiene. About 84 percent of the richest households used basic sanitation services compared to the poorest households (13%). Similarly, about 83 percent of the richest households used basic hygiene services, compared to just 28 percent of the poorest households. However, it is important to note that there is wide variation between the countries, which is shown in the analysis in Supplementary Appendix 2; Supplementary Tables 1B–42B.
It is worthwhile to mention that coverage of any basic WASH component is directly driven by access to the other WASH facilities (i.e., having one WASH facility will induce the households to have other WASH facilities). Households with basic sanitation and hygiene facilities had higher drinking water source coverage than their counterparts. Similarly, accessibility of basic sanitation facilities promoted the usage of basic drinking water and hygiene services. A similar result was found for hygiene facilities; households with basic water or basic sanitation facilities had 33 and 27 percentage points higher coverage of hand-washing facilities with soap and water compared to the households with no basic WASH facility. A chi-square test was performed, and these associations were significant at 5 percent significance level. The country-wise descriptive statistics of the variable used in the empirical analysis of households’ access to basic drinking water, sanitation, and hygiene facilities are also provided in Supplementary Appendix 2; Supplementary Tables 1B–42B, and the result shows a similar kind of association between WASH facilities use (basic drinking water, basic sanitation, basic hygiene) and location (rural and urban), education of head, and wealth status of the households.
3.3 Multi-level regression analysis
Having identified the factors influencing the choice of WASH facilities in the previous bivariate analysis and literature review, a multi-level logistic model is used to evaluate their simultaneous effect on the coverage of individual basic WASH services (Water, Sanitation, and Hygiene). For multi-level analysis, the age of the household head is used as a continuous predictor, unlike categorical, as is done in bivariate analysis, to avoid incorporating more variables in the model. In the multi-level logit model, units at the lower level (level-1) are households that are nested within units at higher levels-country and region (42 countries at level 2 and 6 regions at level 3). The regression result in terms of log odds with 95 percent confidence interval (CI) is reported in Figure 6. Urban households were 1.9 and 1.2 times more likely to access basic drinking water and hygiene facilities than rural households. In contrast, the coverage of basic sanitation facilities was 18 percent lesser among urban dwellers compared to rural dwellers.
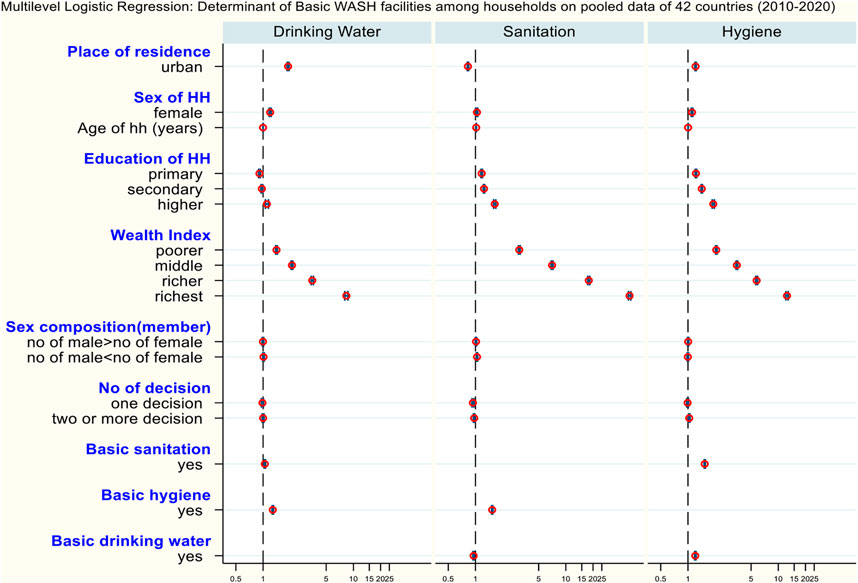
FIGURE 6. Multi-level Logistics determinants of Basic WASH facilities among households in pooled data of 42 countries (2010–2020).
Female-headed households were more likely to access basic WASH services compared to their male counterparts. Notably, the chance of using basic drinking water, sanitation, and hygiene services was 19 percent, 3 percent, and 11 percent higher among female-headed households than male-headed households. The multi-level models show that the odds of accessing basic drinking water and sanitation services increased significantly with the age of the household head. The household head’s education level seems to be an influential factor in regulating the coverage of basic WASH services; the direction of causality indicates a monotonic increase in the coverage of basic WASH services as the education of the household head increases. Households with highly educated household heads were 10, 63, and 91 percent more likely to have access to drinking water, sanitation, and hygiene than households with illiterate household heads.
It is evident from Figure 6 that the wealth index comes out as a significant correlate of basic WASH service use. Higher wealth quantile leads to higher odds of using basic WASH services. The richest households had 8, 50, and 12 times higher likelihood of having improved drinking water, sanitation, and hygiene facility compared to the poorest households. The sex composition of households did not appear to be a significant factor in the use of improved WASH services except for sanitation facilities. Households with more women than men show a slightly higher likelihood of accessing basic sanitation facilities (about 3%) than those households with equal members of both sexes. Women’s decision-making power is insignificant for the odds of using basic drinking water services. In contrast, households with empowered women (who took all three decisions) had 1.03 times higher likelihood of using basic hygiene facilities than households with women with no decision-making power. Unlike this, the inverse association is manifested between the decision-making power and the use of basic sanitation facilities.
Household likelihood of usage of any basic WASH component has been significantly affected by practice of the remaining two facilities. Households with basic drinking water sources were 20 percent more likely to practice basic hygiene services, whereas the likelihood of using basic sanitation facilities was 5 percent lesser. Likewise, the odds of having basic drinking water and hygiene facilities were 1.04 and 1.53 times higher among households with basic sanitation facilities than their counterparts. Households with basic hygiene services were 53 percent and 28 percent more likely to use basic drinking water and sanitation services compared to households with unimproved or no hand-washing facilities.
The random effect model is used to measure the unobserved heterogeneity present in the data, and the computed variations at both country and region levels in terms of Variance (var) are given in Figure 6. The random effects are significant at the country level, suggesting considerable heterogeneity between countries in access to basic sanitation and hygiene services, which strongly indicates the presence of some unobserved factors working at the country level affecting the coverage of basic WASH practice. There may be unobserved components related to the coverage of basic WASH facilities, such as availability of improved toilet/hygiene facilities, quality of the facilities, accessibility to facilities, as well as social and behavioural development at the country level, which jointly affect the use of basic WASH services. Lastly, the significant value of the likelihood ratio test confirms that the model is adequately fitted.
3.4 Multi-level regression analysis by country
This study also performed a multi-level logistic model separately for 42 countries for different WASH practices (Water, Sanitation, and Hygiene), and the summarized result is presented in Table 2, while the detail result by country is presented in Supplementary Appendix 3; Supplementary Tables S1C–S45C.
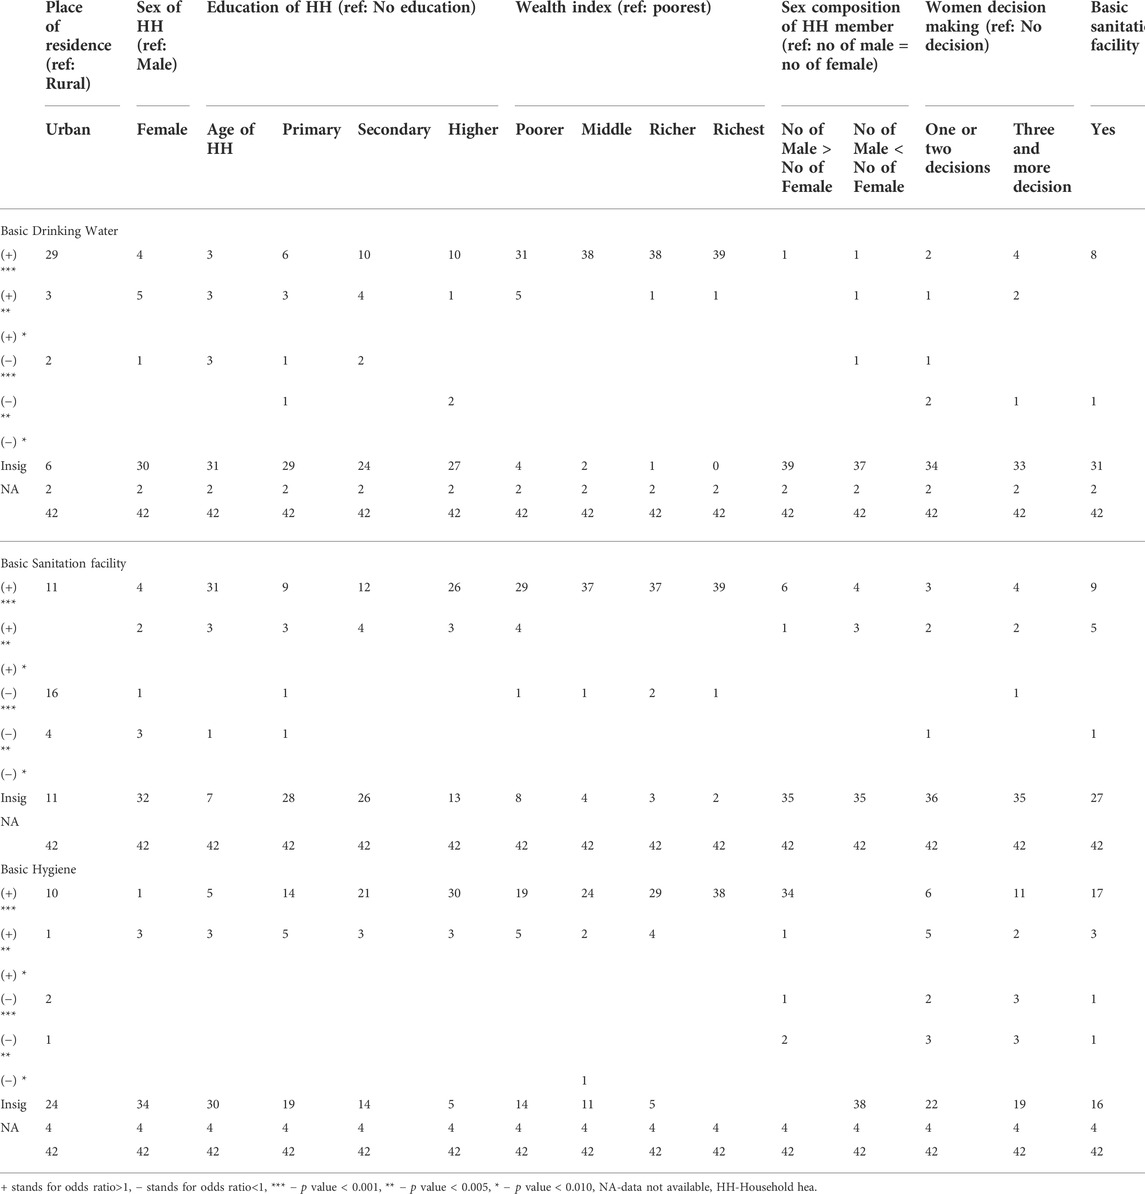
TABLE 2. Multi-level Logistic Regression: Determinant of coverage of Basic Drinking Water facility among households of 42 selected countries, 2010–2020.
For basic drinking facilities, wealth status emerges as the most significant driver in most countries, followed by the place of residence (urban), other wash facilities, and the household head’s education level. Of 42 countries, 402 countries show that households with higher economic status are more likely to adopt basic drinking water, and in 323 countries, households in urban areas were more likely to use basic drinking water. The female head dummy was significant and positive only in 94 countries for the adoption of basic drinking facilities. Compared to the illiterate, the household with primary, secondary, and higher education was positive and significant in 9, 14, and 11 countries.
For basic sanitation facilities also, the wealth status emerges as the most significant driver in the majority of the countries, followed by the age of the household, other wash facilities, the level of education of the household head, and the place of residence (urban). In over 37 countries, more affluent households are more likely to use basic sanitation facilities. Compared to the illiterate, the household with primary, secondary, and higher education was positive and significant for basic sanitation practices in 12, 16, and 29 countries. The age of the household head is positive and significantly related to basic sanitation facilities in 34 countries, highlighting the fact that elderly households are more likely to use basic sanitation facilities. We also noted a positive and significant relationship between a basic sanitation facility and a basic hygiene facility.
For basic hygiene, wealth status emerges as the most significant driver in the majority of the countries, followed by gender composition, other wash facilities, the level of education of the household head, the place of residence (urban), and the women’s decision-making power.
4 Discussion
The current work is an effort to analyze the reach of basic WASH facilities in developing countries and the factor influencing its adoption. Using aggregated data from forty-two developing countries from different regions allowed us to conduct a comparative study that further delineates the mechanisms that explain variation in the practice of basic WASH services. The comparable quantitative indicators computed through advance statistical techniques have the potential to exploit spatial variation that gives credence to the value of multi-country studies. In addition, hierarchical models were used to identify a broad array of elements located on different levels of the WASH model (i.e., household, socioeconomic, behavioural, regional) that affect basic WASH practices. Both national and sub-national comparisons and further multi-level models have moved knowledge forward at various levels of inquiry for the coverage of water, sanitation, and hygiene services.
This study is the first such application of the multi-level regression technique on pooled cross-sectional surveys to gain insight into prevalence as well as covariates of practicing basic WASH services in different regional settings. The advantage of this methodology over a single model is its hierarchical design which enables the proper investigation of the effects of all covariates measured at country and regional levels on the response variable, i.e., coverage of basic WASH services. Notably, the significant random effects suggest the existence of dependencies between household observations because instead of using simple random sampling, the DHS data is based on multi-stage cluster sampling from geographical areas. The significant variation at the global and national levels suggests that geographical disparities surpass the socioeconomic and demographic inequalities in access to basic WASH services (World Health Organization, 2021).
A multitude of studies advocates the importance of basic WASH services in safeguarding human health (Armah et al., 2018; Okurut et al., 2015). We used the JMP ladder to analyze the coverage of basic WASH services in forty-two countries. The result of this paper favour variation present in the access to individual WASH components-drinking water, sanitation, and hygiene. For instance, the prevalence of basic drinking water facilities at the household level was 83 percent, whereas the prevalence of sanitation and hygiene facilities was 48 percent and 56 percent. Conspicuously, this variation was clearly visible at the regional and national levels. This finding suggests that only 64 percent of households in sampled SSA countries had access to basic drinking water facilities, which is lower than the MDG figure of 68 percent reported in 2015 (UN, 2015). The difference may be attributed to the number of countries included in the analysis. The situation is most critical in Chad and Ethiopia, where about half of the households use unimproved or surface water sources (Zerbo et al., 2021). Unlike SSA, in South and Southeast Asian countries, more than 90 percent of households had access to basic drinking water facilities, which increased from 73 percent since 1990, however still 134 million people do not have access to improved water facilities, and it is estimated that almost 68 to 84 percent of water sources are contaminated (Unicef, 2016). Switching to the definition of basic services from improved ones has changed the scenario completely. For instance, previous studies set on SSA countries indicate that more than half of the households had access to improved sanitation facilities, though the offered prevalence had a wide variation across countries (Armah et al., 2018; Pullan et al., 2014; Yu et al., 2014) whereas our findings revealed that only 30 percent of households ranging from 6 percent to 57 percent, used improved sanitation facility which was not shared with any other households.
Most African and South Asian countries are still practicing open defecation, which is considered as a major cause of infectious diseases and mortality among children. The much argued reason for poor sanitation is the high urbanization rate without a similar increase in income. The level of per capita income does not accompany the urbanization rate, and it leads to an increase in the urban poor population (World Bank Group, 2015). According to UNDESA (2014), with more than 50 percent urbanization rate, Africa’s urban population is projected to reach 1.2 billion by 2050, which is a cause of concern. According to Marx et al. (2013), in SSA countries, the slum population is growing by 4.5 percent annually and is expected to double in the next 15 years. Adding to this, a study by Ndikumana and Pickbourn (2017) in SSA and Arias Granada et al. (2020) in Bangladesh has shown that urban poor are less likely to access improved WASH services. Some studies have also mentioned that the lack of improved sanitation facilities forces the urban poor to use polythene bags and/or defecate in nearby open stream drains or natural water sources, which leads to severe environmental contamination and disease-related hazards (Isunju et al., 2011; Konteh, 2009; Cheng et al., 2018).
In sum, SSA countries may lose their momentum on the coverage of basic WASH indicators and may not achieve SDGs goals if the comprehensive WASH approach is not adopted, i.e., ensure universal access to basic WASH facilities, particularly to the rural poor households. On the contrary, basic sanitation and hygiene coverage estimates were very high in Western and Central Asian countries, with almost zero open defecation; these countries set a roadmap for others to achieve universal access to basic sanitation facilities. Although, the literature on access to basic WASH services in development studies is very scanty and mostly focused on African and south Asian countries. Further, a detail examination of policies, behavioural shifts, and interventions are needed to understand the achievement of western and central Asian countries.
Socioeconomic dimensions have an overarching influence on access to WASH services, and the effects are not linear as expected. The selected covariates–dwelling setting, age, sex and education of household head, and household wealth, show significant association with the coverage of basic WASH services, separately computed for each component. The patterns are fairly consistent, with varying intensities in different countries. Our results suggest that affluent households have higher coverage of basic WASH facilities; a positive association was established between the wealth index and access to WASH facilities. This finding shows that access to basic drinking water, sanitation, and hygiene is more concentrated among rich households than poorer ones. This relationship offers concordance with an earlier study carried out in Cambodia, Ghana, Nepal, and some of the SSA countries (Mulenga et al., 2017; Tuyet-Hanh et al., 2016; Yang et al., 2013; Lawrence et al., 2002). Place of residence (urban versus rural) emerged as another influential covariate for WASH coverage. Finding reveals that rural households were less likely to access basic drinking water and hygiene facilities compared to urban households, and this finding is in agreement with several other studies (Tuyet-Hanh et al., 2016; Yang et al., 2013; World Health Organization, 2021). Further, some studies have found within rural, socioeconomic development influences sanitary toilet penetration (Li et al., 2022). In terms of the household head’s education, an insignificant relationship between the education level and odds of having basic drinking water facilities is unexpected and inconsistent with a previous study conducted by Irianti et al., 2016.
Combining the above two major findings raises two fundamental issues-economic and spatial access. Spatially, rural areas have lesser knowledge, advancement, and access to basic needs. There is a need for a Knowledge, Access, and Practice (KAP) approach to increase the coverage of basic drinking water and sanitation services in rural areas. Along with access to services, there is a need for behavioral change interventions to inculcate the habit of hand-washing and better sanitation. Economically, poorer households are not able to bear the cost of improved sanitation and drinking water services. This finding could be an important precursor for the policymakers to introduce future WASH interventions with some solutions to the issues associated with socially deprived strata.
Furthermore, the study also unraveled that female-headed households had higher odds of using basic WASH services than male-headed households. In most households, women are solely responsible for all household chores, such as fetching water, cleaning toilets, and managing hygiene services (Gomez M et al., 2019). As the welfare of women is directly connected with WASH services, the female head focuses more on access to WASH than its counterparts, i.e., the male head. This finding is consistent with Mulenga et al. (2017) and Osei et al. (2015). A similar explanation can justify the positive correlation between women’s decision-making power and the use of basic sanitation facilities. Education of household heads depicts a significant and positive relationship with the use of basic WASH services, which is in concurrence with several studies conducted in developing countries (Abubakar, 2017; Okurut et al., 2015; Adams et al., 2016). This result advocates that education increases the use of WASH facilities through better awareness of the benefit of using improved WASH facilities. The study also suggests robust interlinkages of all three components of WASH. The finding shows that households with coverage of one basic WASH service had higher access to the other two WASH components. It may be attributed to the fact that exposure to any improved facility encourages people to use other WASH facilities too. Having a better facility may increase the knowledge about the respective benefit of these services. Previous studies Kema et al. (2012), Abubakar (2017), and Gomez et al. (2019) conclude that awareness about the benefit of improved WASH facilities over health and development increases the likelihood of having access to improved WASH services.
5 Conclusion
By inspecting a connection between access to basic WASH services with selected household-level indicators, this study confirms the importance of these covariates–socioeconomic status, sex, age, and education of household heads, and women empowerment in the practice of improved WASH facilities. As wealth (economic status) has emerged as an important driver of the adoption of WASH facilities, it highlights the affordability aspect. Therefore, the government-supported sanitation program should focus on poor households. Analysis shows that rural households are more deprived of improved WASH facilities, the sanitation program should make an effort to scale WASH facilities in rural areas. However, the urban poor also deserves the attention of the sanitation program. As women are more concerned about the well-being of the family and children, women could play an important role in scaling improved WASH facilities.
It is worth noting that the use of WASH services could increase by improving awareness about the impact of safe sanitation, hygiene, and water supply on human development as well as providing opportunities to take advantage of these services through education and improvement of residential areas. The region with high urbanization without the same pace of economic growth may increase the slum population in urban areas. This suggests that robust policy interventions are required to tackle the urbanization issues by investing in housing, economy, and infrastructure. The collective efforts of different sectors, e.g., government, non-government and private sectors, are needed to increase access to basic water, sanitation, and hygiene facilities, giving extra attention to the underprivileged populations. The national and sub-national analysis shed light on the inequalities that exist in the coverage of basic WASH facilities at the cluster level. A common intervention will not be favorable for all countries in a region. Formulating more decentralized schemes is necessary to tackle community and country-specific issues. Policymakers and demographers need to develop a plan for sustainable WASH solutions for LMICs and spend more effort there to achieve the SDG goals. The empirical method employed here offers a base that can be expanded in different research areas to test the hypothesis using a repeated cross-sectional survey. This multi-level approach can confer significant resource efficiency to future multi-country studies.
Besides interesting findings, this study also has certain limitations. Most of these are related to the questionnaire and data reporting. DHS record all the WASH-related questions at the household level instead of the individual level, which may introduce underestimation in the inequality of access to basic WASH services. Our analysis ignores the intra-household inequality, i.e., the disparities in access to WASH services among the members in the same households are not covered in the study. Another limitation is the retrospective recall bias present in measuring some of the information (like age, education, etc.) We believe that this bias is random and somewhat mitigated with the use of average proportions. Finally, the survey year is different for different countries; the majority of participating countries are not measured at the same time, which imposes limitations on the cross-national comparisons.
Data availability statement
Publicly available datasets were analyzed in this study. This data can be found here: https://dhsprogram.com/.
Ethics statement
Ethical review and approval was not required for the study on human participants in accordance with the local legislation and institutional requirements. Written informed consent from the participants was not required to participate in this study in accordance with the national legislation and the institutional requirements.
Author contributions
AS: Contributed to conceptualization of the research idea, data cleaning, analysis, write-up, editing, and structuring DR: Contributed to conceptualization of the research idea, data cleaning, analysis, write-up, editing, and structuring. TS: Contributed to conceptualization of the research idea, write-up, editing, and structuring.
Acknowledgments
We would like to thank The Demographic and Health Surveys (DHS) Program for providing access to the data and Asian Development Bank Institute (ADBI) for supporting this research.
Conflict of interest
The authors declare that the research was conducted in the absence of any commercial or financial relationships that could be construed as a potential conflict of interest.
Publisher’s note
All claims expressed in this article are solely those of the authors and do not necessarily represent those of their affiliated organizations, or those of the publisher, the editors and the reviewers. Any product that may be evaluated in this article, or claim that may be made by its manufacturer, is not guaranteed or endorsed by the publisher.
Author disclaimer
This map does not imply the expression of any opinions of the authors concerning the boundaries. The views expressed here are those of the authors and do not necessarily reflect the views of the authors’ institutions, and the usual disclaimer applies.
Supplementary material
The Supplementary Material showing the descriptive and econometric analysis for each countries for this article can be found online at: https://www.frontiersin.org/articles/10.3389/fenvs.2022.1013657/full#supplementary-material
Footnotes
1The Country with survey year are given as follows: Afghanistan: 2015, Bangladesh: 2017–18, Cambodia: 2014, India: 2015–16, Indonesia: 2017, Maldives: 2016–17, Nepal: 2016, Pakistan: 2017–18, Philippines: 2017, Timor-Leste: 2016, Papua New Guinea: 2016–17, Columbia: 2015–16, Guatemala: 2014–15, Haiti: 2016–17, Tajikistan: 2017, Albania: 2017–18, Armenia: 2015–16, Jordan: 2017–18, Turkey: 2013, Angola: 2015–16, Benin: 2017–18, Burkina Faso: 2010, Burundi: 2016–17, Cameroon: 2018–19, Chad: 2014–15:, Ethiopia: 2016, Gambia: 2019–20, Ghana: 2014, Guinea: 2018, Kenya:2 020, Liberia:2019–20, Malawi: 2015–16, Mali: 2018, Nigeria: 2018, Rwanda: 2019–20, Senegal: 2019, Sierra Leone: 2019, South Africa: 2016, Tanzania: 2015–16, Uganda: 2016, Zambia: 2018, Zimbabwe: 2015.
2Armenia and Bangladesh was not included in the analysis for access to drinking water due to lack of data.
3Afghanistan, Cambodia, India, Indonesia, Pakistan, Philippines, Timor leste, Papua New Guinea, Columbia, Guatemala, Haiti, Tajikistan, Albania, Jordan, Turkey, Angola, Benin, Burkin Faso, Burundi, Cameroon, Chad, Ethiopia, Guinea, Kenya, Liberia, Malawi, Nigeria, Rwanda, Sierra Leone, South Africa, Tanzania, Uganda, Zambia. It was negative and significant for Nepal and Zimbabwe.
4It was positive and significant for Cambodia, India, Burkin Faso, Cameroon, Gambia, Rwanda, Sierra Leone, Uganda, Zimbabwe. It was negative and significant at 1% in case of Pakistan.
References
Abubakar, I. R. (2017). Access to sanitation facilities among Nigerian households: Determinants and sustainability implications. Sustainability 9 (4), 547. doi:10.3390/su9040547
Adams, E. A., Boateng, G. O., and Amoyaw, J. A. (2016). Socioeconomic and demographic predictors of potable water and sanitation access in Ghana. Soc. Indic. Res. 126 (2), 673–687. doi:10.1007/s11205-015-0912-y
Aiello, A. E., Coulborn, R. M., Perez, V., and Larson, E. L. (2008). Effect of hand hygiene on infectious disease risk in the community setting: A meta-analysis. Am. J. Public Health 98 (8), 1372–1381. doi:10.2105/ajph.2007.124610
Arias Granada, Y., Haque, S. S., Joseph, G., and Yanez Pagans, M. (2020). Water and sanitation in dhaka slums: Access, quality, and informality in service provision. Water Int. 45 (7-8), 791–811. doi:10.1080/02508060.2020.1786878
Armah, F. A., Ekumah, B., Yawson, D. O., Odoi, J. O., Afitiri, A. R., and Nyieku, F. E. (2018). Access to improved water and sanitation in sub-Saharan Africa in a quarter century. Heliyon 4 (11), e00931. doi:10.1016/j.heliyon.2018.e00931
Benova, L., Cumming, O., and Campbell, O. M. (2014). Systematic review and meta‐analysis: Association between water and sanitation environment and maternal mortality. Trop. Med. Int. Health 19 (4), 368–387. doi:10.1111/tmi.12275
Cairncross, S., Hunt, C., Boisson, S., Bostoen, K., Curtis, V., Fung, I. C., et al. (2010). Water, sanitation and hygiene for the prevention of diarrhoea. Int. J. Epidemiol. 39, i193–i205. doi:10.1093/ije/dyq035
Cheng, S., Li, Z., Uddin, S. M. N., Mang, H. P., Zhou, X., Zhang, J., et al. (2018). Toilet revolution in China. J. Environ. Manag. 216, 347–356. doi:10.1016/j.jenvman.2017.09.043
Clasen, T., Schmidt, W. P., Rabie, T., Roberts, I., and Cairncross, S. (2007). Interventions to improve water quality for preventing diarrhoea: Systematic review and meta-analysis. Bmj 334 (7597), 782. doi:10.1136/bmj.39118.489931.be
Fewtrell, L., Kaufmann, R. B., Kay, D., Enanoria, W., Haller, L., and Colford, J. M. (2005). Water, sanitation, and hygiene interventions to reduce diarrhoea in less developed countries: A systematic review and meta-analysis. Lancet Infect. Dis. 5 (1), 42–52. doi:10.1016/s1473-3099(04)01253-8
Global Nutrition Report (2021). The state of global nutrition. Bristol, UK: Development Initiatives.
Goldstein, H. (2011). Multi-level statistical models. New Jersey, United States: John Wiley & Sons. doi:10.1002/9780470973394
Gomez, M., Perdiguero, J., and Sanz, A. (2019). Socioeconomic factors affecting water access in rural areas of low and middle income countries. Water 11 (2), 202. doi:10.3390/w11020202
Gould, I. M. (2010). Alexander Gordon, puerperal sepsis, and modern theories of infection control—Semmelweis in perspective. Lancet Infect. Dis. 10 (4), 275–278. doi:10.1016/s1473-3099(09)70304-4
ICF International (2012). Demographic and health survey sampling and household listing manual. MEASURE DHS. Calverton, Maryland, U.S.A. ICF International.
Irianti, S., Prasetyoputra, P., and Sasimartoyo, T. P. (2016). Determinants of household drinking-water source in Indonesia: An analysis of the 2007 Indonesian family life survey. Cogent Med. 3 (1), 1151143. doi:10.1080/2331205x.2016.1151143
Isunju, J. B., Schwartz, K., Schouten, M. A., Johnson, W. P., and van Dijk, M. P. (2011). Socioeconomic aspects of improved sanitation in slums: A review. Public health 125 (6), 368–376. doi:10.1016/j.puhe.2011.03.008
Kema, K., Semali, I., Mkuwa, S., Kagonji, I., Temu, F., Ilako, F., et al. (2012). Factors affecting the utilisation of improved ventilated latrines among communities in Mtwara Rural District, Tanzania. Pan Afr. Med. J. 13 (Suppl 1), 4. Epub December 25, 2012.
Konteh, F. H. (2009). Urban sanitation and health in the developing world: Reminiscing the nineteenth century industrial nations. Health Place 15 (1), 69–78. doi:10.1016/j.healthplace.2008.02.003
Lawrence, P. R., Meigh, J., and Sullivan, C. (2002). The water poverty index: An international comparison. Keele, Straffordshire, UK: Department of Economics, Keele University.
Li, Y., Cheng, S., Cui, J., Gao, M., Li, Z., Wang, L., et al. (2022). Mining of the association rules between socio-economic development indicators and rural harmless sanitary toilet penetration rate to inform sanitation improvement in China. Front. Environ. Sci. 10, 74. doi:10.3389/fenvs.2022.817655
Marx, B., Thomas, S., and Tavneet, S. (2013). The economics of slums in the developing world. J. Econ. Perspect. 27 (4), 187–210.
Mulenga, J. N., Bwalya, B. B., and Chishimba, K. K. (2017). Determinants and inequalities in access to improved water sources and sanitation among the Zambian households. Int. J. Dev. Sustain. 6 (8), 746–762.
Nagabhatla, N., Avellan, T., Pouramin, P., Qadir, M., Mehta, P., Payne, J., et al. (2019). UNESCO world water assessment programme (WWAP). The united nations world water development report 2019: Leaving No one behind. Paris: UNESCO, 44–57.
Nalule, Y., Buxton, H., Ir, P., Leang, S., Macintyre, A., Pors, P., et al. (2021). Hand hygiene during facility-based childbirth in Cambodia: A theory-driven, mixed-methods observational study. BMC Pregnancy Childbirth 21 (1), 429. doi:10.1186/s12884-021-03901-7
Ndikumana, L., and Pickbourn, L. (2017). The impact of foreign aid allocation on access to social services in sub-Saharan Africa: The case of water and sanitation. World Dev. 90, 104–114. doi:10.1016/j.worlddev.2016.09.001
Okurut, K., Kulabako, R. N., Abbott, P., Adogo, J. M., Chenoweth, J., Pedley, S., et al. (2015). Access to improved sanitation facilities in low-income informal settlements of East African cities. J. water, sanitation Hyg. Dev. 5 (1), 89–99. doi:10.2166/washdev.2014.029
Oloruntoba, E. O., Folarin, T. B., and Ayede, A. I. (2014). Hygiene and sanitation risk factors of diarrhoeal disease among under-five children in Ibadan, Nigeria. Afr. Health Sci. 14 (4), 1001–1011. doi:10.4314/ahs.v14i4.32
Onda, K., LoBuglio, J., and Bartram, J. (2012). Global access to safe water: Accounting for water quality and the resulting impact on MDG progress. Int. J. Environ. Res. Public Health 9 (3), 880–894. doi:10.3390/ijerph9030880
Ordinioha, B., and Owhondah, G. (2008). Sanitation facilities and hygiene practices in a semi-urban community in Rivers State, south-south Nigeria. Niger. Health J. 8 (1–2), 10–15.
Osei, L., Amoyaw, J., Boateng, G. O., Boamah, S., and Luginaah, I. (2015). The paradox of water accessibility: Understanding the temporal and spatial dimensions of access to improved water sources in Rwanda. J. Water, Sanitation Hyg. Dev. 5 (4), 553–564. doi:10.2166/washdev.2015.029
Prüss‐Ustün, A., Bartram, J., Clasen, T., Colford, J. M., Cumming, O., Curtis, V., et al. (2014). Burden of disease from inadequate water, sanitation and hygiene in low‐and middle‐income settings: A retrospective analysis of data from 145 countries. Trop. Med. Int. Health 19 (8), 894–905. doi:10.1111/tmi.12329
Pullan, R. L., Freeman, M. C., Gething, P. W., and Brooker, S. J. (2014). Geographical inequalities in use of improved drinking water supply and sanitation across sub-saharan Africa: Mapping and spatial analysis of cross-sectional survey data. PLoS Med. 11 (4), e1001626. doi:10.1371/journal.pmed.1001626
Raudenbush, S. W., and Bryk, A. S. (2002). Hierarchical linear models: Applications and data analysis methods, Vol. 1. California, United States: SAGE Publications.
Semmelweis, I., and Semmelweis, I. F. (1983). The etiology, concept, and prophylaxis of childbed fever. Madison, Wisconsin: Univ of Wisconsin Press.
Snijders, T. A., and Bosker, R. J. (2011). Multilevel analysis: An introduction to basic and advanced multilevel modeling. California, United States: SAGE Publications Ltd. Available at: https://us.sagepub.com/en-us/nam/multilevel-analysis/book234191.
Tincani, L., Ross, I., Zaman, R., Burr, P., Mujica, A., and Evans, B. E. (2015). Regional assessment of the operational sustainability of water and sanitation services in Sub-Saharan Africa. Report. Oxford, UK: Oxford Policy Management.
Tuyet-Hanh, T. T., Lee, J. K., Oh, J., Van Minh, H., Ou Lee, C., Hoan, L. T., et al. (2016). Household trends in access to improved water sources and sanitation facilities in vietnam and associated factors: Findings from the multiple indicator cluster surveys, 2000–2011. Glob. Health Action 9 (1), 29434. doi:10.3402/gha.v9.29434
UN Assembly (2010). Resolution adopted by the general assembly on 28 July 2010: 64/292. The human right to water and sanitation. Available at: https://www.un.org/en/ga/search/view_doc.asp (Accessed July 20, 2022).
UNDESA (2014). World urbanization prospects, the 2011 revision. United Nations Secretariat: Population Division, Department of Economic and Social Affairs.
UNICEF (2022). Estimates of child cause of death, diarrhea. [Data file]. Available from: https://data.unicef.org/topic/child-health/diarrhoeal-disease/ (Accessed July, 2022).
UNICEF (2016). Strategy for water, sanitation and hygiene 2016–2030. New York, United States: Programme Division, United Nations International Children’s Emergency Fund.
WHO (2005). Health through safe drinking water and basic sanitation. Geneva Switzerland: World Health Organization.
Wolfe, M., Kaur, M., Yates, T., Woodin, M., and Lantagne, D. (2018). A systematic review and meta-analysis of the association between water, sanitation, and hygiene exposures and cholera in case–control studies. Am. J. Trop. Med. Hyg. 99 (2), 534–545. doi:10.4269/ajtmh.17-0897
World Bank Group (2015). Stocktaking of the housing sector in sub-saharan Africa: Challenges and Opportunities. Washington, DC: The World Bank. Available at: https://openknowledge.worldbank.org/handle/10986/23358
World Health Organization (2015). Improving nutrition outcomes with better water, sanitation and hygiene: Practical solutions for policies and programmes. Geneva, Switzerland: WHO Press, World Health Organization.
World Health Organization (WHO)/United Nations Childrens’ Fund (UNICEF) (2021). Progress on household drinking water, sanitation and hygiene 2000–2020: Five years into the SDGs. Situation report. Geneva: World Health Organization (WHO) and the United Nations Childrens’ Fund (UNICEF).
WHO/UNICEF Joint Water Supply, and Sanitation Monitoring Programme (2015). Progress on sanitation and drinking water: 2015 update and MDG assessment. World Health Organization.
Yang, H., Bain, R., Bartram, J., Gundry, S., Pedley, S., and Wright, J. (2013). Water safety and inequality in access to drinking-water between rich and poor households. Environ. Sci. Technol. 47, 1222–1230. doi:10.1021/es303345p
Yu, W., Bain, R. E., Mansour, S., and Wright, J. A. (2014). A cross-sectional ecological study of spatial scale and geographic inequality in access to drinking-water and sanitation. Int. J. Equity Health 13 (1), 113–115. doi:10.1186/s12939-014-0113-3
Keywords: WASH services, developing countries, basic sanitation facilities, basic hygiene facilities, wealth, and education
Citation: Rahut DB, Singh A and Sonobe T (2022) WASH facilities prevalence and determinants: Evidence from 42 developing countries. Front. Environ. Sci. 10:1013657. doi: 10.3389/fenvs.2022.1013657
Received: 07 August 2022; Accepted: 11 October 2022;
Published: 04 November 2022.
Edited by:
Shikun Cheng, University of Science and Technology Beijing, ChinaReviewed by:
Zhe Zhan, University of Leeds, United KingdomHongxing Li, Chinese Center for Disease Control and Prevention, China
Ihtiyor Bobojonov, Leibniz Institute of Agricultural Development in Transition Economies (LG), Germany
Copyright © 2022 Rahut, Singh and Sonobe. This is an open-access article distributed under the terms of the Creative Commons Attribution License (CC BY). The use, distribution or reproduction in other forums is permitted, provided the original author(s) and the copyright owner(s) are credited and that the original publication in this journal is cited, in accordance with accepted academic practice. No use, distribution or reproduction is permitted which does not comply with these terms.
*Correspondence: Dil B. Rahut, ZHJhaHV0QGFkYmkub3Jn