 Lan Lan1
 Yinshan Xu
95% of researchers rate our articles as excellent or good
Learn more about the work of our research integrity team to safeguard the quality of each article we publish.
Find out more
ORIGINAL RESEARCH article
Front. Environ. Sci. , 19 September 2022
Sec. Environmental Informatics and Remote Sensing
Volume 10 - 2022 | https://doi.org/10.3389/fenvs.2022.1013583
This article is part of the Research Topic Artificial Intelligence Methods for Water-Environment-Food-Energy Nexus View all 6 articles
The main objective for the Three Gorges Reservoir is to help control floods and to protect the Jingjiang and Chenglingji regions in the middle reach of the Yangtze River. Hydrological measurements have demonstrated that the character of flood propagation in the Jingjiang Reach has changed significantly since the Three Gorges Reservoir became operational, meaning that flood control management must be modified accordingly. To explore the effective flood control management, a hydraulic model was developed to simulate the potential causes and impacts. For a natural flood with gradually varying discharge propagated as a diffusive wave, the celerity downside the dam fasted due to the change of the dominant property of the flood wave. For a flood event controlled by a reservoir, the wave was propagated more quickly as a surge with rapidly varying discharge. The rating curve changed for flooding processes associated with a diffusive wave versus a surge event at a particular cross-section, which changed the flow capacity in the river channel. Observed flood events in 2016 and 2017 were also simulated in the hydraulic model using different management schemes, and the modified flood propagation trends along the lower river reach were analyzed. Lastly, from these simulations, we provide suggestions on how to optimize the operation of the Three Gorges Reservoir to control flood damage and protect the Jiangjiang Reach and Chenglingji areas more effectively.
With increasing global hydropower needs and exploitation of water resources (Li et al., 2015; Dias et al., 2018), great efforts have been made to optimize freshwater reservoir operations (Sangiorgio and Guariso, 2018). With im-pounding reservoirs, the water depth of the upper reaches becomes deeper than that of the reservoir area, and outflow from the reservoir can be changed rapidly, resulting in significant changes to flood propagation characteristics in the upper and lower reaches of the dam (He et al., 2015), which in turn affects the effectiveness of the flood control. To more effectively manage flood events, it is necessary to understand how flood wave propagation responds to changes in reservoir operation. In research on flood routing, hydraulic models that numerically solve the Saint-Venant equations have been most widely applied (Liu et al., 2018), either considering all or some of the terms of the momentum equation (Castro-Orgaz and Chanson 2017). However, simplified models may lead to significant errors once the magnitudes of different terms in the momentum equation vary widely.
The Yangtze River is the longest river in China with a length of 6,300 km and a drainage basin of 1.8 km2 × 106 km2, and the frequency of floods is high and carries high costs (Sun et al., 2017). The Three Gorges Reservoir (TGR) was initially designed for flood control, in-creasing the Jingjiang Reach’s flood control ability from a 10- to 100-years recurrence (Zheng 2016). The TGR is also the largest hydropower station in the world, with a capacity of 22.5 GW. After the regulation of the TGR, some of the inflow from a catchment of about 1 × 10⁶ km2 in the upper reaches of the Yangtze River was diverted to Dongting Lake through three out-falls on the Jingjiang Reach, and then re-injected into the Yangtze River in the Chenglingji area together with the inflow from the Lake (Dai et al., 2017). The amount of water that can be safely discharged into the Jingjiang reach is far less than the peak flood flow that may occur upstream. The Chenglingji area has a complex flood control issue that is caused by multiple flood sources, easy encounters, and the hydrological relationships in the river network around the Dongting Lake (Yin et al., 2007).
Due to the dangers posed by floods and the complicated relationship between rivers and lakes, flood control in Jingjiang Reach has always been considered an important issue. After the TGR and other reservoirs in the upper and middle reaches of the Yangtze River-were completed, the corresponding inflow and sediment conditions in Jingjiang Reach was changed significantly (Fang et al., 2012; Zhang et al., 2017), as well as the flood characteristics and channel scour and siltation. Previous investigations have shown that the relationship between rivers and lakes before the TGR was operational was mainly manifested as scouring in the Jingjiang Reach, siltation from Chenglingji to Hankou Reach, a decreasing flow and sediment diversion trend in three outfalls, siltation and atrophy of Dongting Lake, and a general decline in flood regulation capacity (Li et al., 2016). After the TGR was completed, the relationship between rivers and lakes has mainly manifested as an intensification of erosion in Jingjiang Reach, conversion from silting to flushing from Chenglingji to Hankou Reach, a sharp decrease of the flow and sediment diversion in three outfalls, and the conversion from silting to flushing of The Dongting lake area.
The influences of river and lake erosion and siltation on regional hydrology are a slow but continuously developing process. Flood control in the Chenglingji area is aimed at controlling water levels at the Lianhuatang station at the intersection of Dongting Lake and the Yangtze River, and the water exchange between rivers and lakes plays a crucial role (Chen 2014). The reservoir allows control of the outflow, allowing sharp increases or decreases in a short time. For example, when the “Eastern Star” Ship was dispatched from the TGR in 2015, the outflow decreased from 17,000 to 7,000 m3/s within 6 h. To control the largest flood in the Yangtze River in 2017, the outflow of the TGR decreased from 27,300 to 8,000 m3/s within 34 h. When the outflow changed rapidly in these situations, the flood wave in the channel downstream of the dam changed from continuous to discontinuous, and the corresponding propagation characteristics changed significantly.
While studying the effects of the above factors, He (2017) pointed out that sediment transport in Jingjiang Reach has changed from a quasi-equilibrium to sub-saturation regime since the impoundment of the TGR, as well as the vertical concentration profiles of suspended sediments. Zhang et al. (2017) pointed out that the downstream impact of the TGR has started to become apparent, observing a reduction in flood duration and dis-charge, and a significant reduction in sediment load. Although there was some increase in the downstream sediment load, the total amount did not exceed the pre-impoundment annual average. Yang et al. (2017) showed that for the same flow, the low water level decreased, the flood water level stayed constant, the lowest water level increased, and the highest water level decreased at the hydrological stations downstream of the dam. Xia et al. (2017) documented remarkable channel degradation that has occurred in the Jingjiang Reach since the TGR became operational, which has caused significant geomorphic adjustments including variations in bankfull discharge. Bankfull discharge is a key indicator of flood-discharge capacity, and responds to altered water and sediment conditions and local base-level changes. Cheng et al. (2016) introduced the surge wave theory as a preliminary mechanism explaining the shortened flood propagation time (i.e., time difference between the flood peak at the upstream and downstream sections) in the upper Jingjiang reach after the completion of the TGR.
The above studies analyzed the changes in river regime, rating curve, and flood propagation time downstream of the TGR, especially in the Jingjiang reach. However, these studies are not enough to support real-time forecasting and scheduling of the Three Gorges Reservoir. After the Three Gorges Reservoir starts to operate, under the influence of the gate control, compared with the natural flood process, the rate of change of the down-stream flood process is accelerated, and the continuous flood wave becomes a sharply changing flood wave, resulting in significant changes in flood characteristics such as flood propagation time. The Three Gorges Reservoir undertakes the task of flood control compensation scheduling for the Jingjiang River section and the Chenglingji area, and mastering the flood propagation characteristics is the basis for the flood control compensation schedule. This paper takes Three Gorges Reservoir, Dongting Lake area, and the Jingjiang River section as the research objects, explores the changes of flood propagation characteristics and their causes in Jingjiang River section after the completion of Three Gorges Reservoir through the measured data and the constructed hydraulics model, simulates and analyzes the response relationship between floods at main control stations and different scheduling schemes of Three Gorges Reservoir in Jingjiang River section, and provides technical support for the real-time scheduling of Three Gorges Reservoir.
This paper first used measured data to analyze the change of the rating curve in the main hydrological stations and flood propagation time. Then, we constructed a hydraulic model covering the river networks of Jingjiang and Dongting Lake and used the results to investigate the mechanisms responsible for these changes. Finally, the observed flood events in 2016 and 2017 were simulated under different regulation schemes to identify the optimal operations that would effectively control flooding and protect the vulnerable reaches near Shashi and Lianhuatang.
MIKE 11 (Thakur et al., 2016) is a widely used hydraulic model developed by the Danish Hydraulic Institute (DHI). The core of the model is the hydrodynamic (HD) module, which provides a choice of three different representations of flow: the dynamic wave which uses the full momentum equation including inertia forces, the diffusive wave which only models the bed friction, gravity force, and hydrostatic gradient terms in the momentum equation, and the kinematic wave which assumes that the flow is governed by a balance between the friction and gravity forces. The model uses the finite difference approach and a double sweep algorithm to solve the unsteady-state flow equations. Based on the hydraulics calculated by the HD module, secondary variables such as sediment transport or water quality can be further simulated in a modelled reach (Abebe et al., 2016).
Along the Yangtze River, the reach just downstream of the TGR is traditionally called the Jingjiang River, which has complex dynamics between the river and the lake. On the South bank of the reach, three rivers (Songzi, Hudu, and Ouchi, from West to East) emanate from Jingjiang, which is further divided into a tangled river network that ultimately drains into Dongting Lake. The lake also receives runoff from another four Rivers (Xiang River, Zi River, Yuan River, and Li River, from West to East). The lake outflow goes to the Yangtze River at Chenglingji Station. Several tributaries also join the mainstream in this section, the largest two being the Qing and Juzhang Rivers. Discharge gauges measure the runoff at these two rivers and the four branches of Dongting Lake.
The MIKE 11 model was built to include the river network described above, bounded as described in Figure 1. The Yichang hydrological station is located 44.8 km downstream of the TGR and represents the reservoir’s outflow. The upper boundary conditions of the model are the discharge from Yichang station (mainstream of the Yangtze River), Gaobazhou station (Qing River), Herong station (Juzhang River), Shimen station (Li River), Taoyuan station (Yuan River), Taojiang station (Zi River), Xiangtan station (Xiang River); while the lower boundary conditions are the rating curve of Luoshan Station (20 km downstream from the entrance of Dongting Lake). And the rating curve was highly impacted by the ration of discharge from Jingjiang and Dongting Lake, and the flood in Han River’s downside can make some difference. The model is a one-dimensional river generalization of the Dongting Lake area, divided into South Dongting Lake, East Dongting Lake and West Dongting Lake to set up virtual river cross-sections according to the proportion of lake storage so that the virtual river storage volume is consistent with the volume of the lake.
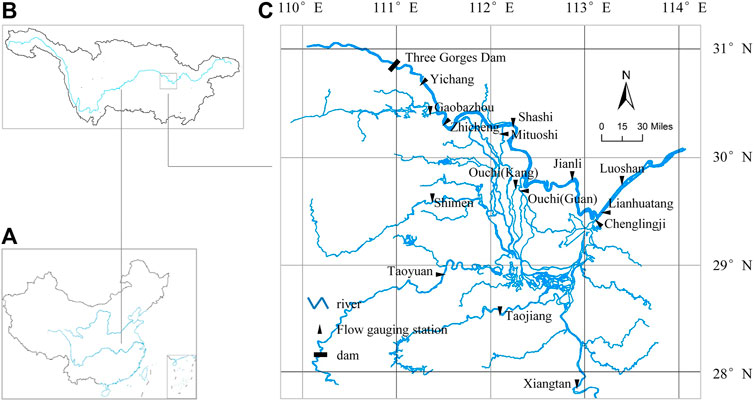
FIGURE 1. Drainage system of the Jingjiang Reach of the Yangtze River. (A) China, (B) the Yangtze River Basin, (C) Study area: the Three Gorges Reservoir and the Jingjiang Reach.
Most of the cross-sectional data used to set up the MIKE11 model was measured in 2016, while the rest was measured a few years earlier. The runoff generated was divided into 24 sub-basins and was simulated by the NAM model, which was linked to the model by a point or lateral resource according to the real joints (Doroszkiewicz et al., 2019). The outline of the overall model structure is shown in Figure 2.
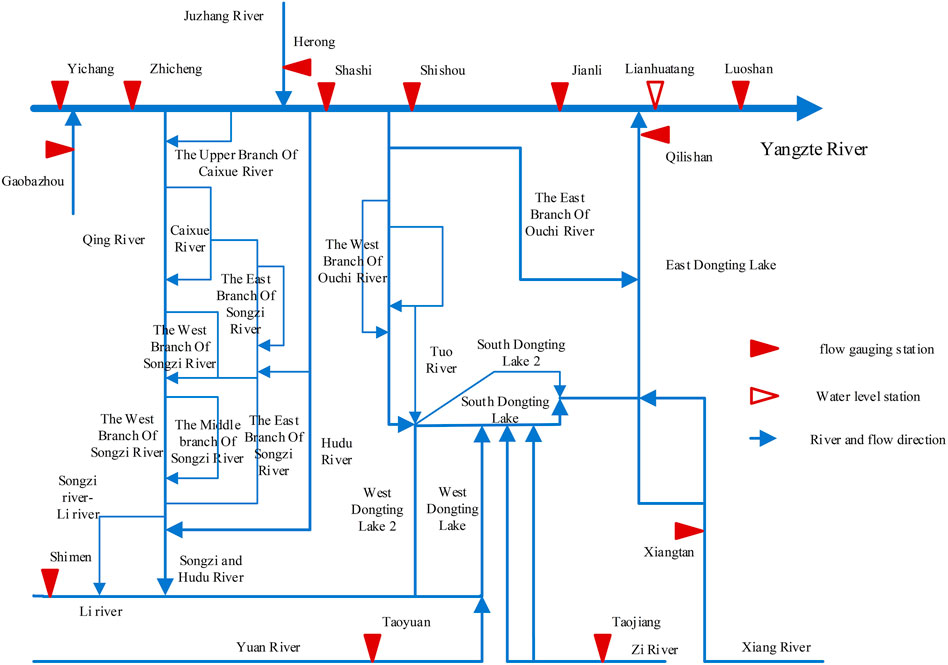
FIGURE 2. Outline of the MIKE11 hydraulic model for Jingjiang Reach.
There are four gauges along the mainstream of the Yangtze River (Zhicheng, Shashi, Shishou, and Jianli). The parameters of the model were calibrated based on the hydrological data observed at the four stations in 2016 and 2017, with special priority given to high flooding events that occurred during the wet season. The comparison between simulated and observed values in year 2017 is shown in Figure 3, and the crest error and Nash–Sutcliffe model efficiency coefficient (NSE) are listed in Table 1.
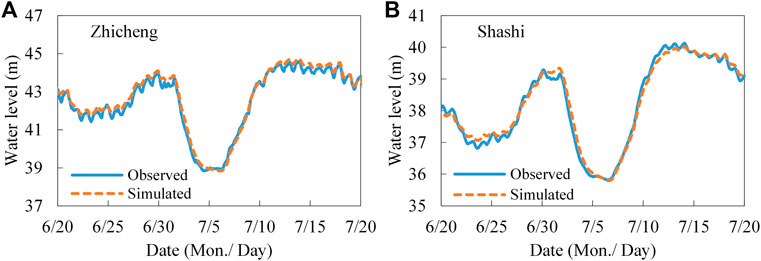
FIGURE 3. Simulated flood process in year 2017: (A) Zhicheng; (B) Shashi station.
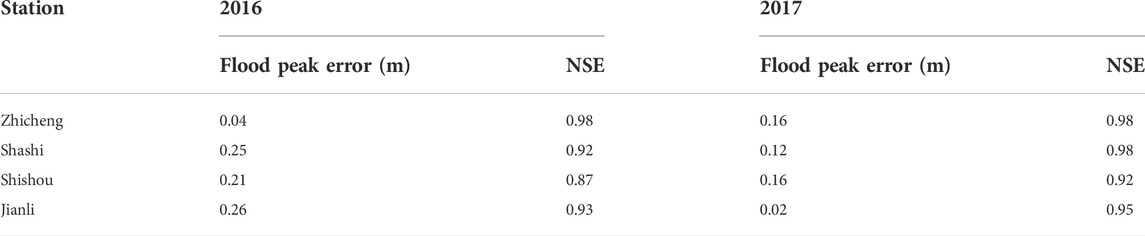
TABLE 1. Simulated results at the main stations in Jingjiang Reach.
Results in Figure 3 and Table 1 show that in general, the simulation was well-fitted to the observations, with NSE higher than 0.92 with a single exception (0.87 in Shishou in 2016), while the crest water level errors were less than 0.3 m.
From 20th June to 20th July in both years, there was serious flooding in the modeled area. By operating the TGR and many others in an integrated manner, the potential peak flow in the modeled reach was reduced. However, the crest water level at some gauges in the mainstream exceeded warning levels, including at Lianhuatang station, where Dongting Lake joins the Yangtze River. Detailed analysis of the reservoir during the flooding event in 2016 showed that the crest water level decreased by 0.8–1.7 m along the Jingjiang section, and by 1 m at the Lianhuatang section. Similarly, in the 2017 flood event, the crest water level reduced even more at the Lianhuatang section. Without the appropriate operation of these reservoirs, it would be inevitable to divide the excessive flood to the local water detain area, which would obviously cause high loss. The flooding in this reach showed unusual behavior when compared to natural flooding during reservoir operation, showing differing flood travel times, rating curves, and other hydraulic factors.
The MIKE 11 model built for this reach allows researchers and reservoir managers to fully study the new hydraulic behavior with different reservoirs in operation, and to modify existing guidelines to regulate the reservoir group and protect the area from flooding more efficiently.
Since 2008, the TGR has been operational, with the ability to impound water levels rising to 175 m. Since 2010, this ability has been fully tested again and again, as the area has experienced major flood events. To study the response of floods in Jingjiang to the operation of the TGR, flood propagation times representing natural events from 1992 to 2008 were compared with those representing reservoir regulation events from 2010 to 2017.
From the above table, it can be observed that when the TGR was put into operation, the flood propagation time from Yichang to Jianli decreased by a total of 12 h on average, with about 3 h in the Yichang-Zhicheng Reach, 5 h in the Zhicheng-Shashi Reach, and 4 h in the Shashi—Jianli Reach. However, downstream of Jianli, the propagation time showed very few changes.
The natural floods propagated normally along the river channel, mainly via Kinematic waves, diffusion waves, inertial waves, or dynamic waves. Kinematical and diffusion waves propagate downwards with a velocity of
For a discontinuous surge wave with rapidly varying flow (Cheng et al., 2016), the velocity
The derivation of this equation is based on the assumption of an instantaneous discharge jump superimposed on a steady flow, where A0 and v0 represent the cross-sectional area and average flow velocity of the early steady flow, respectively.
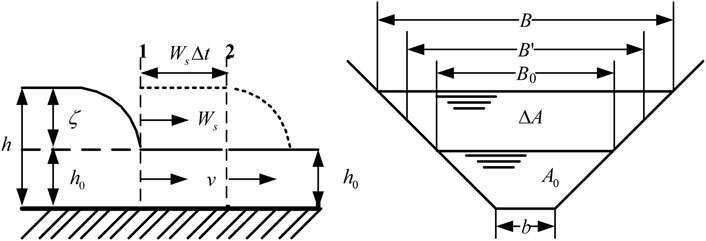
FIGURE 4. Delineation of surge propagation. (A0 represents the cross-sectional area of the early steady flow.
For a prismatic trapezoidal channel,
Normally, the velocity of the surge is faster than that from a kinematic wave and be-comes even faster with increasing surge height.
According to the observations in Table 2 and hydraulic factors computed for typical flooding events based on the above model, the velocity of natural floods varies from 1.0 to 2.0 u, meaning that they are routed as kinematic waves in Jingjiang Reach. When TGR became operational, the flood velocity from Yichang to Shashi Reach suggested a surge event, while velocities downstream of Jianli Reach indicated a kinematical wave no different from natural floods. From Shashi to Jianli Reach, the average velocity was between surge and kinematic waves, meaning that the surge transitioned to a kinematic wave in this section.
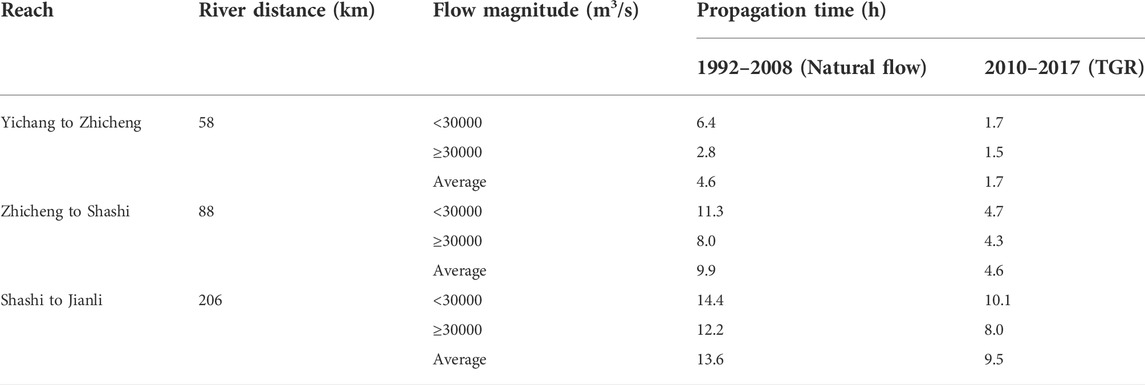
TABLE 2. Natural and post-TGR flood propagation time in the Jingjiang Reach.
The observed data from 2002 to 2017 were used to analyze changes in the rating curve in the main stations along Jingjiang Reach (Figure 5). With TGR operational, the main changes to the rating curve included that: 1) since 2014, the average water level decreased at discharge of less than 15,000 m3/s at the Yichang station, but the annual amplitude of the decrease shows a convergence trend, 2) there was no apparent change to the average water level at discharge above 30,000 m3/s at the Yichang station, but the water level varied more widely. Since the TGR was built to control flooding and to protect assets in the Jiangjiang Reach, the outflow has not exceeded 45,000 m3/s, or the approximate flow capacity of that reach. No data were available to explore changes in the rating curve change beyond that maximum discharge.
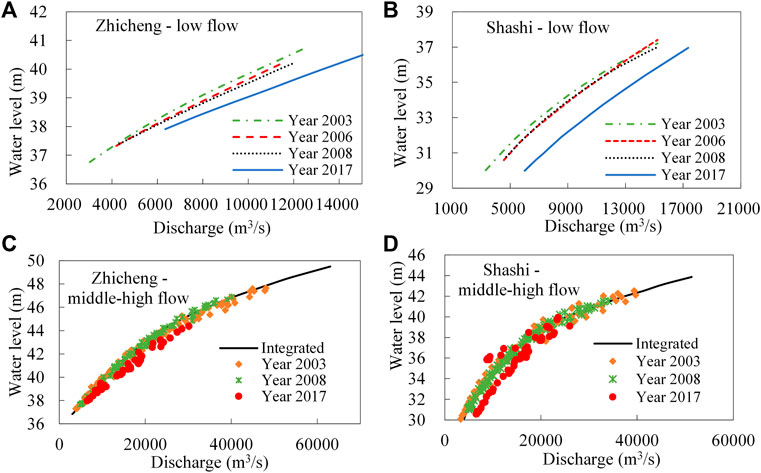
FIGURE 5. The stage-discharge relationship (based on observations): (A) Zhicheng at low flow; (B) Shashi at low flow; (C) Zhicheng at middle-high flow; (D) Shashi at middle-high flow.
By deriving from the dynamical equation in the Saint-Venant equation group (Chai et al., 2021), Eq. 3 can be obtained:
where
As mentioned above, for a flood wave dominated by diffusion characteristics,
In the wet seasons of 2016 and 2017, serious flood events occurred in the catchment upstream of the TGR, and in basins of branches of Dongting Lake. Both TGR and other reservoirs were in operation to reduce the peak flows and to detain floodwater runoff to protect vulnerable assets in Jingjiang Reach. The MIKE11 model created for this study was used to simulate the observed flood events in 2016 and 2017 with different TGR regulation schemes, and the optimized TGR operation was explored by studying the trends of the flooding characteristics in Jingjiang Reach.
The sensitivity of the rating curve in Luoshan, the model’s downstream boundary condition, was tested since it varied widely and was impacted by several elements. By comparing the crest of the high water level with small discharge with that of low water level with large discharge, no significant differences were found in Shashi. In Lianhuatang, however, a crest difference of ∼0.9 m was found with a time varying from 3 to 4 h. These changes showed a systematic bias. In analyzing these case studies, the average rating curve in Luoshan was used as the boundary condition, since most impacts were focused around the Shashi area, and the effects in the Lianghuatang area could be estimated qualitatively based on systematic bias.
Both in 2016 and 2017, the TGR reservoir detained floodwater, however, how the different intensities of flood and detention at different times impacted the crest water level at Shashi station is unknown. To investigate this, six flooding scenarios were selected for 2016 and seven scenarios for 2017. Actual conditions from the 6/7/2016 8:00:00 flood event was used as the initial condition of the model. The first scenario kept the outflow of the TGR (discharge at Yichang) constant at 30,000 m3/s; the second and third scenarios reduced the outflow of TGR to 10,000 and 20,000 m3/s, respectively, over a 6-h period and lasting for 10 days, and then smoothly increased it to 30,000 m3/s over a 6-h period. Scenarios four through six built on scenario three, but continued the reduced outflow time to 5 days, 8 days, and continuously, respectively.
Assumptions for the model in 2017 were the same, except that the initial conditions were from the observed flood event on 1/7/2016 8:00:00, with an initial outflow from TGR of 26,000 m3/s, with reduced outflow and durations as shown in Table 3.
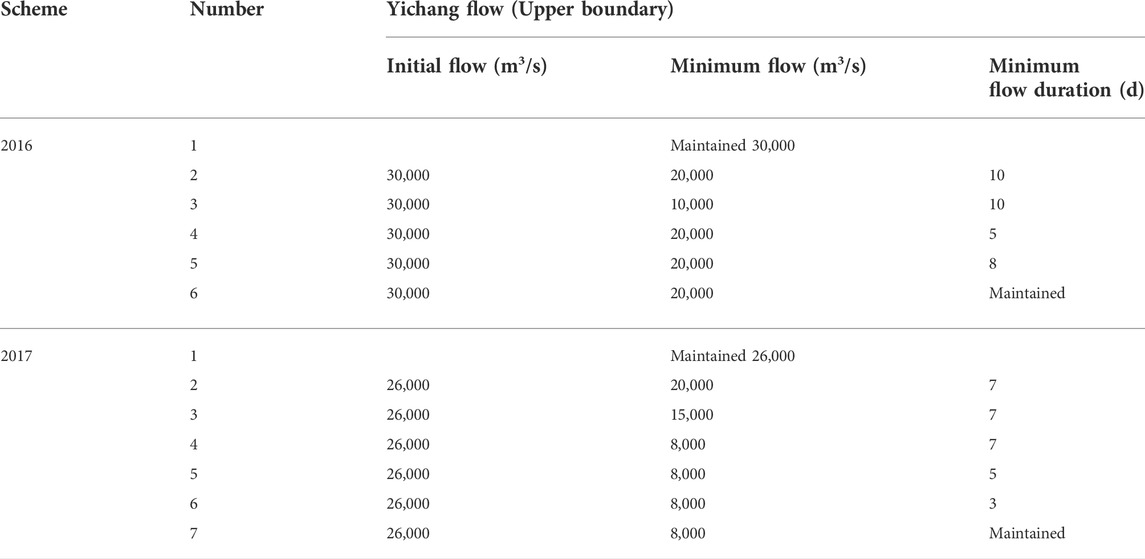
TABLE 3. Upper boundary settings of different scenarios of reduced outflow discharge from the TGR.
As shown in Figures 6A,B, for the flood events in 2016 and 2017, the water level at Shashi station shows the effects 3–5 h after the outflow was reduced from the TGR. For the second and third scenarios in 2016, and the second through fourth scenarios in 2017, the speed with which the water level receded as compared to the first scenario took an hour to reach the maximum the difference of the reduced water level up to 1.05 and 2.25 m for the scenarios of 2016, and 0.65, 1.30, 2.20 m for the three scenarios of 2017. Three days later, the speed with which the water level receded decreased, meaning that the water level at Shashi reduced further, with a limited amplitude. In scenarios two and three in 2016, after 5 days, the outflow reduced to an amplitude of 0.14 and 0.23 m, respectively, indicating a further reduction of the water level at Shashi station. The amplitude for the three similar counterpart scenarios in 2017 was about 0.05, 0.14, and 0.23 m, respectively. Once the outflow from TGR increased to the initial value, the water level at Shashi station kept rising back to that of scenario one, although the effects were gone after 6 days.
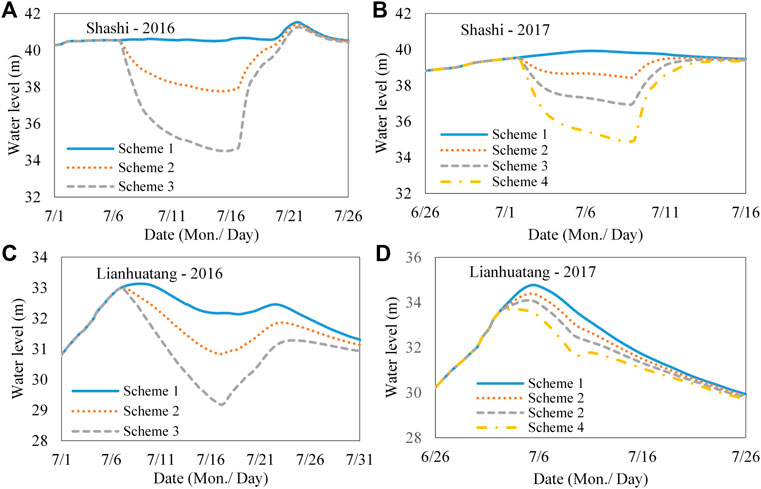
FIGURE 6. The water level processes under different flood interception discharges during the same period: (A) Shashi—2016; (B) Shashi—2017; (C) Lianhuatang—2016; (D) Lianhuatang—2017.
As shown in Figures 6C,D, under the same initial flow and duration conditions with different interception scenarios, the water level at Lianhuatang station was affected ∼15 h after the TGR reduced the outflow. After 30 h, the water level recession rate reached its maximum, which was maintained for 24 h, and then gradually decreased. After 5 days, the daily water level recession rate in scenarios two and three was reduced to 0.11 and 0.29 m, respectively, relative to scenario one in 2016. The daily recession rate of scenarios two through four was reduced to 0.07, 0.13, and 0.22 m, respectively, relative to scenario one in 2017. In 2016, the maximum daily recession in scenarios two and three relative to scenario one was about 0.25 and 0.47 m, respectively. The maximum daily recession in scenarios two through four in 2017 was about 0.15, 0.27, and 0.46 m, respectively. When the outflow of the TGR was increased for 9 days, the difference in water level for each scenario was within 0.5 m, and when it increased for 19 days, it was within 0.2 m, meaning that the impact of the reduced outflow on the water levels at Lianhuatang station were effectively eliminated.
Figure 7 supports the conclusion regarding the initial influence time and appearance time of the amount of maximum influence that is shown in Figure 6. In addition, the longer the duration of the interception, the greater the impact on the water level of Shashi and Lianhuatang stations. Comparing the results of scenarios six and one in 2016 and the results of scenarios one and seven in 2017, the impact of the reduction of the outflow from the TGR on the water level of Shashi station after 6–7 days was stable. The impact on the water level of Lianhuatang station lasted for a long time, but after the outflow from the TGR was reduced for 20 days, the recession rate for scenario seven in-creased slowly as comparing to scenario one. On the 21st day of 2016 and 2017, the recession rate was 0.1 and 0.2 m, respectively, but decreased to 0.05 and 0.01 m, respectively, on the 30th day.
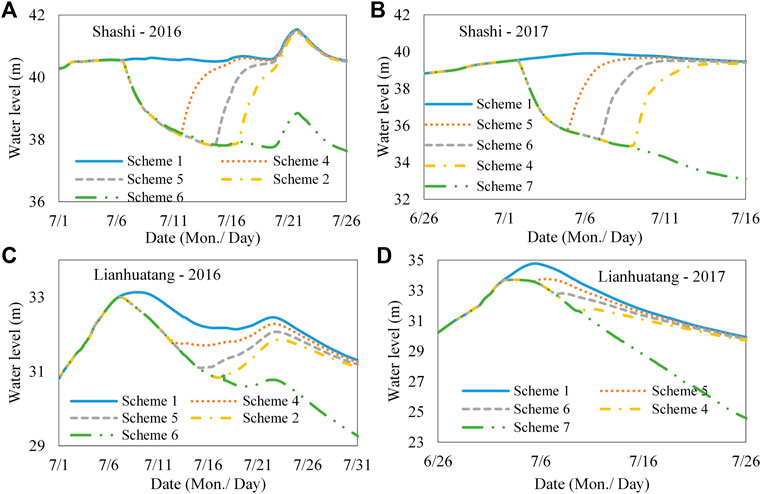
FIGURE 7. The water level processes under same flood interception discharges during different period: (A) Shashi—2016; (B) Shashi—2017; (C) Lianhuatang—2016; (D) Lianhuatang—2017.
Due to the complicated relationship between rivers and lakes, the TGR was able to reduce the outflow at Lianghuatang station in a sustained manner after being stored in Dongting Lake and the mainstream of the Yangtze River. At the same time, due to the continuous increase of the recession rate of the water level at Lianghuatang station, the water level at Shashi station also showed a slow increase. In 2016, the 30-days recession rate at Lianhuatang station reached 0.05 m, which may be due to the slight increase in the water level after the increase in water supply from Shashi station from the Qingjiang River.
In real-time flood control operations, reservoirs need to increase discharge after a flood event, and gradually reduce the pre-storage water. When the flood design standard is exceeded, the reservoir should increase the amount discharged and release floodwaters in a timely manner according to the operation rules and regulations. In order to analyze the impact of different scenarios of increasing outflow on the flood propagation characteristics in the Jingjiang River section, a set of scheduling schemes was set up (Table 4) to examine the 2016 flood dispatching process.
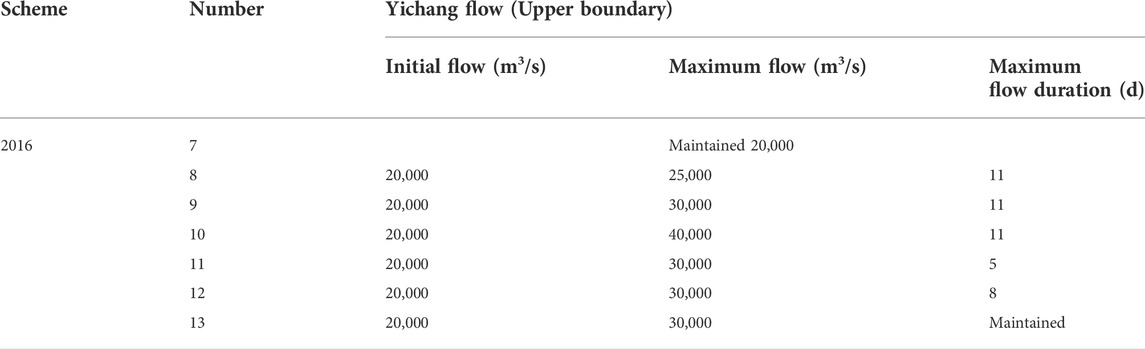
TABLE 4. Upper boundary settings of different increasing discharge schemes from the TGR.
Similar to when the discharge was reduced, the water level at Shashi Station showed effects from the increased TGR discharge in about 3–5 h, and the increased water level rate at Shashi station for scenarios 8–10 relative to scenario seven reached the maximum in ∼12 h. After 3 days, the rate of water level rise slowed significantly. After 4 days, rate of scenario ten relative to seven was ∼0.1 m. After 8 days, the water level in Shashi station was stable. The maximum daily increase of scenarios 8–10 relative to seven was about 0.55, 1.18, and 2.38 m, respectively. At 13–15 h post increasing the TGR outflow, the water level at Lianhuatang station was affected. The greater the flow rate, the earlier the impact time. The rising water level rate at Lianhuatang station reached the maximum at about 30 h, while the rate in scenarios 8–10 began to gradually decrease on days 4, 5, and 5, respectively. The maximum daily increase in scenarios 8–10 relative to seven was about 0.14, 0.27, and 0.52 m, respectively. After 7 days, the increase rate was below 0.1 m.
The conclusion in Figure 8 are similar to those in Figure 9. The longer the duration of the increase in discharge, the more significant the impact on the water level at Shashi and Lianhuatang stations. The impact of increasing the TGR discharge at Shashi station was stable after 8 days, and after 10 days at Lianhuatang station.
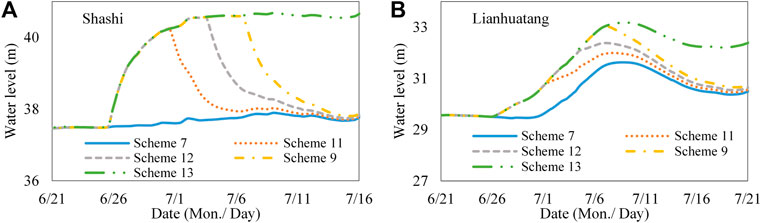
FIGURE 8. The water level processes in (A) Shashi and (B) Lianhuatang stations under same increasing discharge rates in different periods.
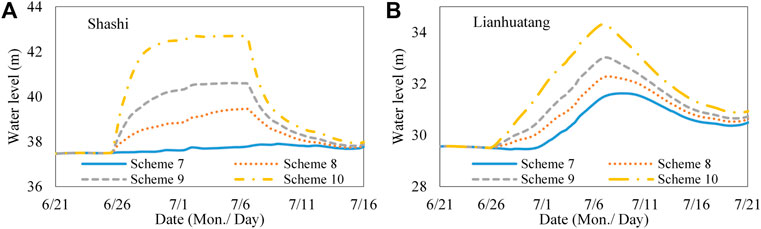
FIGURE 9. The water level processes at (A) Shashi and (B) Lianhuatang stations under different increasing discharge rates during the same period.
Based on the observed data, after the construction of the TGR, the flood propagation time and the flow stage-discharge relationship at the main station in the Jingjiang reach of the Yangtze River have been changed (Chai et al., 2020; Yang et al., 2022). The factors influencing the relationship between flood propagation time and water level flow were discussed mechanistically based on the Saint-Venan Equation, and validated using a constructed MIKE 11 model. To create better guidance for real-time forecasting and operation of the TGR in conjunction with the reservoirs in the upper-reaches of the Yangtze River, the water level change processes of the main control station at the Jingjiang River reach for different TGR discharge scenarios were simulated via hydraulic model. The analysis and summary of the impact on time and degree of Shashi and Lianhuatang stations in the Jingjiang reach under different scenarios can be used as an important technical resource for real-time forecasting and operation. The main conclusions are as follows:
(1) After the TGR became operational, a series of changes occurred in the flood propagation characteristics downstream of Jingjiang Reach. Flood propagation time was significantly shortened, and under low flow conditions, the discharge increased under the same water levels, and the range of the loop curve of the stage-discharge relationship increased under high flow conditions. Through theoretical analysis and model validation, results showed that these changes occurred after the regulation of the TGR for natural floods, and were caused by decreasing the operation times of the gates. This caused the time for the floodwaters to rise and subsequently decrease to be significantly shortened, and changed the flood waves from gradual to sudden.
(2) Analysis of the response relationship between the different TGR discharge rates and the flood control process at the main control stations in Jingjiang Reach showed that the flow stage-discharge relationship at Luoshan station had no significant effect on the peak stage at Shashi station, but had a significant impact on the peak stage at Lianhuatang station. The lower the discharge at Luoshan station at the same water level, the higher the water level at Shashi and Lianhuatang stations, and the later the peak time. As the TGR reduced discharge, it affected the water level at Shashi station after 3–5 h. The water level recession rate at Shashi Station reached the maximum after 14 h, and decreased significantly after 3 days, and was stable after 4 days.
The TGR began to affect the water level at Lianhuatang station after ∼15 h, and reached the maximum recession rate after 30 h. After maintaining this for ∼24 h it started to gradually decrease. After six or 7 days, the daily recession significantly slowed, and the discharge reduction by the TGR had a longer effect on the water level of the Lianhuatang. The TGR increased the discharge and began to affect the water level at Shashi station after 3–5 h. The rate of water level rise at Shashi station reached the maximum after ∼12 h, and decreased significantly after 3 days, and was back to pre-flood levels after 8 days. It began to affect the water level at Lianhuatang station after ∼13–15 h, reached maximum water levels at ∼30 h, and then gradually decreased. After 7 days the increase rate was not obvious, and was stable after 10 days.
(3) Due to the complicated relationship between rivers and lakes, after Dongting Lake was regulated, some floodwater from the upper reaches of the Yangtze could still flow up-stream of the Lianhuatang station. In addition, the mainstream of the middle and lower reaches of the Yangtze River with wide sections, small slopes, large channel-storage, have a complex up- and downstream hydraulic relationship, which present urgent problems to real-time forecasting and operations. Based on the results of this paper, it is appropriate to reduce the discharge from the TGR one to 3 days in advance of implementing flood control compensation operations at Shashi station. Lianghuatang station should be reduced two to 4 days in advance, as the water level recession rate at Shashi and Lianhuatang stations are relatively large during this operational period, and can be controlled to be lower if the discharge from TGR will be reduced in advance for a longer period of time. If the TGR needs to store more flood volume, then the efficiency of flood control capacity may be relatively low. After implementing the flood control compensation operation, if the TGR needs to increase discharge to release the storage, the interval of inflow recession from the TGR to the Lianhuatang must be considered to avoid the water level re-rising in the lower reaches of the river.
The flood propagation characteristics of the Jingjiang River section have changed significantly since the TGR became operational. Due to the huge storage effect of TGR and the prominent position of flood control in the Jingjiang River section, the influence of its flood propagation law is significantly important. The flood waves in the Jingjiang River section are converted from natural state diffusion waves to break waves in a certain range of the river channel. Since the research on the mechanism of break waves is not deep enough, and the influence relationship is complicated, there is an urgent need to carry out experimental research based on physical models.
The data analyzed in this study is subject to the following licenses/restrictions: Restrictions apply to the availability of these data. Data was obtained from Bureau of Hydrology, Changjiang Water Resources Commission and are available from the authors with the permission of Bureau of Hydrology, Changjiang Water Resources Commission. Requests to access these datasets should be directed to eWluc2hhbnh1QDE2My5jb20=.
LL, YX, and YM worked together in forming the ideas of this paper; LL, YX, YM, YR, YT, and XZ worked together in the calculating and writing of this manuscript. LL and YX provided supervision during the whole process. All authors have read and agreed to the published version of the manuscript.
This research was funded by the National Key Research and Development Program of China (2021YFC3200301) and Research Foundation of China Three Gorges Corporation (No. 0799245).
Author YR was employed by the company China Yangtze Power Co., Ltd.
The remaining authors declare that the research was conducted in the absence of any commercial or financial relationships that could be construed as a potential conflict of interest.
All claims expressed in this article are solely those of the authors and do not necessarily represent those of their affiliated organizations, or those of the publisher, the editors and the reviewers. Any product that may be evaluated in this article, or claim that may be made by its manufacturer, is not guaranteed or endorsed by the publisher.
Abebe, Y. A., Seyoum, S. D., Vojinovic, Z., and Price, R. K. (2016). Effects of reducing convective acceleration terms in modelling supercritical and transcritical flow conditions. Water 8 (12), 562. doi:10.3390/w8120562
Castro-Orgaz, O., and Chanson, H. (2017). Ritter's dry-bed dam-break flows: Positive and negative wave dynamics. Environ. Fluid Mech. (Dordr). 17 (4), 665–694. doi:10.1007/s10652-017-9512-5
Chai, Y. F., Deng, J. Y., Yang, Y. P., Sun, Z. H., Li, Y. T., and Zhu, L. L. (2021). Evolution characteristics and driving factors of the water level at the same discharge in the Jingjiang reach of Yangtze River. Acta Geogr. Sin. 76 (01), 101
Chai, Y. F., Yang, Y. P., Deng, J. Y., Sun, Z. H., Li, Y. T., and Zhu, L. L. (2020). Evolution characteristics and drivers of the water level at an identical discharge in the jingjiang reaches of the Yangtze River. J. Geogr. Sci. 30 (10), 1633–1648. doi:10.1007/s11442-020-1804-x
Chen, J., Hammerer, D., D'Ostilio, K., Casula, E. P., Marshall, L., Tsai, C. H., et al. (2014). Bi-Directional modulation of somatosensory mismatch negativity with transcranial direct current stimulation: an event related potential study. J. Physiol. 25 (5), 745–757. doi:10.1113/jphysiol.2013.260331
Cheng, H., Chen, L., and Xu, Y. (2016). Surge wave and its propagation in upper Jingjiang Reach. Yangtze River 21, 30
Dai, M. L., Wang, J., Zhang, M. B., and Chen, X. (2017). Impact of the three Gorges project operation on the water exchange between Dongting lake and the Yangtze River. Int. J. Sediment Res. 32 (4), 506–514. doi:10.1016/j.ijsrc.2017.02.006
Dias, V. D., da Luz, M. P., Medero, G. M., and Nascimento, D. T. F. (2018). An overview of hydropower reservoirs in Brazil: Current situation, future perspectives and impacts of climate change. Water 10 (5), 592. doi:10.3390/w10050592
Doroszkiewicz, J., Romanowicz, R. J., and Kiczko, A. (2019). The influence of flow projection errors on flood hazard estimates in future climate conditions. Water 11 (2), 49. doi:10.3390/w11010049
Fang, H. W., Han, D., He, G. J., and Chen, M. H. (2012). Flood management selections for the Yangtze River midstream after the three Gorges project operation. J. Hydrology 432, 1–11. doi:10.1016/j.jhydrol.2012.01.042
He, H. M., Tian, Y. Q., Mu, X. M., Zhou, J., Li, Z. B., Cheng, N. N., et al. (2015). Confluent flow impacts of flood extremes in the middle Yellow River. Quat. Int. 380, 382–390. doi:10.1016/j.quaint.2015.01.048
He, L. (2017). Quantifying the effects of near-bed concentration on the sediment flux after the operation of the three Gorges dam, Yangtze River. Water 9 (12), 986. doi:10.3390/w9120986
Li, Y., Li, Y. B., Ji, P. F., and Yang, J. (2015). The status quo analysis and policy suggestions on promoting China's hydropower development. Renew. Sustain. Energy Rev. 51, 1071–1079. doi:10.1016/j.rser.2015.07.044
Li, Y. Y., Yang, G. S., Li, B., Wan, R. R., Duan, W. L., and He, Z. (2016). Quantifying the effects of channel change on the discharge diversion of Jingjiang three outlets after the operation of the three Gorges dam. Hydrology Res. 471, 161–174. doi:10.2166/nh.2016.016
Liu, W. J., Wang, B., Chen, Y. L., Wu, C., and Liu, X. (2018). Assessing the analytical solution of one-dimensional gravity wave model equations using dam-break experimental measurements. Water 10 (9), 1261. doi:10.3390/w10091261
Sangiorgio, M., and Guariso, G. (2018). NN-based implicit stochastic optimization of multi-reservoir systems management. Water 10 (3), 303. doi:10.3390/w10030303
Sun, Z. L., Zhu, X. F., Pan, Y. Z., and Zhang, J. S. (2017). Assessing terrestrial water storage and flood potential using GRACE data in the yangtze river basin, China. Remote Sens. 9 (10), 1011. doi:10.3390/rs9101011
Thakur, P. K., Aggarwal, S., Aggarwal, S. P., and Jain, S. K. (2016). One-dimensional hydrodynamic modeling of GLOF and impact on hydropower projects in Dhauliganga River using remote sensing and GIS applications. Nat. Hazards (Dordr). 83 (2), 1057–1075. doi:10.1007/s11069-016-2363-4
Xia, J. Q., Zhou, M. R., Lin, F. F., Deng, S. S., and Lu, J. Y. (2017). Variation in reach-scale bankfull discharge of the Jingjiang Reach undergoing upstream and downstream boundary controls. J. Hydrology 547, 534–543. doi:10.1016/j.jhydrol.2017.02.026
Yang, Y. P., Zhang, M. J., Zhu, L. L., Liu, W. L., Han, J. Q., and Yang, Y. H. (2017). Influence of large reservoir operation on water-levels and flows in reaches below dam: Case study of the Three Gorges Reservoir. Sci. Rep. 7, 15640. doi:10.1038/s41598-017-15677-y
Yang, Y. P., Zheng, J. H., Zhang, H. Q., Chai, Y. F., Zhu, Y. D., and Wang, C. Y. (2022). Impact of the three gorges dam on riverbed scour and siltation of the middle reaches of the Yangtze River. Earth Surf. Process. Landf. 47 (6), 1514–1531. doi:10.1002/esp.5332
Yin, H. F., Liu, G. R., Pi, J. G., Chen, G. J., and Li, C. A. (2007). On the river-lake relationship of the middle Yangtze reaches. Geomorphology 85 (3-4), 197–207. doi:10.1016/j.geomorph.2006.03.017
Zhang, W., Yang, Y. P., Zhang, M. J., Li, Y., Zhu, L., You, X., et al. (2017). Mechanisms of suspended sediment restoration and bed level compensation in downstream reaches of the three gorges projects (TGP). J. Geogr. Sci. 27 (4), 463–480. doi:10.1007/s11442-017-1387-3
Keywords: Three Gorges Reservoir, flood propagation characteristics, flood control operation scheme, Jingjiang Reach, Yangtze River
Citation: Lan L, Xu Y, Mei Y, Ren Y, Tian Y and Zhang X (2022) Optimized flood control for the Three Gorges Reservoir considering evolving flood propagation trends in the Jingjiang Reach of the Yangtze River. Front. Environ. Sci. 10:1013583. doi: 10.3389/fenvs.2022.1013583
Received: 07 August 2022; Accepted: 23 August 2022;
Published: 19 September 2022.
Edited by:
Shiping Wen, University of Technology Sydney, AustraliaReviewed by:
Xudong Zhou, The University of Tokyo, JapanCopyright © 2022 Lan, Xu, Mei, Ren, Tian and Zhang. This is an open-access article distributed under the terms of the Creative Commons Attribution License (CC BY). The use, distribution or reproduction in other forums is permitted, provided the original author(s) and the copyright owner(s) are credited and that the original publication in this journal is cited, in accordance with accepted academic practice. No use, distribution or reproduction is permitted which does not comply with these terms.
*Correspondence: Yinshan Xu, eWluc2hhbnh1QDE2My5jb20=; Yadong Mei, eWRtZWlAd2h1LmVkdS5jbg==
Disclaimer: All claims expressed in this article are solely those of the authors and do not necessarily represent those of their affiliated organizations, or those of the publisher, the editors and the reviewers. Any product that may be evaluated in this article or claim that may be made by its manufacturer is not guaranteed or endorsed by the publisher.
Research integrity at Frontiers
Learn more about the work of our research integrity team to safeguard the quality of each article we publish.