 Liguang Li
- 1Institute of Atmospheric Environment, China Meteorological Administration, Shenyang, China
- 2Institute of Applied Ecology, Chinese Academy of Sciences, Shenyang, China
Ozone pollution has been growing in the recent decade, becoming a critical urban environmental issue in China. However, Shenyang’s near-surface ozone concentration (ground to 100 m altitude) is of grave concern. To obtain the ozone concentration and the corresponding meteorological conditions from 1 October 2018, to 30 September 2019, we built observatory sites at low (≈15 m) and high (≈90 m) layers in Shenyang, northeast China. Then, we analyzed the temporal variation of ozone concentration and discussed the relationship between ozone concentration and the meteorological factors at low and high layers. Compared with the high layer, the ozone concentration in the low layer is chartered with an earlier peak and higher diurnal range. The ozone concentration in all seasons first peaked at a low-layer height, in early in winter (15:00) and late summer (17:00). Then, the peak at high-layer height lagged for behind 1–2 h, generally occurring between 17:00 and 19:00. The variations in ozone concentration at low and high layers differed in daytime and nighttime. The diurnal ranges of ozone concentrations at the low layer were higher than those at the high layer in the four seasons examined. Overall, ozone concentration correlated significantly with air temperature, having correlation coefficients of 0.814 (p < 0.05) in the low layer and 0.731 (p < 0.05) in the high layer. Inversely, it showed a weak correlation with relative humidity: 0.310 (p < 0.05) and 0.351 (p < 0.05) in the low and high layers, respectively. Also, the correlation coefficients with wind speed were meager at both layers. Generally, ozone pollution is not severe in Shenyang.
Introduction
Tropospheric ozone is a critical atmospheric pollutant with a strong oxidizing property. It is also a greenhouse gas without any benefits to animals, plants, or the climate (Liu, 2019; Yu et al., 2021). With the implementation of emission reduction measures in China, particulate matter pollution has reduced (Wang W. X. et al., 2019). In contrast, near-ground ozone concentration has been increasing recently (Cheng et al., 2019; Deng et al., 2022). Furthermore, ozone has become a primary pollutant in some Chinese cities (Li et al., 2021). Thus, studying ozone is crucial to improving their atmospheric environment.
Previous studies on ozone have mainly focused on the characteristics of spatial and temporal distributions (Wang et al., 2018; Liu et al., 2019b; Oufdou et al., 2021), formation mechanism (Ridel et al., 2014; Wang et al., 2021), chemical precursors (An et al., 2015; Shi et al., 2015; Lyu et al., 2021), influencing factors (Pu et al., 2017; Wang Z. et al., 2019), etc. Generally, ozone concentration has lucid spatial distribution characteristics, i.e., higher in the suburbs and lower in the urban areas (Im et al., 2019). Many studies reported that daily ozone concentration is a unimodal curve change that peaks in the afternoon and plateaus in the morning (Liu, 2019; Han et al., 2021). Also, the concentration is respectively higher and lower in the summer and winter than the average (Zhang and Zhang, 2019; Wang et al., 2020; Zhang et al., 2021). Key factors that influence the seasonal and spatial ozone variations in a specific region include horizontal inflows and outflows via long-range transport, vertical stratospheric-to-tropospheric transport, photochemical production and destruction, and deposition on the Earth’s surface (Logan, 1985; Ma et al., 2002). Moreover, most studies were done in temporal and spatial variations.
With improved urbanization, ozone studies on vertical height are gradually increasing. Generally, the tropospheric O3 increased to around 8 km altitude, and then increased rapidly above 8 km with a larger variability near the tropopause in mid-latitudes (Beekmann et al., 1994; Logan, 1994; Cooper et al., 2005). For PBL, the O3 concentrations increased sharply below 1 km and then remained fairly constant (∼52 ppbv) between 1 and 2 km in Beijing by Airbus In-Service Aircraft (MOZAIC) program (Ding et al., 2008). Using a differential absorption ozone Lidar, He and coworkers (He et al., 2020) found that ozone concentration increases before decreasing with altitude (300–3,000 m), peaking at 600–800 m. Based on the observation at 8, 120, and 280 m layers, the ozone layer was 325 and 255 mm at the Beijing and Tianjin towers, respectively. The daily average ozone concentration increased with altitude from August 18 to 22 September 2006 (Sun et al., 2010). In the vertical direction, few studies on ozone in Shenyang, northeast China focused on the near-surface (0–100 m), predominantly the space for urban activities. Because near-surface ozone pollution is closely related to human health, we monitored the ozone concentration at low (15 m) and high (90 m) layers in Shenyang. This study aims to provide ozone concentration variations at 15 and 90 m and discuss the relationships between ozone and meteorological factors in the study area. Data and methods introduces observation data and method. Results and discussion presents results that include statistical characteristics of seasonal, monthly and diurnal ozone concentration in this city, and the relationship between ozone concentration and meteorological factors. Summary and conclusion summarizes the results.
Data and method
Study area and observation instrument
The study area is located in Shenyang, a heavily industrialized city. Based on the seventh population census, Shenyang has a permanent resident population of 9.03 × 10⁶ in 2020 (https://www.maigoo.com/news/585028.html). The topography is flat, and the altitude is 40–50 m above sea level. It has a humid, warm continental monsoon climate, with a mean temperature of −6°C in January and 23°C in July. The annual mean precipitation in Shenyang is 716 mm (average from 1951 to 2010), with the precipitation concentrated in summer (June–August).
The study site (Figure 1) is in the yard of Shenyang Institute of Atmospheric Environment, China Meteorological Administration. The site is surrounded by a primary school (south), a branch of the Hunhe River (north), a residential area (east), and bare land (west).
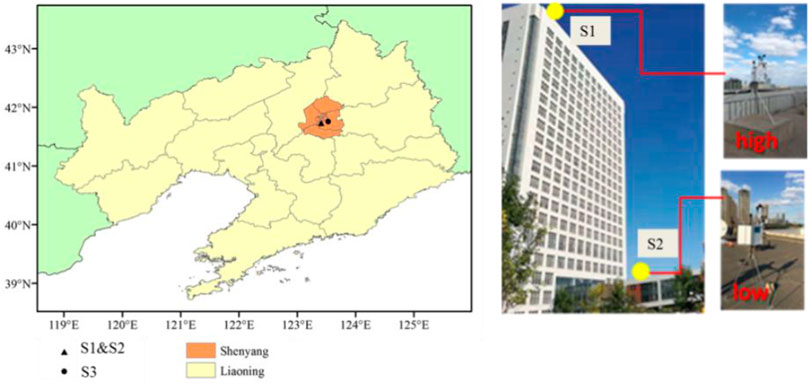
FIGURE 1. Locations of study sites of high (S1) and low (S2) layers. S3 is the controlled site (S3) on Hunnan East Road, Shenyang.
The monitoring instrument (H6 air quality early warning system (constant temperature)) produced by Qingdao Hecheng Environmental Protection Technology Co., Ltd., was set on the roof platform of two buildings of different heights (Figure 1). The heights are considered low (30 m) and high (90 m) layers, respectively, influenced by various pollution sources such as industrial pollution, traffic pollution, etc., (China State Bureau of Technical Supervision, 1992).
Observation data and method
We measured the ozone concentration, air temperature, wind speed, and relative humidity from 1 October 2018, to 30 September 2019. Table 1 lists the description of observed elements. The interval time was 1 min, and the entire data underwent strict quality control, including eliminating outliers and interpolating missing test data. We employed the data from the surrounding site (about 13.5 m below vertical distance and 10 m horizontal distance to the observed site at the low layer) because of missing measurements of meteorological elements at that layer. Also, we compared the daily mean ozone concentration measured in the low layer in this study with those (http://www.cnemc.cn/) from the controlled site (S3 in Figure 1) on Hunnan east road of Shenyang. After removing missing data and outliers, 331 sample pairs were obtained from both sites, separated by 5 km. The trend of ozone concentration at both sites in November was similar (Figure 2A), and the correlation coefficient was 0.80 (p < 0.01) (Figure 2B). Thus, the observed data can represent the status of ozone in Shenyang.
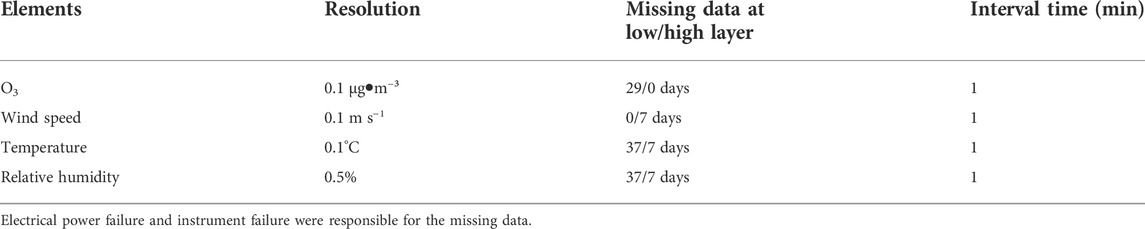
TABLE 1. Description of monitored ozone concentration and meteorological factors.
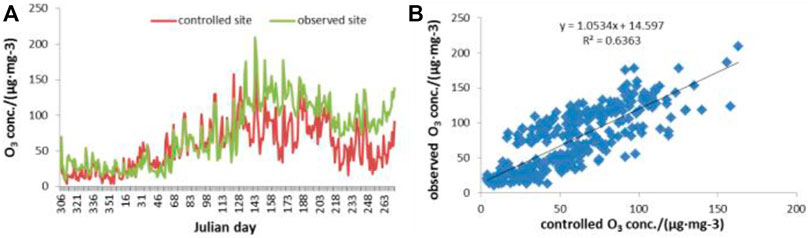
FIGURE 2. (A) Comparison of ozone concentrations measured in the low layer and controlled site and (B) scatter plots from October 2018 to September 2019 in Shenyang.
Furthermore, the spring, summer, autumn, and winter seasons reported here correspond to March-May, June-August, September-November, and December-February. In addition, vertical airflow speed data indicating pollutant mixing in the lower boundary layer were from the European Centre for Medium-Range Weather Forecasts (ECMWF). The data had horizontal and vertical resolutions of 0.125 and 25 hPa, respectively.
Shenyang’s mean boundary layer heights in 2018 were calculated using the Weather Research and Forecasting (WRF) model. Boundary layer height was determined from the MYNN2 PBL scheme (Nakanishi and Niino, 2003) in the WRF model. The scheme used 1.5-theta-increase and Turbulent Kinematic Energy (TKE) methods to define the Planet Boundary Layer Heights (PBLH). The 1.5-theta-increase method defines PBL heights as the level at which the potential temperature first exceeds the minimum potential temperature within the boundary layer by 1.5 K. When applied to observed temperatures, this method can produce PBL-height estimates that are unbiased relative to profiler-based estimates (Nielsen-Gammon et al., 2008). However, their study did not include Low-Level Jets (LLJ). Banta et al. (2006) show that a TKE-based threshold is a viable estimate of the PBL heights in LLJs. Therefore, a hybrid definition (a tanh weighting function) was implemented using both methods, weighting the TKE-method (Nakanishi and Niino, 2003) more during stable conditions (PBLH <400 m). In addition, a variable, the TKE threshold (0.02 times the maximum TKE below 250 m), was also used in the TKE methods. The ECMWF data verified the simulated results of PBL heights. Both correlation coefficients reached 0.65 (p < 0.05) and passed the t-test.
Results and discussion
Seasonal and monthly variations of ozone concentrations
Among the four seasons, the ozone concentration was highest in summer with 112.76 ± 28.51 μg m−3 at the low layer and 104.13 ± 32.08 μg m−3 at the high layer. The sequence was summer > spring > autumn > winter (Table 2). Generally, the ozone concentration at the low layer was higher in summer and autumn, while those at the high layer were higher in winter and spring.
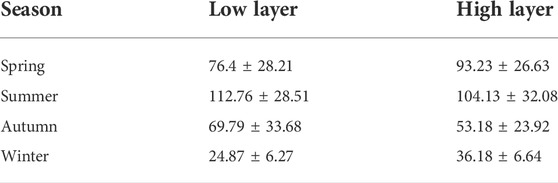
TABLE 2. Seasonal ozone concentrations (µg m−3) in the low and high layers of Shenyang.
The variations in ozone concentration and meteorological elements in low and high layers from October 2018 to September 2019 in Shenyang are shown in Figure 3. For monthly variations (Figure 3A), trends for ozone concentrations at both height layers are similar, having a peak and a valley. The maximum ozone concentrations in both heights occurred in June with 129.73 ± 23.51 μg m−3 in the low layer and 128.74 ± 22.01 μg m−3 in the high layer, while the minimum values were in January with 22.78 ± 5.85 μg m−3 in the low layer and in December with 32.21 ± 3.11 μg m−3 in the high layer, respectively. The ozone concentration peak in the summer relates to meteorological factors, such as high temperature and relative humidity, intense insolation, and transport of Asia summer wind (Liu et al., 2021). From June to October, the ozone concentration was higher in the low layer than in the high layer, and the maximum difference appeared in October, reaching 35.60 μg m−3. However, from November to May, it is the contrary, with the corresponding maximum difference (16.6 μg m−3) occurring in January.
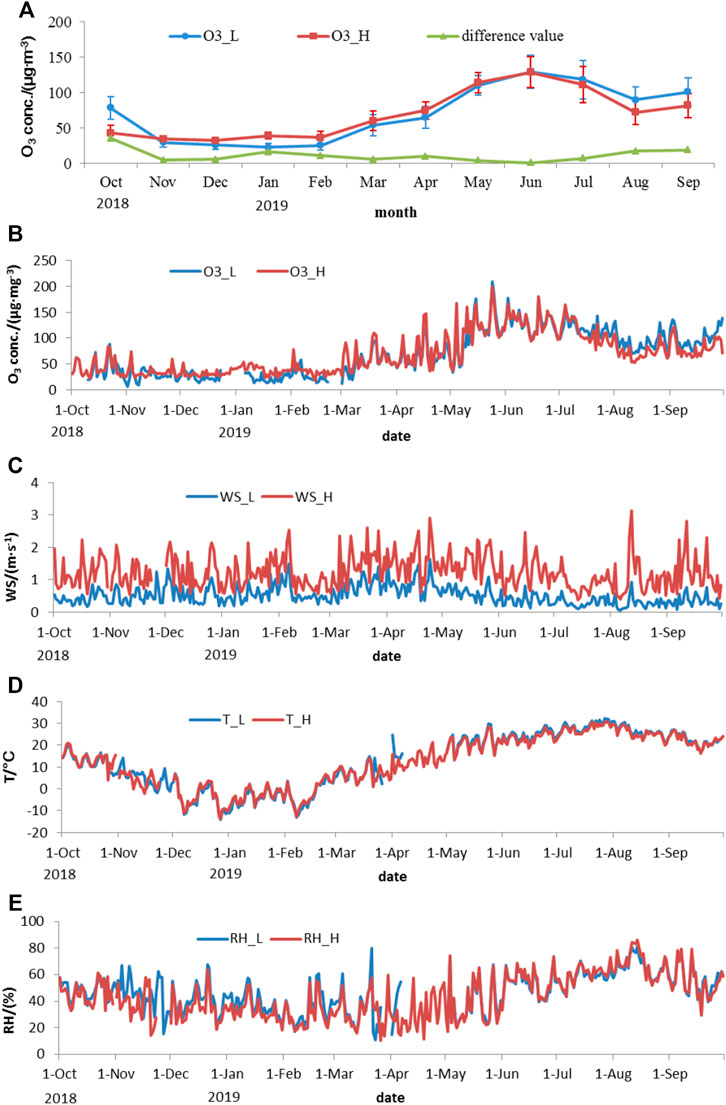
FIGURE 3. Variation in mean (A) daily and (B) monthly ozone concentration and the corresponding (C) wind speed, (D) temperature, and (E) relative humidity in low and high layers from October 2018 to September 2019 in Shenyang, China.
In general, the monthly variations of ozone concentrations are similar in the two height layers (Figures 3A,B). The daily mean ozone concentrations in most months were under 160 μg m−3 (limit of ozone pollution standard) except in June, with five and 7 days in the low and high layers, respectively. This result suggests that ozone pollution seldom happens in Shenyang.
The daily mean wind speed, air temperature, and relative humidity in the two layers in Shenyang are shown in Figures 3C–E. Wind speed in the high layer was much higher than in the low layers, with low and high wind speed (LWS and HWS) values of 0.47 and 1.23 ms−1, respectively. However, air temperatures in the low (12.67°C) and high (12.62°C) layers differed slightly. The same was observed for relative humidity, i.e., 46.68% and 43.22% in low and high layers, respectively). Compared with the two layers, the air temperature was higher in the low layer from May to November, but higher in the high layer from December to March (unmeasured data in the low layer in April). For relative humidity, it was higher in the low layer from October to April, while the opposite occurred from May to September.
Many studies indicated that meteorological factors could influence vertical ozone concentration (Ma et al., 2011; Guo et al., 2013; Dai et al., 2021). Thus, we correlated the ozone levels against the meteorological data to discuss factors influencing ozone pollution (Figure 4). Ozone concentration has a better relationship with air temperature; both correlation coefficients were 0.814 (p < 0.05) in the low layer and 0.731 (p < 0.05) in the high layer. As for the relative humidity, the respective values were 0.310 (p < 0.05) and 0.351 (p < 0.05), while the correlation coefficients with wind speed were meager for both layers. It also shows that ozone concentration is well correlated with air temperature but poorly correlated with relative temperature and wind speed in Xi’an (Hu et al., 2021) and Cangzhou (Xiong et al., 2022), China.
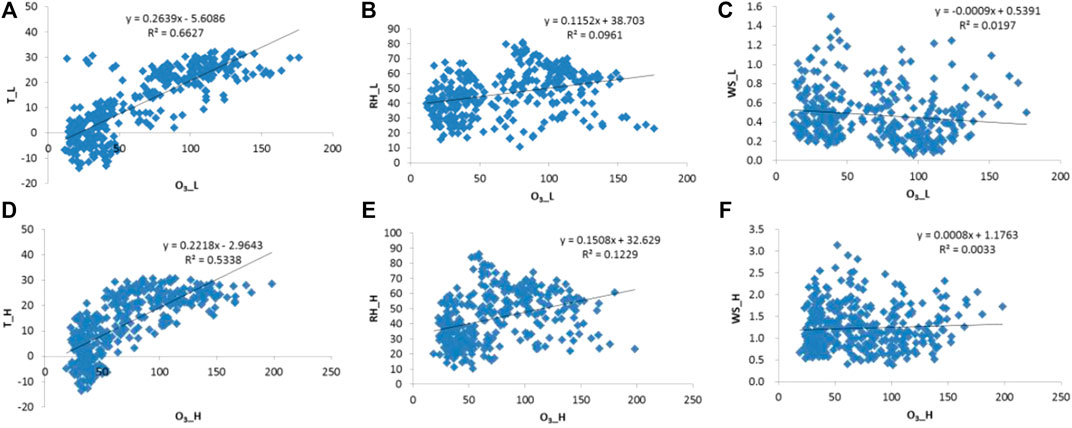
FIGURE 4. Scatter plots of relationships of ozone concentration with (A) air temperature, (B) relative humidity, (C) wind speed in the low layers, and with (D) air temperature, (E) relative humidity, (F) wind speed in high layers in Shenyang, China.
Diurnal characteristics of ozone concentrations
Figure 5 shows the diurnal variation of hourly ozone concentrations. Generally, O3 concentration, whose variation is characteristic of photochemical reactions, was low at night, gradually increasing in the morning and peaking at dusk (Xu et al., 2008; Li et al., 2021; Liu et al., 2021). En all seasons, the O3 concentration first peaked at the low-layer height in early winter (15:00) and late summer (17:00). Then, the peak at the high layer height lagged for 1–2 h (between 17:00 and 19:00). The diurnal variations (the difference between the maximum and minimum) of ozone concentrations at the low layer were 44.70, 67.67, 39.60, and 19.99 μg m−3 in spring, summer, autumn, and winter, respectively. These values were higher than their counterparts in the high layer. Compared with the high layer, the ozone concentration in the low layer is chartered with an earlier peak and wider diurnal variations. This occurrence could be attributed to the higher concentrations of ozone precursors in the lower layer, i.e., conducive conditions for ozone formation and transportation of updraft transporting air mass from the low layer, leading to the lags in ozone maximum in the high layer.
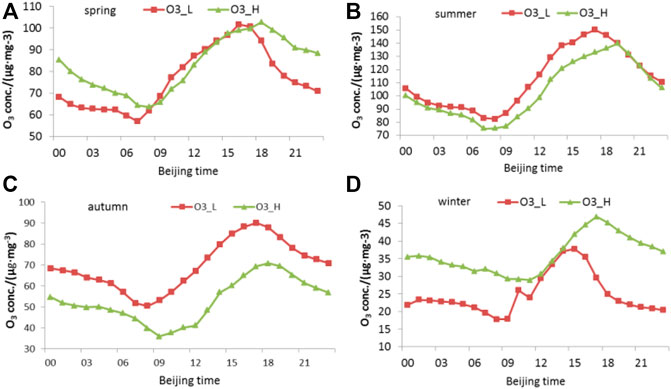
FIGURE 5. Diurnal variation of ozone concentration in (A) spring, (B) summer, (C) autumn, and (D) winter at low and high layers in Shenyang.
In spring, the ozone concentration during the daytime was slightly higher at the low layer than at the high layer. The differences between the two heights were below 6.17 μg m−3, while during the nighttime, it was lower at the low layer than at the high layer, with an increase in the corresponding differences. In the daytime, the boundary layer height in spring was the highest among the four seasons in Shenyang, reaching 1,490 m at 14:00 (Table 3). Numerous ozone photochemical reactions were initiated in the daytime, and the vertical mixing near the ground was intense, resulting in similar ozone concentrations at the two heights during the day. On the other hand, during nighttime, the “titration” consumption of NO was evident in the lower layer due to the high NO concentration. The dry deposition of ozone (Ripperton and Vukovich, 1971) also led to a more significant loss in the lower layers, and the atmospheric turbulence weakened. The vertical mixing at different altitudes was lower during daytime, so the ozone concentration in the lower layer was lower than in the upper layer.
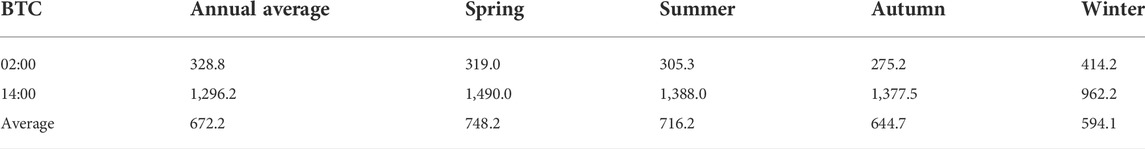
TABLE 3. Atmospheric boundary layer height (m) at Shenyang in 2018.
In summer, the ozone concentration was higher at the low layer than at the high layer during daytime and nighttime, while the difference between the two heights was higher in the daytime than at night. The transport of ozone and its precursors by the Asian summer monsoon (ASM) during the day, combined with the intense local photochemical reactions, resulted in a prominent ozone concentration in the lower layer (Liu et al., 2019a). At night, NO transported by ASM and locally emitted NO simultaneously consumed ozone at both heights. More ozone was consumed at the low level than the high level because NO was more concentrated at the low level. Furthermore, vertical mixing in summer, even at night, makes the ozone concentrations similar in both layers.
We analyzed the corresponding meteorological factors in summer at low and high layer heights in Shenyang (Figure 6). Lower air temperature, higher relative humidity, and higher wind speed existed at the high layer height in summer than at the low layer, whose vertical distribution suggests unstable atmosphere stratification (Li et al., 2019). Also, the profile of the vertical speed of airflow indicated that the area over the observation site (123.41°E, 41.73°N) from the ground to 990 hPa (about 100 m) was a weak updraft area (Figure 7A). A typical updraft at 18UTC on 7 July 2018 over Shenyang is shown in Figure 7B, bringing pollutants upward thus shrinking the concentration differences between the low and high layers. All meteorological elements were advantageous to the vertical mixing of pollutants.
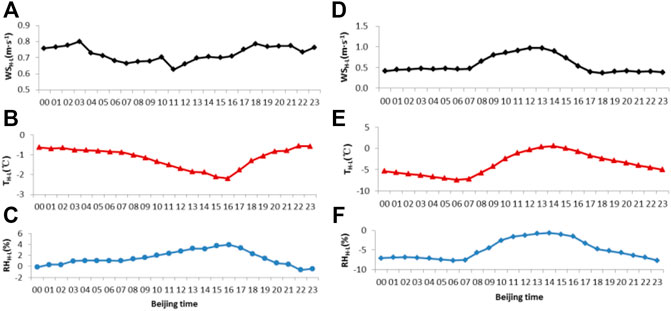
FIGURE 6. Diurnal variation (high minus low) of (A) wind speed, (B) air temperature, (C) relative humidity in summer, and the corresponding values (D–F) in winter in Shenyang.
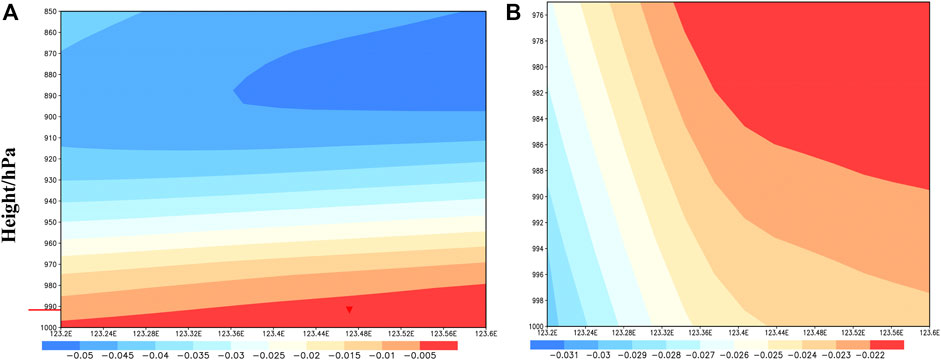
FIGURE 7. Vertical profile of airflow speed (unit: Pa/s, positive value is downdraft; negative value is updraft) along 41.73°N (A) in summer and (B) at 18UTC on 7 July 2018 over Shenyang.
Further, the ozone concentration variations in autumn and summer were similar, i.e., higher at the low layer than at the high layer. At the same time, the difference (about 16 μg m−3) between the two heights was stable throughout the day. Also, the ozone concentration decreased significantly in autumn than in summer, only being 50.56–90.16 μg m−3 in the low layer and 35.93–70.86 μg m−3 in the high layer.
During winter, the ozone concentration was lower at the low layer than at the high layer throughout the day. In contrast, the difference between the two heights was slight in the daytime but significant in the nighttime. An inverse temperature occurred in winter, and wind shear was weaker in winter than in summer, while the horizontal wind speed was also meager (Figure 6D). Under these meteorological conditions, pollutant transport in vertical and horizontal directions was slow (Li et al., 2019). Thus, local photochemical generation and consumption of ozone were more critical. During winter, the ozone concentration was lower in the high layer than in the low layer. And the first reason is as follows: ozone was generated and mixed vertically along the boundary layer during daytime. NO consumed the uniformly mixed ozone at nighttime. The difference in NO consumption by ozone at different heights during nighttime was different. Another reason was that central heating during winter, adopted in Shenyang in recent years, ensured that the total emissions (including NOx) from elevated point sources were effectively controlled (Yang et al., 2005). Thus, NO emissions were lesser at the upper layer than at the lower layer. The same was the ozone consumption, resulting in a lower ozone concentration in the lower layer than in the upper layer.
Summary and conclusion
We monitored ozone concentration and meteorological factors at the low layer (≈15 m) and high (≈90 m) layer in Shenyang, northeast China. Then, we analyzed the temporal variation of ozone concentration from 1 October 2018, to 30 September 2019. We also discussed the relationships between ozone concentration and meteorological factors (i.e., air temperature, relative humidity, and wind speed).
The ozone concentration in the four seasons peaked at the low layer first, early in winter, and late in summer. The peak at the high layer height lagged for 1–2 h. For spring, the ozone concentration in the daytime was slightly higher at the low layer than at the high layer, with a meager difference between the two heights. Whereas during the nighttime, the concentration was lower at the low layer than at the high layer, with an increased corresponding difference. In summer, the ozone concentration was higher at the low layer than at the high layer throughout the day. The difference between the heights was higher during the day than at night. During autumn, the variation in the ozone concentration was similar to that in summer, while the difference between the heights was stable throughout the day. Finally, in winter, the ozone concentration was lower at the low layer than at the high layer during daytime and nighttime, with some slight difference between the two heights in the daytime but higher at night.
Data availability statement
The original contributions presented in the study are included in the article/supplementary material, further inquiries can be directed to the corresponding authors.
Author contributions
Conceptualization, LL, and NL; methodology, LL, and NL; software, LS, and HW; validation, LL. and X.L; formal analysis, LL, XL, and YM; investigation, LL, XL, and YW; resources, LL, NL, and YW; data curation, LL, and HW; writing-original draft preparation, LL, and NL; writing-review and editing, LL, LS, ZZ, HW, XL, YW, NL, and YM; project administration, LL, and YM. All authors have read and agreed to the submitted version of the manuscript.
Funding
This research was funded by the Key Project of the National Natural Science Foundation of China (grant number: 41730647), Natural Science Foundation of Liaoning Province (No. 2022-MS-098 ), Basic Scientific Research Fund of Shenyang Institute of Atmospheric Environment (2020SYIAEZD1) and Key R&D Program of Science and Technology Department of Liaoning Province (2019JH8/10300095).
Acknowledgments
We thank the Shenyang Environmental Monitoring Center for providing us with the air quality monitoring data used in this study. The English in this document has been checked by two professional editors, both native speakers of English.
Conflict of interest
The authors declare that the research was conducted in the absence of any commercial or financial relationships that could be construed as a potential conflict of interest.
Publisher’s note
All claims expressed in this article are solely those of the authors and do not necessarily represent those of their affiliated organizations, or those of the publisher, the editors and the reviewers. Any product that may be evaluated in this article, or claim that may be made by its manufacturer, is not guaranteed or endorsed by the publisher.
References
An, J., Zou, J., Wang, J., Lin, X., and Zhu, B. (2015). Differences in ozone photochemical characteristics between the megacity Nanjing and its suburban surroundings, Yangtze River Delta, China. Environ. Sci. Pollut. Res. 22, 19607–19617. doi:10.1007/s11356-015-5177-0
Beekmann, M., Ancellet, G., and Megie, G. (1994). Climatology of tropospheric ozone in southern Europe and its relation to potential vorticity. J. Geophys. Res. 99, 12 841–912 853. doi:10.1029/94jd00228
Banta, R. M., Pichugina, Y. L., and Brewer, W. A. (2006). Turbulent velocity-variance profiles in the stable boundary layer generated by a nocturnal low-level jet. J. Atmos. Sci. 63, 2700–2719. doi:10.1175/jas3776.1
Cheng, N. L., Li, R. Y., Xu, C. X., Chen, Z. Y., Chen, D. L., Meng, F., et al. (2019). Ground ozone variations at an urban and a rural station in beijing from 2006 to 2017: Trend, meteorological influences and formation regimes. J. Clean. Prod. 235, 11–20. doi:10.1016/j.jclepro.2019.06.204
China State Bureau of Technical SupervisionState Environmental Protection Bureau of China (1992). Technical methods of formulating local emission standards for air pollutants (GB/T 13201-91). Beijing: China Standards Press. Available at: https://www.mee.gov.cn/ywgz/fgbz/bz/bzwb/other/qt/199206/t19920601_67580.shtml.
Cooper, O. R., Stohl, A., Eckhardt, S., Parrish, D. D., Oltmans, S. J., Johnson, B. J., et al. (2005). A springtime comparison of tropospheric ozone and transport pathways on the east and west coasts of the United States. J. Geophys. Res. 110, D05S90. doi:10.1029/2004JD005183
Dai, H., Zhu, J., Liao, H., Li, J., Liang, M., Yang, Y., et al. (2021). Co-Occurrence of ozone and PM2.5 pollution in the yangtze river delta over 2013–2019: Spatiotemporal distribution and meteorological conditions. Atmos. Res. 249, 105363. doi:10.1016/j.atmosres.2020.105363
Deng, T. T., Zhao, J. H., Zhang, Z. X., Sun, Y. Y., and Yang, Z. (2022). Spatiotemporal distribution of ozone concentration in different districts of wuhan during 2016—2020. J. Hubei Univ. 44 (4). doi:10.3969/j.issn.1000-2375.2022.00.004
Ding, A. J., Wang, T., Thouret, V., Cammas, J. P., and Nédélec, P. (2008). Tropospheric ozone climatology over Beijing: analysis of aircraft data from the MOZAIC program. Atmos. Chem. Phys. 8, 1–13.
Guo, H., Ling, Z. H., Cheung, K., Jiang, F., Wang, D. W., Simpson, I. J., et al. (2013). Characterization of photochemical pollution at different elevations in mountainous areas in Hong Kong. Atmos. Chem. Phys. 13, 3881–3898. doi:10.5194/acp-13-3881-2013
Han, J. H., Wang, J., Li, Z., Wang, K. L., Bai, X. C., and Gu, Y. (2021). Variation characteristics of ozone concentration and its influencing factors in Hohhot. J. Arid. Land Resour. Environ. 35 (12), 73–78. doi:10.13448/j.cnki.jalre.2021.328
He, G. W., Wu, D., Wu, C., Li, M., Deng, T., Wu, W. C., et al. (2020). Characterizing the near-surface vertical variations of summertime O3 in Jiaxing. China. Environ. Sci. 40 (10), 4265–4274. (in Chinese with English abstract). doi:10.19674/j.cnki.issn1000-6923.2020.0474
Hu, L., Cheng, L., Wang, Q., Hu, S. L., and Liu, Y. (2021). Analysis of ozone concentration characteristics and key meteorological factors in Xi’an. J. Arid. Land Res. Environ. 35 (6), 102–109. (in Chinese with English abstract). doi:10.13448/j.cnki.jalre.2021.164
Im, U., Incecik, S., Guler, M., Tek, A., Topcu, S., Unal, Y. S., et al. (2019). Analysis of surface ozone and nitrogen oxides at urban, semi-rural and rural sites in Istanbul, Turkey. Sci. Total Environ. 443, 920–931. doi:10.1016/j.scitotenv.2012.11.048
Li, X. L., Ma, Y. J., Wang, Y. F., Wei, W., Zhang, Y. H., Liu, N. W., et al. (2019). Vertical distribution of particulate matter and its relationship with planetary boundary layer structure in Shenyang, Northeast China. Aerosol Air Qual. Res. 19, 2464–2476. doi:10.4209/aaqr.2019.06.0311
Li, Z. Y., Yang, L. F., Hua, D. Z., Fang, J. R., Huang, W., Sun, L., et al. (2021). Spatial pattern of surface ozone and its relation with meteorological variables in China during 2013-2018. Res. Environ. Sci. 34 (9), 2094–2104. (in Chinese with English abstract). doi:10.13198/j.issn.1001-6929.2021.06.16
Liu, N., Li, X., Ren, W., Li, L., Su, C., and Wang, C. (2021). Concentration characteristics and photochemical reactivities of VOCs in Shenyang, China. Atmosphere 12, 1240. doi:10.3390/atmos12101240
Liu, N. W., Lin, W. L., Ma, J. Z., Xu, W. Y., and Xu, X. B. (2019a). Seasonal variation in surface ozone and its regional characteristics at global atmosphere watch stations in China. J. Environ. Sci. 77 (3), 291–302. doi:10.1016/j.jes.2018.08.009
Liu, N. W., Ren, W. H., Li, X. L., Ma, X. G., Zhang, Y. H., and Li, B. K. (2019b). Distribution and urban-suburban differences in ground-level ozone and its precursors over Shenyang, China. Meteorol. Atmos. Phys. 131, 669–679. doi:10.1007/s00703-018-0598-1
Liu, N. W. (2019). Seasonal-spatial variations of surface ozone over China and the influence of long range transport. Beijing: Chinese Academy of Meteorological Sciences.
Logan, J. A. (1994). Trends in the vertical distribution of ozone: An analysis of ozonesonde data. J. Geophys. Res. 99 (25), 25553–25585. doi:10.1029/94jd02333
Logan, J. A. (1985). Tropospheric ozone: Seasonal behavior, trends, and anthropogenic influence. J. Geophys. Res. 90, 10463–10482. doi:10.1029/jd090id06p10463
Lyu, X., Guo, H., Zhang, W., Cheng, H., Yao, D., Lu, H., et al. (2021). Ozone and its precursors in a high-elevation and highly forested region in central China: Origins, in-situ photochemistry and implications of regional transport. Atmos. Environ. X. 259, 118540. doi:10.1016/j.atmosenv.2021.118540
Ma, J. Z., Zhou, X. J., and Hauglustaine, D. (2002). Summertime tropospheric ozone over China simulated with a regional chemical transport model 2. Source contributions and budget. J. Geophys. Res. 107, 4612. doi:10.1029/2001jd001355
Ma, Z. Q., Zhang, X. L., Xu, J., Zhao, X. J., and Meng, W. (2011). Characteristics of ozone vertical profile observed in the boundary layer around Beijing in Autumn. J. Environ. Sci. 23, 1316–1324. doi:10.1016/s1001-0742(10)60557-8
Nakanishi, M., and Niino, H. (2003). An improved mellor-yamada level-3 model with condensation physics: Its design and verification. Bound. Layer. Meteorol. 112, 1–31. doi:10.1023/b:boun.0000020164.04146.98
Nielsen-Gammon, J. W., Powell, C. L., Mahoney, M. J., Angevine, W. M., Senff, C., White, A., et al. (2008). Multisensor estimation of mixing heights over a coastal city. J. Appl. Meteorol. Climatol. 47, 27–43. doi:10.1175/2007jamc1503.1
Oufdou, H., Bellanger, L., Bergam, A., and Khomsi, K. (2021). Forecasting daily of surface ozone concentration in the grand Casablanca region using parametric and nonparametric statistical models. Atmosphere 12, 666. doi:10.3390/atmos12060666
Pu, X., Wang, T., Huang, X., Melas, D., Zanis, P., Papanastasiou, D. K., et al. (2017). Enhanced surface ozone during the heat wave of 2013 in Yangtze River delta region, China. Sci. Total Environ. 603-604, 807–816. doi:10.1016/j.scitotenv.2017.03.056
Ridel, T. P., Wolfe, G. M., Danas, K. T., Gilman, J. B., Kuster, W. C., Bon, D. M., et al. (2014). An MCM Modeling Study of Nitryl Chloride (CINO2) impacts on oxidation, ozone production and nitrogen oxide partitioning in polluted continental outflow. Atmos. Chem. Phys. 14, 3789–3800. doi:10.5194/acp-14-3789-2014
Ripperton, L. A., and Vukovich, F. M. (1971). Gas phase destruction of tropospheric ozone. J. Geophys. Res. 76, 7328–7333. doi:10.1029/jc076i030p07328
Shi, C., Wang, D., Liu, R., Zhou, R., Li, D., Wang, W., et al. (2015). A study of aerosol optical properties during ozone pollution episodes in 2013 over Shanghai, China. Atmos. Res. 153, 235–249. doi:10.1016/j.atmosres.2014.09.002
Stathopoulou, E., Mihalakakou, G., Santamouris, M., and Bagiorgas, H. S. (2008). On the impact of temperature on tropospheric ozone concentration levels in urban environments. J. Earth Syst. Sci. 117, 227–236. doi:10.1007/s12040-008-0027-9
Sun, Y., Wang, Y. S., and Zhang, C. C. (2010). Vertical observations and analysis of PM2.5, O3, and NO x at Beijing and Tianjin from towers during summer and Autumn 2006. Adv. Atmos. Sci. 27 (1), 123–136. doi:10.1007/s00376-009-8154-z
Wang, W. X., Chai, F. H., Ren, Z. H., Wang, X. F., Wang, S. L., Li, H., et al. (2019a). Process, achievement and experience of air pollution control in China since the founding of the People’s Republic of China 70 years ago. Res. Environ. Sci. 32 (10), 1621–1635. (in Chinese with English abstract). doi:10.13198/j.issn.1001-6929.2019.09.15
Wang, X. Q., Xiang, Y., Liu, W. T., Yun, L., Lv, L. H., Zhang, M. D., et al. (2021). Characteristics and source apportionment of the vertical distribution of ozone at a site of the pearl river delta region of China. Earth Space Sci. 8, e2020EA001578. doi:10.1029/2020ea001578
Wang, Y., Du, H., Xu, Y., Lu, D., Wang, X., and Guo, Z. (2018). Temporal and spatial variation relationship and influence factors on surface urban heat island and ozone pollution in the Yangtze River Delta, China. Sci. Total Environ. 631/632, 921–933. doi:10.1016/j.scitotenv.2018.03.050
Wang, Z., Li, J., and Liang, L. (2020). Spatio-temporal evolution of ozone pollution and its influencing factors in the Beijing-Tianjin-Hebei urban agglomeration. Environ. Pollut. 256, 113419. doi:10.1016/j.envpol.2019.113419
Wang, Z., Lv, J., Tan, Y., Guo, M., Gu, Y., Xu, S., et al. (2019b). Temporospatial variations and spearman correlation analysis of ozone concentrations to nitrogen dioxide, sulfur dioxide, particulate matters and carbon monoxide in ambient air, China. Atmos. Pollut. Res. 10, 1203–1210. doi:10.1016/j.apr.2019.02.003
Xiong, X. P., Shen, R. S., Suo, C. N., Li, E. J., and Zhang, W. (2022). Analysis of relationship between ozone mass concentration and meteorological factors in Cangzhou of Hebei Province. J. Arid. Meteoro. 40 (1), 108–113. (In Chinese with English abstract). doi:10.11755/j.issn.1006-7639(2022)-01-0108
Xu, X., Lin, W., Wang, T., Yan, P., Tang, J., Meng, Z., et al. (2008). Long-term trend of surface ozone at a regional background station in eastern China 1991-2006: Enhanced variability. Atmos. Chem. Phys. 8, 2595–2607. doi:10.5194/acp-8-2595-2008
Yang, T., Hao, J. M., Guo, H. C., and Zhang, M. (2005). Study on SO2 total amount control in Hunnan Shenyang. Environ. Prot. Sci. 31, 58–60. (in Chinese with English abstract). doi:10.3969/j.issn.1004-6216.2005.02.020
Yu, R., Lin, Y., Zou, J., Dan, Y., and Cheng, C. (2021). Review on atmospheric ozone pollution in China: Formation, spatiotemporal distribution, precursors and affecting factors. Atmosphere 12, 1675. doi:10.3390/atmos12121675
Zhang, J. Q., Li, D., Bian, J. C., Xuan, Y. J., Chen, H. B., Bai, Z. X., et al. (2021). Long-term ozone variability in the vertical structure and integrated column over the North China Plain: results based on ozonesonde and Dobson measurements during 2001-2009. Environ. Res. Lett. 16, 074503
Keywords: vertical observation, ozone, meteorological factor, near-surface, correlation
Citation: Li L, Liu N, Shen L, Zhao Z, Wang H, Wang Y, Li X and Ma Y (2022) Ozone concentration at various heights near the surface layer in Shenyang, Northeast China. Front. Environ. Sci. 10:1011508. doi: 10.3389/fenvs.2022.1011508
Received: 04 August 2022; Accepted: 23 August 2022;
Published: 13 September 2022.
Edited by:
Honglei Wang, Nanjing University of Information Science and Technology, ChinaReviewed by:
Jinhui Gao, Chengdu University of Information Technology, ChinaCheng Xinghong, Chinese Academy of Meteorological Sciences, China
Copyright © 2022 Li, Liu, Shen, Zhao, Wang, Wang, Li and Ma. This is an open-access article distributed under the terms of the Creative Commons Attribution License (CC BY). The use, distribution or reproduction in other forums is permitted, provided the original author(s) and the copyright owner(s) are credited and that the original publication in this journal is cited, in accordance with accepted academic practice. No use, distribution or reproduction is permitted which does not comply with these terms.
*Correspondence: Liguang Li, liliguang@iaesy.cn; Ningwei Liu, liunw@iaesy.cn