 Shamal Shasang Kumar1†
 Owais Ali Wani1*†
 Shakeel Ahmad Mir1
 Subhash Babu2*Vikas Sharma3Majeed Ul Hassan Chesti1Zahoor Ahmad Baba1Parvaze Ahmad Sofi1Fehim Jeelani Wani1Shahnawaz Rasool Dar1
 Raghavendra Singh4Devideen Yadav5
- 1Sher-e-Kashmir University of Agricultural Sciences and Technology of Kashmir, Srinagar, India
- 2Division of Agronomy, ICAR, Indian Agricultural Research Institute, New Delhi, India
- 3Sher-e-Kashmir University of Agricultural Sciences and Technology of Jammu, Jammu, India
- 4ICAR, Indian Institute of Pulses Research, Kanpur, India
- 5ICAR, Indian Institute of Soil and Water Conservation (ICAR), Dehradun, India
Food security and environmental health are directly linked with soil carbon (C). Soil C plays a crucial role in securing food and livelihood security for the Himalayan population besides maintaining the ecological balance in the Indian Himalayas. However, soil C is being severely depleted due to anthropogenic activities. It is well known that land use management strongly impacted the soil organic carbon (SOC) dynamics and also regulates the atmospheric C chemistry. Different types of cultivation practices, i.e., forest, plantations, and crops in the Kashmir Himalayas, India, has different abilities to conserve SOC and emit C in the form of carbon dioxide (CO2). Hence, five prominent land use systems (LUC) (e.g., natural forest, natural grassland, maize-field-converted from the forest, plantation, and paddy crop) of Kashmir Himalaya were evaluated to conserve SOC, reduce C emissions, improve soil properties and develop understanding SOC pools and its fractions variations under different land use management practices. The results revealed that at 0–20 cm and 20–40 cm profile, the soil under natural forest conserved the highest total organic carbon (TOC, 24.24 g kg−1 and 18.76 g kg−1), Walkley-black carbon (WBC, 18.23 g kg−1 and 14.10 g kg−1), very-labile-carbon (VLC, 8.65 g kg−1, and 6.30 g kg−1), labile-carbon (LC, 3.58 g kg−1 and 3.14 g kg−1), less-labile-carbon (VLC, 2.59 g kg−1, and 2.00 g kg−1), non-labile-carbon (NLC, 3.41 g kg−1 and 2.66 g kg-1), TOC stock (45.88 Mg ha−1 and 41.16 Mg ha−1), WBC stock (34.50 Mg ha−1 and 30.94 Mg ha−1), active carbon pools (AC, 23.14 Mg ha−1 and 20.66 Mg ha−1), passive carbon pools (PC, 11.40 Mg ha−1 and 10.26 Mg ha−1) and carbon management index (CMI, 100), followed by the natural grassland. However, the lowest C storage was reported in paddy cropland. The soils under natural forest and natural grassland systems had a greater amount of VLC, LC, LLC, and NLC fraction than other land uses at both depths. On the other hand, maize-field-converted-from-forest-land-use soils had a higher proportion of NLC fraction than paddy soils; nonetheless, the NLC pool was maximum in natural forest soil. LUS based on forest crops maintains more SOC, while agricultural crops, such as paddy and maize, tend to emit more C in the Himalayan region. Therefore, research findings suggest that SOC under the Kashmir Himalayas can be protected by adopting suitable LUS, namely forest soil protection, and by placing some areas under plantations. The areas under the rice and maize fields emit more CO2, hence, there is a need to adopt the conservation effective measure to conserve the SOC without compromising farm productivity.
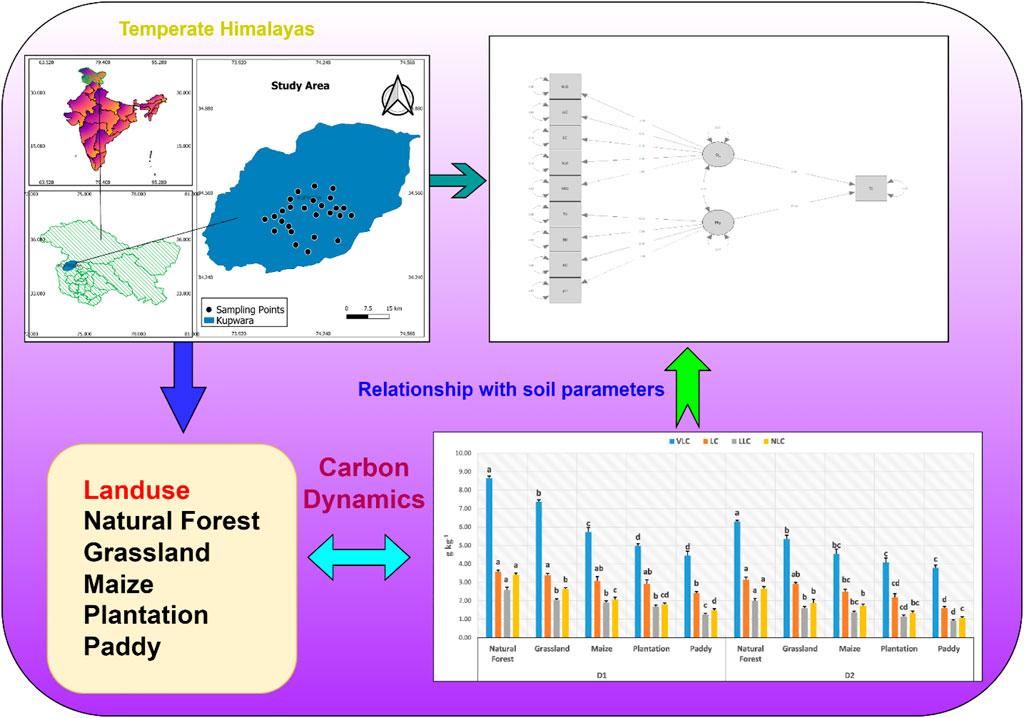
Graphical Abstract
Introduction
Soil organic carbon (SOC) strongly impacts the global C cycle and regulates ecosystem functionality (Yadav et al., 2021; Yadav et al., 2022). SOC is also critical for the preservation of soil fertility and has a significant impact on various soil characteristics and processes (Pan et al., 2009). SOC consists of multiple compounds, from simple to more complex molecules, which can have different stability (Babu et al., 2020; Gerzabek et al., 2022). It is advisable that measuring rapidly changing SOC pools (labile pools) might be more informative in assessing soil quality (Anantha et al., 2022). Labile carbon (LC) mainly originates from the decomposition of plant and faunal biomass, root exudates, and deceased microbial biomass (Ahmed et al., 2022). The LC pool is directly available for microbial activity and, hence, is considered the primary energy source for microorganisms (Bei et al., 2022). Therefore, LC has the potential to act as an indicator of soil functions, in particular: nutrient cycling, soil aggregate formation, carbon sequestration, and habitat provision for biodiversity (Yadav et al., 2019; Singh R. et al., 2021; Yadav et al., 2021). Particulate organic matter carbon is very important for soil aggregate stability, nutrient cycling, etc., and microbial biomass carbon (MBC) and mineralizable C are also considered labile organic carbon fractions (Yadav et al., 2021). Whereas, the passive pool of SOC, also known as the non-labile pool (NLC), is more stable, as it is made up of refractory SOC fractions that form organic-mineral complexes with soil minerals and are slowly broken down by microbial activity (Wiesenberg et al., 2010). The labile SOC pool is critical for the immediate flow of CO2, which is a better measure of the quality of the soil to evaluate variations caused by changes in land use (Vieira et al., 2007), whereas the non-labile SOC pool adds on to the TOC stock. SOC comprises of organic material except coasrse roots and that pool of biomass which is below surface. Key indicator for soil fertility and soil soility is SOC it also determines CO2 fixation. Soil biological and chemical properties are greatly influenced by SOC.
Land use change and the associated management practices exert a strong impact on SOC dynamics (Babu et al., 2020). Land-use change currently contributes to a net emission of 1.4 Pg C yr−1 (Arneth et al., 2019). Anthropogenic factors, such as the management practices associated with agricultural activity, has a more tenacious impact on SOC stock than climate change (Kumar et al., 2020; Wu et al., 2022). Transitions in land utilization/land cover patterns are considered the crucial factor that affects the SOC pools. Land-use changes have resulted in a decrease in the cumulative SOC content by approximately 55 ± 78 Gt since 1750 (Lal, 2004). Misplacing in input (e.g., plant litter) and output rates (e.g., SOC mineralization) of SOM as a result of alterations in plant community and land management practice is the major cause of SOC depletion (Dawson and Smith, 2007). Several studies have shown the decrease in SOC storage by changes from natural land-use systems to artificial land use, and the transition of an artificial land-use pattern to a natural soil-use pattern ultimately causes an increment in SOC reservoirs (Guo and Gifford, 2002; Wei et al., 2014; Hobley et al., 2015).
The hill and mountain environment covers 54 Mha of the total geographical area of 329 Mha of India (Kumar, 2018). The Indian Himalayas are a mountain range characterized by varying altitudes, slopes, aspects, and climate resulting in wide ecological diversity. The northwest Himalayas (NWH) spread over Jammu & Kashmir, Himachal Pradesh, and Uttarakhand and cover 17.7 Mha of the land of India (Arora and Bhatt, 2016). The valleys of NWH receive ∼1,600–2000 mm of precipitation and have fertile soil (Bhardwaj et al., 2021). While soil properties, including SOC, is decreased over the years due to improper land use practices (Singh et al., 2019), the adoption of improved land use practices (cropping systems, conservation tillage, nutrient management, etc.) has been reported to enhance the SOC, microbial carbon, and available N, P and K contents of Himalayan soils (Gogoi et al., 2021). The C status of the Himalayan soil varies according to the land use pattern followed, i.e., forests, plantation crops, and grasses are major C sinks because of their high storage potential and low decomposition processes compared to other agricultural crops (Babu et al., 2021; Yadav et al., 2021; WANI et al., 2022). Numerous studies also suggested that agricultural soils or intensively cultivated soils have lower labile C than forest and grassland soils (Geraei et al., 2016; Kumar et al., 2022). However, the magnitude of the reduction of soil C depends on the soil types, management practices adopted, and climatic conditions. The distribution of SOC into labile and non-labile or recalcitrant pools under different land uses varied significantly in most studies (Sainepo et al., 2018; Yeasmin et al., 2020). Because labile SOC fractions have faster turnover rates than recalcitrant fractions and are more responsive to anthropogenic and management-driven changes than total SOC, they are given higher priority as an indicator. (Mikha et al., 2013; Shao et al., 2015; Yu et al., 2017). In undisturbed soils, accumulation of more labile C occurs within aggregates that lead to enhanced protection, and thus there are differences found in the chemical composition of unprotected and protected SOM (Aduhene-Chinbuah et al., 2022). Since the types of land use systems influence the quantity and quality of litter inputs, decomposition, and organic matter stabilization/protection processes in soils, it is essential to control SOM storage (Qafoku, 2015; von Haden et al., 2019).
Increasing population pressure with growing food demand causes a rampant land-use change in the ecologically and environmentally fragile region of the Himalayas. In addition, the glaciers melting due to increasing temperature affects the natural vegetation and land use practices in the region, thus causing depletion in the soil C content. As a result, identifying more vulnerable SOM fractions can broaden the understanding and trajectories of SOC during the early stages of land use and management changes. Various studies regarding different SOC pools have been conducted in different parts of the hilly ecosystems like the eastern Himalayas (Yadav et al., 2019; Babu et al., 2020) and western Himalayas (Yadav et al., 2019). However, very few studies on changes in SOC due to land use practices i.e., forest, plantation, agricultural cropland, etc., in the Kashmir Himalayas have so far been conducted. Hence, a comprehensive study on the effects of land use management on soil C stocks is needed to identify viable land-use systems for C buildup in Kashmir Himalaya in face of changing climatic parameters. Furthermore, C- stock measurement is also required by an international agreement between 192 countries in the world that have joined to form a treaty (Mathew et al., 2020).
The Kashmir Himalaya is very rich in natural vegetation and plantation crops and has fertile land to cultivate various crops. This study is conducted to estimate C loss while shifting one land use system to others and also to find a suitable land use pattern for Kashmir Himalayas. Certainly, the findings of this study can help in choosing appropriate land use patterns by the farmers of the region to achieve sustainable crop productivity and income while conserving the soil resources of the region. The study also aims to identify the most stable and quickly depleting form of SOC due to practicing various land use management practices in the Himalayan region. The findings of the current study will assist policymakers in planning soil-supportive and environmentally robust land use policy for sustainable land management and livelihood security of the Himalayas population.
Materials and methods
Study site
The present study was conducted in the Kupwara District of North Kashmir, India. The study site is located in an environmental hotspot in the temperate Himalayas of India. The study site lies between 34°31′32.8544 ″N and 74°15′19.4653 ″E with an elevation ranging from 1,500 to 3,500 m above sea level (Figure 1). Soils of the region are mainly Inceptisols and Entisols which are primarily composed of sandy loam to clayey in texture. Valley has flat to slightly undulating topography. The climate of the study site is Mediterranean-type-temperate-cum with a minimum and maximum temperature of -15°C–35°C. The winter season starts in November, and extreme winter conditions continue until March. The average maximum temperature of the study site was 35°C, while the average minimum temperature was −10°C. The annual rainfall is about 869 mm over about 60 days in the form of rain and snow. Kupwara District is hilly and mountainous in the north, west, and east regions, consisting of Lesser Himalayan Pir-Panjal ranges with wide intermountain valleys. The valley has a diverse range of flora, wildlife, and domesticated species in its forest lands. Plant diversity is critical for the survival of practically all terrestrial ecologies, as humans and animals rely on plants directly and indirectly. The district’s forest types range in altitude from low to high (1,500–3,500 m). The forests are dominated by broadleaved trees such as Populus deltoides, Salix species, Pinus wallichiana, Abies pindrow, and Betula utilis. Farmers in the valley grow paddy, maize, and wheat, as well as apples, walnuts, and other leafy greens.
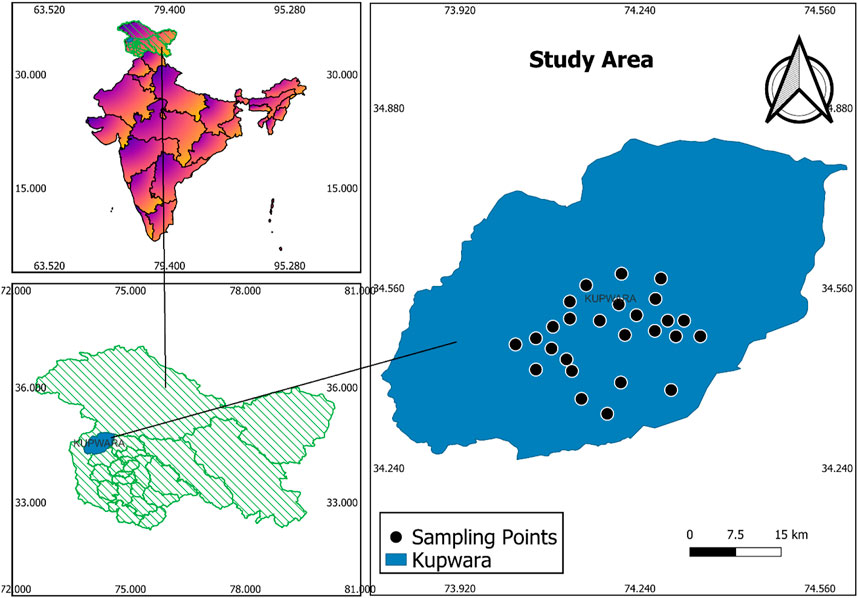
FIGURE 1. Land use systems of the study site.
Soil sampling and sample preparation
Soil samples were collected from five land uses, viz., natural forest, natural grassland, maize-field-converted-from-forest, plantation, and paddy land, during 2020. The natural forests mainly comprise pine plants, with minimal felling in the lower boundaries. Natural grassland had a moderate to severe grazing use pattern. Under maize-field-converted-from-forest; farmers follow a subsistence level of cultivation of local maize genotypes with minimum inputs (basically organic manures) and tillage on the forest margins. Concerning plantation land use, apple orchards were considered. Farmers mainly use moderate quantities of inorganic fertilizers and plant protection chemicals in apple orchards. Under paddy land use; farmers adopted traditional tillage practices for the cultivation of local genotypes. A total of twenty-five sites were selected (five sites for each land use) for the study. Composite soil samples were collected using a soil auger for 0–20 cm (surface/D1) and 20–40 cm (sub-surface/D2) depth, with three replicates, and every replicate sample was composited from six randomly selected sub-samples. The stratified random sampling method was followed. After removal of all stubbles, residues, and undesirable substances, the soil samples collected from each site and depth were homogenized and air-dried at room temperature, ground in a mortar, sieved with a 2 mm sieve, and a 0.5 mm sieve (for SOC), thereafter carefully kept in airtight plastic bags for laboratory analysis.
Analysis of soil organic carbon and pools
The method described by (Walkley and Black, 1934) was used to determine the concentration of soil organic carbon/walkley-black carbon. Organic matter was first oxidized using chromic acid (potassium dichromate + concentrated sulphuric acid), and the unconsumed potassium dichromate was back-titrated against ferrous sulfate (redox titration). Total organic carbon (TOC) was estimated using a modified Mebius-based method (Yeomans and Bremner, 1988). The soil samples were digested at 150°C for 30 min with K2Cr2O7 and H2SO4, following titration by using 0.2 mol (Fe2+) L−1 Mohr salt.
The functional pools of organic carbon (OC) were estimated through a modified (Walkley and Black, 1934) as described by (Chen et al., 2019) using 12.0 N, 18.0 N, and 24.0 N of H2SO4, respectively. The very labile carbon was estimated using organic C oxidizable by 12.0 N H2SO4. The labile carbon was estimated by the differences in SOC oxidizable by 18.0 N and that under 12.0 N H2SO4. The less labile carbon was estimated by the differences in SOC oxidizable under 24.0 N and that under 18.0 N, H2SO4. The non-labile carbon was estimated by the differences between SOC oxidizable under 36.8 N and that under 24.0 N H2SO4.
Analysis of organic carbon stocks and carbon management index
The SOC stocks were calculated as follows, (Jones et al., 2005).
Where; SOC is the soil organic carbon measured in g g−1; ρ is the soil bulk density (g cm−3), and d is the depth of the soil layer (m). The value of 10,000 indicates the stock for 1 ha−1 of land.
The CMI was calculated using the formulae;
CMI = CPI x LI x 100, where CPI is the carbon pool index and LI is the lability index of the soil under a particular land use (Blair et al., 1995).
LI = L in the treatment/L in the reference where L is the carbon lability of the soil
Analysis of soil physico-chemical properties
The soil pH was determined with the help of a glass electrode pH meter (Jackson et al., 1973). The EC of the soil samples was determined using a conductivity bridge in 1:2.5 soil-water suspensions after equilibration for 24 h, using a Solu-bridge conductivity meter (Jackson et al., 1973). The bulk density (ρb) was estimated using the core method (Blake and Hartge, 1986). The modified Kjeldahl digestion method was used to estimate TN in soil. A known weight of soil sample was taken in the presence of concentrated H2SO4 and catalyst mixture under high temperature (420°C) and digested to break down complicated structures into simple structures, thereby releasing N in the form of ammoniacal radicles (NH4+). The digested samples were then distilled by steam with concentrated NaOH (40%), the released NH3 is condensed and absorbed in a known volume (20 ml) of boric acid (4%) with a mixed indicator to form ammonium borate, and the excess of which is titrated with 0.1N HCL (Bremner, 1982).
Statistical analysis
The results on different parameters under laboratory conditions were statistically evaluated according to the procedure outlined by (Gomez and Gomez, 1984). The descriptive statistics-one factor analysis was done by using OPSTAT software. The correlation coefficients were computed using SPSS software version 27.0 (Morgan et al., 1988).
Results and discussion
Effect of land use systems on distribution of TOC and WBC
The total organic carbon (TOC) in surface and sub-surface soil under various land uses ranged from 9.81 to 24.24 g kg−1. The mean values of TOC (g kg−1) in surface and sub-surface depths were 24.24 and 18.76 in the natural forest; 20.52 and 15.60 in natural grassland; 16.98 and 13.44 under maize-field-converted-from-forest; 15.13 and 11.60 in the plantation; 12.76 and 9.81 in soils under paddy land use (Table 1). Among surface soils, the highest TOC mean value was found in natural forest soil, which was 90% higher than in paddy soils (12.76 g kg−1). A similar trend was found in the sub-surface soils, with mean TOC content of 18.76 g kg−1 in natural forests and 9.81 g kg−1 in paddy soils. The natural grassland land use system at both the soil depths also had a significantly higher amount of TOC (20.52 and 15.30 g kg−1) than the maize-field-converted-from-forest system (16.98 and 13.44 g kg−1) and plantation land use (15.13 and 11.60 g kg−1). The Walkley-Black carbon (WBC) in both soil depths was significantly affected by different land-use patterns (Table 2). Natural forests had the highest WBC (18.23 g kg−1 and 14.10 g kg−1) among the different land use types, followed by natural grassland land use (15.42 g kg−1 and 11.73 g kg−1), maize fields converted from forests (12.77 g kg−1 and 10.11 g kg−1), plantations (11.38 g kg−1 and 8.72 g kg−1) and paddy soils (9.59 g kg−1 in and 7.37 g kg−1) at 0–20 and 20–40 cm soil depths respectively.
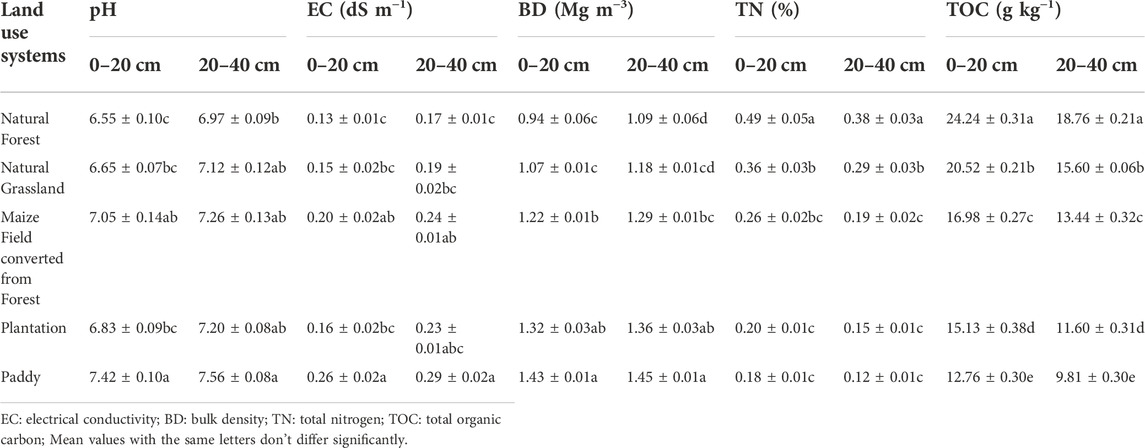
TABLE 1. Soil pH, EC, BD, TN, and TOC in surface and sub-surface soil under diverse land-use systems.
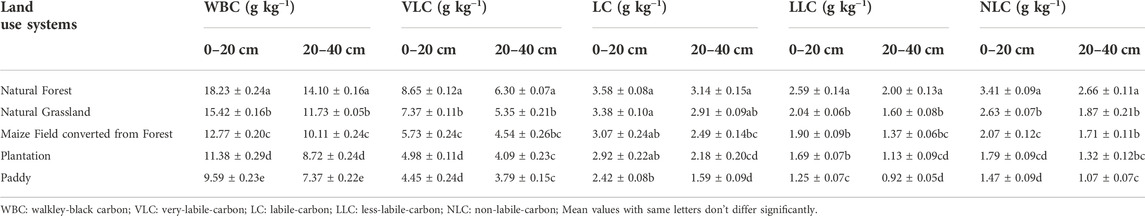
TABLE 2. Functional organic carbon pools in surface and sub-surface soil layers under diverse land-use systems.
The WBC decreased with soil depth. When compared to other land uses, natural forests have a greater TOC due to minimal soil disturbance, and higher levels of C inputs, such as leaf litter and root biomass from natural systems, as well as its recalcitrant characteristic, which limits complete microbial breakdown (Vezzani et al., 2018). The higher carbon under the forest field might be due to the higher soil binding ability of forest trees, which protected soil C from being degraded and lost in the form of CO2 to the atmosphere. The leaf litter is an important part that transports the carbon from plant to soil (Giweta, 2020). Low TOC contents in cropland use other than natural forests imply a significant reduction in TOC from plant species variations, C loss from the soil due to residue removal, soil perturbation, and a small quantity of added biomass to the soil (Raiesi, 2021). Similar findings have been reported by (Sharma et al., 2018) and (Bahadori et al., 2021). The amount of TOC in the soil decreased with depth, possibly due to an increase in OM at the soil surface (Jobbágy and Jackson, 2000). This is supported by the finding of (Sreekanth et al., 2013). Under various land uses in the temperate Himalayan Region, SOC content and OC stocks have ranged from 4.27 to 27.00 g kg−1 and 6.57–54.10 Mg ha−1, respectively (Dar and Sahu, 2018). WBC concentration was substantially greater in natural forest and natural grassland land-use soils than in the other land-use systems investigated.
The WBC content varied greatly among the different land uses in both the surface and sub-surface soil depths. Natural woods had the highest levels of WBC, while paddy soils had the lowest. Higher WBC under natural forest systems under different ecoregions of the world was recorded by many researchers (Prasad et al., 2019; Mourya et al., 2021; WANI et al., 2022). The addition of high levels of inputs, such as leaf litter and root biomass, as well as its recalcitrant nature, high altitude, low temperature, slow rate of mineralization, and role in the augmentation of soil aggregates and ultimately increasing soil OC content, all, contribute to high WBC in natural forests (Nath et al., 2018). Rapid mineralization and C loss from soil-by-soil disturbance and management techniques are to blame for paddy soils’ low WBC content (Chauhan et al., 2014). Furthermore, low WBC content in paddy may be due to long-term cultivation under submerged conditions and mineral fertilizer application, puddling, crop removal during harvesting, breakdown of stable aggregates, and deterioration of soil organic matter, resulting in a degradation of overall soil quality (Yang et al., 2005). The results are further supported by the findings of (Kaur and Bhat, 2017). A consistent decrease in WBC content with depth was noticed in all cultivated lands. That might be due to the addition of animal wastes and plant residues to surface soils (Chibsa and Ta’a, 2009). Also, with an increase in soil depth, a decline in fine roots returned, aeration, and soil microbial activity may have resulted in a comparable reduction in WBC content (Sheng et al., 2015; Kaushal et al., 2020).
Effect of land use systems on functional carbon pools
Across both the soil depths, there was a significant difference in C pools among the different land uses. Data about mean values of VLC under different land uses are presented in Table 2. In both the surface and sub-surface soil depth, VLC was observed to be in the order of; natural forest > natural grassland > maize-field-converted-from-forest > plantation > paddy (Figure 2). A decreasing trend with depth was observed for all the land-use systems having the highest values in the surface layer of soil. Among the different land uses, the natural forest and natural grassland land-use systems had the highest VLC, i.e., 8.65 g kg−1 and 7.37 g kg−1 in 0–20 cm and 6.30 g kg−1 and 5.35 g kg−1 in 20–40 cm depth, respectively. Natural forests had the highest VLC in surface and subsurface (8.65 and 6.30 g kg−1), followed by natural grassland (7.35 and 5.35 g kg−1), maize-field-converted-from-forest (5.73 and 4.54 g kg−1), and plantation (4.98 and 4.09 g kg−1) and paddy soils (4.45 and 3.79 g kg−1). Among the different land uses, the natural forest had the highest LC, i.e., 3.58 g kg−1 in 0–20 cm and 3.14 g kg−1 in 20–40 cm depth. Natural forests had 3.58 and 3.14 g kg−1 labile carbon content at 0–20 cm and 20–40 cm soil depths, respectively, followed by natural grasslands (3.38 and 2.91 g kg−1), maize-field-converted-from-forest (3.07 and 2.49 g kg−1), plantations (2.92 and 2.18 g kg−1), and paddy (2.42 and 1.59 g kg−1) (Table 2). A perusal of the data reveals that the labile carbon content in natural forests at both depths was higher than the other land uses. The plantation-based land-use system had higher labile carbon content than the paddy system at both soil depths. A decreasing trend in labile carbon content with depth was observed under all the land uses, and it followed the order; natural forest > natural grassland > maize-field-converted-from-forest > plantation > paddy (Figure 2). The less labile carbon (LLC) content at 0–20 cm and 20–40 cm soil depth in the natural forest was 2.59 and 2.00 g kg−1, respectively; natural grassland had 2.04 and 1.60 g kg−1, respectively; maize-field-converted-from-forest 1.90 and 1.37 g kg−1, respectively; plantations had 1.69 and 1.13 g kg−1, and paddy soils had 1.25 and 0.92 g kg−1, respectively (Table 2). It was found that the highest LLC content at the surface and sub-surface soil layers was recorded in natural forests, followed by natural grassland and maize-field-converted-from-forests, whereas the lowest was recorded under paddy soils. A decreasing trend in LLC content with depth was observed under all land uses, with the highest value observed in the surface layer. The LLC had the following order at both the soil depths; natural forest > natural grassland > maize-field-converted-from-forest > plantation > paddy, respectively (Figure 2). A decreasing trend in non-labile carbon (NLC) content with depth was observed under all land uses, with the highest value observed in the surface layer. The NLC followed the order; natural forest > natural grassland > maize-field-converted-from-forest > plantation > paddy (Figure 2). The NLC content in surface and the sub-surface soil was 3.41 and 2.66 g kg−1 in the natural forest; 2.63 and 1.87 g kg−1 under natural grassland; 2.07 and 1.71 g kg−1 in maize-field-converted-from-forest; 1.79 and 1.32 g kg−1 in plantations and 1.47 and 1.07 g kg−1 in paddy fields (Table 2). The relationship between C fractions and soil properties is shown in Figure 3 using a structural modeling equation (SEM). The mean values of NLC content in natural forest land use at both soil depths were higher than the other land uses, with the lowest recorded in paddy soils. SOC pools such as VLC, LC, LLC, and NLC are influenced by differences in C inputs, litter/crop residue composition, and species richness among land-use regimes. Natural forests had the most VLC and LC in the surface and subsurface layers, followed by natural grassland, and paddy soils had the least. High VLC and LC fractions in natural forest and natural grassland land use compared to other land uses could be attributed to continuous addition (retention) of easily decomposable plant/leaf litter, high microbial biomass, and mechanisms for protecting added C, all of which contribute to significantly increased soil microbial functions and corresponding increases in VLC and LC fractions. Furthermore, tree spices like Pinus wallichiana and Cedrus deodara have a lot of litterfall. Leaves with a high nitrogen concentration have a greater ability to improve soil LC (Sharma et al., 2014). High concentrations of VLC and LC have been reported by (Benbi et al., 2015) and (Babu et al., 2020) in forests adjacent to other land uses. The low values of VLC and LC in other land-use systems other than native vegetation could be associated with aggregate disruption and more organic matter oxidation in conventional farming systems based on intensive management practices like plowing and harrowing (Bayer et al., 2006). The LLC fraction followed the order as natural forest > natural grassland > maize-field-converted-from-forest > plantation > paddy in both soil depths. The higher LLC in natural forests and low content in paddy soils is due to variations in the plant/tree species found; above-below ground biomass, and its nature of decomposition; and other variables such as climate, which have an intrinsic effect on its decomposition and loss. Natural forests had a significantly higher NLC content than cultivated lands. Higher NLC content in natural forests has also been recorded by (Nath et al., 2018). Usually, forest litters are rich in sources of tannin and wax that are resistant to degradation. This enhances the levels of NLC in natural forests compared to cultivated lands (Nath et al., 2018). The NLC fraction is usually resistant to field management operations and microbial decomposition due to its sorption on fine particles (Sherrod et al., 2005; Sainepo et al., 2018). In general, all the lability-based OC fractions showed a decreasing trend with soil depth (Babu et al., 2021; Xie et al., 2021).
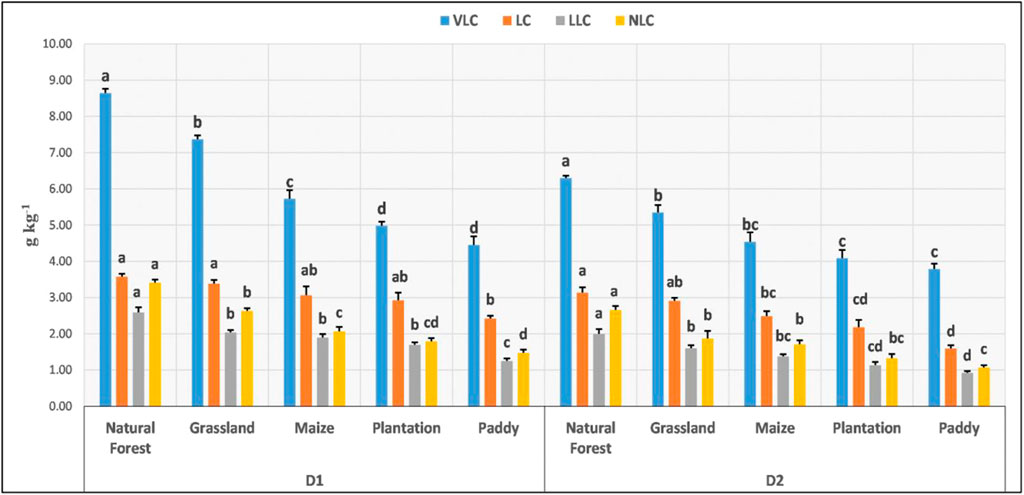
FIGURE 2. Effect of land use on functional organic carbon pools (g kg−1) in 0–20 cm and 20–40 cm soil depth. Error bars indicate the least significant difference (LSD) values at p = 0.05. Mean values with the same letters don’t differ significantly.
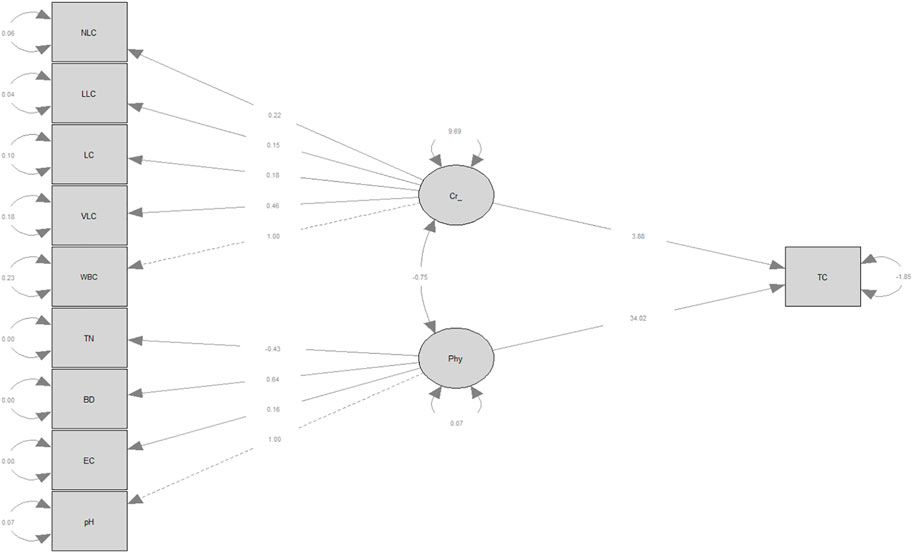
FIGURE 3. Structural equation modeling plot between soil properties and C fractions.
Effect of land use systems on carbon stocks
The TOC stock in natural forest land use (surface soil) was recorded as the highest among the different land uses with a mean of 45.88 Mg ha−1; in the sub-surface, it was 41.16 Mg ha−1 (Table 3). In the natural grassland system (surface soil), the mean TOC stock was 43.93 Mg ha−1; in the sub-surface, it was 36.82 Mg ha−1. The mean TOC stock value in maize-field-converted-from-forest (surface and sub-surface soil) was 41.75 Mg ha−1 and 34.80 Mg ha−1. In the surface layer, the TOC stock under the plantation was 39.73 Mg ha−1, with the sub-surface having a mean of 31.37 Mg ha−1. In paddy soils, TOC stock in surface and sub-surface soil was 36.45 Mg ha−1 and 28.42 Mg ha−1, respectively. The highest TOC stocks (surface and sub-surface) were recorded in natural forests, followed by natural grassland, with the lowest recorded under paddy soils (Figure 4).
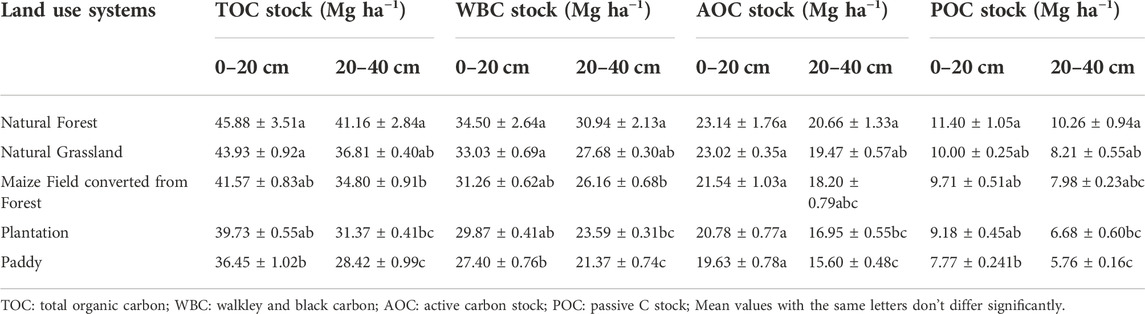
TABLE 3. Organic carbon stocks in surface and sub-surface layers under diverse land use systems.
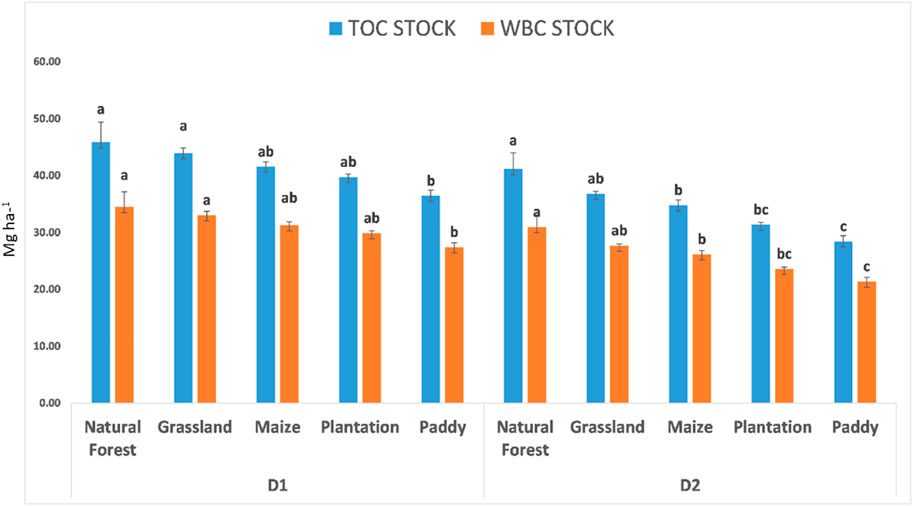
FIGURE 4. Effect of land use on TOC and WBC stocks (g kg−1) in 0–20 cm and 20–40 cm soil depth. Error bars indicate the least significant difference (LSD) values at p = 0.05. Mean values with the same letters don’t differ significantly.
Natural forest land-use systems had the highest WBC stock in surface, and sub-surface soil depth, followed by natural grasslands, and paddy soils had the lowest (Figure 4). The WBC stock in the natural forest land-use system was 34.50 Mg ha−1 and 30.94 Mg ha−1 at the surface and sub-surface, respectively; in the natural grassland system, it was 33.03 Mg ha−1 and 27.68 Mg ha−1; in the maize-field-converted-from-forest system, it was 31.26 Mg ha−1 and 26.16 Mg ha−1; in plantations, it was 29.87 Mg ha−1 and 23.0. The WBC stock had the following order at both the soil depths; natural forest > natural grassland > maize-field-converted-from-forest > plantation > paddy, respectively. The active organic stock (AOC) stocks in the surface and sub-surface layers were 23.14 and 20.66 Mg ha−1 in the natural forest; 23.02 and 19.47 Mg ha−1 under natural grassland; 21.54 and 18.20 Mg ha−1 in maize-field -converted-from-forest; 20.78 and 16.95 Mg ha−1 in plantations and 19.63 and 15.60 Mg ha−1 found in paddy soils (Table 3). The highest AOC stocks were recorded under natural forest land use at both soil depths, followed by natural grasslands, whereas the lowest was recorded in paddy soils (). The AOC stock had the following order at both the soil depths; natural forest > natural grassland > maize-field-converted-from-forest > plantation > paddy, respectively. The POC stocks under different land uses are presented in Table 3. The highest POC stocks at both soil depths were recorded under natural forests, followed by natural grasslands, and the lowest was recorded in paddy soils (Figure 5). The POC stocks in surface and sub-surface layers were 11.40 and 10.26 Mg ha−1 in the natural forest; 10.00 and 8.21 Mg ha−1 under natural grassland; 9.71 and 7.98 Mg ha−1 in maize-field-converted-from-forest; 9.18 and 6.68 Mg ha−1 in plantations; and 7.77 and 5.76 Mg ha−1 in paddy soils. The POC stock had the following order at both the soil depths; natural forest > natural grassland > maize-field-converted-from-forest > plantation > paddy, respectively. The highest TOC stock in surface and sub-surface soil depth was recorded in natural forests, followed by natural grassland, and the lowest in paddy fields. Higher TOC stock in natural forests due to high concentrations of OC, as recorded by (Valbrun et al., 2018) and (Singh R. et al., 2021), due to high leaf litter, less soil disturbance, the presence of a high number of heterogeneous plants with different root structures and less organic matter decomposition as compared to other cultivated lands (Nicodemo et al., 2018). Horticultural land use (plantations) recorded higher TOC stocks as compared to agricultural (paddy) soils since plantations add more litter and input of animal manures, whereas, in agricultural lands, removal of biomass and intensive tillage practices reduce the OC (Hu et al., 2020). Similar results were reported by (Toru and Kibret, 2019). WBC stock is mostly attributed to physiography, altitude, bulk density, organic matter additions, tree proportions, and land disturbances (Turner et al., 2005; Wang et al., 2012). The highest WBC stock was found in natural forest land use, followed by natural grasslands, and the lowest in the surface and subsurface of paddy soils, according to the study. Natural forest land use recorded higher WBC stock due to the above-mentioned reasons and is further supported by (Dhakal et al., 2010) and (Yitbarek et al., 2013). The WBC stock varied with soil depth, and with an increase in soil depth, the WBC stock distribution showed a decreasing trend in all land-use systems, which has been observed in many studies (Sahoo et al., 2019). Similar findings of higher WBC stocks in natural forests as compared to agricultural land uses have been reported by (Ali et al., 2019), (Begum et al., 2020), and (Mir et al., 2020). The active OC pool is a chief source of essential plant nutrients (Mandal et al., 2008) and is involved in crop production and soil quality. This particular pool (active OC) of TOC is more easily and readily influenced by management practices when compared to the passive C pool (Biederbeck et al., 1994) and is regarded as an early indicator of soil quality (Duval et al., 2013) (Duval et al., 2013). The active C pool comprises the VLC and the LC pool (Sainepo et al., 2018) and (Bhattacharjya et al., 2017). Converting carbon-rich forests to croplands depletes carbon stocks quickly (Pan et al., 2009) and jeopardizes ecosystem functioning (Isbell et al., 2011). The maximum AOC stock was recorded in natural forests, and the lowest was found in paddy soils in both soil depths. Similar results have been reported by (Sharma et al., 2018) and (Babu et al., 2020), where the high content of the active C pool was due to the availability of readily decomposable organic matter found throughout the year in forests. Also, the root systems of trees are liable as they exude labile C compounds (Conteh et al., 1997). The passive OC pool in the soil is more stable and recalcitrant (Choudhury et al., 2018), and is made up of the LLC and NLC pools (Wiesenberg et al., 2010). A higher POC stock in natural forests and natural grasslands is attributed to the input of high quantities and quality of plant/leaf litter as compared to cultivated lands. Along a successional gradient (Xiang et al., 2015), reported a significant increase in passive C fractions with increasing litterfall. This implies that the OC retrieved in natural grasslands and natural forests are more stable than that retrieved in other land uses. Physical and chemical conservation of C in undisturbed soils may also account for high POC storage in natural forests and grasslands. The variation in AOC and POC stocks among the different land uses might be explained by wide changes in vegetation type, litter input (Yao et al., 2010), and soil perturbation intensity (Yadav et al., 2022).
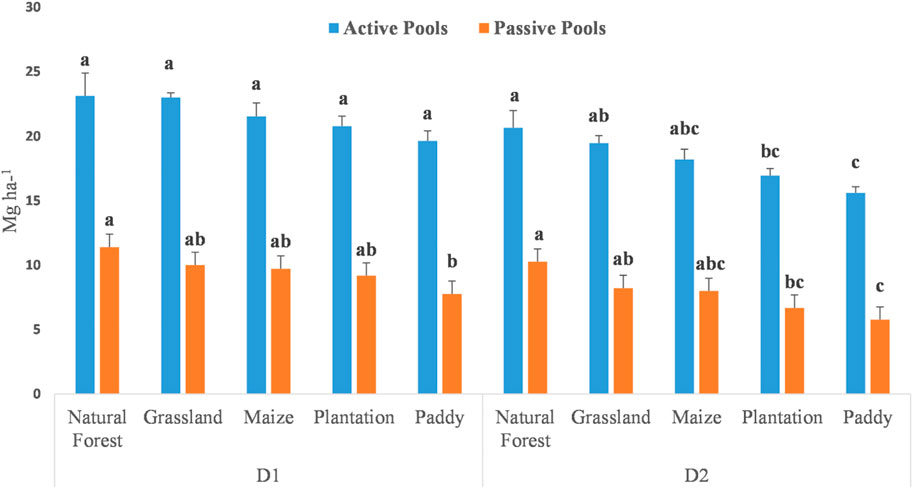
FIGURE 5. Effect of land use systems on active and passive organic carbon stocks (Mg ha−1) in 0–20 cm and 20–40 cm soil depth. Error bars indicate the least significant difference (LSD) values at p = 0.05. Mean values with the same letters don’t differ significantly.
Effect of land use systems on carbon management index
The natural forests were used as the reference soil to compute the carbon management index (CMI) for various land-use systems. Table 4 represents the CMI of different land-use types. The CMI differed significantly between different land uses and varied in response to labile OC concentration patterns. The CMI at 0–40 cm soil depth in different land-use types were as follows; 100.00 in the natural forest; 98.71 in natural grassland; 83.33 in maize-field-converted-from-forest; 79.39 under plantation, and 70.08 in paddy soils. The highest CMI was recorded under natural forest, followed by natural grassland, and the lowest was in paddy soils. The CMI values had the following order; natural forest > natural grassland > maize-field-converted-from-forest > plantation > paddy, respectively (Figure 6).
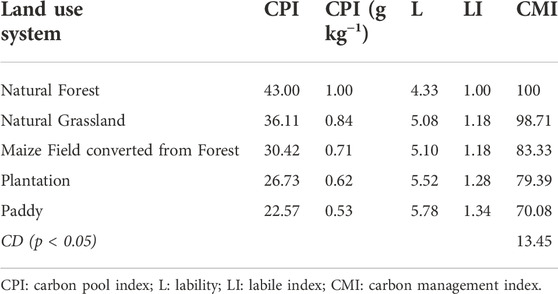
TABLE 4. Carbon Management Index under diverse land-use systems (0–40 cm).
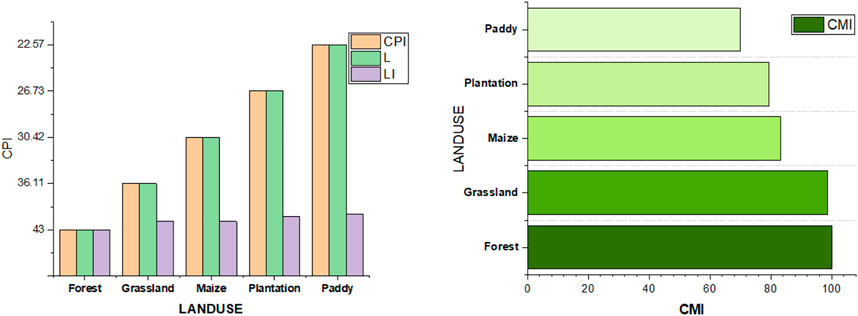
FIGURE 6. Effect of land use on carbon management index in 0–40 cm soil depth. Error bars indicate the least significant difference (LSD) values at p = 0.05.
CMI measures the quality and quantity of soil organic matter in a system (Reddy, 2010). Since the CMI is linked to the carbon pool index (CPI) and the lability index (LI), it may be used as a soil C rehabilitation measure to illustrate how soil C dynamics change as a result of changes in land use and management (de Assis et al., 2010). In reality, higher values indicate soil C rehabilitation, while lower values indicate C compound degradation (Blair et al., 1995). The CMI among the different land-use systems in this study was significantly different. The highest CMI was recorded in natural forests, which were used as a reference due to less anthropogenic disturbance, and the lowest was observed in paddy soils. The CPI is also one of the two indices that make up the CMI, which is also regarded as being more susceptible to the impact of land-use change on soil organic C dynamics (Geraei et al., 2016). Compared to cultivated land uses, adding organic matter regularly improves the ability to boost the CMI by increasing inputs and minimizing losses in natural forests and grasslands. This has also been reported by (Kalambukattu et al., 2013) and (Musinguzi et al., 2015), where cultivated soils had lower CMI values than uncultivated soils (forests).
Effect of land use systems on soil pH, electrical conductivity (EC), bulk density (ρb), and total nitrogen (TN)
Across the land-use systems, soil pH, EC, and ρb increased as soil depth was increased to 40 cm (Table 1). Across all land uses, the lowest pH, EC, and ρb values were found in the surface soil depth, whereas the highest was found in the sub-surface layer. Land-use systems significantly affected soil pH at the surface and sub-surface soil layers. The soil pH at 0–20 cm and 20–40 cm soil depth was 6.55 and 6.97 in the natural forest; 6.65 and 7.12 under natural grassland; 7.05 and 7.26 in maize-field-converted-from-forest; 6.83 and 7.20 under plantation; and 7.42 and 7.56 in paddy soils, respectively. The highest pH values at 0–20 cm and 20–40 cm depth were recorded in paddy land use, and the lowest was recorded in natural forests (Figure 7). At 0–20 cm and 20–40 cm depth, the pH under maize-field-converted-from-forest land use was higher as compared to natural forest, natural grassland, and plantation. The pH values in all land-use systems increased with increased soil depth. The result concerning pH indicates that the soil varied from slightly acidic to mildly alkaline. The overall EC varied among all land use, with the lowest value in the surface soils of natural grasslands and the highest in the sub-surface of paddy soils. The EC at 0–20 cm and 20–40 cm was 0.13 and 0.17 dS m−1 in natural forest, 0.15 and 0.19 dS m−1 in natural grassland, 0.20 and 0.24 dS m−1 in maize-field-converted-from-forest, 0.16 and 0.23 dS m−1 in plantation, and 0.26 and 0.29 dS m−1 in paddy soils, respectively (Table 1). The highest EC in surface and sub-surface soils was under paddy soil, and the lowest was under natural forest soil (Figure 7). Across the soil depth and land use pattern, land use had a considerable impact on ρb. It is evident from data that paddy soils recorded the highest ρb, i.e., 1.43 and 1.45 Mg m−3 at 0–20 and 20–40 cm soil depth, which was followed by plantation land use, viz., 1.32 and 1.36 Mg m−3, and the least was recorded in natural forest, viz., 0.94 and 1.09 Mg m−3 in surface and sub-surface layers (Figure 7). The ρb in the surface and subsurface soil layers of natural forest, natural grassland, maize-field-converted-from-forest, plantation and paddy soils was 0.94 and 1.09 Mg m−3, 1.07 and 1.18 Mg m−3, 1.22 and 1.29 Mg m−3, 1.32 and 1.36 Mg m−3 and 1.43 and 1.45 Mg m−3, respectively (Table 1). Natural forest land-use type recorded the highest total nitrogen content at the surface and sub-surface soil depths, followed by natural grassland, and the least was recorded in paddy soils. The TN content in 0–20 cm and 20–40 cm soil depth were 0.49 and 0.38% in natural forest; 0.36 and 0.29% under natural grassland; 0.26 and 0.19% in maize-field-converted-from-forest; 0.20 and 0.15% under plantation and 0.18 and 0.12% in soils under paddy land use (Table 1). In general, the total nitrogen content was found in the order of: natural forest > natural grassland > maize-field-converted-from-forest > plantation > paddy (Figure 7). Soils of natural forests and natural grasslands had significantly lower soil pH, EC, and higher ρb and TN than the other land-use systems. The highest soil pH was reported in paddy land use, and the lowest was recorded in the soils of natural forests. Natural forests had low pH, which could be attributed to extensive root systems producing more root exudates, high organic matter content, and leaching of soluble salts from surface soil layers (Perie and Ouimet, 2008). Moreover, soil pH increased with soil depth in the different land uses. Similar findings were reported by (Bhuyan et al., 2013). The quantity of organic matter available in a particular land use system significantly influences the pH of the soil, and the decomposition of this organic matter releases chemicals such as organic acids that cause the lowering of soil pH (Shao et al., 2015). Since the paddy soils contain less organic matter, their pH was the highest among all the land-use systems. Other researchers have also documented variations in soil pH due to different management practices used in diverse land-use types (Orgill et al., 2018). Our study shows that among the various land-use systems, the EC of the soils was the lowest in natural grasslands and the highest in paddy soils. The low EC of natural forest land-use systems can be attributed to the leaching of salts and base-forming cations into the sub-surface layers and translocating them out of the soil profile (Tufa et al., 2019). Higher EC in paddy soils due to the accumulation of salts, usage of fertilizers, and management practices (Kiflu and Beyene, 2013). In the sub-surface soil layer, the EC values are higher than the surface layers, which could be due to the leaching of ions (Kalambukattu et al., 2013). also reported EC values below 1 dS m−1 while studying the soils of Jammu and Kashmir. The soil ρb had lower natural forest land use, which could be due to high clay content, less soil disturbance, higher root biomass, and the presence of high amounts of organic matter. Several researchers have revealed lower ρb in natural forest soils (Emadi et al., 2008). The high ρb in paddy lands could also be due to intrinsic soil properties like texture and intensive tillage operations and practices like plowing and puddling that break soil aggregates, increase soil compaction, and reduce the amount of organic matter in the particular land use through direct exposure in the surface soil layer to raindrops and climatic factors (Bennett et al., 2017). The increase in ρb with depth could be attributed to the weight of the overlying soil layers, and the decrease in SOC content (Abad et al., 2014; Gull et al., 2020; Jan et al., 2020). Correspondence increase in ρb with soil depth was also reported by other researchers (Chhagan et al., 2019; Singh G. et al., 2021). Nitrogen has an immense role to play in plant nutrition as it is linked with essential living processes of life. TN content was higher in the natural forest land-use system in both depths than in the other land uses. The high TN of natural forest systems is due to their high organic matter content, which is the biggest and most credible source of total soil nitrogen. Several researchers (Ufot et al., 2016; Wani, 2016) have also revealed that TN is higher in the forest than in cultivated lands. The lowest TN was found in paddy soils, which could be due to higher decomposition rates and oxidation processes, influenced by intensive cultivation practices that, reduce the total nitrogen content. Also, low TN in paddy land could be attributed to the addition of smaller quantities of organic matter, leaching loss of nitrate-nitrogen, and loss of nitrogen through the denitrification process back into the atmosphere. Similarly (Gull et al., 2020; Mansoor et al., 2021), have reported that soils under cultivation tend to have lower TN concentrations as compared to uncultivated lands. A decreasing trend with an increase in soil depth was observed in all the studied land uses, usually due to a decrease in soil organic matter relative to soil depth. Our results are in close conformity with the findings of (Jan et al., 2020), who reported that the TN decreases gradually from the surface to the sub-surface layers.
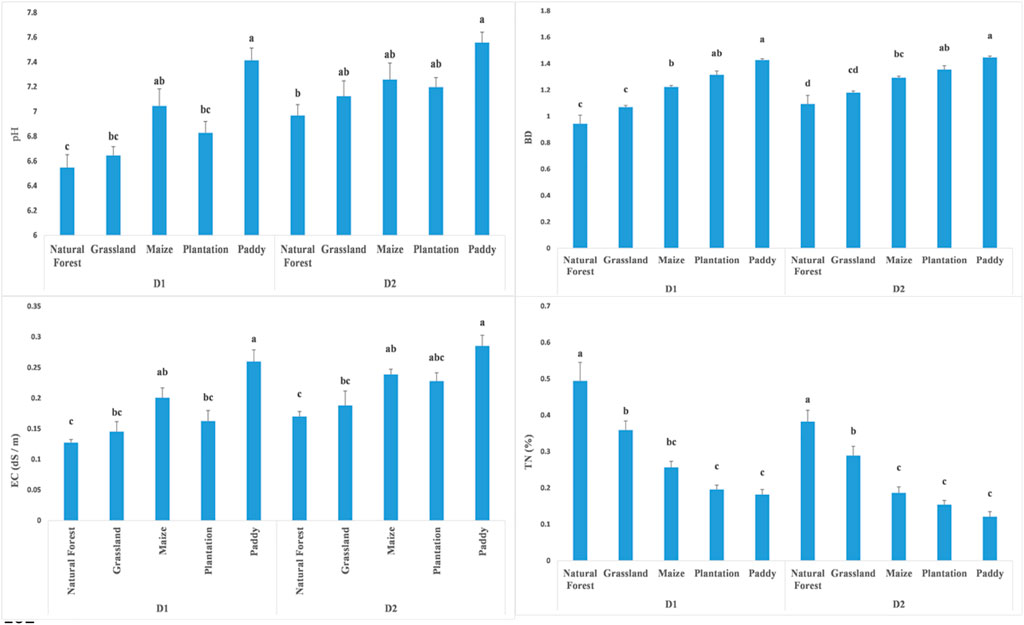
FIGURE 7. Effect of land use on pH, electrical conductivity, bulk density, and total nitrogen in 0–20 cm and 20–40 cm soil depth. Error bars indicate the least significant difference (LSD) values at p = 0.05. Mean values with the same letters don’t differ significantly.
Policy recommendation and future research perspectives
Our study indicated that the conversion of forest land to cropland has a negative impact on soil carbon storage both in surface (0–20 cm) and subsurface soil layers (20–40 cm) in the temperate region. Hence, to reduce the global temperature rise, we must reduce C emission from the soil by preserving or capturing more CO2 from the atmosphere and storing it in deep soil. The global temperature had negative consequences on snow cover in the temperate region, which may further amplify the flood problem in the mainland (Nie et al., 2021; Talukder et al., 2021). But at the same time, we cannot compromise the food security of our resource-poor population who lives in a remote location in the Himalayas. Temperate Himalayas is a major source of livelihood and habitat for many plant species, wildlife, and million populations globally (Sharma et al., 2018; Mugloo et al., 2021; Mehmood et al., 2021; Rahman et al., 2022). So it is a social responsibility to ensure the food and livelihood security of the temperate populace. Therefore, current agricultural land must be bought under conservation effective adequate soil and crop management practices. Conservation of effective agricultural practices like diversified farming, organic farming, integrated production systems, no-tilling, mulching, intercropping, etc can satisfy the food demand besides conserving soil C in the long run. Conservation agricultural practices improve food production and soil C levels over conventional farming practices in the Himalayan region (Ngangom et al., 2020; Babu et al., 2021; Singh G. et al., 2021). Fewer C losses in agricultural systems can be achieved through conservation tillage, reduced soil disturbance, and a steady supply of high-quality organic amendments. Hence, the adoption of conservation effective management practices and halting of forest land conversion to agricultural cropland must be a focal recommendation of the policy planners. Future research should concentrate on new and improved methods for increasing the C sequestration potential of agricultural systems in the region to improve soil C besides ensuring food security. According to COP 26 Article 6 of the Paris Agreement, which describes rules for an international carbon market, it layed emphasis on CO2 emissionsand innovative methods to copeup with reduction of emissions from production systems.
Conclusion
The study proved the hypothesis that the land-use changes had a tenacious impact on the different functional carbon pools under the Kashmir Himalaya of India, where the carbon pools are being severely depleted due to climatic and anthropogenic factors. Under all of the studied land-use systems, various carbon fractions were maximum under natural forests followed by plantation crop fields, while there was a lower amount of soil carbon fractions observed under the maize and paddy field. The main differences in soil carbon in different land use systems were due to differences in their soil conservation capacity through root and canopy proliferation, the recyclable biomass produced, and the reduction of CO2 emissions from the soil. Results from the current experimentation are useful for developing soil carbon status and improving soil properties under the Indian Himalayas. The results are also useful for understanding the transformation behavior of different carbon pools in different Himalayan land use systems. Based on the results of the study, it is possible to develop suitable land use practices for the Kashmir Himalayas. The study also suggests that areas of land in this region, which have already been converted from forest to cropland, should be treated with soil conservation measures to restore soil productivity. As a result, policymakers can think of developing policies to protect forest land and its conversion to agricultural land.
Data availability statement
The raw data supporting the conclusions of this article will be made available by the authors, without undue reservation.
Author contributions
SK Writing Analysis OW Drafting, statistical analysis and review SM Methodology, Writing SB Writing Editing and Review. VS Review Editing, FW Statistical analysis Gobinder Singh writing MA Bhat, MHC, PS and ZB Editing Writing SRD Writing and editing RS Writing Editing and DY Writing Editing.
Conflict of interest
The authors declare that the research was conducted in the absence of any commercial or financial relationships that could be construed as a potential conflict of interest.
Publisher’s note
All claims expressed in this article are solely those of the authors and do not necessarily represent those of their affiliated organizations, or those of the publisher, the editors and the reviewers. Any product that may be evaluated in this article, or claim that may be made by its manufacturer, is not guaranteed or endorsed by the publisher.
References
Abad, J. R. S., Khosravi, H., and Alamdarlou, E. H. (2014). Assessment the effects of land use changes on soil physicochemical properties in Jafarabad of Golestan province, Iran. Bull. Environ. Pharmacol. Life Sci. 3 (3), 296–300.
Aduhene-Chinbuah, J., Sugihara, S., Komatsuzaki, M., Nishizawa, T., and Tanaka, H. (2022). No tillage increases SOM in labile fraction but not stable fraction of andosols from a long-term experiment in Japan. Agronomy 12 (2), 479. doi:10.3390/agronomy12020479
Ahmed, I. U., Assefa, D., and Godbold, D. L. (2022). Land-use change depletes quantity and quality of soil organic matter fractions in Ethiopian highlands. Forests 13 (1), 69. doi:10.3390/f13010069
Ali, A., Lin, S-L., He, J-K., Kong, F-M., Yu, J-H., and Jiang, H-S. (2019). Climatic water availability is the main limiting factor of biotic attributes across large-scale elevational gradients in tropical forests. Sci. Total Environ. 647, 1211–1221. doi:10.1016/j.scitotenv.2018.08.072
Anantha, K. C., Mandal, B., Badole, S., Majumder, S. P., Datta, A., Padhan, D., et al. (2022). Distribution of sequestered carbon in different pools in Alfisols under long-term groundnut system of hot arid region of India. Eur. J. Agron. 135, 126467.
Arneth, A., Barbosa, H., Benton, T. G., Calvin, K., Calvo, E., Connors, S., et al. (2019). Climate change and land — IPCC, 41. Intergovernmental Panel on Climate Change.
Arora, S., and Bhatt, R. (2016). “Resource conservation technologies (RCTs) for climate-resilient agriculture in the foothill of northwest Himalayas,” in Conservation agriculture (Singapore: Springer), 71–111.
Babu, S., Mohapatra, K., Das, A., Yadav, G., Singh, R., Chandra, P., et al. (2021). Exploring synergies and trade-offs between climate change and the sustainable development goals. Springer, 119–143.
Babu, S., Mohapatra, K., Yadav, G. S., Lal, R., Singh, R., Avasthe, R., et al. (2020). Soil carbon dynamics in diverse organic land use systems in North Eastern Himalayan ecosystem of India. Catena 194, 104785. doi:10.1016/j.catena.2020.104785
Bahadori, M., Chen, C., Lewis, S., Boyd, S., Rashti, M. R., Esfandbod, M., et al. (2021). Soil organic matter formation is controlled by the chemistry and bioavailability of organic carbon inputs across different land uses. Sci. Total Environ. 770, 145307. doi:10.1016/j.scitotenv.2021.145307
Bayer, C., Martin-Neto, L., Mielniczuk, J., Pavinato, A., and Dieckow, J. (2006). Carbon sequestration in two Brazilian Cerrado soils under no-till. Soil Tillage Res. 86 (2), 237–245. doi:10.1016/j.still.2005.02.023
Begum, F., Abbas, H., Ali, S., Ali, D., Mumtaz, S., Khan, M. Z., et al. (2020). Soil quality and organic carbon stock across the different land use in a mountainous landscape of Karakoram region, Gilgit, Pakistan. FEB-Fresenius Environ. Bull. 29 (01), 503.
Bei, S., Li, X., Kuyper, T. W., Chadwick, D. R., and Zhang, J. (2022). Nitrogen availability mediates the priming effect of soil organic matter by preferentially altering the straw carbon-assimilating microbial community. Sci. Total Environ. 815, 152882. doi:10.1016/j.scitotenv.2021.152882
Benbi, D. K., Brar, K., Toor, A. S., and Singh, P. (2015). Total and labile pools of soil organic carbon in cultivated and undisturbed soils in northern India. Geoderma 237, 149–158. doi:10.1016/j.geoderma.2014.09.002
Bennett, J. M., Roberton, S. D., Jensen, T. A., Antille, D. L., and Hall, J. (2017). A comparative study of conventional and controlled traffic in irrigated cotton: I. Heavy machinery impact on the soil resource. Soil Tillage Res. 168, 143–154. doi:10.1016/j.still.2016.12.012
Bhardwaj, D. R., Tahiry, H., Sharma, P., Pala, N. A., Kumar, D., Kumar, A., et al. (2021). Influence of aspect and elevational gradient on vegetation pattern, tree characteristics and ecosystem carbon density in Northwestern Himalayas. Land 10 (11), 1109. doi:10.3390/land10111109
Bhattacharjya, S., Bhaduri, D., Chauhan, S., Chandra, R., Raverkar, K., and Pareek, N. (2017). Comparative evaluation of three contrasting land use systems for soil carbon, microbial and biochemical indicators in North-Western Himalaya. Ecol. Eng. 103, 21–30. doi:10.1016/j.ecoleng.2017.03.001
Bhuyan, S., Tripathi, O., and Khan, M. (2013). Soil nutrients status in prominent agro-ecosystems of East Siang district, Arunachal Pradesh. Int. J. Environ. Sci. 3 (6), 1957.
Biederbeck, V., Janzen, H., Campbell, C., and Zentner, R. (1994). Labile soil organic matter as influenced by cropping practices in an arid environment. Soil Biol. Biochem. 26 (12), 1647–1656. doi:10.1016/0038-0717(94)90317-4
Blair, G. J., Lefroy, R. D., and Lisle, L. (1995). Soil carbon fractions based on their degree of oxidation, and the development of a carbon management index for agricultural systems. Aust. J. Agric. Res. 46 (7), 1459–1466. doi:10.1071/ar9951459
Blake, G. R., and Hartge, K. (1986). Bulk density. Methods soil analysis Part 1 Phys. mineralogical methods 5, 363–375.
Bremner, J. (1982). Total nitrogen. Methods of soil analysis. Am. Soc. Agron. Mongrn 10 (2), 594–624.
Chauhan, R., Pande, K., and Thakur, S. (2014). Soil properties affected by land use systems in Western Chitwan, Nepal. Int. J. Appl. Sci. Biotechnol. 2 (3), 265–269. doi:10.3126/ijasbt.v2i3.10660
Chen, Z., Yu, G., and Wang, Q. (2019). Magnitude, pattern and controls of carbon flux and carbon use efficiency in China's typical forests. Glob. Planet. Change 172, 464–473. doi:10.1016/j.gloplacha.2018.11.004
Chhagan, B. R., Sharma, M., Sharma, K., Samanta, A., Wani, O. A., Kachroo, D., et al. (2019). Impact of organic, inorganic and biofertilizers on crop yield and N, P and K uptake under rainfed maize-wheat cropping system. Int. J. Curr. Microbiol. Appl. Sci. 8 (4), 2546–2564. doi:10.20546/ijcmas.2019.804.297
Chibsa, T., and Ta’a, A. (2009). Assessment of soil organic matter under four land use systems in bale highlands, southeast Ethiopia. A. Soil organic matter contents in four land use systems: Forestland, grassland, fallow land and cultivated land. World Appl. Sci. J. 6 (9), 1231–1246.
Choudhury, B., Saha, S., Singh, S., Das, A., Buragohain, J., Dayal, V., et al. (2018). Impact of postburn jhum agriculture on soil carbon pools in the north-eastern Himalayan region of India. Soil Res. 56 (6), 615–622. doi:10.1071/sr18031
Conteh, A., Lefroy, R., and Blair, G. (1997). Dynamics of organic matter in soil as determined by variations in 13C/12C isotopic ratios and fractionation by ease of oxidation. Soil Res. 35 (4), 881–890. doi:10.1071/s96107
Dar, D. A., and Sahu, P. (2018). Assessment of soil organic carbon stock in five forest types of northern Kashmir and Himalaya.
Dawson, J. J., and Smith, P. (2007). Carbon losses from soil and its consequences for land-use management. Sci. Total Environ. 382 (2-3), 165–190. doi:10.1016/j.scitotenv.2007.03.023
De Assis, C. P., De Oliveira, T. S., Da Nóbrega Dantas, J. D. A., and De Sá Mendonça, E. (2010). Organic matter and phosphorus fractions in irrigated agroecosystems in a semi-arid region of Northeastern Brazil. Agric. Ecosyst. Environ. 138 (1-2), 74–82. doi:10.1016/j.agee.2010.04.002
Dhakal, S., Koirala, M., Sharma, E., and Subedi, N. R. (2010). Effect of land use change on soil organic carbon stock in Balkhu Khola watershed southwestern part of Kathmandu valley, central Nepal. World Acad. Sci. Eng. Technol. 66.
Duval, M. E., Galantini, J. A., Iglesias, J. O., Canelo, S., Martinez, J. M., and Wall, L. (2013). Analysis of organic fractions as indicators of soil quality under natural and cultivated systems. Soil Tillage Res. 131, 11–19. doi:10.1016/j.still.2013.03.001
Emadi, M., Emadi, M., Baghernejad, M., Fathi, H., and Saffari, M. (2008). Effect of land use change on selected soil physical and chemical properties in North Highlands of Iran. J. Appl. Sci. 8 (3), 496–502. doi:10.3923/jas.2008.496.502
Geraei, D. S., Hojati, S., Landi, A., and Cano, A. F. (2016). Total and labile forms of soil organic carbon as affected by land use change in southwestern Iran. Geoderma Reg. 7 (1), 29–37. doi:10.1016/j.geodrs.2016.01.001
Gerzabek, M. H., Aquino, A. J. A., Balboa, Y. I. E., Galicia-Andrés, E., Grančič, P., Oostenbrink, C., et al. (2022). A contribution of molecular modeling to supramolecular structures in soil organic matter. J. Plant Nutr. Soil Sci. 185 (1), 44–59.
Gogoi, B., Borah, N., Baishya, A., Dutta, S., Nath, D. J., Das, R., et al. (2021). Yield trends, soil carbon fractions and sequestration in a rice-rice system of North-East India: Effect of 32 years of INM practices. Field Crops Res. 272, 108289. doi:10.1016/j.fcr.2021.108289
Gomez, K. A., and Gomez, A. A. (1984). Statistical procedures for agricultural research. John Wiley & Sons.
Gull, R., Bhat, T. A., Sheikh, T. A., Wani, O. A., Fayaz, S., Nazir, A., et al. (2020). Climate change impact on pulse in India-A. J. Pharmacogn. Phytochemistry 9 (4), 3159–3166.
Guo, L. B., and Gifford, R. M. (2002). Soil carbon stocks and land use change: A meta analysis. Glob. change Biol. 8 (4), 345–360. doi:10.1046/j.1354-1013.2002.00486.x
Hobley, E., Wilson, B., Wilkie, A., Gray, J., and Koen, T. (2015). Drivers of soil organic carbon storage and vertical distribution in Eastern Australia. Plant Soil 390 (1), 111–127. doi:10.1007/s11104-015-2380-1
Hu, Y., Wang, S., Niu, B., Chen, Q., Wang, J., Zhao, J., et al. (2020). Effect of increasing precipitation and warming on microbial community in Tibetan alpine steppe. Environ. Res. 189, 109917. doi:10.1016/j.envres.2020.109917
Isbell, F., Calcagno, V., Hector, A., Connolly, J., Harpole, W. S., Reich, P. B., et al. (2011). High plant diversity is needed to maintain ecosystem services. Nature 477 (7363), 199–202. doi:10.1038/nature10282
Jackson, W., Flesher, D., and Hageman, R. (1973). Nitrate uptake by dark-grown corn seedlings: Some characteristics of apparent induction. Plant Physiol. 51 (1), 120–127. doi:10.1104/pp.51.1.120
Jan, B., Bhat, T. A., Sheikh, T. A., Wani, O. A., Bhat, M. A., Nazir, A., et al. (2020). Agronomic bio-fortification of rice and maize with iron and zinc: A review. Int. Res. J. Pure Appl. Chem., 28–37. doi:10.9734/irjpac/2020/v21i1630257
Jobbágy, E. G., and Jackson, R. B. (2000). The vertical distribution of soil organic carbon and its relation to climate and vegetation. Ecol. Appl. 10 (2), 423–436. doi:10.1890/1051-0761(2000)010[0423:tvdoso]2.0.co;2
Jones, R. J., Hiederer, R., Rusco, E., and Montanarella, L. (2005). Estimating organic carbon in the soils of Europe for policy support. Eur. J. Soil Sci. 56 (5), 655–671. doi:10.1111/j.1365-2389.2005.00728.x
Kalambukattu, J. G., Singh, R., Patra, A. K., and Arunkumar, K. (2013). Soil carbon pools and carbon management index under different land use systems in the Central Himalayan region. Acta Agric. Scand. Sect. B - Soil & Plant Sci. 63 (3), 200–205. doi:10.1080/09064710.2012.749940
Kaur, R., and Bhat, Z. (2017). Effect of different agricultural land use systems on physico-chemical properties of soil in sub-mountainous districts of Punjab, North-West India. J. Pharmacogn. Phytochemistry 6 (3), 226–233.
Kaushal, R., Singh, I., Thapliyal, S., Gupta, A., Mandal, D., Tomar, J., et al. (2020). Rooting behaviour and soil properties in different bamboo species of Western Himalayan Foothills, India. Sci. Rep. 10 (1), 4966–5017. doi:10.1038/s41598-020-61418-z
Kiflu, A., and Beyene, S. (2013). Effects of different land use systems on selected soil properties in South Ethiopia. J. Soil Sci. Environ. Manage. 4 (5), 100–107. doi:10.5897/jssem2013.0380
Kumar, S. (2018). Geospatial approach in modeling soil erosion processes in predicting soil erosion. Remote Sens. Northwest Himal. Ecosyst. 355.
Kumar, S. S., Mahale, A. G., and Patil, A. C. (2020). Mitigation of climate change through approached agriculture-soil carbon sequestration (A review). Curr. J. Appl. Sci. Technol., 47–64. doi:10.9734/cjast/2020/v39i3331017
Kumar, S. S., Mir, S. A., Wani, O. A., Babu, S., Yeasin, M., Bhat, M. A., et al. (2022). Land-use systems regulate carbon geochemistry in the temperate Himalayas, India. J. Environ. Manage. 320, 115811. doi:10.1016/j.jenvman.2022.115811
Lal, R. (2004). Soil carbon sequestration to mitigate climate change. Geoderma 123 (1-2), 1–22. doi:10.1016/j.geoderma.2004.01.032
Mansoor, S., Kour, N., Manhas, S., Zahid, S., Wani, O. A., Sharma, V., et al. (2021). Biochar as a tool for effective management of drought and heavy metal toxicity. Chemosphere 271, 129458. doi:10.1016/j.chemosphere.2020.129458
Mikha, M. M., Vigil, M. F., and Benjamin, J. G. (2013). Long-term tillage impacts on soil aggregation and carbon dynamics under wheat-fallow in the central Great Plains. Soil Sci. Soc. Am. J. 77 (2), 594–605. doi:10.2136/sssaj2012.0125
Mir, S., Wani, J., Sofi, J., Chesti, M., Mir, A., Khan, I., et al. (2020). Soil organic carbon pools and stocks in different land uses of a temperate Himalayan region. J. Indian Soc. Soil Sci. 68 (2), 162–169. doi:10.5958/0974-0228.2020.00018.3
Morgan, G. A., Leech, N. L., Barrett, K. C., Brace, N., Snelgar, R., Griego, O. V., et al. (1988). 1. SPSS: Statistical package for the social sciences by norman H nie.
Mourya, K., Jena, R., Ray, P., Ramachandran, S., Sharma, G., Hota, S., et al. (2021). Profile distribution of soil organic carbon fractions under different landforms in the Meghalaya plateau of India. Environ. Conserv. J. 22 (3), 9–16. doi:10.36953/ecj.2021.22302
Musinguzi, P., Tenywa, J. S., Ebanyat, P., Basamba, T. A., Tenywa, M. M., Mubiru, D. N., et al. (2015). Soil organic fractions in cultivated and uncultivated Ferralsols in Uganda. Geoderma Reg. 4, 108–113. doi:10.1016/j.geodrs.2015.01.003
Nath, A. J., Brahma, B., Sileshi, G. W., and Das, A. K. (2018). Impact of land use changes on the storage of soil organic carbon in active and recalcitrant pools in a humid tropical region of India. Sci. Total Environ. 624, 908–917. doi:10.1016/j.scitotenv.2017.12.199
Nicodemo, M. L. F., Borges, W. L. B., and De Souza, I. M. D. (2018). Atributos físicos do solo em quatro sistemas de uso da terra em São Carlos, SP. Agraria. 13 (2), 1–7. doi:10.5039/agraria.v13i2a5524
Orgill, S. E., Condon, J. R., Conyers, M. K., Morris, S. G., Alcock, D. J., Murphy, B. W., et al. (2018). Removing grazing pressure from a native pasture decreases soil organic carbon in southern New South Wales, Australia. Land Degrad. Dev. 29 (2), 274–283. doi:10.1002/ldr.2560
Pan, G., Zhou, P., Li, Z., Smith, P., Li, L., Qiu, D., et al. (2009). Combined inorganic/organic fertilization enhances N efficiency and increases rice productivity through organic carbon accumulation in a rice paddy from the Tai Lake region, China. Agric. Ecosyst. Environ. 131 (3-4), 274–280. doi:10.1016/j.agee.2009.01.020
Perie, C., and Ouimet, R. (2008). Organic carbon, organic matter and bulk density relationships in boreal forest soils. Can. J. Soil Sci. 88 (3), 315–325. doi:10.4141/cjss06008
Prasad, K. K., Veerendra, M., Mahajan, N., Mrunalini, K., Sirisha, L., Reddy, T., et al. (2019). Water-stable aggregates and soil organic carbon fractions in a sub-tropical RWCS under variable tillage and precision nutrient management: A. IJCS 7 (3), 2228–2240.
Raiesi, F. (2021). The quantity and quality of soil organic matter and humic substances following dry-farming and subsequent restoration in an upland pasture. Catena 202, 105249. doi:10.1016/j.catena.2021.105249
Reddy, D. (2010). Determination of labile SOC by KMnO4 oxidation technique and its use in carbon management index, 66–69. Farmers Resource based site specific integrated nutrient management and on line fertilizer recommendations using GPS and GIS tools.
Sahoo, U. K., Singh, S. L., Gogoi, A., Kenye, A., and Sahoo, S. S. (2019). Active and passive soil organic carbon pools as affected by different land use types in Mizoram, Northeast India. PLoS One 14 (7), e0219969. doi:10.1371/journal.pone.0219969
Sainepo, B. M., Gachene, C. K., and Karuma, A. (2018). Assessment of soil organic carbon fractions and carbon management index under different land use types in Olesharo Catchment, Narok County, Kenya. Carbon Balance Manag. 13 (1), 4–9. doi:10.1186/s13021-018-0091-7
Shao, X., Yang, W., and Wu, M. (2015). Seasonal dynamics of soil labile organic carbon and enzyme activities in relation to vegetation types in Hangzhou Bay tidal flat wetland. PLoS One 10 (11), e0142677. doi:10.1371/journal.pone.0142677
Sharma, O. R., Arya, D., Goel, S., Vyas, K., and Shinde, P. (2018). Trillium govanianum wall. Ex D. Don (nagchatri): An important ethno medicinal plant of himalayan region (Himachal Pradesh). J. Med. Plants Stud. 6 (1), 11–13.
Sharma, V., Hussain, S., Sharma, K., and Arya, V. M. (2014). Labile carbon pools and soil organic carbon stocks in the foothill Himalayas under different land use systems. Geoderma 232, 81–87. doi:10.1016/j.geoderma.2014.04.039
Sheng, H., Zhou, P., Zhang, Y., Kuzyakov, Y., Zhou, Q., Ge, T., et al. (2015). Loss of labile organic carbon from subsoil due to land-use changes in subtropical China. Soil Biol. Biochem. 88, 148–157. doi:10.1016/j.soilbio.2015.05.015
Sherrod, L. A., Peterson, G. A., Westfall, D. G., and Ahuja, L. R. (2005). Soil organic carbon pools after 12 years in no-till dryland agroecosystems.
Singh, G., Batra, N., Salaria, A., Wani, O. A., and Singh, J. (2021a). Groundwater quality assessment in Kapurthala district of central plain zone of Punjab using hydrochemical characteristics. J. Soil Water Conservation 20 (1), 43–51. doi:10.5958/2455-7145.2021.00008.4
Singh, R., Babu, S., Avasthe, R. K., Meena, R. S., Yadav, G. S., Das, A., et al. (2021b). Conservation tillage and organic nutrients management improve soil properties, productivity, and economics of a maize-vegetable pea system in the Eastern Himalayas. Land Degrad. Dev. 32 (16), 4637–4654. doi:10.1002/ldr.4066
Singh, S. B., Choudhury, B. U., Saha, S., Hnamte, V., and Hnamte, V. (2019). Transforming jhum to plantations: Effect on soil microbiological and biochemical properties in the foot hills of North Eastern Himalayas, India. Catena 177, 84–91. doi:10.1016/j.catena.2019.02.008
Sreekanth, N., Prabha, S. V., Padmakumar, B., and Thomas, A. (2013). Soil carbon alterations of selected forest types as an environmental feedback to climate change. Int. J. Environ. Sci. 3 (5), 1516.
Toru, T., and Kibret, K. (2019). Carbon stock under major land use/land cover types of Hades sub-watershed, eastern Ethiopia. Carbon Balance Manag. 14 (1), 7–14. doi:10.1186/s13021-019-0122-z
Tufa, M., Melese, A., and Tena, W. (2019). Effects of land use types on selected soil physical and chemical properties: The case of kuyu district, Ethiopia. Eurasian J. soil Sci. 8 (2), 94–109. doi:10.18393/ejss.510744
Turner, J., Lambert, M. J., and Johnson, D. W. (2005). Experience with patterns of change in soil carbon resulting from forest plantation establishment in eastern Australia. For. Ecol. Manag. 220 (1-3), 259–269. doi:10.1016/j.foreco.2005.08.025
Ufot, U., Iren, O., and Chikere Njoku, C. (2016). Effects of land use on soil physical and chemical properties in Akokwa area of Imo State, Nigeria. Int. J. Life Sci. Sci. Res. 2 (3), 273–278.
Valbrun, W., De Andrade, E., De Almeida, A., and De Almeida, E. (2018). Carbon and nitrogen stock under different types of land use in a seasonally Dry Tropical Forest. J. Agric. Sci. (Tor). 10 (12), 479. doi:10.5539/jas.v10n12p479
Vezzani, F. M., Anderson, C., Meenken, E., Gillespie, R., Peterson, M., and Beare, M. H. (2018). The importance of plants to development and maintenance of soil structure, microbial communities and ecosystem functions. Soil Tillage Res. 175, 139–149. doi:10.1016/j.still.2017.09.002
Vieira, F. C. B., Bayer, C., Zanatta, J. A., Dieckow, J., Mielniczuk, J., and He, Z. L. (2007). Carbon management index based on physical fractionation of soil organic matter in an Acrisol under long-term no-till cropping systems. Soil Tillage Res. 96 (1-2), 195–204. doi:10.1016/j.still.2007.06.007
Walkley, A., and Black, I. A. (1934). An examination of the Degtjareff method for determining soil organic matter, and a proposed modification of the chromic acid titration method. Soil Sci. 37 (1), 29–38. doi:10.1097/00010694-193401000-00003
Wang, X., Wang, J., and Zhang, J. (2012). Comparisons of three methods for organic and inorganic carbon in calcareous soils of northwestern China.
Wani, O. A., Kumar, S., Hussain, N., Wani, A. I. A., Subhash, B., Parvej, A., et al. (2022). Multi-scale processes influencing global carbon storage and land-carbon-climate nexus: A critical review. Pedosphere.
Wani, O. A. (2016). Mapping of nutrients status in soils of Kishtwar and Ramban districts of J&K using geographic information system (GIS). Jammu: Sher-e-Kashmir University of Agricultural Sciences & Technology of Jammu.
Wei, X., Shao, M., Gale, W., and Li, L. (2014). Global pattern of soil carbon losses due to the conversion of forests to agricultural land. Sci. Rep. 4 (1), 1–6. doi:10.1038/srep04062
Wiesenberg, G. L., Dorodnikov, M., and Kuzyakov, Y. (2010). Source determination of lipids in bulk soil and soil density fractions after four years of wheat cropping. Geoderma 156 (3-4), 267–277. doi:10.1016/j.geoderma.2010.02.026
Wu, L., Adebayo, T. S., Yue, X. G., and Umut, A. (2022). The role of renewable energy consumption and financial development in environmental sustainability: Implications for the Nordic Countries. Int. J. Sustain. Dev. World Ecol., 1–16. doi:10.1080/13504509.2022.2115577
Xiang, H., Zhang, L., and Wen, D. (2015). Change of soil carbon fractions and water-stable aggregates in a forest ecosystem succession in South China. Forests 6 (8), 2703–2718. doi:10.3390/f6082703
Xie, X., Wu, T., Zhu, M., Jiang, G., Xu, Y., Wang, X., et al. (2021). Comparison of random forest and multiple linear regression models for estimation of soil extracellular enzyme activities in agricultural reclaimed coastal saline land. Ecol. Indic. 120, 106925. doi:10.1016/j.ecolind.2020.106925
Yadav, G. S., Lal, R., Meena, R. S., Babu, S., Das, A., Bhowmik, S., et al. (2019). Conservation tillage and nutrient management effects on productivity and soil carbon sequestration under double cropping of rice in north eastern region of India. Ecol. Indic. 105, 303–315. doi:10.1016/j.ecolind.2017.08.071
Yadav, G. S., Das, A., Kandpal, B., Babu, S., Lal, R., Datta, M., et al. (2021). The food-energy-water-carbon nexus in a maize-maize-mustard cropping sequence of the Indian Himalayas: An impact of tillage-cum-live mulching. Renew. Sustain. Energy Rev. 151, 111602. doi:10.1016/j.rser.2021.111602
Yadav, V. S., Yadav, S. S., Gupta, S. R., Meena, R. S., Lal, R., Sheoran, N. S., et al. (2022). Carbon sequestration potential and CO2 fluxes in a tropical forest ecosystem. Ecol. Eng. 176, 106541. doi:10.1016/j.ecoleng.2022.106541
Yang, C., Yang, L., and Ouyang, Z. (2005). Organic carbon and its fractions in paddy soil as affected by different nutrient and water regimes. Geoderma 124 (1-2), 133–142. doi:10.1016/j.geoderma.2004.04.008
Yao, M. K., Angui, P. K., Konaté, S., Tondoh, J. E., Tano, Y., Abbadie, L., et al. (2010). Effects of land use types on soil organic carbon and nitrogen dynamics in Mid-West Cote d’Ivoire. Eur. J. Sci. Res. 40 (2), 211–222.
Yeasmin, S., Jahan, E., Molla, M., Islam, A. K. M., Anwar, M., Or Rashid, M., et al. (2020). Effect of land use on organic carbon storage potential of soils with contrasting native organic matter content. International Journal of Agronomy.
Yeomans, J. C., and Bremner, J. M. (1988). A rapid and precise method for routine determination of organic carbon in soil. Commun. soil Sci. plant analysis 19 (13), 1467–1476. doi:10.1080/00103628809368027
Yitbarek, T., Gebrekidan, H., Kibret, K., and Beyene, S. (2013). Impacts of land use on selected physicochemical properties of soils of Abobo area, Western Ethiopia. Agric. For. Fish. 2 (5), 177–183. doi:10.11648/j.aff.20130205.11
Keywords: carbon geochemistry, carbon management index, fragile ecosystem, functional land restoration, climate change
Citation: Kumar SS, Wani OA, Mir SA, Babu S, Sharma V, Chesti MUH, Baba ZA, Sofi PA, Wani FJ, Dar SR, Singh R and Yadav D (2022) Soil carbon dynamics in the temperate Himalayas: Impact of land use management. Front. Environ. Sci. 10:1009660. doi: 10.3389/fenvs.2022.1009660
Received: 02 August 2022; Accepted: 22 November 2022;
Published: 09 December 2022.
Edited by:
Donatella Valente, University of Salento, ItalyReviewed by:
Meraj Alam Ansari, ICAR-Indian Institute of farming system research, Modipuram, IndiaBilal Ahmad, Northwest University, China
Copyright © 2022 Kumar, Wani, Mir, Babu, Sharma, Chesti, Baba, Sofi, Wani, Dar, Singh and Yadav. This is an open-access article distributed under the terms of the Creative Commons Attribution License (CC BY). The use, distribution or reproduction in other forums is permitted, provided the original author(s) and the copyright owner(s) are credited and that the original publication in this journal is cited, in accordance with accepted academic practice. No use, distribution or reproduction is permitted which does not comply with these terms.
*Correspondence: Owais Ali Wani, b3dhaXNhbGl3YW5pQHNrdWFzdGthc2htaXIuYWMuaW4=; Subhash Babu, c3ViaGlhcmlAZ21haWwuY29t
†These authors share first authorship