
95% of researchers rate our articles as excellent or good
Learn more about the work of our research integrity team to safeguard the quality of each article we publish.
Find out more
ORIGINAL RESEARCH article
Front. Environ. Sci. , 01 November 2022
Sec. Environmental Informatics and Remote Sensing
Volume 10 - 2022 | https://doi.org/10.3389/fenvs.2022.1009433
This article is part of the Research Topic Advanced Application of Deep Learning, Statistical Modelling, and Numerical Simulation on Geo-Environmental Hazards View all 59 articles
 Niandong Deng1,2
 Yuxin Li3Jianquan Ma1,2
 Himan Shahabi4,5*Mazlan Hashim5Gabriel de Oliveira6
 Saman Shojae Chaeikar7
Landslide susceptibility assessment is an important support for disaster identification and risk management. This study aims to analyze the application ability of machine learning hybrid models in different evaluation units. Three typical machine learning models, including random forest forest by penalizing attributes (FPA) and rotation forest were merged by random subspace algorithm. Twelve evaluation factors, including elevation, slope angle, slope aspect, roughness, rainfall, lithology, distance to rivers, distance to roads, normalized difference vegetation index, topographic wetness index, plan curvature, and profile curvature, were extracted from 155 landslides in Yaozhou District, Tongchuan City, China. Six landslide susceptibility maps were generated based on the slope units divided by curvature and 30 m resolution grid units. Multiple performance metrics showed that the RS-RF model based on slope units has excellent spatial prediction ability. At the same time, the method of slope unit division based on curvature is proved to be more suitable for the typical Loess tableland regions, which provides basis for the selection of evaluation units in landslide susceptibility assessment.
A landslide is a phenomenon where the soil or rock mass on a slope moves down in the soft direction under the action of gravity (Varnes 1978). With extensive human activities and increasingly serious surface environmental problems, landslides have become one of the most severe geological disasters threatening human life and property (Kannan et al., 2015). On average, landslides cause more than 300 million dollars in economic losses each year, especially in mountainous regions of China (Wang Q. et al., 2016). According to China’s geological disaster bulletin, a total of 4,220 landslides occurred in China in 2019, accounting for 68.27% of all geological disasters nationally and causing more than 200 deaths. Policymakers have been concentrating efforts to formulatea series of measures intended to reduce the risk of harm caused by landslides in relation to people in recent years.
The landslide susceptibility map (LSM) has been considered an effective tool for landslide control and land use (Nicu and Asăndulesei 2018). In recent years, studied have been conducted on landslide susceptibility worldwide, and their results have provided an essential reference tool for local governments in disaster management and urbanplanning (Feizizadeh et al., 2014). The core goal of LSM is obtaining a high-precision susceptibility map. This work procedure has worked perfectly, and the most important step is to select an appropriate evaluation model. Previously, several methods and models were applied to landslide susceptibility maps, but there was no consistent standard for selecting models (Chen et al., 2017a). From previous studies, landslide susceptibility assessment models can be divided into qualitative, semi-quantitative, and quantitative methods (Lee et al., 2018). The qualitative method mainly relies on experts to score the topographical features and related parameters of a particular slope. The results depend on expert ability but can have high accuracy (Pham et al., 2020). However, this method, by nature, is highly subjective, and the results in applying this approach to a specific locale are not suitable for other locations. The semi-quantitative method combines the qualitative method with statistical analysis of relevant factors, and, accordingly, the results are also subjective and tend to be one-sided (Tien Bui et al., 2019b).
The quantitative method focuses on analyzing the relationship between influencing factors and landslides and quantitatively forecasting the possibility of landslides in a certain area (Reichenbach et al., 2018). It is divided into two parts, the first using a probability statistic method and the other a machine learning method. The probability statistic method can be divided into binary and multivariate statistical models (Pourghasemi et al., 2012b). For example, the classical binary statistical models have frequency ratio, the weight of evidence, index of entropy, information value, etc. (Che et al., 2012). These methods were simplistic in terms of model construction and had a low predictive ability for landslides in more complex areas (Abedini et al., 2019a). Multivariate statistical models include logistic regression (Shahabi et al., 2015; Sangchini et al., 2016) and linear discriminant analysis (Nicu and Asăndulesei 2018). These models are often superior to binary statistical models but still have the disadvantage of low accuracy when faced with complex nonlinear data (Akgun 2012). With the development of computers, the machine learning model has been widely used in landslide susceptibility charts and has achieved good prediction results (Tien Bui et al., 2019a; Fang et al., 2020). Numerous machine learning models have been developed, including the artificial neural network (Bragagnolo et al., 2020), decision tree (Wang L.-J. et al., 2016; Wu et al., 2020), support vector machine (Chen et al., 2016; Yu et al., 2016), naive Bayes (Tsangaratos and Ilia 2016) and have performed well overall. These models have better designed strategies for dealing with nonlinear problems. However, over fitting and parameter optimization are common problems in machine learning models (Peng and Bai 2019). It is noted that with increased promotion of the decision tree model, some improved models based on the underlying theory have been applied to landslide susceptibility, such as the J48 tree (Hong et al., 2018a), reduced error pruning tree (Pham et al., 2019), alternating decision tree (Shirzadi et al., 2018), logistic model tree (Chen et al., 2018a; Chen et al., 2018b;), naive Bayes tree (Chen et al., 2017c), random forest (RF) (Pourghasemi and Kerle 2016; Chen et al., 2019a; Hong et al., 2019), forest by penalizing attributes (FPA) (Hong et al., 2020), rotation forest (ROF) (Chen et al., 2017b; He et al., 2019), among others. The core of the hybrid model is to combine individual learners through a range of strategies in order to enhance the diversity of learners and achieve complementary effects. Hybrid models such as fuzzy weight of evidence integration (Hong et al., 2017a), bayesian logistic regression ensemble (Abedini et al., 2019b), data mining and multi-criteria decision-making methods (Rafiei Sardooi et al., 2021), among others, were found that the predictive capability is often higher than that of individual models (Umar et al., 2014; Pham et al., 2017a). In the present work, a variety of improved models were used to replace decision tree, the original base classifier of random subspace algorithm (RS), aiming to compare the generalization ability of different hybrid models.
The selection of appropriate mapping units is one of the prerequisites for generating high-precision landslide susceptibility maps (Reichenbach et al., 2018). Different types or sizes of units will present additional landslide attribute information, affecting the model’s effectiveness. In previous studies, grid and slope units were mainly selected to evaluate landslide susceptibility. The grid unit divides the region into regular squares of a certain size, which has obvious advantages and disadvantages. Due to the use of boundary rules, the calculation is convenient and efficient, conducive to attribute extraction, and for sample training of the machine learning model. It ignores, however, the unique factors of topography and geomorphology, and the size of individual grid units is questionable (Trigila et al., 2015). Results showed that the size of grid units in different resolutions affects evaluation accuracy, and evaluation results do not always increase with smaller resolutions (Chen et al., 2020b). Based on GIS software, a hydrological analysis model is commonly used in slope units, dividing a region by valley lines and ridgelines. It also considers the morphological elements of hills and mountainous areas. However, the division of slope units based on this method does not match the geomorphic background in a wide area, such as an intermountain basin (Reichenbach et al., 2018).
In this study, three models based on RS, including ROF, FPA and RF, were created respectively to compare the applicability of different hybrid models using slope unit divided by curvature and grid unit to obtain a more sensitive map of landslide susceptibility for the Yaozhou District, Tongchuan City, China.
Yaozhou District is located south of Tongchuan City, Shaanxi Province, China. The coordinates are 108°34′–109°06′ east longitude and 34°50′–35°20′ north latitude, with a total area of about 1622 km2 (Figure 1). It belongs to the southern Loess Plateau; the terrain is high in the north and low in the south, with a relative elevation difference of 1156 m. The north and west are mainly medium and low elevation mountainous areas, the central part is a ruined highland gully area, and the south is primarily a plains and river valley area. The study area is a warm temperate continental monsoon semi-arid and semi-humid climate zone. Rainfall is concentrated primarily between July and September, accounting for more than half of the rainfall for the entire year. The spatial distribution of rainfall increases from southeast to northwest. According to data from the main regional observation station, the maximum rainfall is 830.5 mm (1983), and the minimum rainfall is 344.1 mm (1977). The annual average rainfall, therefore, is 616.3 mm. The highest temperature throughout the year is 39.7°C, and the lowest temperature is -16°C. The vegetation coverage rate of the whole area is 41%, of which the vegetation coverage rate of the northern mountainous area reaches 85%, while the southern plateau area is only 10%. The earthquake intensity belongs to the VII-degree zone, and there was no geological background of strong earthquakes.
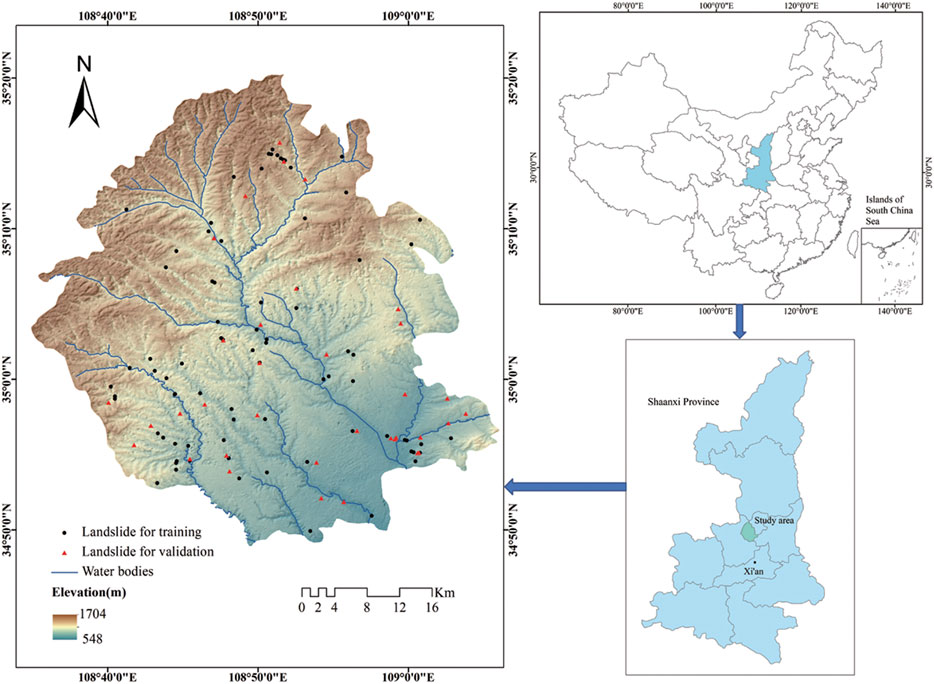
FIGURE 1. Location of the study area and landslide inventory map.
The preparation of a landslide inventory map is the first step in landslide susceptibility assessments (Rosi et al., 2018). In this study, 115 landslides were delineated by referring to the detailed survey report of geological disasters. The basic data of landslides for this area was obtained by using field surveys, an interpretation of remote sensing satellite images, and a 1:50000 scale geological map. According to the geological map scale of 1:50000, a grid of 30 × 30 m was selected as the base evaluation unit (Petschko et al., 2014). The landslide inventory map of current study area was generated in ArcGIS software (Figure 1) (Tien Bui et al., 2016b). In order to construct positive and negative sample data, 115 non-landslide points with the same number were randomly selected (Pham et al., 2016). The elevation data image was obtained from the geospatial data cloud (http://www.gscloud.cn/). The sample data were randomly divided into a training set (170 locations) and a validation set (60 locations) according to scale of 7:3 (Dou et al., 2019).
It is particularly significant to select relevant influencing factors for generating a high-precision landslide susceptibility map. In selecting these factors using predecessors, due to the difference in the geological environment conditions and landslide formation mechanism in this specific study area, the selection of factors was not clearly defined (Chen et al., 2018c; Abuzied and Alrefaee 2019). In this paper, referring to the influence factors of previous references and the geological environment conditions of the study area, a total of 12 influencing factors were selected for the model, including elevation, slope angle, slope aspect, roughness, rainfall, lithology, distance to rivers, distance to roads, normalized difference vegetation index (NDVI), topographic wetness index (TWI), plan curvature and profile curvature. This paper used ASTER GDEM 30 M resolution digital elevation data to generate elevation, slope angle, slope aspect, roughness, TWI, plan curvature, and profile curvature. NDVI, distance to roads, and distance to rivers were generated by land imaging from the Landsat eight OLI images. Rainfall observation data for multiple years were obtained from the Meteorological Bureau of Tongchuan City, Shaanxi Province, China (http://sn.cma.gov.cn/).
As one of the most critical factors affecting landslides, elevation is widely used in landslide susceptibility modeling (Pradhan 2013). It mainly affects the stress distribution of the slope, which is crucial to the stability of a landslide. In this study, elevation was classified by the natural break model as 0–815°m, 815–991°m, 991–1170°m, 1170–1358°m, and 1358–1704°m, totaling five categories (Figure 2A).
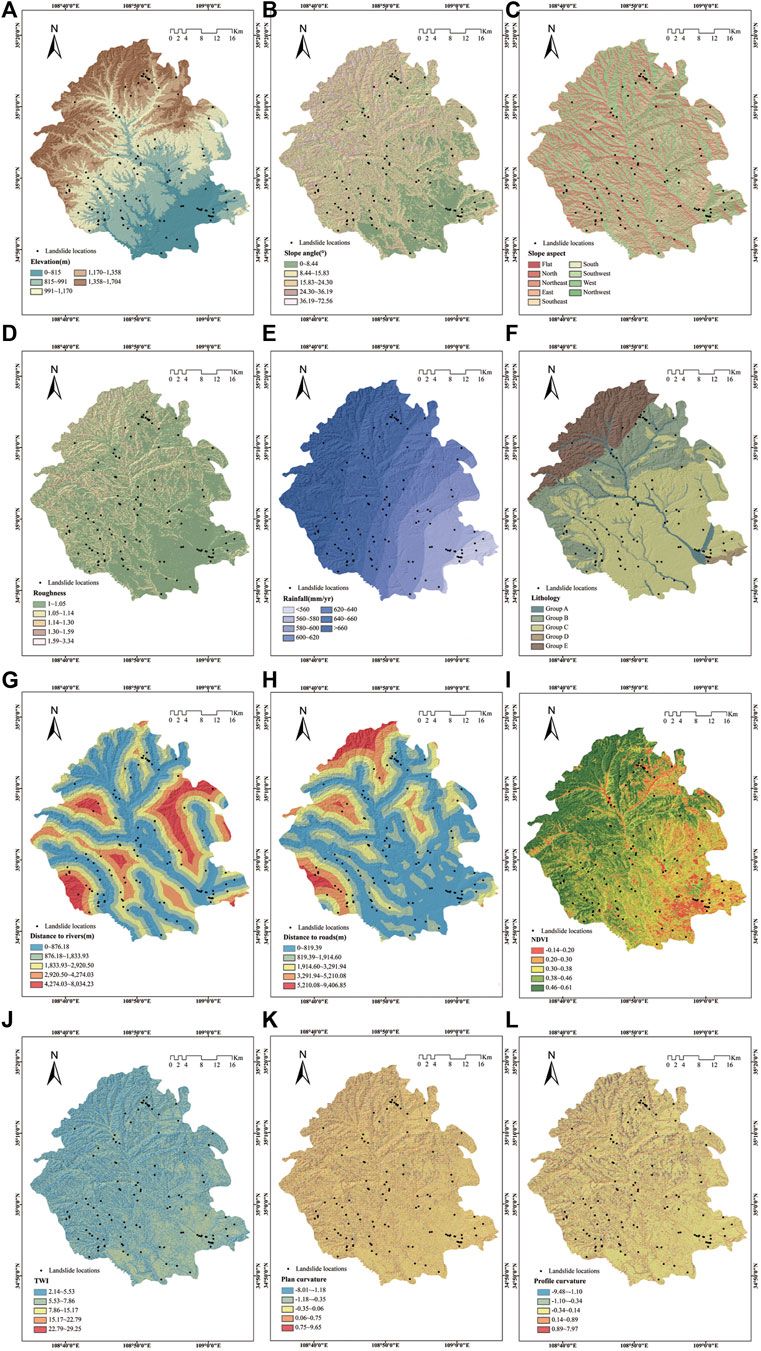
FIGURE 2. Thematic maps of the study area: (A)elevation; (B)slope angle; (C)slope aspect; (D)roughness; (E)rainfall; (F)lithology; (G)distance to rivers; (H)distance to roads; (I)NDVI; (J)TWI; (K)plan curvature; (L)profile curvature.
The slope angle is also closely related to the stability of a landslide (Saha et al., 2005). When the slope is larger than the dip angle of the rock-soil structural surface, the overlying rock-soil mass will slide along the crack surface. The slope angle was divided into five classes: 0–8.44°, 8.44–15.83°, 15.83–24.30°, 24.30–36.19°, 36.19–72.56° by the natural break method (Figure 2B).
The slope aspect affects the orientation of the slope, and different orientations are related to differences in sunlight, which lead to differences in vegetation growth and weathering (Galli et al., 2008; Trigila et al., 2015). Studies have shown that the soil moisture of a shady slope is 1.09–1.52°times that of a sunny slope and the vegetation coverage rate is 4–5°times that of a sunny slope (Tien Bui et al., 2016a). The temperature of a sunny slope is higher than that of a shady slope, which may cause weathering and fragmentation of carbonate rocks and induce landslide instability. This paper divided the slope aspect into nine categories: plan, north, northeast, east, southeast, south, southwest, west, and northwest, based on equal intervals (Figure 2C).
Roughness refers to the ratio of the surface area of a particular area to its projected area, which is a dimensionless parameter. It was divided into 1–1.05, 1.05–1.14, 1.14–1.30, 1.30–1.59, and 1.59–3.34 through the natural break model (Figure 2D).
Where r is the surface roughness and
Rainfall is one of the factors that cause landslide instability and sliding and is closely related to subsequent landslides (Bai et al., 2013). It causes the soil to soften with water and lose its original strength. The rainfall at equal pitches was divided into seven classes, as follows: <560°mm, 560–580°mm, 580–600°mm, 600–620°mm, 620–640°mm, 640–660°mm, and >660 mm (Figure 2E).
The weathering resistance and cohesion of different strata are different, so lithology is one of the important factors affecting landslide stability (Chen et al., 2019b). This paper is divided into five categories according to the age and composition of the lithology: Group A: Quaternary Holocene (Q4) silty sand, fine sand, medium sand, and gravel sand; Group B: Upper Triassic (T) sandstone, fine sandstone, mudstone, and sandy mudstone interbedded; Group C: Malan loess, fine sand, and silt from the Upper Pleistocene quaternary system (
The lateral erosion of a river will weaken the rock and soil stability on both banks’ slopes (Pourghasemi et al., 2012a). The distance to rivers was generated by Euclidean distance and divided into five categories according to the natural break method: 0–876.18m, 876.18–1833.93m, 1833.93–2920.50m, 2920.50–4274.03m, 4274.03–8034.23 m (Figure 2G).
Road construction is usually accompanied by excavating the slope toe, which changes the slope’s stress distribution and significantly impacts landslides (Pham et al., 2017c). The distance to roads was divided into five categories by the natural break method: 0–819.39°m, 819.39–1914.60°m, 1914.60–3291.94°m, 3291.94–5210.08°m, 5210.08–9406.85 m (Figure 2H).
NDVI is the difference between the near-infrared band’s reflection value and the red band’s reflection value divided by their sum, which is a dimensionless parameter (Ada and San 2018). It was divided into five categories by natural break method: 0.01–0.04.0.04–0.05, 0.05–0.07, 0.07–0.12, 0.12–0.31 (Figure 2I).
Where NIR is the reflection value of the near-infrared band and R is the reflection value of the red band.
The TWI reflects the dry and wet conditions of the soil under the ideal condition, which is a dimensionless parameter (Hong et al., 2018b). It was divided into 2.14–5.53.5.53–7.86.7.86–15.17, 15.17–22.79, and 22.79–29.25 by the natural break method (Figure 2J).
Among them, As stands for specific catchment area
The plan curvature is the rate of change in the direction perpendicular to the maximum slope, which is a dimensionless parameter (Ohlmacher 2007). The natural break method divided into five categories: −8.01–−1.12, −1.12–−0.35, −0.35–0.06, 0.06–0.75, and 0.75–9.65 (Figure 2K).
The profile curvature is the variability of the slope along the maximum slope, which is a dimensionless parameter. It was divided into five categories by the natural break method: −9.48–−1.10, −1.10–−0.34, −0.34–0.14, 0.14–0.89 and 0.89–7.97 (Figure 2L).
The study area was divided into grid units and slope units. The grid unit mainly determines the resolution size, and an empirical formula was used to determine the resolution (Formula 4). The slope unit division method based on curvature was proposed by Yan Ge, which was applied to the evaluation of landslide susceptibility in other studies (Yan G 2016). Results showed that this method has a better evaluation result than the traditional hydrological analysis model. Combined with previous studies, 30 m resolution grid unit and slope unit based on curvature division were selected to evaluate the applicability of different units in this paper. Then, the study area was divided into 1,799,237 grid units and 42,981 slope units.
Where
The random subspace algorithm (RS) was first proposed in 1998 (Tin Kam Ho 1998). This method constructed a classifier based on a decision tree, which maintained the highest accuracy in training data, and the generalization accuracy also increased with the increase of complexity. The classifier comprises several trees constructed by a pseudo-random selection of feature vectors, and one classifier is trained by using each subspace (Kuncheva and Plumpton 2010). Overfitting can be avoided to a certain extent by remaining part of the training data. First, there are k attributes (1 < k < n) selected from the attribute set of the training set (a1, a2, ... an) randomly. Each sample of the initial training set was described to obtain the new training set. Then, it was continuously randomly sampled until the bootstrap sample sets were consistent with the number of the training set. Finally, the reduced-error pruning tree model was used as the base classifier. The classification results are combined with the simple majority voting rule to obtain the final classification results.
The random forest (RF) was first proposed in 2001 (Breiman 2001). First, the bootstrap resampling method was used to extract multiple samples from the original sample, among which 2/3 samples were randomly put back. For each bootstrap sample, decision trees were established through feature sampling and optimal segmentation. The decision tree was generated using classification and regression tree algorithms, and some factors were randomly selected for internal node branching, unrestricted growth, and no pruning (Trigila et al., 2015). Then the out-of-bag error was calculated by 1/3 of the data. Finally, these decision trees were combined, and the final classification result was obtained by voting.
The forest by penalizing attributes (FPA) was developed in 2017 (Adnan and Islam 2017). It comes from the forest by continuously excluding the root node and has become a more balanced and accurate decision forest algorithm. It systematizes weights by penalizing attributes, effectively avoiding the attributes of low-level trees. It generates a bootstrap data set from training data samples and uses attribute weights to create a decision tree, similar to a classification and regression tree. Still, the difference is that the attribute is divided based on merit values rather than classification ability, and the attribute weight of the tree is constantly updated. It is worth mentioning that FPA avoids switching between similar trees by preserving the weight of the previous tree, so the test attributes of the previous tree will not be penalized. The weight of the attribute mainly considers the attribute level of the nearest tree (λ). It randomly generates weight range (WR) (Formula 5).
Where
The rotation forest model (ROF) has been widely used to evaluate landslide susceptibility and has achieved high prediction accuracy (Pham et al., 2018; Pham et al., 2020). It is assumed that N is a training sample data composed of an A×B matrix (A represents the training instances and B represents the landslide influencing factors), and the decision tree classifiers and feature set in the ensemble model are represented by Di (i = 1.2, … ,L) and F. First, F is randomly divided into K subsets. K represents M features contained by B in each feature subset, where M = B/k. The ith decision tree classifier of the jth subset can be represented by Fij. Then 75% of the training data is selected to generate the random non-empty subset, and the principal component analysis (PCA) is run through the subset of N and M features (J. J. Rodriguez et al., 2006). Finally, its coefficients are stored to obtain vectors,
The evaluation of the generalization ability of different models requires effective experimental methods and effective experimental methods and evaluation criteria to measure the generalization ability of the models (Abedini et al., 2019b). When the evaluation of landslide susceptibility is taken as the task requirement, it is significant to verify the relative good or bad of different models to select evaluation models (Nguyen et al., 2019). In this study, the commonly used statistical test methods were selected, such assensitivity, specificity, accuracy (ACC), mean absolute error (MAE), precision, kappa statistics, F-score, and Matthews correlation coefficient (MCC).
True positive (TP) and true negative (TN) are correctly predicted and classified as landslides and non-landslides, respectively. False-positive (FP) and false-negative (FN) are misclassified as landslides and non-landslide, respectively. pi is the predicted value of landslide sensitivity, while ai is the actual value of landslide sensitivity (i = 1, 2, 3, … , n, n is the number of sample instances). k0 represents the sum of the number of correctly classified samples in each category divided by the total number of samples, and ke represents the product of the true and predicted samples in each category divided by the square of the total number of samples.
The main steps of this study are shown in Figure 3. The first step is to determine the distribution of landslides in the study area by interpreting remote sensing images, field investigation, and verification. In the second step, 12 types of influencing factors such as elevation, slope angle, and slope aspect were selected to establish a database divided into grid units and slope units. Then the data were screened through VIF and CAE. The third step is to show the RS model through WEKA software, mix it with the ROF, FPA, and RF models, respectively, and continuously adjust the iterations to determine the optimal parameters. The fourth step is to get the map of landslide susceptibility, divided into five grades from very low to very high. The fifth step used the ROC curve, AUC, MAE, and SE to verify the model and obtains the most sensitive model through analysis.
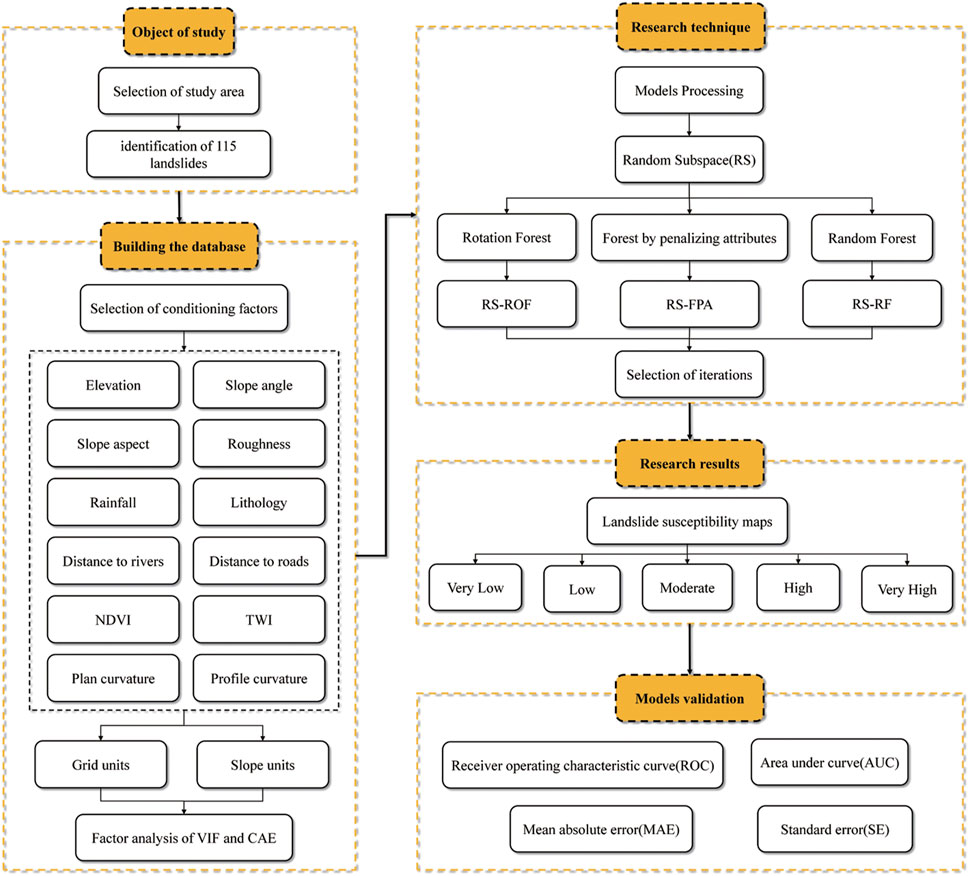
FIGURE 3. Flow chart of the study.
In the landslide susceptibility assessment, the analysis of influencing factors is mainly divided into two aspects: one is the multicollinearity between factors, and the other is the importance of the influencing factors on landslides in the study area. Tolerance (TOL) and variance inflation factors (VIF) are measures of collinearity severity of multiple linear regression models. It is generally believed that when TOL is less than 0.1 or VIF is greater than 10, there is more severe collinearity among data (Toebe and Cargnelutti Filho 2013). The results of the collinearity analysis are shown in Table 1.
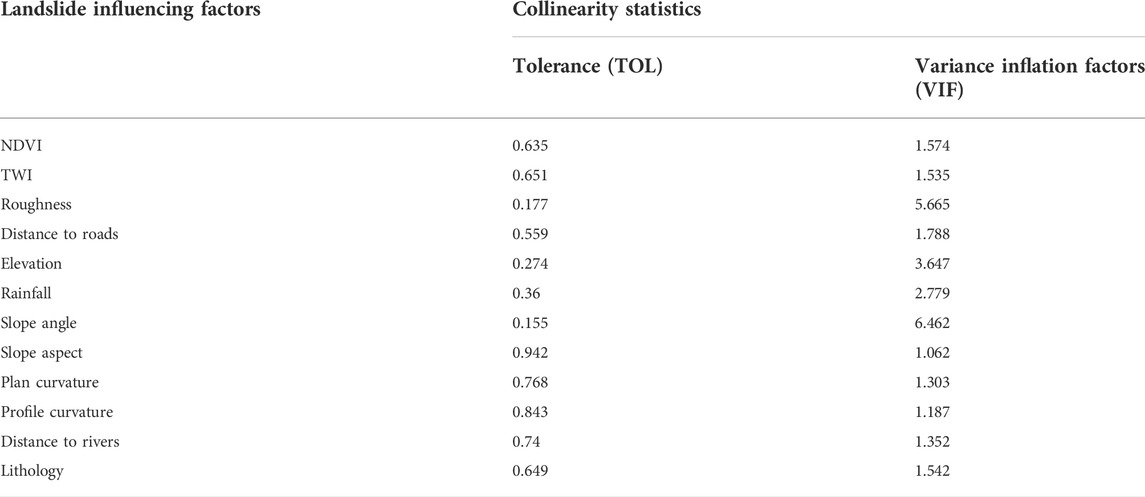
TABLE 1. Multicollinearity analysis.
Correlation attribute evaluation (CAE) is used to evaluate the worth of an attribute by measuring the correlation (Pearson’s) between it and the class. In previous work, it was also used to select relevant factors for landslide susceptibility. CAE was used to calculate the importance of 12 types of factors in this paper, and the results are shown in Table 2. If average merit (AM), the weight of a factor, is greater than 0, it indicates that it is beneficial to evaluating landslide susceptibility. It can be clearly seen from the results that all the 12 types of factors selected in this paper are suitable for landslide susceptibility evaluation in the study area.
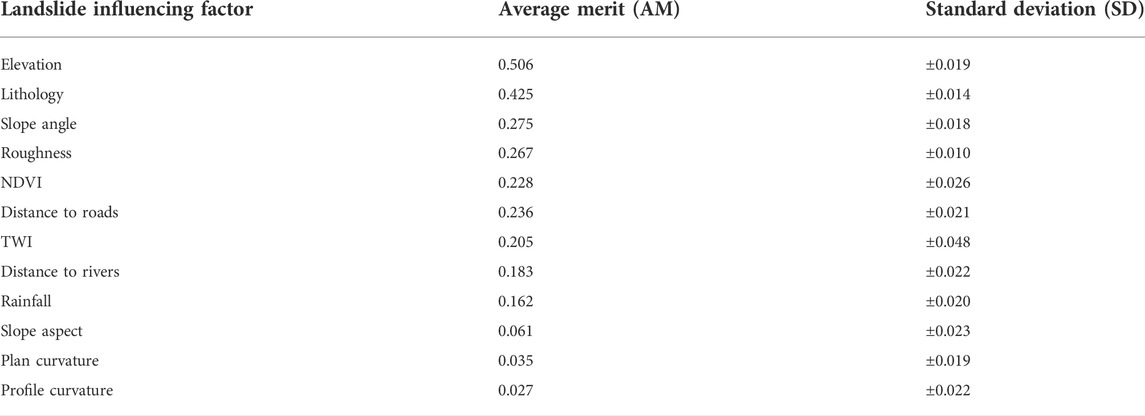
TABLE 2. Importance of influencing factors based on correlation attribute evaluation (CAE).
The parameter adjustment of the machine learning model is a complex task. In order to reduce the complexity of parameter optimization and obtain more reliable parameters, we obtained the test results of the training set and validation set by comparing the changes of AUC and MAE values of each model under the number of iterations ranging from 10 to 200 times (Figure 4). In order to select the number of iterations more in line with the overall sample, the difference between AUC and MAE was calculated, and the mean value was calculated to obtain average statistical index (ASI), which represented the average level of model fitting under the number of iterations (Figure 5). The results show that RS-ROF, RS-FPA, and RS-RF models have the best fitting degree under 190, 50, and 200 iterations, respectively, to adjust the model’s parameters.
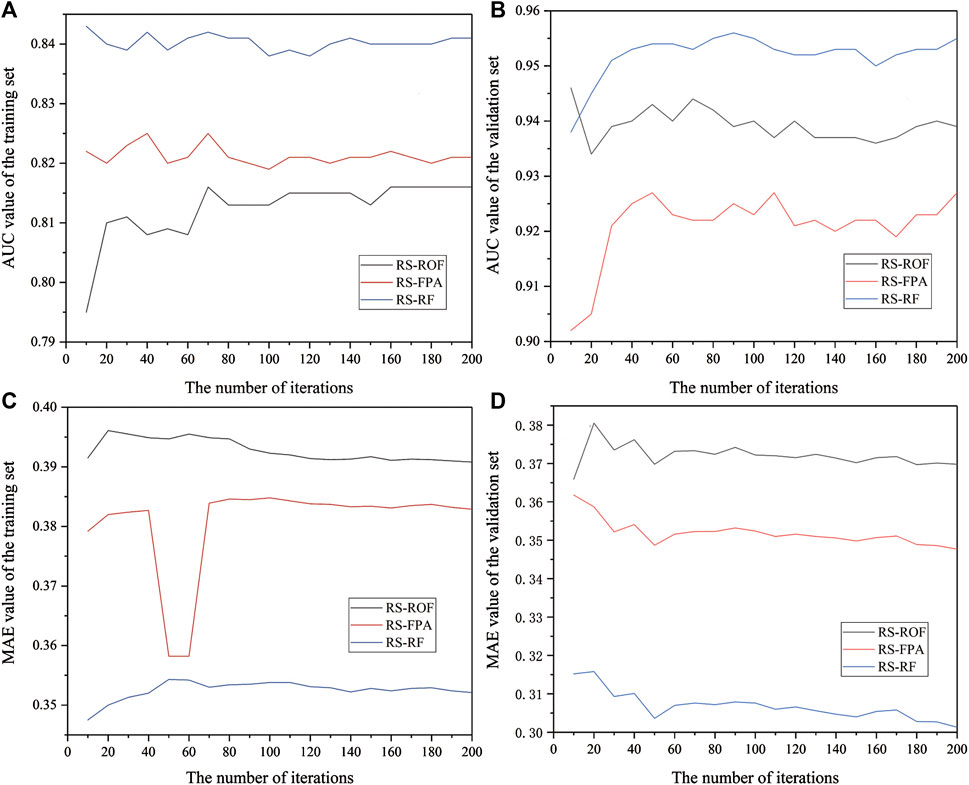
FIGURE 4. AUC and MAE of training set and validation set under different iteration times; (A) AUC value of the training set; (B) AUC value of the validation set; (C) MAE value of the training set; (D) MAE value of the validation set.
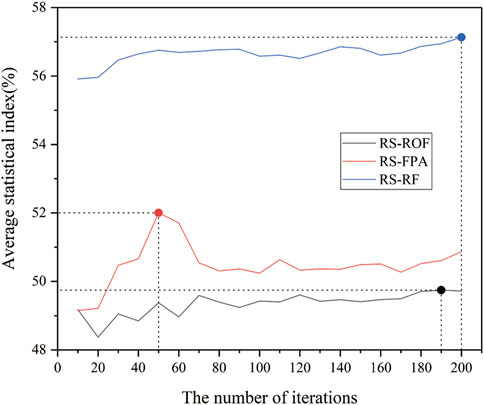
FIGURE 5. ASI of each model under different iteration times.
As mentioned previously, we used different datasets applied to RS model, and the ROF, FPA, and RF models were selected as base classifiers to construct RS-ROF, RS-FPA, and RS-RF models. Then, the success rate and prediction rate curves based on three models were obtained. After the training of models was completed, the data in the study area {Ai, Bi, … , Li} (0 < i
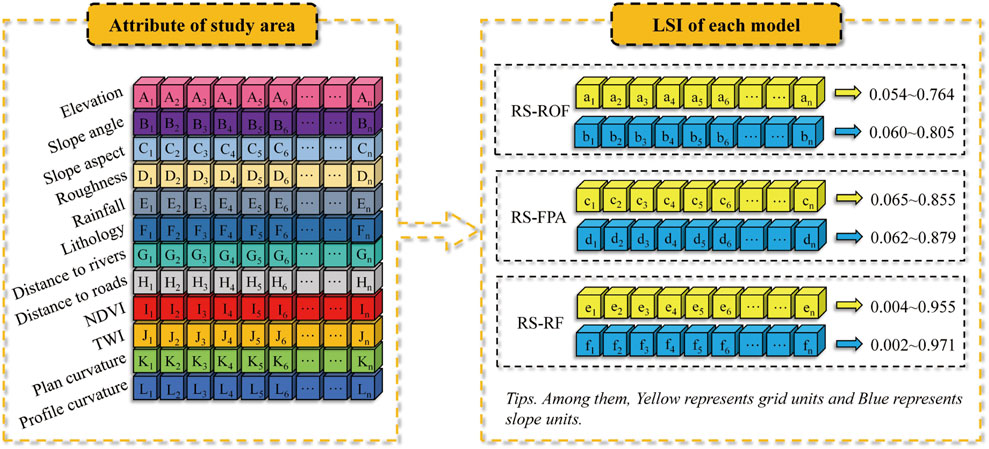
FIGURE 6. Generation of landslide susceptibility.
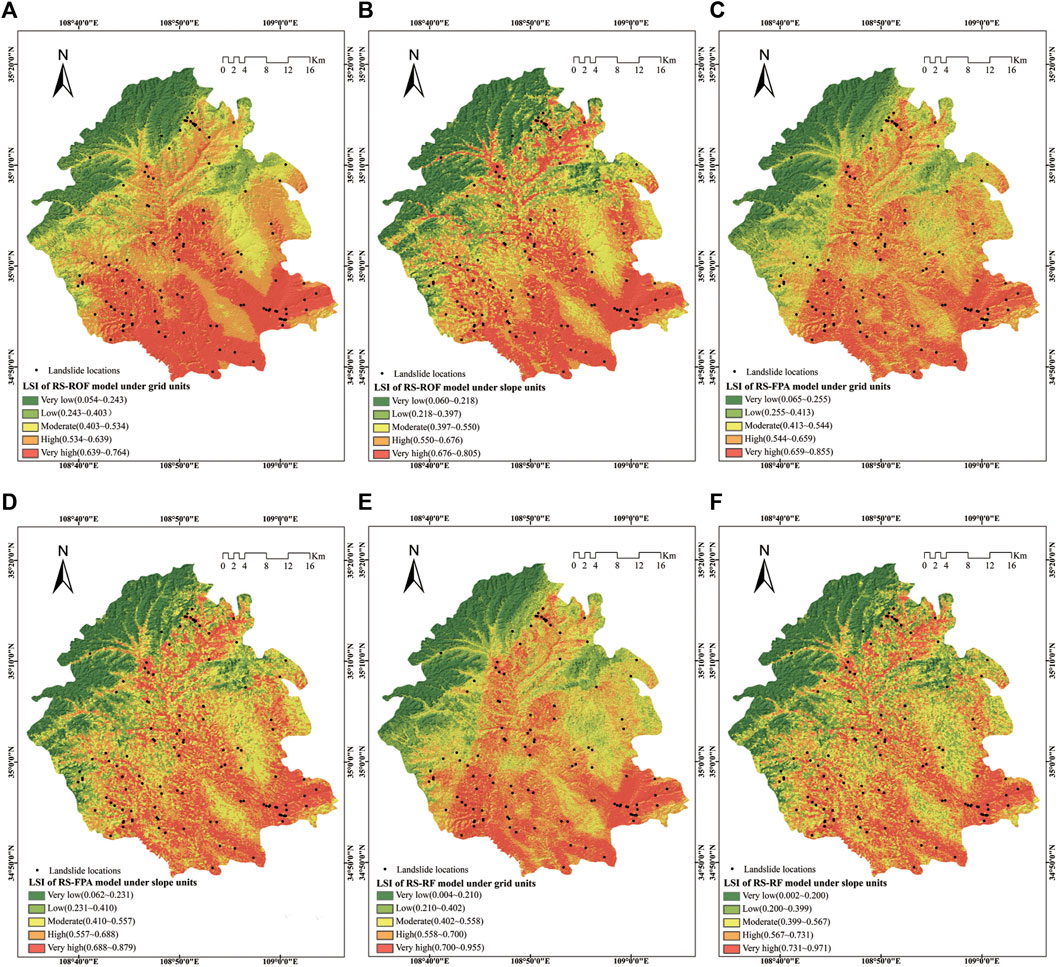
FIGURE 7. Landslide susceptibility maps using three models of different units: (A) LSI of RS-ROF model under grid units; (B) LSI of RS-ROF model under slope units; (C) LSI of RS-FPA model under grid units; (D) LSI of RS-FPA model under slope units; (E) LSI of RS-RF model under grid units; (F) LSI of RS-RF model under slope units.
Model performance is a critical step in detecting the predictive ability of the model and the last stage of a landslide susceptibility evaluation (Ozdemir and Altural 2013; Hussin et al., 2016). Test indicators were calculated according to Formulas 9 to 15 (Table 3 and Table 4). Among them, the larger the values of other parameters except for the MAE value, the higher the model’s prediction ability is. In the case of the grid unit, the training set showed the maximum value of the specificity, ACC, precision, kappa, and MCC of the RS-ROF model, followed by the RS-FPA and RS-RF model. In the RS-RF model, the value of sensitivity and F-score were the largest, while its MAE was the smallest. The validation set showed that the comparison results differed from the training set. The RS-RF model obtained the highest value insensitivity, ACC, F-score, Kappa, and MCC, respectively, while the MAE value remained at the minimum, followed by the RS-FPA and RS-ROF model. Only specificity and specificity showed that the RS-ROF model was superior to the other two models. The difference of the results may be caused by the size of the samples and the different testing principles of each parameter.

TABLE 3. The performance of the training set and the validation set of models using grid unit.
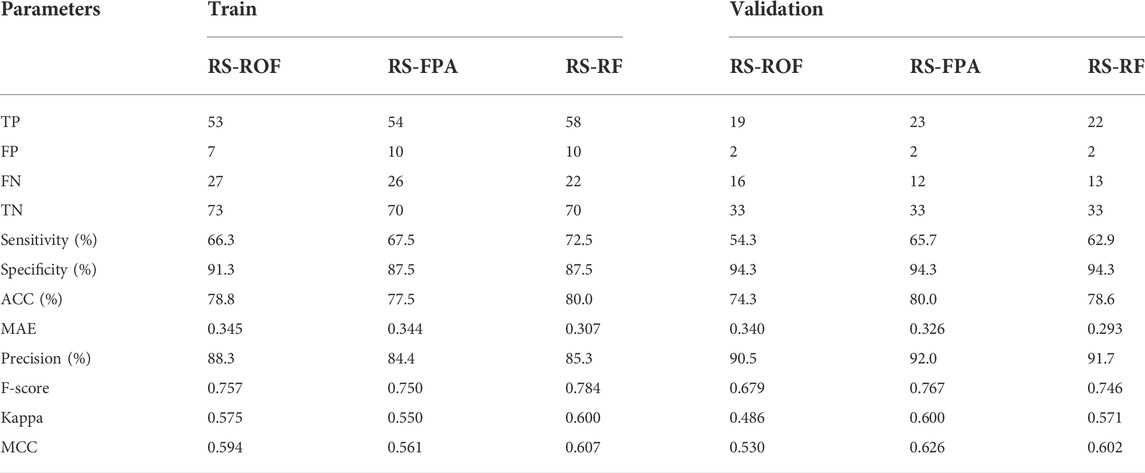
TABLE 4. The performance of the training set and the validation set of models using slope unit.
When the slope unit was used, the training set showed that the RS-RF model’s sensitivity, ACC, F-score, Kappa, and MCC reached the maximum value, and MAE was the minimum, followed by the RS-ROF model and RS-FPA model. The RS-ROF model has the maximum value in specificity and specificity indicators. The validation set showed that the RS-FPA model achieved the maximum value insensitivity, ACC, precision, F-score, Kappa, and MCC, followed by the RS-RF and RS-ROF models. Each exhibited the same specificity, but the MAE of the RS-RF model remained at the minimum. It showed that the results obtained by different test indexes are not the same, and it is difficult to measure according to one standard.
The receiver operating characteristic curve (ROC) originated in the 1990s and has been widely used in data mining and machine learning classification model evaluation (Chen et al., 2017d). ROC curves were generated by counting the sensitivity (landslide samples predicted as landslides) and 1-specificity (non-landslide samples predicted as landslides) of each model (Figure 8). Using the area under the curve (AUC), which is the main statistical indicator of the ROC curve (Pham et al., 2021). In both the training and validation sets, the AUC value of the RS-RF model was the highest among the three models and its SE was also the smallest (Table 5 and Table 6). The AUC value of the training set of RS-FPA in the two types of units is higher than that of the RS-ROF model, while the AUC value of the RS-ROF model of the grid unit is higher than that of the RS-FPA model in the validation set and the comparison results of the slope unit were consistent with that of the training set. The RS-RF model shows the highest generalization ability among the three models, followed by the RS-FPA and the RS-ROF model. Compared with the AUC results of the grid and slope units, the three models all evidence that the prediction accuracy of slope units is higher than that of grid units, which highlights that it is more appropriate to divide slope units to evaluate landslide susceptibility in Yaozhou District.
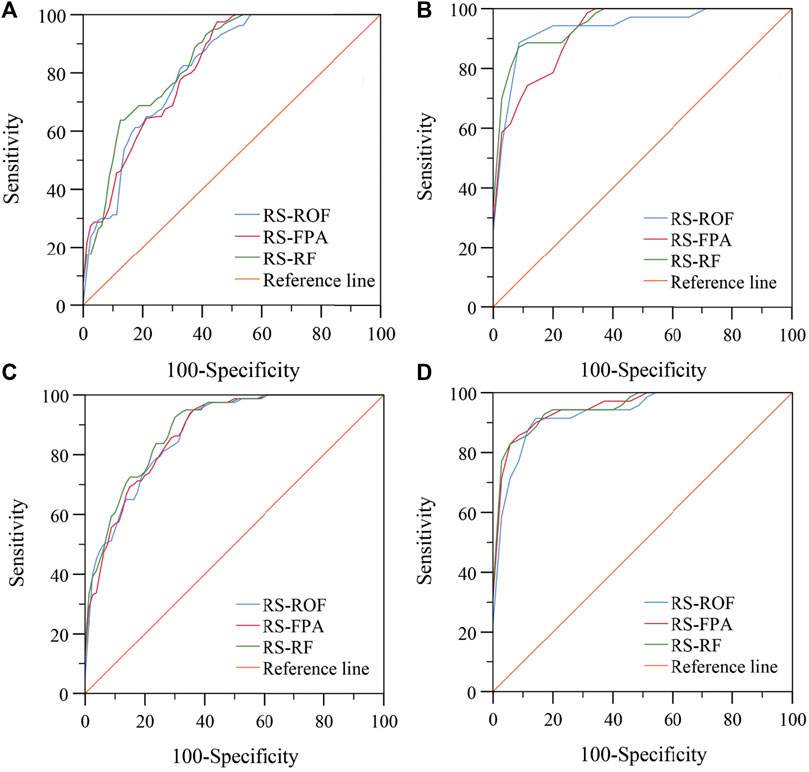
FIGURE 8. ROC curves of the models using: (A) training set of grid units; (B) validation set of grid units; (C) training set of slope units; (D) validation set of slope units.
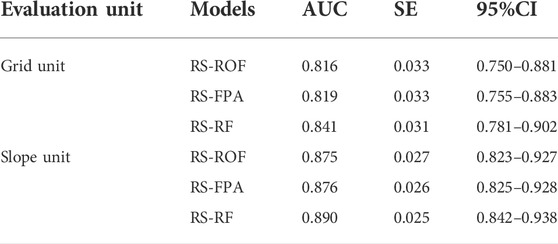
TABLE 5. Parameters of ROC curves using the training dataset.
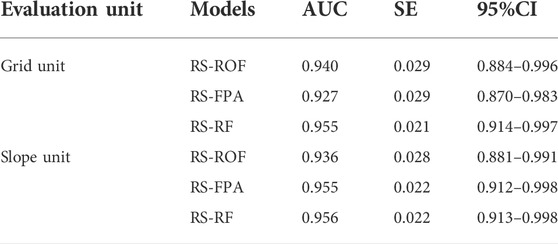
TABLE 6. Parameters of ROC curves using the validation dataset.
The frequency ratio (FR) was used to measure the consistency of the predicted results with the actual results (Formula 17). A higher FR means a relatively higher number of landslides in a smaller range. Thus, FR should increase with the increase of susceptibility, and the model with a higher FR is closer to reality at a very high susceptibility. In Figure 9, the FR of the three models increased with increased sensitivity, and slope units’ FR was higher than grid units in very high sensitivity grade. Among them, the RS-RF model had the highest FR value, followed by the RS-FPA and the RS-ROF model.
Where
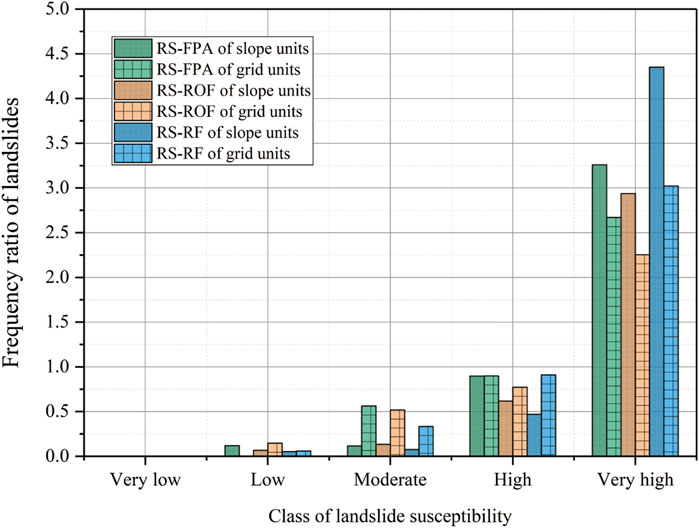
FIGURE 9. Comparison of the frequency ratios of three models.
The evaluation of landslide susceptibility involves sampling strategy, determination of evaluation unit, selection of influence index, evaluation model, and model verification. Due to the complex mechanism of landslide occurrence and the uncertainty of the evaluation process, the evaluation of landslide susceptibility has not reached a unified standard despite much research spanning decades (Nhu et al., 2020). In this study, slope units and grid units were selected for comparison. A curvature watersheds-based slope unit was used to evaluate the landslide susceptibility of Baxie River Basin, and the study showed that the slope division based on curvature was superior to the traditional hydrological analysis method (Chen et al., 2020a). The classification of hydrological analysis methods over wide areas has been deemed inappropriate and requires extensive manual correction, which subsequently increases objectivity and uncertainty (Yan G 2016). The 70 m resolution grid units have been proved to be the best size in Baxie River Basin, but this phenomenon is not fixed, causing problems in evaluating different areas and different types of landslides (Chen et al., 2020b). According to the empirical formula, 30 m resolution was selected as the grid unit compared to the slope unit in this study. The results showed that the model prediction results of the slope unit were better than that of the grid unit, highlighting the importance of the slope as the boundary for evaluating landslide susceptibility (Table 5 and Table 6) (Ba et al., 2018). The slope unit division method based on essential curvature in this study can effectively overcome the shortcomings of fuzzy boundaries and complicated operations (Chen et al., 2020a). The geomorphology of the study area is mainly Loess tableland. The results showed that the division of slope unit has a suitable application in relatively flat areas, while its adaptability in hilly and mountainous areas needs further analysis and verification.
There was no fixed standard for the selection range of factors in the previous literature, so there is still a certain subjectivity (Pham et al., 2017b). In this paper, 12 factors were evaluated based on detailed investigation reports of geological hazards in the study area, and their importance to the landslide in the study area was analyzed through the CAE method. The results showed (Table 2) that elevation is the factor most closely related to the occurrence of landslides in the area (AM = 0.506) among the 12 types of factors, which is consistent with the relevant research results (Tien Bui et al., 2016b; Chen et al., 2017d). The second is the lithology of the area (AM = 0.425), which determines the deformation and failure mode of the slope, as well as the location of a weak structural plane. It, therefore, has a noticeable control effect on the location of the sliding plane. Slope angle (AM = 0.275) and roughness (AM = 0.267) are also important influencing factors in this study, significantly changing the stress distribution state and making the slope more unstable, thereby inducing a landslide. NDVI (AM = 0.228) plays a role in slope protection and soil erosion prevention (Shou and Lin 2016). According to Figure 2I, it can be seen that vegetation is lush and landslides are relatively less developed in the northwest of the region. In contrast, vegetation coverage is more diminutive, and landslides are more densely developed in the southeast. The distance to roads (AM = 0.236) is also an important landslide-inducing factor related to the rapid development of highway construction in the study area resulting in many slopes excavated to form the blank surface (Xu et al., 2012). The remaining factors are relatively less important but cannot be ignored because AM values showed that they are still associated with landslides.
The random subspace algorithm was used to optimize the support vector machine model to evaluate the landslide susceptibility in the Wuning area, China (Hong et al., 2017b). Results showed that the hybrid model constructed by the random subspace algorithm improved the prediction ability of the basic classifier. The former study applied the ROF, FPA, and RF models to predict landslide susceptibility. In this study, they were compared with the hybrid model constructed by the random subspace to verify their applicability in predicting landslide susceptibility. A variety of performance measurement methods were adopted to evaluate the three models of two types of units. Due to the different interpretation emphases of other measurement methods, the evaluation results were also different. Precision is used to measure the proportion of the actual number of landslides in the predicted unit, for example, while sensitivity is used to measure the exact number of landslides in the predicted unit. As a result, two indexes often have opposite rules (Table 3 and Table 4). Although there are slight differences, the RS-RF model had the highest AUC value after the overall comparison by the ROC curve, followed by the RS-FPA and the RS-ROF model. It was proved that the RF model has a stronger generalization ability and prediction performance than other single models. In extremely vulnerable areas, the RS-RF model predicted the highest landslide frequency ratio under the slope unit, which was consistent with the AUC value and proved that the results are relatively reliable. It should be pointed out that in this study, the model training process only adopts the grid search method to determine the iterative parameters. However, there are many hyperparameters in machine learning hybrid model. We recommend, for future studies, the optimization methods of different parameters are worthy of further analysis and research to improve the stability and accuracy of the model. Besides that, in addition to RS algorithm, improved complete ensemble empirical mode decomposition with adaptive noise (ICEEMDAN) was used for the construction of machine learning hybrid model. It has been proved that the prediction ability of machine learning models has been improved in energy fields such as global solar radiation and wind direction, which is also inspiring for the construction of landslide susceptibility models (Li et al., 2021; Ghimire et al., 2022). The advantages of hybrid models can be further compared and explored.
Landslide susceptibility prediction is a necessary and often an uncertain work due to the harmfulness and complexity of landslide procesess. The main purpose of this study was to compare the applicability of different hybrid machine learning models, including RS-ROF, RS-FPA, and RS-RF, for landslide susceptibility assessment in the Yaozhou District, Tongchuan City, China. The results were compared based on the grid unit and slope unit, respectively. Combined with the geological environment characteristics of the study area, a total of 12 categories of influencing factors, including elevation, slope angle, slope aspect, roughness, rainfall, lithology, distance to rivers, distance to roads, NDVI, TWI, plan curvature, and profile curvature were used for evaluation and models were verified by ROC curve, Kappa coefficient, F-score, MCC, and other performance metrics. The results showed that the 12 factors selected were all suitable for this study, among which elevation, lithology, slope, roughness, and NDVI were the main inducing factors of landslide. The prediction results of the three models based on slope unit were all the better than those of the grid unit, which verified the efficiency and accuracy of the curvature-based slope unit division method. In typical Loess tableland regions, the method of slope unit division based on curvature is worthy of application. Curvature analysis improves the partition efficiency of slope unit, which is observed in the landslide susceptibility assessment of different machine learning hybrid models. Through the comprehensive comparison of different performance measures, excellent landslide susceptibility prediction ability was demonstrated by RS-RF model. At the same time, the hyperparameter optimization of the model can be further studied and explored. Landslide susceptibility is an important branch in the field of environmental geology. This model can be used to evaluate and apply a wide range of environmental problems. The research results based on machine learning hybrid model will play an important role and influence on the development and utilization of urban/agricultural areas aiming for an harmonious development of human and environment.
The datasets presented in this study can be found in online repositories. The names of the repository/repositories and accession number(s) can be found below: http://www.gscloud.cn/sources/index?pid = 1&rootid = 1.
ND collected field data and conducted the landslide mapping and analysis. YL and JM wrote the manuscript. HS, MH, GO, and SC provided critical comments in planning this paper and edited the manuscript. All the authors discussed the results and edited the manuscript.
This study was supported by the National Natural Science Youth Foundation of China (Grant Nos. 41602359 and Grant Nos. 41702377) and the Open Project of the Key Laboratory of Geological Process and Mineral Resources in the Northern Qinghai-Tibet Plateau of Qinghai Province (No. 2019-KZ-01).
The authors thank the Shaanxi Institute of Geological Survey of China for providing the geological survey data of the study area and Professor Chen Wei of Xi’an University of Science and Technology for his suggestions on the evaluation model and factor analysis in this paper. Furthermore, the authors thank the University of Kurdistan, Iran, and Universiti Teknologi Malaysia (UTM) for preparing this international collaboration for the scientific sharing experience.
Author YL was employed by the company Xi’an Meihang Remote Sensing Information Co., Ltd.
The remaining authors declare that the research was conducted in the absence of any commercial or financial relationships that could be construed as a potential conflict of interest.
All claims expressed in this article are solely those of the authors and do not necessarily represent those of their affiliated organizations, or those of the publisher, the editors and the reviewers. Any product that may be evaluated in this article, or claim that may be made by its manufacturer, is not guaranteed or endorsed by the publisher.
The Supplementary Material for this article can be found online at: https://www.frontiersin.org/articles/10.3389/fenvs.2022.1009433/full#supplementary-material
Abedini, M., Ghasemian, B., Shirzadi, A., and Bui, D. T. (2019a). A comparative study of support vector machine and logistic model tree classifiers for shallow landslide susceptibility modeling. Environ. Earth Sci. 78, 560. doi:10.1007/s12665-019-8562-z
Abedini, M., Ghasemian, B., Shirzadi, A., Shahabi, H., Chapi, K., Pham, B. T., et al. (2019b). A novel hybrid approach of Bayesian Logistic Regression and its ensembles for landslide susceptibility assessment. Geocarto Int. 34, 1427–1457. doi:10.1080/10106049.2018.1499820
Abuzied, S. M., and Alrefaee, H. A. (2019). Spatial prediction of landslide-susceptible zones in El-Qaá area, Egypt, using an integrated approach based on GIS statistical analysis. Bull. Eng. Geol. Environ. 78, 2169–2195. doi:10.1007/s10064-018-1302-x
Ada, M., and San, B. T. (2018). Comparison of machine-learning techniques for landslide susceptibility mapping using two-level random sampling (2LRS) in Alakir catchment area, Antalya, Turkey. Nat. Hazards (Dordr). 90, 237–263. doi:10.1007/s11069-017-3043-8
Adnan, M. N., and Islam, M. Z. (2017). Forest PA : Constructing a decision forest by penalizing attributes used in previous trees. Expert Syst. Appl. 89, 389–403. doi:10.1016/j.eswa.2017.08.002
Akgun, A. (2012). A comparison of landslide susceptibility maps produced by logistic regression, multi-criteria decision, and likelihood ratio methods: A case study at i?zmir, TTurkey Landslides 9, 93–106. doi:10.1007/s10346-011-0283-7
Ba, Q., Chen, Y., Deng, S., Yang, J., and Li, H. (2018). A comparison of slope units and grid cells as mapping units for landslide susceptibility assessment. Earth Sci. Inf. 11, 373–388. doi:10.1007/s12145-018-0335-9
Bai, S.-b., Cheng, C., Wang, J., Thiebes, B., and Zhang, Z.-g. (2013). Regional scale rainfall- and earthquake-triggered landslide susceptibility assessment in Wudu County, China. J. Mt. Sci. 10, 743–753. doi:10.1007/s11629-013-2432-z
Bragagnolo, L., Silva, R. d., and Grzybowski, J. M. V. (2020). Artificial neural network ensembles applied to the mapping of landslide susceptibility. CATENA 184, 104240. doi:10.1016/j.catena.2019.104240
Che, V. B., Kervyn, M., Suh, C. E., Fontijn, K., Ernst, G. G. J., del Marmol, M.-A., et al. (2012). Landslide susceptibility assessment in limbe (SW Cameroon): A field calibrated seed cell and information value method. CATENA 92, 83–98. doi:10.1016/j.catena.2011.11.014
Chen, W., Chai, H., Zhao, Z., Wang, Q., and Hong, H. (2016). Landslide susceptibility mapping based on GIS and support vector machine models for the Qianyang County, China. Environ. Earth Sci. 75, 474. doi:10.1007/s12665-015-5093-0
Chen, W., Panahi, M., and Pourghasemi, H. R. (2017a). Performance evaluation of GIS-based new ensemble data mining techniques of adaptive neuro-fuzzy inference system (ANFIS) with genetic algorithm (GA), differential evolution (DE), and particle swarm optimization (PSO) for landslide spatial modelling. CATENA 157, 310–324. doi:10.1016/j.catena.2017.05.034
Chen, W., Peng, J., Hong, H., Shahabi, H., Pradhan, B., Liu, J., et al. (2018a). Landslide susceptibility modelling using GIS-based machine learning techniques for Chongren County, Jiangxi Province, China. Sci. Total Environ. 626, 1121–1135. doi:10.1016/j.scitotenv.2018.01.124
Chen, W., Shahabi, H., Shirzadi, A., Li, T., Guo, C., Hong, H., et al. (2018b). A novel ensemble approach of bivariate statistical-based logistic model tree classifier for landslide susceptibility assessment. Geocarto Int. 33, 1398–1420. doi:10.1080/10106049.2018.1425738
Chen, W., Shirzadi, A., Shahabi, H., Ahmad, B. B., Zhang, S., Hong, H., et al. (2017b). A novel hybrid artificial intelligence approach based on the rotation forest ensemble and naïve Bayes tree classifiers for a landslide susceptibility assessment in Langao County, China. Geomatics, Nat. Hazards Risk 8, 1955–1977. doi:10.1080/19475705.2017.1401560
Chen, W., Sun, Z., and Han, J. (2019a). Landslide susceptibility modeling using integrated ensemble weights of evidence with logistic regression and random forest models. Appl. Sci. 9, 171. doi:10.3390/app9010171
Chen, W., Xie, X., Peng, J., Wang, J., Duan, Z., and Hong, H. (2017c). GIS-Based landslide susceptibility modelling: A comparative assessment of kernel logistic regression, naïve-bayes tree, and alternating decision tree models. Geomatics, Nat. Hazards Risk 8, 950–973. doi:10.1080/19475705.2017.1289250
Chen, W., Xie, X., Wang, J., Pradhan, B., Hong, H., Bui, D. T., et al. (2017d). A comparative study of logistic model tree, random forest, and classification and regression tree models for spatial prediction of landslide susceptibility. CATENA 151, 147–160. doi:10.1016/j.catena.2016.11.032
Chen, W., Yan, X., Zhao, Z., Hong, H., Bui, D. T., and Pradhan, B. (2019b). Spatial prediction of landslide susceptibility using data mining-based kernel logistic regression, naive Bayes and RBFNetwork models for the Long County area (China). Bull. Eng. Geol. Environ. 78, 247–266. doi:10.1007/s10064-018-1256-z
Chen, W., Zhang, S., Li, R., and Shahabi, H. (2018c). Performance evaluation of the GIS-based data mining techniques of best-first decision tree, random forest, and naïve Bayes tree for landslide susceptibility modeling. Sci. Total Environ. 644, 1006–1018. doi:10.1016/j.scitotenv.2018.06.389
Chen, Z., Liang, S., Ke, Y., Yang, Z., and Zhao, H. (2020a). Landslide susceptibility assessment using different slope units based on the evidential belief function model. Geocarto Int. 35, 1641–1664. doi:10.1080/10106049.2019.1582716
Chen, Z., Ye, F., Fu, W., Ke, Y., and Hong, H. (2020b). The influence of DEM spatial resolution on landslide susceptibility mapping in the Baxie River basin, NW China. Nat. Hazards (Dordr). 101, 853–877. doi:10.1007/s11069-020-03899-9
Dou, J., Yunus, A. P., Tien Bui, D., Merghadi, A., Sahana, M., Zhu, Z., et al. (2019). Assessment of advanced random forest and decision tree algorithms for modeling rainfall-induced landslide susceptibility in the Izu-Oshima Volcanic Island, Japan. Sci. Total Environ. 662, 332–346. doi:10.1016/j.scitotenv.2019.01.221
Fang, Z., Wang, Y., Peng, L., and Hong, H. (2020). Integration of convolutional neural network and conventional machine learning classifiers for landslide susceptibility mapping. Comput. Geosciences 139, 104470. doi:10.1016/j.cageo.2020.104470
Feizizadeh, B., Shadman Roodposhti, M., Jankowski, P., and Blaschke, T. (2014). A GIS-based extended fuzzy multi-criteria evaluation for landslide susceptibility mapping. Comput. Geosciences 73, 208–221. doi:10.1016/j.cageo.2014.08.001
Galli, M., Ardizzone, F., Cardinali, M., Guzzetti, F., and Reichenbach, P. (2008). Comparing landslide inventory maps. Geomorphology 94, 268–289. doi:10.1016/j.geomorph.2006.09.023
Ghimire, S., Deo, R. C., Casillas-Pérez, D., and Salcedo-Sanz, S. (2022). Improved complete ensemble empirical mode decomposition with adaptive noise deep residual model for short-term multi-step solar radiation prediction. Renew. Energy 190, 408–424. doi:10.1016/j.renene.2022.03.120
He, Q., Xu, Z., Li, S., Li, R., Zhang, S., Wang, N., et al. (2019). Novel entropy and rotation forest-based credal decision tree classifier for landslide susceptibility modeling. Entropy 21, 106. doi:10.3390/e21020106
Hong, H., Ilia, I., Tsangaratos, P., Chen, W., and Xu, C. (2017a). A hybrid fuzzy weight of evidence method in landslide susceptibility analysis on the Wuyuan area, China. Geomorphology 290, 1–16. doi:10.1016/j.geomorph.2017.04.002
Hong, H., Liu, J., Bui, D. T., Pradhan, B., Acharya, T. D., Pham, B. T., et al. (2018a). Landslide susceptibility mapping using J48 decision tree with AdaBoost, bagging and rotation forest ensembles in the guangchang area (China). CATENA 163, 399–413. doi:10.1016/j.catena.2018.01.005
Hong, H., Liu, J., and Zhu, A.-X. (2020). Modeling landslide susceptibility using LogitBoost alternating decision trees and forest by penalizing attributes with the bagging ensemble. Sci. Total Environ. 718, 137231. doi:10.1016/j.scitotenv.2020.137231
Hong, H., Liu, J., Zhu, A.-X., Shahabi, H., Pham, B. T., Chen, W., et al. (2017b). A novel hybrid integration model using support vector machines and random subspace for weather-triggered landslide susceptibility assessment in the Wuning area (China). Environ. Earth Sci. 76, 652. doi:10.1007/s12665-017-6981-2
Hong, H., Miao, Y., Liu, J., and Zhu, A.-X. (2019). Exploring the effects of the design and quantity of absence data on the performance of random forest-based landslide susceptibility mapping. CATENA 176, 45–64. doi:10.1016/j.catena.2018.12.035
Hong, H., Panahi, M., Shirzadi, A., Ma, T., Liu, J., Zhu, A.-X., et al. (2018b). Flood susceptibility assessment in Hengfeng area coupling adaptive neuro-fuzzy inference system with genetic algorithm and differential evolution. Sci. Total Environ. 621, 1124–1141. doi:10.1016/j.scitotenv.2017.10.114
Hussin, H. Y., Zumpano, V., Reichenbach, P., Sterlacchini, S., Micu, M., van Westen, C., et al. (2016). Different landslide sampling strategies in a grid-based bi-variate statistical susceptibility model. Geomorphology 253, 508–523. doi:10.1016/j.geomorph.2015.10.030
Kannan, M., Saranathan, E., and Anbalagan, R. (2015). Comparative analysis in GIS-based landslide hazard zonation—A case study in bodi-bodimettu ghat section, theni District, Tamil nadu, India. Arab. J. Geosci. 8, 691–699. doi:10.1007/s12517-013-1259-9
Kuncheva, L. I., and Plumpton, C. O. (2010). “Choosing parameters for random subspace ensembles for fMRI classification,” in Multiple classifier systems. Editors N. El Gayar, J. Kittler, and F. Roli (Berlin, Heidelberg: Springer Berlin Heidelberg), 54–63.
Lee, J.-H., Sameen, M. I., Pradhan, B., and Park, H.-J. (2018). Modeling landslide susceptibility in data-scarce environments using optimized data mining and statistical methods. Geomorphology 303, 284–298. doi:10.1016/j.geomorph.2017.12.007
Li, H., Deng, J., Feng, P., Pu, C., Arachchige, D. D. K., and Cheng, Q. (2021). Short-Term nacelle orientation forecasting using bilinear transformation and ICEEMDAN framework. Front. Energy Res. 9, 879. doi:10.3389/fenrg.2021.780928
Nguyen, T. P., Tuyen, T. T., Shirzadi, A., Shahabi, H., Omidvar, A., Entezami, O., et al. (2019). Development of a novel hybrid intelligence approach for landslide spatial prediction. Appl. Sci. 9, 2824. doi:10.3390/app9142824
Nhu, V.-H., Hoang, N.-D., Nguyen, H., Ngo, P. T. T., Thanh Bui, T., Hoa, P. V., et al. (2020). Effectiveness assessment of Keras based deep learning with different robust optimization algorithms for shallow landslide susceptibility mapping at tropical area. CATENA 188, 104458. doi:10.1016/j.catena.2020.104458
Nicu, I. C., and Asăndulesei, A. (2018). GIS-based evaluation of diagnostic areas in landslide susceptibility analysis of Bahluieț River Basin (Moldavian Plateau, NE Romania). Are Neolithic sites in danger? Geomorphology 314, 27–41. doi:10.1016/j.geomorph.2018.04.010
Ohlmacher, G. C. (2007). Plan curvature and landslide probability in regions dominated by Earth flows and Earth slides. Eng. Geol. 91, 117–134. doi:10.1016/j.enggeo.2007.01.005
Ozdemir, A., and Altural, T. (2013). A comparative study of frequency ratio, weights of evidence and logistic regression methods for landslide susceptibility mapping: Sultan Mountains, SW Turkey. J. Asian Earth Sci. 64, 180–197. doi:10.1016/j.jseaes.2012.12.014
Peng, H., and Bai, X. (2019). Comparative evaluation of three machine learning algorithms on improving orbit prediction accuracy. Astrodyn. 3, 325–343. doi:10.1007/s42064-018-0055-4
Petschko, H., Brenning, A., Bell, R., Goetz, J., and Glade, T. (2014). Assessing the quality of landslide susceptibility maps – case study Lower Austria. Nat. Hazards Earth Syst. Sci. 14, 95–118. doi:10.5194/nhess-14-95-2014
Pham, B. T., Khosravi, K., and Prakash, I. (2017a). Application and comparison of decision tree-based machine learning methods in landside susceptibility assessment at pauri garhwal area, uttarakhand, India. Environ. Process. 4, 711–730. doi:10.1007/s40710-017-0248-5
Pham, B. T., Nguyen, V.-T., Ngo, V.-L., Trinh, P. T., Ngo, H. T. T., and Tien Bui, D. (2018). “A novel hybrid model of rotation forest based functional trees for landslide susceptibility mapping: A case study at kon tum Province, vietnam. Pages 186–201,” in Advances and applications in geospatial Technology and earth Resources. Editors D. Tien Bui, A. Ngoc Do, H.-B. Bui, and N.-D. Hoang (Cham: Springer International Publishing).
Pham, B. T., Prakash, I., Dou, J., Singh, S. K., Trinh, P. T., Tran, H. T., et al. (2020). A novel hybrid approach of landslide susceptibility modelling using rotation forest ensemble and different base classifiers. Geocarto Int. 35, 1267–1292. doi:10.1080/10106049.2018.1559885
Pham, B. T., Prakash, I., Singh, S. K., Shirzadi, A., Shahabi, H., Tran, T.-T.-T., et al. (2019). Landslide susceptibility modeling using Reduced Error Pruning Trees and different ensemble techniques: Hybrid machine learning approaches. CATENA 175, 203–218. doi:10.1016/j.catena.2018.12.018
Pham, B. T., Tien Bui, D., Dholakia, M. B., Prakash, I., and Pham, H. V. (2016). A comparative study of least square support vector machines and multiclass Alternating decision trees for spatial prediction of rainfall-induced landslides in a tropical cyclones area. Geotech. Geol. Eng. (Dordr). 34, 1807–1824. doi:10.1007/s10706-016-9990-0
Pham, B. T., Tien Bui, D., Pourghasemi, H. R., Indra, P., and Dholakia, M. B. (2017b). Landslide susceptibility assesssment in the uttarakhand area (India) using GIS: A comparison study of prediction capability of naïve bayes, multilayer perceptron neural networks, and functional trees methods. Theor. Appl. Climatol. 128, 255–273. doi:10.1007/s00704-015-1702-9
Pham, B. T., Tien Bui, D., and Prakash, I. (2017c). Landslide susceptibility assessment using bagging ensemble based alternating decision trees, logistic regression and J48 decision trees methods: A comparative study. Geotech. Geol. Eng. (Dordr). 35, 2597–2611. doi:10.1007/s10706-017-0264-2
Pham, Q. B., Achour, Y., Ali, S. A., Parvin, F., Vojtek, M., Vojteková, J., et al. (2021). A comparison among fuzzy multi-criteria decision making, bivariate, multivariate and machine learning models in landslide susceptibility mapping. Geomatics, Nat. Hazards Risk 12, 1741–1777. doi:10.1080/19475705.2021.1944330
Pourghasemi, H. R., and Kerle, N. (2016). Random forests and evidential belief function-based landslide susceptibility assessment in Western Mazandaran Province, Iran. Environ. Earth Sci. 75, 185. doi:10.1007/s12665-015-4950-1
Pourghasemi, H. R., Mohammady, M., and Pradhan, B. (2012a). Landslide susceptibility mapping using index of entropy and conditional probability models in GIS: Safarood Basin, Iran. CATENA 97, 71–84. doi:10.1016/j.catena.2012.05.005
Pourghasemi, H. R., Pradhan, B., and Gokceoglu, C. (2012b). Application of fuzzy logic and analytical hierarchy process (AHP) to landslide susceptibility mapping at Haraz watershed, Iran. Nat. Hazards (Dordr). 63, 965–996. doi:10.1007/s11069-012-0217-2
Pradhan, B. (2013). A comparative study on the predictive ability of the decision tree, support vector machine and neuro-fuzzy models in landslide susceptibility mapping using GIS. Comput. Geosciences 51, 350–365. doi:10.1016/j.cageo.2012.08.023
Rafiei Sardooi, E., Azareh, A., Mesbahzadeh, T., Soleimani Sardoo, F., Parteli, E. J. R., and Pradhan, B. (2021). A hybrid model using data mining and multi-criteria decision-making methods for landslide risk mapping at Golestan Province, Iran. Environ. Earth Sci. 80, 487. doi:10.1007/s12665-021-09788-z
Reichenbach, P., Rossi, M., Malamud, B. D., Mihir, M., and Guzzetti, F. (2018). A review of statistically-based landslide susceptibility models. Earth-Science Rev. 180, 60–91. doi:10.1016/j.earscirev.2018.03.001
Rodriguez, J. J., Kuncheva, L. I., and Alonso, C. J. (2006). Rotation forest: A new classifier ensemble method. IEEE Trans. Pattern Anal. Mach. Intell. 28, 1619–1630. doi:10.1109/tpami.2006.211
Rosi, A., Tofani, V., Tanteri, L., Tacconi Stefanelli, C., Agostini, A., Catani, F., et al. (2018). The new landslide inventory of tuscany (Italy) updated with PS-InSAR: Geomorphological features and landslide distribution. Landslides 15, 5–19. doi:10.1007/s10346-017-0861-4
Saha, A. K., Gupta, R. P., Sarkar, I., Arora, M. K., and Csaplovics, E. (2005). An approach for GIS-based statistical landslide susceptibility zonation?with a case study in the Himalayas. Landslides 2, 61–69. doi:10.1007/s10346-004-0039-8
Sangchini, E. K., Emami, S. N., Tahmasebipour, N., Pourghasemi, H. R., Naghibi, S. A., Arami, S. A., et al. (2016). Assessment and comparison of combined bivariate and AHP models with logistic regression for landslide susceptibility mapping in the Chaharmahal-e-Bakhtiari Province, Iran. Arab. J. Geosci. 9, 201. doi:10.1007/s12517-015-2258-9
Shahabi, H., Hashim, M., and Ahmad, B. B. (2015). Remote sensing and GIS-based landslide susceptibility mapping using frequency ratio, logistic regression, and fuzzy logic methods at the central Zab basin, Iran. Environ. Earth Sci. 73, 8647–8668. doi:10.1007/s12665-015-4028-0
Shirzadi, A., Soliamani, K., Habibnejhad, M., Kavian, A., Chapi, K., Shahabi, H., et al. (2018). Novel GIS based machine learning algorithms for shallow landslide susceptibility mapping. Sensors, 18. 3777. doi:10.3390/s18113777
Shou, K.-J., and Lin, J.-F. (2016). Multi-scale landslide susceptibility analysis along a mountain highway in Central Taiwan. Eng. Geol. 212, 120–135. doi:10.1016/j.enggeo.2016.08.009
Tien Bui, D., Ho, T.-C., Pradhan, B., Pham, B.-T., Nhu, V.-H., and Revhaug, I. (2016a). GIS-based modeling of rainfall-induced landslides using data mining-based functional trees classifier with AdaBoost, Bagging, and MultiBoost ensemble frameworks. Environ. Earth Sci. 75, 1101. doi:10.1007/s12665-016-5919-4
Tien Bui, D., Hoang, N.-D., Nguyen, H., and Tran, X.-L. (2019a). Spatial prediction of shallow landslide using bat algorithm optimized machine learning approach: A case study in lang son Province, vietnam. Adv. Eng. Inf. 42, 100978. doi:10.1016/j.aei.2019.100978
Tien Bui, D., Shahabi, H., Omidvar, E., Shirzadi, A., Geertsema, M., Clague, J., et al. (2019b). Shallow landslide prediction using a novel hybrid functional machine learning algorithm. Remote Sens. 11, 931. doi:10.3390/rs11080931
Tien Bui, D., Tuan, T. A., Klempe, H., Pradhan, B., and Revhaug, I. (2016b). Spatial prediction models for shallow landslide hazards: A comparative assessment of the efficacy of support vector machines, artificial neural networks, kernel logistic regression, and logistic model tree. Landslides 13, 361–378. doi:10.1007/s10346-015-0557-6
Tin Kam Ho (1998). The random subspace method for constructing decision forests. IEEE Trans. Pattern Anal. Mach. Intell. 20, 832–844. doi:10.1109/34.709601
Toebe, M., and Cargnelutti Filho., A. (2013). Multicollinearity in path analysis of maize (Zea mays L.). J. Cereal Sci. 57, 453–462. doi:10.1016/j.jcs.2013.01.014
Trigila, A., Iadanza, C., Esposito, C., and Scarascia-Mugnozza, G. (2015). Comparison of logistic regression and random forests techniques for shallow landslide susceptibility assessment in giampilieri (NE sicily, Italy). Geomorphology 249, 119–136. doi:10.1016/j.geomorph.2015.06.001
Tsangaratos, P., and Ilia, I. (2016). Comparison of a logistic regression and Naïve Bayes classifier in landslide susceptibility assessments: The influence of models complexity and training dataset size. CATENA 145, 164–179. doi:10.1016/j.catena.2016.06.004
Umar, Z., Pradhan, B., Ahmad, A., Jebur, M. N., and Tehrany, M. S. (2014). Earthquake induced landslide susceptibility mapping using an integrated ensemble frequency ratio and logistic regression models in West Sumatera Province, Indonesia. CATENA 118, 124–135. doi:10.1016/j.catena.2014.02.005
Varnes, D. J. (1978). “Slope movement types and processes,” in Landslide analysis and control, special report 176, transportation research board. Editors R. L. Schuster, and R. J. Krizek (Washington DC: National Academy of Sciences), 12–33.
Wang, L.-J., Guo, M., Sawada, K., Lin, J., and Zhang, J. (2016a). A comparative study of landslide susceptibility maps using logistic regression, frequency ratio, decision tree, weights of evidence and artificial neural network. Geosci. J. 20, 117–136. doi:10.1007/s12303-015-0026-1
Wang, Q., Li, W., Wu, Y., Pei, Y., and Xie, P. (2016b). Application of statistical index and index of entropy methods to landslide susceptibility assessment in Gongliu (Xinjiang, China). Environ. Earth Sci. 75, 599. doi:10.1007/s12665-016-5400-4
Wu, Y., Ke, Y., Chen, Z., Liang, S., Zhao, H., and Hong, H. (2020). Application of alternating decision tree with AdaBoost and bagging ensembles for landslide susceptibility mapping. CATENA 187, 104396. doi:10.1016/j.catena.2019.104396
Xu, C., Dai, F., Xu, X., and Lee, Y. H. (2012). GIS-based support vector machine modeling of earthquake-triggered landslide susceptibility in the Jianjiang River watershed, China. Geomorphology 145-146, 70–80. doi:10.1016/j.geomorph.2011.12.040
Yan, G. (2016). Landslide susceptibility mapping in huachi country of gansu Province. Lanzhou: Lanzhou University.
Yu, X., Wang, Y., Niu, R., and Hu, Y. (2016). A combination of geographically weighted regression, particle swarm optimization and support vector machine for landslide susceptibility mapping: A case study at wanzhou in the three gorges area, China. Int. J. Environ. Res. Public Health 13, 487. doi:10.3390/ijerph13050487
Keywords: landslide susceptibility, machine learning, hybrid model, slope unit, grid unit
Citation: Deng N, Li Y, Ma J, Shahabi H, Hashim M, de Oliveira G and Chaeikar SS (2022) A comparative study for landslide susceptibility assessment using machine learning algorithms based on grid unit and slope unit. Front. Environ. Sci. 10:1009433. doi: 10.3389/fenvs.2022.1009433
Received: 01 August 2022; Accepted: 19 October 2022;
Published: 01 November 2022.
Edited by:
Yusen He, Grinnell College, United StatesReviewed by:
Achu A. L, Kerala University of Fisheries and Ocean Studies, IndiaCopyright © 2022 Deng, Li, Ma, Shahabi, Hashim, de Oliveira and Chaeikar. This is an open-access article distributed under the terms of the Creative Commons Attribution License (CC BY). The use, distribution or reproduction in other forums is permitted, provided the original author(s) and the copyright owner(s) are credited and that the original publication in this journal is cited, in accordance with accepted academic practice. No use, distribution or reproduction is permitted which does not comply with these terms.
*Correspondence: Himan Shahabi, aC5zaGFoYWJpQHVvay5hYy5pcg==
Disclaimer: All claims expressed in this article are solely those of the authors and do not necessarily represent those of their affiliated organizations, or those of the publisher, the editors and the reviewers. Any product that may be evaluated in this article or claim that may be made by its manufacturer is not guaranteed or endorsed by the publisher.
Research integrity at Frontiers
Learn more about the work of our research integrity team to safeguard the quality of each article we publish.