 Jing Wang1,2*
 Mohan Liu1*
- 1Institute of Finance and Economics Research, Shanghai University of Finance and Economics, Shanghai, China
- 2Institute for Yangtze River Delta and Yangtze River Economic Belt Development, Shanghai University of Finance and Economics, Shanghai, China
To solve the problem of large carbon emissions in rural area, this paper conducts field research in rural areas of Shandong and embarks on supply-demand bilateral energy structure optimization which combines local resource endowments, the latest rural energy application technologies and energy consumption preference. The study uses long-range energy alternatives planning (LEAP) model to analyze the trend of energy consumption and CO2 emission from 2020 to 2050 under four different scenarios. The results of Tanzhuang show that residents in rural areas still rely on traditional biomass for energy consumption, especially for winter heating. Energy structure optimization has a significant impact on energy saving and emission reduction. Energy consumption and generation are projected steadily up to 2050 under all scenarios while the carbon emissions show a downward trend with a rapid decline from 2021 to 2030 and a relatively stable state for the next 20 years. Combining policy advancement and marginal carbon abatement cost (MACC) of different energy technologies, energy structure optimization-low cost (ESO-LOW) scenario shows a higher emission reduction benefits than the others. Six other villages in Shandong are analyzed in order to demonstrate the effectiveness of supply-demand bilateral energy structure optimization, sensitivity results show that the optimization is significant to the carbon neutrality target and carbon emission reduction.
1 Introduction
In recent years, global warming receives great attention. As the world’s largest primary energy consumer and greenhouse gas emitter, China strives to achieve carbon peaking by 2030 and carbon neutrality by 2060 (referred to as the “dual carbon” goal) (Xi, 2020). However, with the improvement of residents’ living standards, the consumption activities of products and services, which lead to the massive use of fossil energy, also rises rapidly (Chao et al., 2019). The household sector has gradually become the second largest carbon emitting sector after the industrial sector (Runst and Thoniparaanita, 2020). Studies have shown that household consumption accounts for 40% of China’s total emissions (Qi and Li, 2020). It indicates that household is an important driving factor for carbon emissions growing in China (Yuan et al., 2015). Compared with households in urban areas, rural households have a larger population (National Bureau of Statistics of China, 2021) and more complex energy utilization format. Therefore, optimizing energy structure is urgent for rural areas.
Many studies in literature have focused on demand-side or supply-side optimization of energy for rural residents using different models. As for the rural energy demand side, the researches mainly concentrated on energy consumption characteristics (Wu et al., 2019; Zou and Luo, 2019; Yang et al., 2021) and optimization of consumption structure (Jin et al., 2019; Hong, 2020; Wang et al., 2021; Imran et al., 2022). Zou et al. (Zou and Luo, 2019) and Wu et al. (Wu et al., 2019) proved that the current energy consumption of rural residents was dominated by biomass energy, and could be transformed to clean energy in the future. Yang et al. (Yang et al., 2021) believed that heating in winter was a key factor affecting the total energy consumption of rural residents, and there existed significant differences in biomass energy consumption among different users. Aiming at optimizing consumption structure, GM (1, 1) and MARKAL model (Hong, 2020), LMDI model (Wang et al., 2021) and STIRPAT model (Imran et al., 2022) were used to evaluate the factors affecting rural energy consumption.
In addition to the research on rural household energy consumption, many scholars have discussed the optimization of rural household energy structure from the supply side (Johnson and Bryden, 2012; Ye and Zhao, 2014; Agrawala et al., 2020; Pelz, 2020). Pelz (Pelz, 2020) believed that spatial heterogeneity was an important factor which affecting the energy supply side reform of rural households. Ye et al. (Ye and Zhao, 2014) investigated the rural electricity consumption in Heilongjiang and pointed out that the use of efficient crop straw energy utilization technology could improve the effective heat supply rate of crop straw. Based on survey data in rural India, Sa et al. (Agrawala et al., 2020) concluded that insufficient power supply from the grid was the main reason for the low level of electricity consumption in rural area. In order to solve the current situation of insufficient energy demand, Johnson et al. (Johnson and Bryden, 2012) applied energy supply side reform to rural households, which in low- and middle-income countries.
The literature studies show that:
1) the existing rural household energy researches mainly focus on improving the rate of the supply side and the conversion efficiency of the demand side, but do not consider the bidirectional effects of supply and demand sides under local resource endowments. However, the energy supply side and the demand side are interactively affected, and the one side structural optimization cannot reflect the impact of energy transformation on the overall carbon emissions. The rural energy structure reform has the characteristics of “adapting measures to local conditions”, this paper combines local resources endowment and cutting-edge energy technologies to propose the supply-demand bilateral energy structure optimization, so as to achieve the goal of energy conservation and emission reduction.
2) At present, the research on rural energy planning mostly uses macro data. There is significant spatial heterogeneity in the resource endowment and economic development level of China’s rural areas. Thus, the energy structure optimization based on macro data lacks promotion value (Shi et al., 2014). In recent years, there are several solid research based on rural energy survey data (Jiang et al., 2021; Wu et al., 2021; Chen et al., 2022). But the discussion on the status quo of rural energy consumption and energy use patterns, which is the basis of energy structure optimization, is relatively lacking. Thus, this paper conducts field investigations on typical rural areas in Shandong Province, and optimizes supply-demand bilateral energy structure based on micro data and macro data.
3) The direct combustion of biomass energy occupies a dominant position in the energy consumption of rural residents in China. Based on the actualities that biomass energy is mostly used for cooking and winter heating (Liu et al., 2020), this paper analyzes the current situation of energy use for winter heating and applies cutting-edge heating technologies to promote clean energy consumption and rural energy supply side optimization. Biomass resources such as firewood and straw are rich in rural areas. In response to this, this paper makes full use of local biomass resources and climate advantages to optimize the energy supply side.
4) The energy structure optimization based on top-to-bottom micro-models reflects the behavioral characteristics of sectors in the economic system, but rarely describes the energy sector and the energy flow (Ciarli and Savona, 2019). Therefore, the LEAP model is suitable for identifying the effectiveness of energy structure reforms and predicting carbon emissions, after taking into account energy end use and energy type (Lazarus et al., 1997). With the proposal of the “dual carbon” goal, the research of rural household carbon emissions based on LEAP model has attracted increasing attention (Chawana, 2007; Hussain et al., 2021; Sessa et al., 2021). The above studies lack consideration of cost minimization and the impact of policies on costs. However, cost is an important factor affecting rural energy structure (Hu et al., 2019), and the subsidy policy for rural clean energy use is closely related to the cost of energy structure optimization. Therefore, it is critical to produce and use clean energy at the lowest possible economic cost. In this paper, MACC, an important energy saving and emission reduction program selection tool (Jiang et al., 2020; Jiang et al., 2022a; Jiang et al., 2022b), is combined with LEAP, to achieve supply-demand bilateral energy structure optimization with the minimum economic cost.
In summary, to deal with energy reform on supply and demand sides, this paper proposes a revised LEAP model to explore the trend of energy consumption and carbon emissions from 2021 to 2050, and calculate MACC for different scenarios for seven typical rural areas in Shandong. The main contributions of this paper are as follows: 1) this paper optimizes the rural household energy structure on supply and demand sides relied on local resource endowments. On the demand side, the researchers put forward equipment efficiency improvement and introduction of new equipment through analysis of energy usage habit, while developing biomass, wind and solar energy on the supply side; 2) after setting BAS, ESO, ESO-EFF and ESO-LOW scenarios, this paper simulates the energy consumption of rural households and focuses on the impact of heating in winter; 3) this paper proposes a revised LEAP model combined with MACC, a method to evaluate the economic cost of energy-saving technologies, to analyze the differences in carbon emissions among different scenarios; 4) this paper conducts field research on seven villages in Shandong Province and analyzes the impact of supply and demand sides energy structure reforms on energy consumption and carbon emissions based on micro data. The selection of different regions further proves the effectiveness of the supply-demand bilateral energy structure optimization.
2 Methodology and data
2.1 Long-range energy alternatives planning model
The LEAP system, developed by the Stockholm Environment Institute (SEI) in Sweden, is an energy-economy-environment comprehensive modeling platform based on scenario analysis (Ciarli and Savona, 2019). The technical roadmap of the LEAP model is shown in Figure 1.
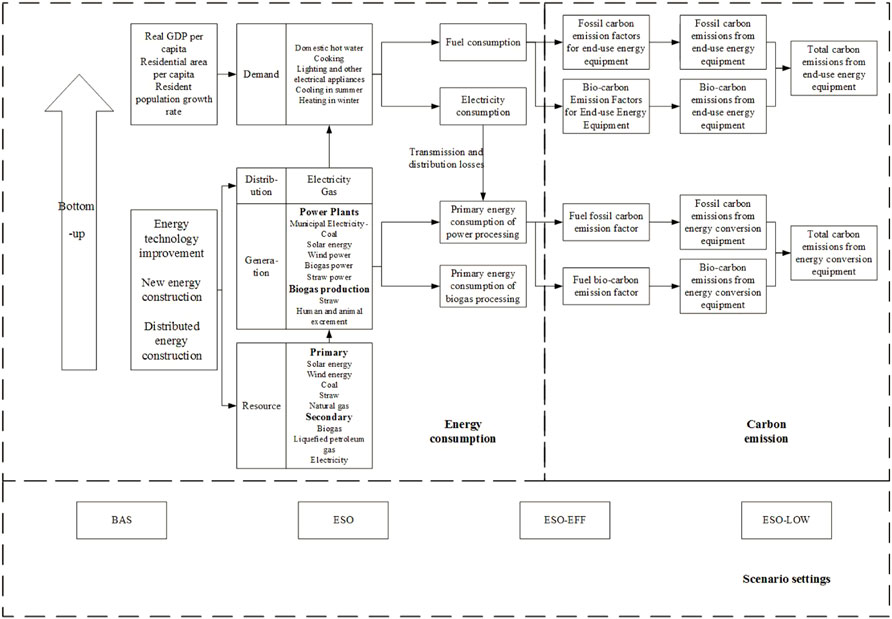
FIGURE 1. LEAP model technology roadmap.
As shown in Figure 1, the technical roadmap of LEAP can be divided into two parts, the left part is the calculation of energy consumption which consists of “terminal energy demand”, “transmission and distribution loss” and “input-output supply”. The “terminal energy demand” module includes the types and quantities of energy consumed by different demand sectors of rural households while the “transmission and distribution loss” module mainly contains the loss of energy in the transmission link. The overall energy demand (
where
The energy production module mainly includes dispatch rule, process efficiency, exogenously specified capacity, maximum availability, etc. For each supply technologies, the overall energy supply (
in which
The right half of Figure 1 is the calculation of CO2 emissions. Referring to the carbon emission factors of primary fuel in “2019 Refinement to the 2006 IPCC Guidelines for National Greenhouse Gas Inventory” (Intergovernmental Panel on Climate Change (IPCC), 2019), the total CO2 emission of the demand sector (
where
2.2 Marginal carbon abatement cost
As a general measure of emission reductions effect, MACC provides a quantitative criteria to measure which actions have the most efficient emission reductions capabilities (Wu et al., 2014; Rahman and Kirkman, 2015). MACC is able to compare the emission reduction effect of a series of emission reduction measures by displaying the relationship between potential emission reductions and corresponding costs. MACC in whole life cycle can be estimated as follows:
where
2.3 Date resource
Shandong Province, located in the eastern China, is not only a large agricultural province, but also a province with large economic and populations. According to Shandong Statistical Yearbook 2021 and National Statistical Yearbook 2021, in 2020, the rural population of Shandong accounted for 10.28% of the national rural population while the energy consumption accounted for 8.39%. Therefore, as a province with a large rural energy consumption, it is necessary to accelerate the energy structure optimization.
The researchers obtain the energy consumption intensity and structure of rural residents in 2020 through the ground investigation of rural household energy consumption in Shandong Province. This field survey involves seven villages in different cities and collects 661 valid survey questionnaires.
Considering the complexity of carbon emissions in Shandong, the scenarios of baseline (BAS), energy structure optimization on the supply demand bilateral (ESO), energy structure optimization efficiency (ESO-EFF) and ESO-LOW are set depending on the economy, population and policy. The relevant policy basis for the scenario setting in this section is based on Tanzhuang, Dezhou City, Shandong Province as an example.
3.1 BAS scenario
In BAS scenario, 2020 is set as the baseline. In this scenario, the impact of future energy conservation and emission reduction policies is not take into consideration, nor does the optimization of rural energy structure. The energy structure and energy-saving technologies are set in conformance with existing energy conservation and emission reduction policy.
3.2 Energy structure optimization scenario
With fully consideration of “Research Report on New Energy Development in Dezhou City”, “Shandong Province Energy Medium and Long-term Development Plan (Public Draft)” and “The 14th Five-Year Plan for Energy Development of Shandong Province”, ESO scenario combines resource endowments with new technologies to optimize the rural energy structure from both sides.
The energy structure optimization diagram on supply-demand bilateral is shown in Figure 2, where the left side is the energy structure optimization on the demand side, and the right side is the energy structure optimization on the supply side.
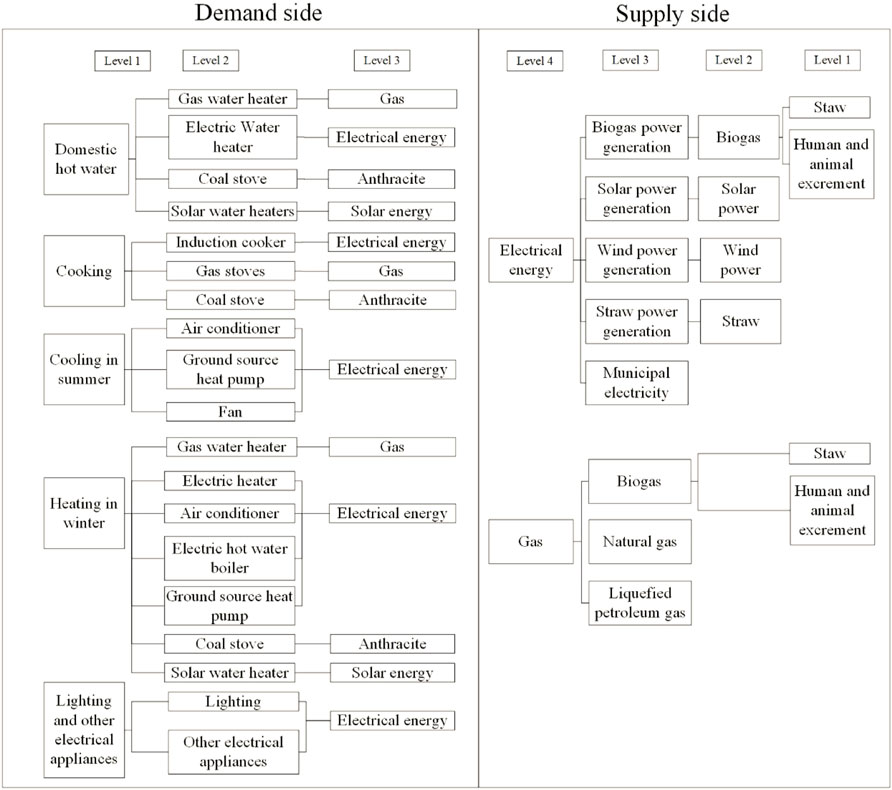
FIGURE 2. Supply-demand bilateral energy structure optimization.
3.3 Energy structure optimization-EFF scenario
ESO-EFF scenario is set according to “China Energy and Power Development Outlook 2020” and “The 14th Five-Year Plan for Renewable Energy Development”. In the scenario, energy efficiency level and supply-demand bilateral energy structure are optimized. Meanwhile, technologies with higher energy efficiency are applied. This scenario focuses on promoting energy-consuming equipment with high emission reduction on the demand side, and deploying distributed power generation on the supply side. However, ESO-EFF takes less consideration of cost. To sum up, ESO-EFF scenario emphasizes on the impact of technological progress on economic development, energy consumption and carbon emissions.
3.4 Energy structure optimization-low cost scenario
ESO-LOW is a cost minimization scenario under the ESO scenario. In this scenario, cost reduction guides the technology selection in supply-demand bilateral energy structure optimization, and energy-saving awareness of rural households is lower than ESO and ESO-EFF scenarios, but still higher than BAS scenario. This scenario basically reflects the cost-oriented state of rural energy consumption and carbon emissions. In summary, the reference basis for the four scenarios is shown in Table 1.
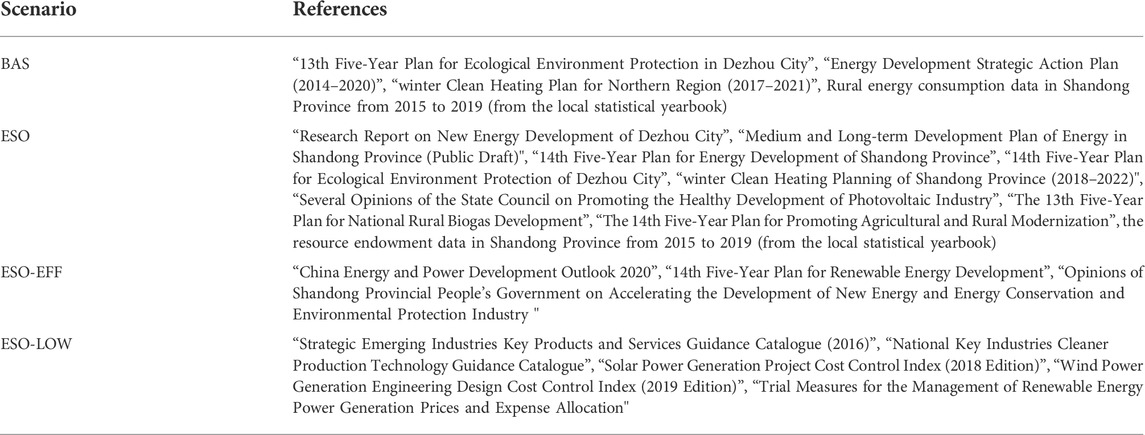
TABLE 1. Reference basis for four scenarios.
4 Result analysis
4.1 Case 1
4.1.1 Energy consumption analysis
This paper takes Tanzhuang, Dezhou City, Shandong Province as an example. According to field research data and scenario analysis, for the demand side, the energy demand structure for the BAS, ESO, ESO-EFF, ESO-LOW scenario in Tanzhuang is shown in the follow figure:
In Figure 3A, the energy demand is rising under the four scenarios with different rates. winter heating accounts for the most significant proportion of energy consumption. Also, it proves that optimizing the heating equipment in winter in rural areas is the key to energy saving. Different from the smooth rise of total energy demand in the BAS scenario, the total energy demand in the ESO-based scenarios show slow increases in 2020–2030, and accelerated in 2030–2050, which is similar to the increasing trend of energy demand for winter heating. As shown in Figure 3B, with the promotion of “winter Clean Heating Plan in Shandong Province”, in ESO-based scenarios, gas water heaters and electric hot water boilers replace bulk coal and direct straw combustion. It offsets the energy consumption increase brought by implementing “Regulations on the Promotion of Rural Revitalization in Shandong Province” and slowdown the growth rate of energy consumption. However, the progress of clean heating renovation gradually slows down, and the role of rural revitalization in promoting energy consumption emerges accordingly after 2030. Therefore, the energy consumption growth rate will increase from 2030 to 2050.
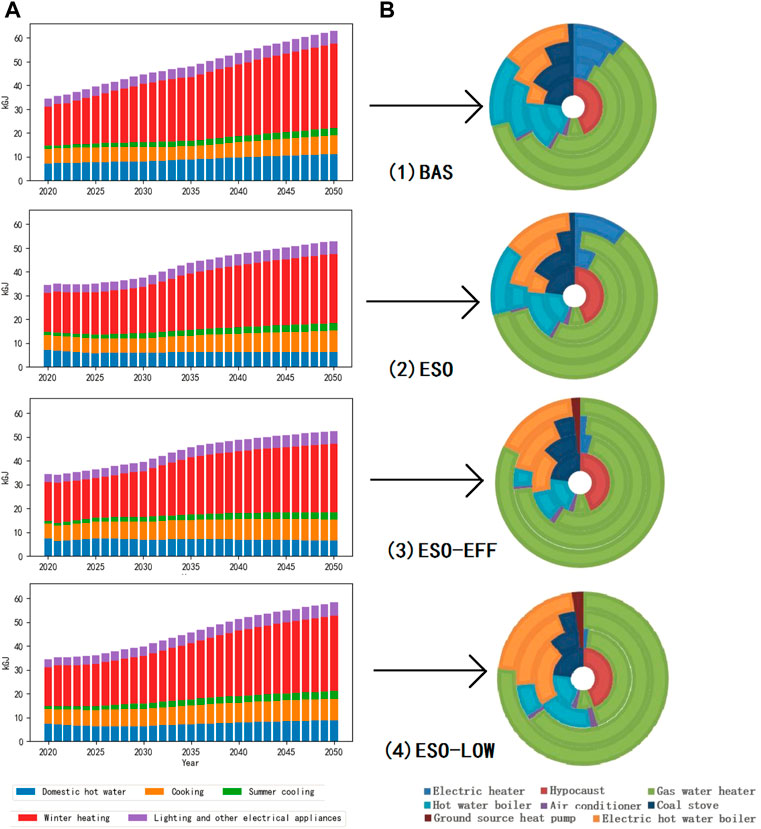
FIGURE 3. (A) Energy demand by sector of all scenarios in Tanzhuang and (B) winter heating energy equipment of all scenarios in Tanzhuan (from the inside to the outside: 2020, 2030, 2040, 2050).
According to Figure 4, electric energy consumption and natural gas consumption show a steady growth trend in all four scenarios and eventually become the main energy consumption, among which the electric energy consumption in four scenarios increases from 7.40 kGJ in 2020 to 22.72 kGJ, 16.29 kGJ, 15.00 kGJ and 19.44 kGJ in 2050 respectively. Nature gas consumption of four scenarios increases from 5.00 kGJ to 32.19 kGJ, 25.65 kGJ, 27.62 kGJ and 27.59 kGJ in 2050 respectively. This indicates that supply-demand bilateral energy structure optimization and high-efficiency equipment have brought a positive impact on reducing energy consumption. The ESO-based scenarios introduce biogas as fuel gas and focus on solar energy. With electrification and gasification, the process of “de-coalization” in rural areas is accelerated. However, BAS scenario is limited to the existing energy structure and cannot completely get rid of coal. Therefore, although coal usage is on a downward trend, it is still much higher than in other scenarios. Due to the fact that the supply of electricity and gas cannot meet the demand of rural households after de-coalization, the consumption of anthracite based on the ESO scenario presents an inverted U-shaped trend. Considering the transformation of the power grid and the construction period of gas pipeline network, the consumption of anthracite shows a trend of first rising and then falling. By 2050, “gas substitute coal” and “electricity substitute coal” is basically realized.
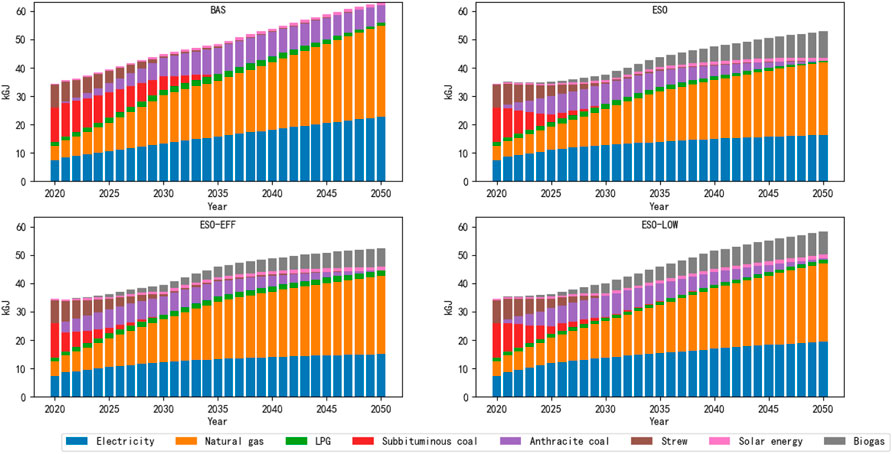
FIGURE 4. Energy demand by fuel of all scenarios in Tanzhuang.
Figure 5 shows the electricity outputs projection to 2050 in Tanzhuang of all scenario. So as to meet the growing electricity demand of rural residents, the electricity generation under four scenarios is expected to expand by 2050, reaching 25.30 kGJ, 18.10 kGJ, 16.50 kGJ and 21.60 kGJ, respectively. Electricity generation under BAS scenario is larger than other scenarios. This is due to the implementation of many energy saving techniques in other scenarios, which leads to energy saving and electricity demand reduction.
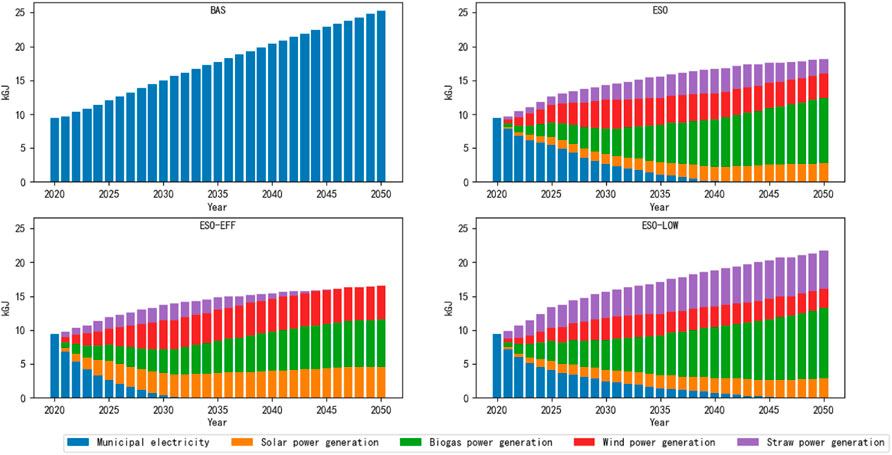
FIGURE 5. Energy used for electricity generation by fuel of all scenarios in Tanzhuang.
From Figure 5, we can see that proportion of renewable energy generation steadily increases under the ESO-based scenarios. By 2050, relying on local resource endowments, the replacement of traditional coal power generation can be basically completed. With the promulgation of the “13th Five-Year Plan for National Rural Biogas Development”, the large and medium-sized biogas projects, which can provide stable clean energy and achieve grid-connected power generation, are actively promoted. Thus, in order to use biogas more efficiently, this paper assumes that Tanzhuang focuses on building large and medium-sized biogas projects to meet the electricity and gas needs of rural residents. It can be seen from Figure 5 that the sum of wind and solar power in the ESO-EFF scenarios much higher than in the ESO and ESO-LOW scenarios. This is mainly because that the carbon emissions of wind and solar power generation, which are lower than biomass power generation, are in line with the low-carbon requirements of ESO-EFF scenario. Compared with other energy power generations, the maintenance cost of wind power and the initial cost of solar power are higher, thus wind and solar power take a less proportion in the ESO-LOW scenario. Due to the various use of straw, the fuel source of straw power plants is not stable enough. Unlike other new energy power generations, the current technologies of straw power generation are not perfect and the carbon emissions are still high. Therefore, in the ESO and ESO-EFF scenarios, the proportion of straw power generation is relatively low. The construction period of straw power generation project is short, which can make up for the power supply gap caused by the lack of other new energy power supply in the early stage. With the development of other new energy power generation systems, straw power generation is gradually replaced. So the growth trend of straw power generation presents an inverted U-shaped curve. However, the cost of straw power generation is relatively low, so the proportion of straw power generation increases yearly.
4.1.2 CO2 emission analysis
The change trend of carbon emissions of rural household energy consumption in Tanzhuang from 2020 to 2050 is shown in Figure 6.
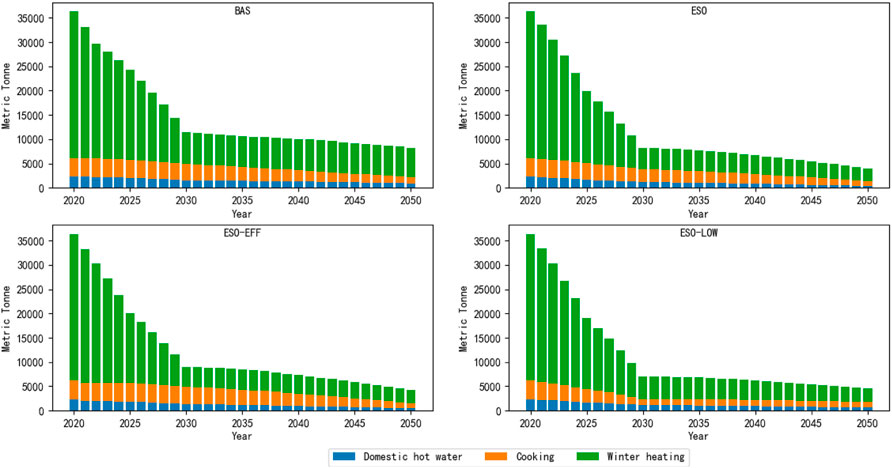
FIGURE 6. Carbon emission by sector of all scenarios in Tanzhuang.
As shown in Figure 6, compared with 2020, the CO2 emissions of rural household energy consumpion in Tanzhuang decrease by 68.52%, 77.48%, 75.20%, and 80.66% under the four scenarios in 2030, and 77.34%, 88.94%, 88.32%, and 87.57% in 2050. The total CO2 emissions show a trend of continuous decline under the four scenarios. Taking 2030 as the dividing point, the decline is rapid from 2020 to 2030 and decelerates after 2030 while finally maintaining a stable state. It shows the same trend of the carbon emissions from heating in winter.
Figure 7A shows the total winter heating carbon emissions of rural households in Tanzhuang. With the implementation of the “winter Clean Heating Plan in Shandong Province”, the replacement and optimization of traditional heating methods have greatly reduced the total carbon emissions.
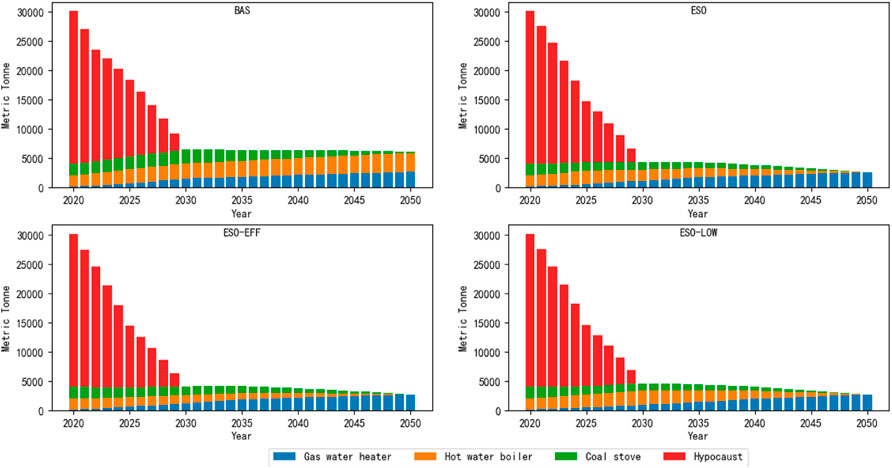
FIGURE 7. (A) Carbon emission of winter heating by sector under all scenarios in Tanzhuang and (B) carbon emission per unit building area in winter heating.
In order to further analyze the relationship between energy structure optimization and carbon emissions, the paper extracts the winter heating carbon emissions per unit building area. The result is shown in Figure 7B.
As shown in Figure 7B, in 2050, the winter heating carbon emissions per unit building area under the ESO-EFF scenario is lower than under the ESO scenario, which proves that the innovation of winter heating technology has a positive impact on the reduction of carbon emissions after economic growth and population changes are excluded.
As shown in Figure 8, carbon emissions decrease as energy demand increases under four scenarios. This is mainly due to the low clean energy usage in winter heating sector, which leads to a large potential for clean energy. So even if energy consumption rises in the future, the carbon emissions still fall. Comparing the carbon emission trends of the four scenarios, it can be seen that in 2050, the BAS scenario has the most carbon emissions, followed by the ESO-LOW scenario, the ESO-EFF scenario and the ESO scenario. The ESO-EFF scenario, which has a lager usage of natural gas, has slightly higher carbon emissions than the ESO scenario. Natural gas belongs to primary energy and is included indirect carbon emissions when calculating carbon emissions in the household sector. Electricity belongs to secondary energy, which is recorded as 0 when calculating carbon emissions. Thus, the higher proportion of natural gas usage results in more carbon emissions than the higher proportion of electricity usage.
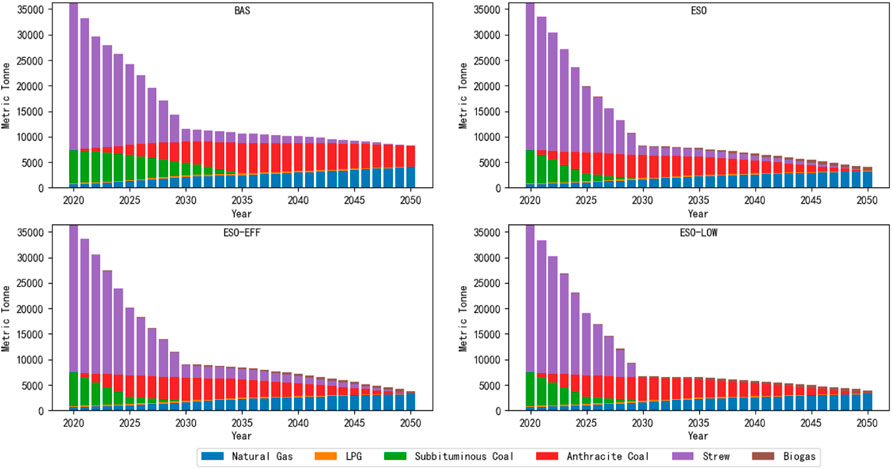
FIGURE 8. Carbon emission by fuel of all scenarios in Tanzhuang.
As shown in Figure 9, the carbon emissions under the BAS and ESO-LOW scenarios show an upward trend. In the context of rural revitalization, the increase in electricity supply under the BAS scenario, which relies on the original coal power generation, inevitably leads to an increase in carbon emissions. Biomass power generation dominates the new energy power generation under the ESO-LOW scenario. Thus, with the increase in power demand, the supply-side carbon emissions under the ESO-LOW scenario also show an upward trend. Under the ESO scenario, the supply-side carbon emissions show a trend of first increasing and then stable. With the fact that other forms of new energy power generation gradually meet the needs of households, straw power generation and overall carbon emissions tend to stabilize. The ESO-EFF scenario vigorously develops wind and solar power generation, while straw power generation is only used as a supplement. In this context, with the improvement of other power generation systems, straw power generation gradually withdraws from the power generation structure, so the carbon emission presents an inverted U-shaped curve.
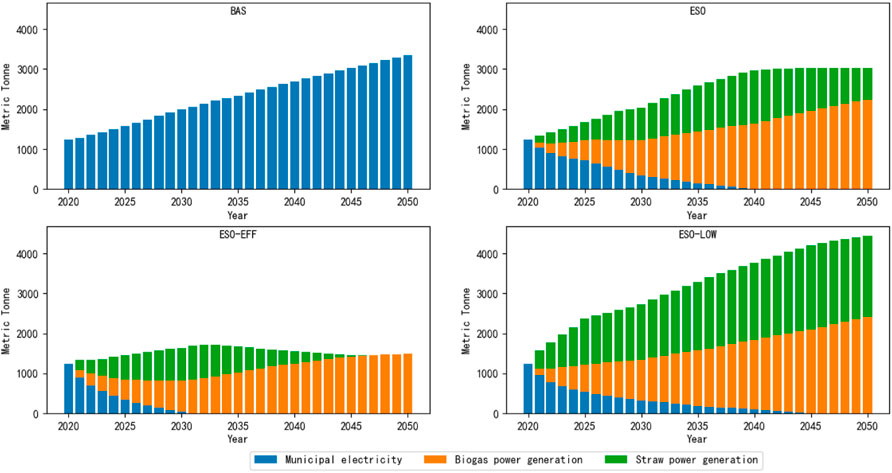
FIGURE 9. Carbon emission of electricity generation by sector of all scenarios in Tanzhuang.
4.1.3 Marginal carbon abatement cost analysis
Based on the LEAP model, the MACC of key emission reduction technologies obtained in Tanzhuang are shown in Table 2.
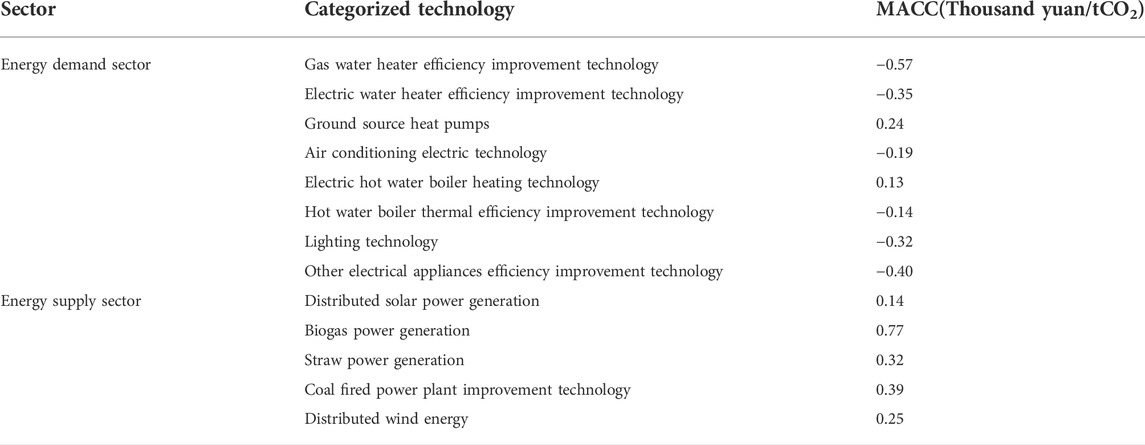
TABLE 2. The MACC of key emission reduction technologies in each sector.
It can be seen from the table that the key emission reduction technologies in Tanzhuang can be divided into two categories: the first one is below the horizontal axis, including gas water heater efficiency improvement technology, electric water heater efficiency improvement technology and air conditioning electric technology et al. These types of emission reduction measures can save cost while achieving the emission reduction target and should be implemented first; the second category is above the horizontal axis, including ground source heat pumps, electric hot water boiler heating technology and distributed solar power generation et al. These types of emission reduction measures need to pay a certain cost while completing carbon reduction.
The state and local governments provide some technical subsidies, which are shown in Table 3, to promote energy-saving and emission-reduction technologies.
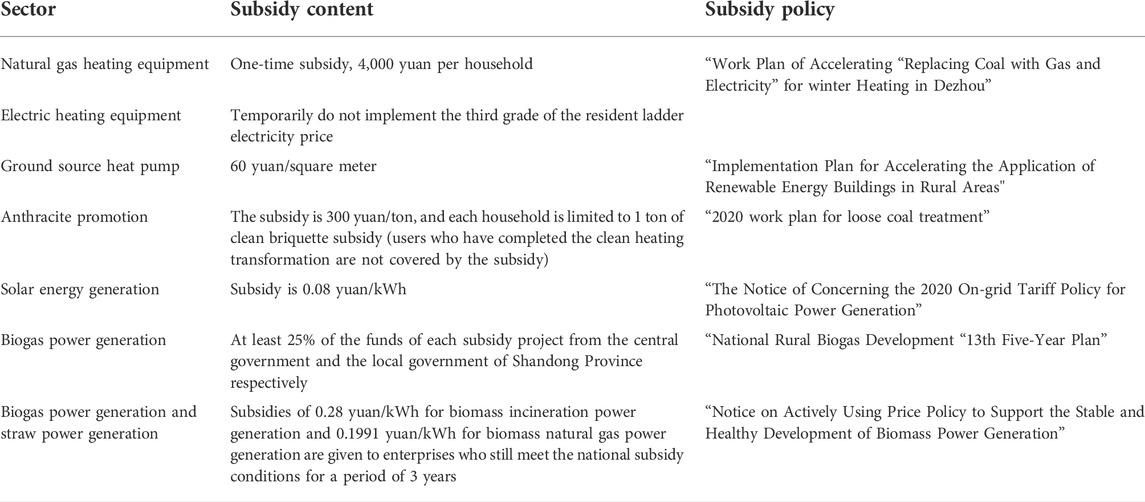
TABLE 3. Technical subsidies to promote energy-saving and emission-reduction technologies.
Based on MACC of key emission reduction technologies and subsidy policies, this paper calculates the carbon emission reduction costs of different scenarios from 2020 to 2050. The results are shown in Table 4. As shown in Table 3, the cumulative cost of ESO-EFF scenario is the lowest after considering government subsidies. Taking into account the emission reduction capabilities and costs, ESO-LOW is the most economical and feasible solution for Tanzhuang in four different scenarios.

TABLE 4. Carbon emission reduction potential and MACC of different scenarios.
4.2 Analysis of other villages
In order to further analyze the impact of supply-demand bilateral energy structure optimization on carbon emission reduction, this paper establishes six LEAP-Shandong models. In Figure 10A, the energy consumptions of the six villages show a growing trend, while the energy consumption s under the BSO scenario is higher than that under the ESO-based scenario. It proves that the energy-saving effect of the demand-side energy structure reform is outstanding. It can be seen from Figure 10A that the energy demand trends of the six villages can be divided into three categories: the energy demand of Donglou and Weijiawan show a fluctuating trend in the early stage. Through micro-investigation, we can see that the proportion of straw burning for winter heating in these two villages is relatively large. In order to achieve the policy requirement of “Shandong’s clean heating rate will increase to more than 80% in 2025” [“Shandong Province winter Clean Heating Plan (2018–2022)”], it is necessary to accelerate the replacement of traditional heating methods. The heating efficiency of natural gas and electricity is much higher than that of straw and coal incineration in the same area. Thus, the reduction in energy consumption is gradually higher than the increase in energy consumption. Therefore, an inverted U-shaped curve appears in the short term. With the comprehensive promotion of clean heating, the increase in energy consumption, which is caused by the improvement of rural household living standards, is gradually reflected, so the energy consumption of the two villages increase steadily after 2030; the growth rate of energy consumption in Jiangzhuang, Dongsun and Shuiniu is the same as that in Tanzhuang. Thus the reasons are not repeated here; different from the other two types of villages, the energy consumption of Weizhuang increases steadily from 2020 to 2050. Based on the micro survey, it can be seen that as a pilot village of “gas village-to-village”, Weizhuang has completed the laying of natural gas pipelines in 2017 and takes the lead in realizing clean heating. So from 2020 to 2050, rural household energy consumption increases with the increase of rural household income level, which is consistent with the research results of Shi Qinghua (Shi et al., 2014).
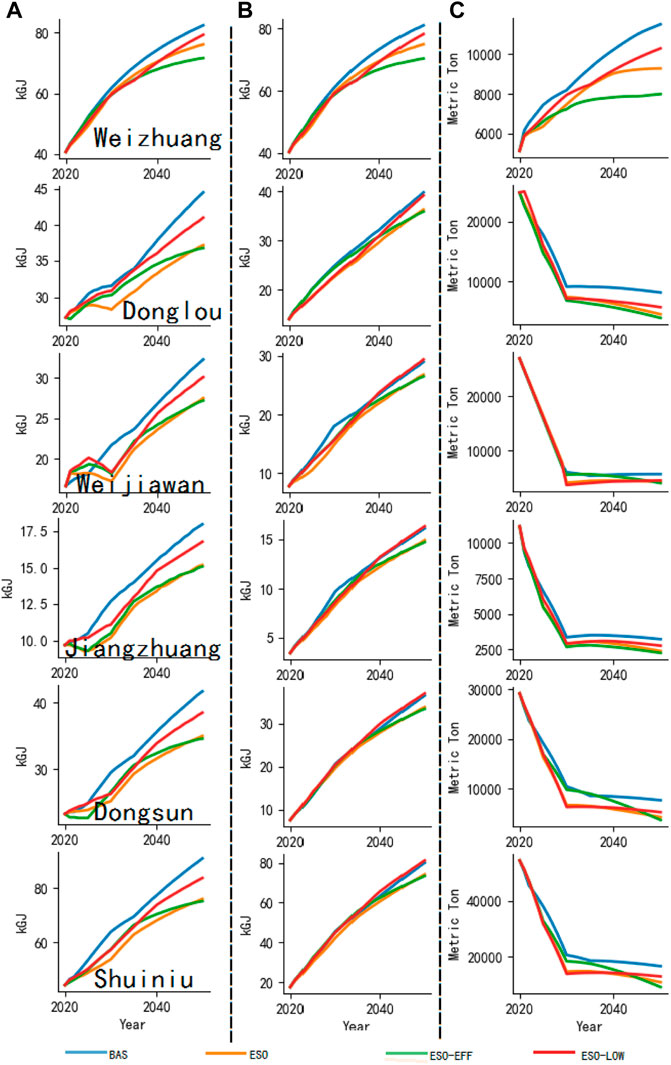
FIGURE 10. (A) Energy consumption in other villages under different scenarios and (B) energy supply in other villages under different scenarios and (C) carbon emission of other villages under different scenarios.
As shown in Figure 10B, the energy supply in the six villages shows an overall growth trend, which is the same as the trend of energy demand. Meanwhile, the energy supply based on the ESO scenario is lower than the BAS scenario, which proves the effectiveness of the supply-demand bilateral energy structure optimization.
As shown in Figure 10C, the supply-demand bilateral energy structure optimization is conducive to the reduction of rural household energy consumption. Further analysis shows that the trend of carbon emissions in six villages can be divided into two categories. As energy demand expands, the carbon emissions in Weizhuang increase. This is mainly because that the households in Weizhuang no longer use straw and coal as energy sources. Thus, carbon emissions with a high proportion of natural gas use also continue to rise. The carbon emissions of other villages decrease with the increase in energy consumption, which proves that the supply-demand bilateral energy structure optimization can reduce emissions while saving energy.
In order to further analyze the emission reduction strength and economy of different scenarios, the paper calculates the MACC of six villages. The results are shown in Table 5.
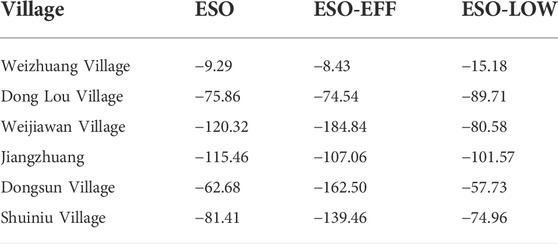
TABLE 5. MACC of other villages (thousand yuan/Metric ton).
From Table 5, it can be seen that different economic benefits are shown in different villages. For Weizhuang and Donglou, the ESO-LOW scenario has the highest emission reduction economic benefits; for Jiangzhuang, the ESO scenario has the highest emission reduction economic benefits, while for Weijiawan, Dongsun and Shuiniu, the emission reduction economic benefits of the ESO-EFF scenario are much higher than the other two scenarios.
5 Conclusions and recommendations
Relying on the micro field research, this paper combines resource endowment of the research area with energy preference of rural households and optimizes the energy consumption structure from supply-demand bilateral. The results show that: 1) according to the survey data, the energy consumption in Shandong rural areas is dominated by non-clean energy, and currently only a few rural areas have realized the supply of natural gas, which is consistent with the survey results of literature (Wu et al., 2019; Zou and Luo, 2019; Yang et al., 2021). The application of unclean energy for cooking and winter heating has caused huge pollution. Increasing the share of existing clean energy use technologies, introducing new energy use models, and optimizing supply-demand bilateral energy structure can effectively reduce the carbon emissions of rural residents’ energy consumption; 2) up to 2050, the energy demand and supply of seven typical villages shows an upward trend in all scenarios, but the increase rate is different. Compared with the BAS scenario, the energy demand and supply of the ESO-based scenario is lower, which proves that the energy-saving effect of energy structure reform is outstanding. 3) the carbon emission analysis of seven villages shows that for the villages that have realized the construction of natural gas pipelines, the carbon emission increases with the increase of the total energy consumption. Although supply-demand bilateral energy structure optimization can bring energy saving and emission reduction, the upward trend remains unchanged. For the villages currently dominated by non-clean energy consumption, the carbon emission reduction trend of the ESO-based scenario is significantly better than that of the BAS scenario. The energy-saving and emission-reduction effect of the supply-demand bilateral energy structure optimization is obvious; 4) according to the MACC of different technologies and policy subsidies, the most economical scenario of different villages is different. Decision makers should fully analyze the characteristics of the villages and combine the advanced energy consumption technologies to select the most economical energy-saving and emission-reduction plan.
The policy recommendations are as follows: 1) as winter heating accounts for the largest proportion of energy consumption and carbon emissions of rural households, promoting clean heating with terminal equipment such as low-temperature coil heating, which consistents with energy usage habits of rural households, is crucial for energy saving and emission reduction, the formulation of policies should not only consider banning the use of non-clean energy, but should promote advanced energy technologies to guide rural residents using clean energy; 2) the local government should improve rural infrastructure and thermal insulation, and renovate the facades of self-built houses to reduce the heat loss in winter and the ineffective heating expenditure; 3) the local area should make full use of the local resource endowment, to develop new energy power generation, and gradually replaces coal power generation. Regarding the carbon emission of biomass power generation, carbon capture and storage (CCS) technology can be combined to realize the low-carbon development of new energy power generation, and relevant policies shall be issued to ensure the supply of straw and realize the full-load operation of straw power generation and biogas power generation; 4) the most economical scenarios for energy and emission reduction in different villages are different, and each village should choose appropriate optimization schemes based on local policies and resource endowments so that they can achieve the “dual carbon” goal on time.
There are some shortcomings in this paper. Firstly, this paper focuses on typical villages in Shandong Province, and the generalizability of the research conclusions cannot be effectively verified. In order to verify the effectiveness of supply-demand bilateral energy structure optimization, researchers will conduct field research in other provinces in China and zoning the villages by energy consumption characteristics and resource endowments. Secondly, due to space limitations, the article is insufficient to analyze the different causes of the most economical scenarios in different rural areas. In the future, researchers will focus on this in combination with policies.
Data availability statement
The original contributions presented in the study are included in the article/Supplementary Material, further inquiries can be directed to the corresponding author.
Author contributions
JW: Methodology, Writing- Reviewing and Editing, Supervision. ML: Formal analysis, Data Curation, Software, Writing- Original draft preparation.
Funding
This work is supported by the National Natural Science Foundation of China (No.42071291).
Conflict of interest
The authors declare that the research was conducted in the absence of any commercial or financial relationships that could be construed as a potential conflict of interest.
Publisher’s note
All claims expressed in this article are solely those of the authors and do not necessarily represent those of their affiliated organizations, or those of the publisher, the editors and the reviewers. Any product that may be evaluated in this article, or claim that may be made by its manufacturer, is not guaranteed or endorsed by the publisher.
References
Agrawala, S., Harish, S. P., Mahajan, A., Thomas, D., and Urpelainen, J. (2020). Influence of improved supply on household electricity consumption - evidence from rural India[J]. Energy 211, 118544. doi:10.1016/j.energy.2020.118544
Chao, W., Zhan, J., Li, Z., Zhang, F., and Zhang, Y. (2019). Structural decomposition analysis of carbon emissions from residential consumption in the Beijing-Tianjin-Hebei region, China[J]. J. Clean. Prod. 208, 1357–1364. doi:10.1016/j.jclepro.2018.09.257
Chawana, L. S . (2007). Sustainable energy development strategies in the rural Thailand: The case of the improved cooking stove and the small biogas digester[J]. Renew. Sustain. Energy Rev. 11, 818–837. doi:10.1016/j.rser.2005.06.002
Chen, F., Qiu, H., and Zhang, J. (2022). Energy consumption and income of the poor in rural China: Inference for poverty measures. Energy Policy 163, 112865. doi:10.1016/j.enpol.2022.112865
Ciarli, T., and Savona, M. (2019). Modelling the evolution of economic structure and climate change: A review. Ecol. Econ. 158, 51–64. doi:10.1016/j.ecolecon.2018.12.008
Hong, Z. (2020). Assessment of energy consumption and energy saving potential of clean renewable energy in rural China[D]. Lanzhou, China: Lanzhou University. doi:10.27204/d.cnki.glzhu.2020.000068
Hu, G., Ma, X., and Ji, J. (2019). Scenarios and policies for sustainable urban energy development based on LEAP model – a case study of a postindustrial city: Shenzhen China. Appl. Energy 238 (15), 876–886. doi:10.1016/j.apenergy.2019.01.162
Hussain, A., Perwez, U., Ullah, K., Kim, C-H., and Asghar, N. (2021). Long-term scenario pathways to assess the potential of best available technologies and cost reduction of avoided carbon emissions in an existing 100% renewable regional power system: A case study of gilgit-baltistan (gb), Pakistan[J]. Energy 221, 119855. doi:10.1016/j.energy.2021.119855
Imran, M., Zahid, A., Mouneer, S., Ozcatalbas, O., Ul Haq, S., Shahbaz, P., et al. (2022). Relationship between household dynamics, biomass consumption, and carbon emissions in Pakistan. Sustainability 14 (11), 6762. doi:10.3390/su14116762
Intergovernmental Panel on Climate Change (IPCC) (2019). 2019 Refinement to the 2006 IPCC guidelines for national greenhouse gas inventories.
Jiang, A., Zhong, Q., Wang, Y., Ao, Y., and Chen, C. (2021). Influencing factors of commercial energy consumption intention of rural residents: Evidence from rural chengdu[J]. Energies 14, 1010. doi:10.3390/en14041010
Jiang, H. D., Dong, K. Y., Zhang, K., and Liang, Q. M. (2020). The hotspots, reference routes, and research trends of marginal abatement costs: A systematic review. J. Clean. Prod. 252, 119809. doi:10.1016/j.jclepro.2019.119809
Jiang, H. D., Purohit, P., Liang, Q. M., Dong, K., and Liu, L. J. (2022). The cost-benefit comparisons of China's and India's NDCs based on carbon marginal abatement cost curves. Energy Econ. 109, 105946. doi:10.1016/j.eneco.2022.105946
Jiang, H. D., Xue, M. M., Dong, K. Y., and Liang, Q. M. (2022). How will natural gas market reforms affect carbon marginal abatement costs? Evidence from China[J]. Econ. Syst. Res. 34 (2), 129–150. doi:10.1080/09535314.2020.1868410
Jin, X., Li, Y., Sun, D., Zhang, J., and Zheng, J. (2019). Factors controlling urban and rural indirect carbon dioxide emissions in household consumption: A case study in Beijing. Sustainability 11 (23), 6563. doi:10.3390/su11236563
Johnson, N. G., and Bryden, K. M. (2012). Energy supply and use in a rural West African village. Energy 43 (1), 283–292. doi:10.1016/j.energy.2012.04.028
Lazarus, M., Heaps, C., and Raskin, P. (1997) LEAP long-range energy alternatives planning system. Boston, MA: Stockholm Environmental Institute.
Liu, Z., Wang, M., Xiong, Q., and Liu, C. (2020). Does centralized residence promote the use of cleaner cooking fuels? Evidence from rural China[J]. Energy Econ. 91, 104895. doi:10.1016/j.eneco.2020.104895
National Bureau of Statistics of China (2021). Communiqué of the seventh national population census [1] (No. 7)–Urban and rural population and floating population may 11, 2021. China Stat. 2021 (5), 13 [in Chinese].
Pelz, S. (2020). Disaggregated household energy supply measurement to support equitable municipal energy planning in rural Nepal. Energy Sustain. Dev. 59, 8–21. doi:10.1016/j.esd.2020.08.010
Qi, W., and Li, G. (2020). Residential carbon emission embedded in China's inter-provincial population migration[J]. Energy Policy 136, 111065. doi:10.1016/j.enpol.2019.111065
Rahman, S. M., and Kirkman, G. A. (2015). Costs of certified emission reductions under the clean development mechanism of the kyoto protocol. Energy Econ. 47, 129–141. doi:10.1016/j.eneco.2014.10.020
Runst, P., and Thoniparaanita, A. (2020). Dosis facit effectum why the size of the carbon tax matters: Evidence from the Swedish residential sector. Energy Econ. 91, 104898. doi:10.1016/j.eneco.2020.104898
Sessa, V., Bhandari, R., and Ba, A. (2021). Rural electrification pathways: An implementation of LEAP and GIS tools in Mali[J]. Energies 14, 3338. doi:10.3390/en14113338
Shi, Q. H., Peng, X. H., and Zhang, Y. (2014). A field survey on energy consumption in China’s rural areas—a case study of 2253 farmers in Shanxi, Guizhou, and Zhejiang provinces. J. Manag. World 2014 (05), 80–92. doi:10.19744/j.cnki.11-1235/f.2014.05.007
Wang, S., Sun, S., and Zhao, E. (2021). Urban and rural differences with regional assessment of household energy consumption in China. Energy 232 (12), 121091. doi:10.1016/j.energy.2021.121091
Wu, L., Qian, H., and Tang, W. (2014). Selection mechanism between emission trading and carbon tax based on simulation of dynamic marginal abatement cost. Econ. Res. J. 49 (9), 48148–48161. [in Chinese].
Wu, S., Zheng, X., You, C., and Wei, C. (2019). Household energy consumption in rural China: Historical development, present pattern and policy implication. J. Clean. Prod. 211, 981–991. doi:10.1016/j.jclepro.2018.11.265
Wu, W. P., Zeng, W. K., Gong, S. W., and Chen, Z. G. (2021). Does energy poverty reduce rural labor wages? Evidence from China's rural household survey[J]. Front. Energy Res. 9, 670026. doi:10.3389/fenrg.2021.670026
Xi, H. E. (2020) Xi jinping president of the people's republic of China at the general debate of the 75th session of the united nations general [EB/OL]. (2021-02-03). Available at: http://www.gov.cn/xinwen/2020-09/22/content_5546168.htm.(Accessed 2020 09 22).
Yang, L., Zhao, K., Zhao, Y., and Zhong, M. (2021). Identifying key factors in determining disparities in energy consumption in China: A household level analysis[J]. Energies 14, 7149. doi:10.3390/en14217149
Ye, Y., and Zhao, J. (2014). Study on the supply capacity of crop residue as energy in rural areas of Heilongjiang province of China[J]. Renew. Sustain. Energy Rev. 38 (38), 526–536. doi:10.1016/j.rser.2014.06.009
Yuan, B., Ren, S., and Chen, X. (2015). The effects of urbanization, consumption ratio and consumption structure on residential indirect CO2 emissions in China: A regional comparative analysis. Appl. Energy 140 (15), 94–106. doi:10.1016/j.apenergy.2014.11.047
Keywords: LEAP model, Shandong rural areas, supply-demand bilateral energy structure optimization, MACC, carbon emission reduction
Citation: Wang J and Liu M (2022) Supply-demand bilateral energy structure optimization and carbon emission reduction in Shandong rural areas based on long-range energy alternatives planning model. Front. Environ. Sci. 10:1009276. doi: 10.3389/fenvs.2022.1009276
Received: 01 August 2022; Accepted: 20 September 2022;
Published: 06 October 2022.
Edited by:
Usama Awan, Lappeenranta University of Technology, FinlandReviewed by:
Hong-Dian Jiang, China University of Geosciences, ChinaJoanna Rosak-Szyrocka, Częstochowa University of Technology, Poland
Copyright © 2022 Wang and Liu. This is an open-access article distributed under the terms of the Creative Commons Attribution License (CC BY). The use, distribution or reproduction in other forums is permitted, provided the original author(s) and the copyright owner(s) are credited and that the original publication in this journal is cited, in accordance with accepted academic practice. No use, distribution or reproduction is permitted which does not comply with these terms.
*Correspondence: Jing Wang, wang.jing@sufe.edu.cn; Mohan Liu, 1315289985@qq.com