 Zhu Nanli1
 Ahmer Bilal
95% of researchers rate our articles as excellent or good
Learn more about the work of our research integrity team to safeguard the quality of each article we publish.
Find out more
ORIGINAL RESEARCH article
Front. Environ. Sci. , 20 September 2022
Sec. Environmental Economics and Management
Volume 10 - 2022 | https://doi.org/10.3389/fenvs.2022.1009155
This article is part of the Research Topic The Role of Energy Efficiency and Transition Towards Clean Energy in Achieving the COP26 Commitments View all 22 articles
China has planned the Belt and Road Initiative to start collaborations among relevant economies in the technology innovation sector. This study examined the impact of technology innovation on environmental quality among the host economies of Belt and Road Initiative (BRI) countries by using panel data of 45 economies from 1991 to 2019. The study employed a fully modified ordinary least squares (FMOLS) panel to estimate the long-run associations among suggested variables. The outcomes validated a healthy cross-sectional dependence within the panel BRI economies. One estimated result of FMOLS specified that increases in patents and trademarks improved the quality of the environment in only Europe in the long run. Trademarks also enhanced the environment in BRI, MENA, and Central Asia. In the short run, the panel heterogeneous causality showed bi-directional causality among patents, trademarks, and CO2 emissions. The results of this study articulated the environment-friendly policies in technology innovation in BRI regions.
The Belt and Road Initiative (BRI) was developed as a new “global grand strategy” that supports reinforcing physical infrastructures, increasing regional economic development, redesigning economic activities, reorganizing interactions, and moving power within and between states (Beeson 2018; Jahanger et al., 2021). The BRI is building a global web of connections. The BRI runs through Eurasia, connecting the Asia Pacific economies to western European economies and a web of connectivity comprising over 100 nations, which account for 54% of CO2 emissions, 50% of the energy consumption, 64% of the population, 39% of the land, 35% of international trade, and 30% of the GDP worldwide (Fan et al., 2019; Usman et al., 2022a, 2022b, 2022c). The BRI has massively enhanced the participation of China with the affiliated economies in different projects of energy, finance, and technology development (Aung et al., 2020; Jahanger, 2022). Through these projects, the Chinese FDI not only supports the creation of an infrastructure in BRIs but also produces indirect and direct technologies that redesign domestic environments (Zhang et al., 2020; Chishti et al., 2021; Jahanger, 2021). Since the 2010s, the average growth rates of CO2 in China and BRI host economies are approximately 8% and 5%, respectively, suggesting that the BRI has a larger share of carbon emissions worldwide. The average CO2 emission trend in BRI regions from 1990 to 2019 can be explained graphically.
To analyze and discuss the basic facts of carbon emissions in BRI economies, we plotted data-based graphs. We focused on region-wide carbon emissions trends rather than the overall sample of BRI countries. Therefore, the BRI sample was divided into five regions: Central Asia, South Asia, South, and Southeast Asia, Europe, and MENA.
Regarding trends in CO2 emissions in Central Asia, Figure 1A shows a sudden upward trend from 1990 to 1992, followed by a rapid decrease until 2003. The spike in carbon emissions followed by a sudden downfall in Central Asia indicated successful green economic growth in these economies. However, carbon emissions showed an upward trend, with small ups and downs from 2005 to 2019. Since the BRI initiative was advocated in 2013 by Chinese authorities through investment in 70 economies (which has increased to approximately 147 economies according to the Green and Finance Development Center, Fudan University), BRI investment also triggered economic activities and increased combustion of different kinds of energy resources such as coal, gas, oil, solar, and wind. Ultimately, the huge combustion of conventional energy resources in Central Asian economies tended to increase carbon emissions.
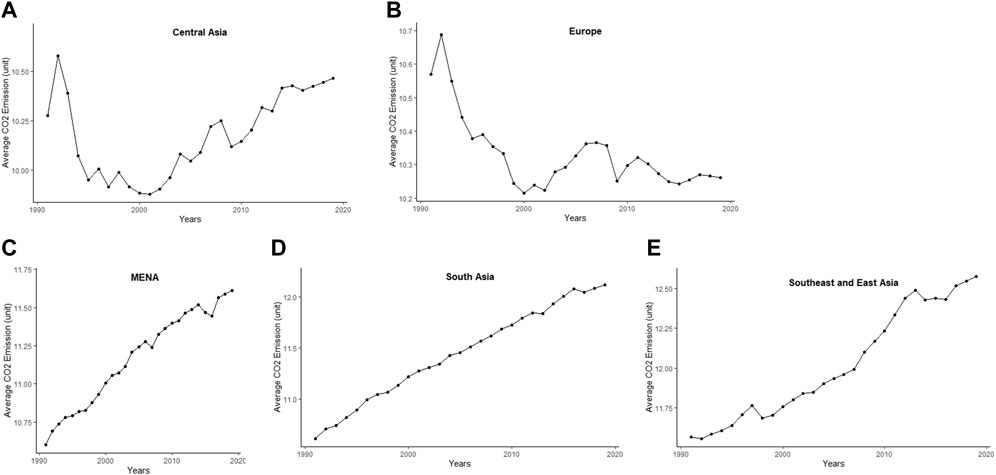
FIGURE 1. Average CO2 emissions in the (A) central Asia, Europe, (C) MENA, (D) South Asia, and (E) Southeast and East Asia regions. Data Source; WDI.
Similarly, Figure 1B shows an upward spike from 1991 to 1992 and a sudden downward trend starting in 2000 in Europe. The trend was positive from 2000 to 2009, followed by a sharp decrease in CO2 emissions in 2010. The BRI projects started in 2013; from 2013 to 2019, CO2 emissions in the Europe region showed a nearly decreasing trend.
South Asia, MENA, and Southeast Asia have shown positive trends from1990 to 2019, indicating increasing carbon emissions in these regions. These regions have experienced the consumption of conventional energy resources, which ultimately causes carbon emissions in these regions. The data-based graphical findings showed a significant positive connection between CO2 emissions in all these regions, during which a surge in economic activities destroys the quality of the environment in these regions.
Sustainable economic growth has become a primary target for policymakers in BRI partner economies. The reduction of pollution emissions is essential, which makes attaining sustainable social and economic development goals problematic. Therefore, technology innovation has become a focus for substantial policy change regarding the climate (Metz et al., 2007; Jahanger et al., 2022a, 2022b, 2022c, 2022d) to propose solutions to address the challenges of economic growth and environmental quality (Hübler et al., 2012). Therefore, technology innovation has appeared as the main factor for efficiency in energy production and certifying the sustainable development of both developing and developed economies. Technological progress is a key channel to attaining physical change toward economic growth (Schumpeter 1934). In growth theory, many studies have reported a link between the accumulation of human capital through innovation and economic growth (Romer 1990; Grossman and Helpman 1991; Young 1991), as the use of knowledge creates technological innovation because the structural shift in the economy promotes economic growth without increasing environmental pollution (Qiang et al., 2022; Zhang et al., 2022; Yang et al., 2021a, 2021b, 2021c).
The impacts of technological innovation on the evolution of the association between economic growth and environmental quality are described by the first theory of endogenous growth, which proposes that production activities are enriched by increasing the volume of polluting resources with other, more environmentally-friendly, resources (Stokey 1998). These theories are based on advanced economies that are devoted to the environment by using more resources for technology innovation. In the literature, (Fernández-caramés et al., 2018; Jiang et al., 2022) explains that technology plays a dynamic role in the mitigation of carbon emissions because the technology innovation process has low energy consumption and leads to environmental quality. Technological innovation also improves energy efficiency and provides environmental quality. The cumulative effect of technological innovation may also resolve the conflict between economic growth and environmental quality in the long run (Jaffe and Stavins 1994). Thus, investment in innovation could condense environmental pollution without disturbing economic growth. Therefore, technology innovation must include policies for the mitigation of environmental pollution.
The endogenous growth reasons for technology innovation are critical for stimulating economic growth. National and international research has demonstrated the crucial role of technological innovation in encouraging environmental quality (Malamud and Zucchi 2019). However, the effects of technological innovation effect on the environment are two-sided. These innovations can increase the efficiency of natural resource usage, encourage clean energy, and reduce environmental pollution; however, they have also promoted economic development leading to environmental pollution (Lin and Zhu, 2019; Qayyum et al., 2021; Usman and Jahanger, 2021; Ahmad et al., 2022). Therefore, there is some controversy in the literature regarding the positive or negative effects of technological innovations on environmental pollution. However, previous studies have reported biased, inconsistent, and meaningless results and policy implications. Studies linking technology innovation and carbon emissions have ignored two factors; first, there is little evidence regarding technology innovation and environmental quality in BRI economies. Therefore, no evidence from previous studies contributes to the policy-level implications of technology innovation and policy environment in BRI economies. Thus, recent studies have extended the empirical literature on BRI economies (Ke et al., 2022; Wan et al., 2022; Li et al., 2022).
In this way, the present study contributes to the existing empirical literature in several ways. First, this study compared the effects of technology innovation on environmental pollution in BRI host economies. Second, this study focused on countries and regions showing good environmental quality through technological innovations. These findings can guide the investments in technology innovations by the Chinese government in partner economies. These findings also increase evidence regarding the factors affecting CO2 emissions and help the BRI authorities to articulate policies to reduce pollution emissions.
This paper is organized as follows: Section 2 provides a literature review. Section 3 outlines the model, methodology, and data. Section 4 describes the findings regarding economic applications, and the last section concludes the study.
Many studies have conducted empirical and theoretical research on the link between technology innovation and economic development (Yu et al., 2020; Yu et al., 2021; Jiang et al., 2022). The first study by Schumpeter (1912) reported that technological innovation positively affects economic growth through horizontal and vertical spillovers. Similar models had been built on Schumpeter (1912). Subsequently, Solow (1957) noted that technological progress affects economic growth but technological progress is considered exogenous. Simultaneously time, Lucas (1988) and Romer (1990) recognized the new growth theory and considered technological innovation as an endogenous variable that is a more decisive factor in economic growth. Thus, technological evolution is an excellent way to solve economic growth and environmental quality but can also encourage productivity and economic activities (Xiao et al., 2013; Evangelista et al., 2014). Zhou et al. (2016) contended that high economic growth occurs at the cost of environmental problems, while BRICS economies are revisiting their development models but increasing environmental quality through products and eco-friendly innovation processes.
The study of technological innovation has a long history in correcting the environment. Ehrlich and Holdren (1971) proposed that technological innovation can lessen environmental pollution produced due to economic factors. Grossman and Krueger (1991) categorized the indicators affecting environmental pollution into structural, scale, and technological effects and underlined the central role of technological impacts on fixing environmental quality. Academics and policymakers have agreed that technological innovation corrects environmental quality. Recent empirical research has focused on the association between innovation and environmental pollution. Innes and Carrio (2010) reported that technological innovation decreased environmental pollution in a sample of 127 manufacturing industries.
Similarly, Tursun et al. (2015) demonstrated that technological progress indicators accounted for a >60% effect in decreasing sulfur dioxide and CO2 emissions. Levinson (2009) reported the impacts of the US industrial sector on the environment, in which technological innovations reduced SO2 emissions by 39% between 1987 and 2001. While Mingyong et al. (2006) observed a negative link between environmental research expenditure and environmental pollution, Yang et al. (2014) showed that the development of innovation capabilities decreased CO2 emissions in the industrial sector of China.
Similarly, Shah and Hasan (2021) recently reported a statistically significant and negative association between patent applications and CO2 emissions in Asian countries. Khan et al. (2020) also evaluated the relationships between technological innovation and CO2 emission in BRICS economies from 1985 to 2014. The results from FM-LS and AMG indicated that technological innovation decreased CO2 emissions in BRICS economies and participated in economic growth.
Problems linked to the environment, including short and long-run and small and large-scale issues, particularly environmental change, have been argued to be positively affected by technological expansion (IPCC 1995). Deviations in energy-saving production technologies, fuel mix, and clean energy innovation are among the critical causes of diagnosing the significance of technological innovation in raising environmental quality (de Bruyn, 1998). Heavy government expenditures on R&D and the digital economy have been proposed as the primary sources of decreased carbon emissions (Jones 2002). Similarly, Gillingham et al. (2008) suggested that the future progress of technology innovation based on costs could be the main instrument to control the problem of climate change by aiming to decrease pollution emissions through economic activities. Moreover, Yeh et al. (2011) noted that long-run energy consumption and environmental issues depend on the level and nature of technology innovations.
Furthermore, the quality of the production stage can efficiently consume energy resources by considering technological innovation. Saudi et al. (2019) demonstrated the negative effects of technological innovation on CO2 emissions. Similarly, (2020) reported that technological innovation in energy was positively and negatively associated with carbon emission in the lower and upper quantile, respectively. Analyzing the effects of anticipated technology on pollution emissions from the rapid upsurge in air traffic, Sohag et al. (2015) reported that energy was consumed more efficiently through technological innovation by increasing economic activity.
The results of previous studies emphasized the possible effects of technology innovations and CO2 emissions. Using data samples from various economies, techniques, and methods to assess the association of technology innovation and CO2 emissions has generated mixed outcomes. Chishti et al. (2020) described different global and group-based estimation results. First, the authors reported the correlations of CO2 emission with research and development intensity among countries. The global analysis indicated that CO2 emission was not significantly affected by technological innovation. The group-based results reveal that technological innovation for high CO2 emission and high income in countries with high technological income not only hurt CO2 emission but also has a similar impact in other homogeneous countries. In contrast, technological innovation in countries with low income, low carbon emissions, and insufficient technological innovation promoted CO2 emissions. Most studies use patents as a proxy for innovation (Weimin et al., 2022; Ullah et al., 2020; Chishti and Sinha, 2022; Raiser et al., 2017; Khattak et al., 2020; Yang et al., 2022; Dogan et al., 2022), as these defend the intellectual property and other rights of firms addressing environmental issues through technology innovation.
Recently, Yu and Du (2019) reported the essential role of independent innovation ventures in decreasing environmental pollution in China. They also concluded that technological innovation had enabled the development of a capable energy market while allowing viable economic development across G7 and BRICS economies. Similarly, Yii and Geetha (2017) reported that technological innovation has contributed to decreasing carbon emissions in the short term, with no long-run relationship. Azevedo et al. (2018) proposed that increased knowledge and innovation in the member states regarding energy savings and efficiency will play essential roles in decreasing carbon emissions. While technology innovation significantly reduced CO2 emissions in OECD countries, Su and Moaniba (2017) reported mixed outcomes between technology innovation and carbon emissions.
The literature on the BRI is growing. However, studies on the impact of technological innovation on CO2 emissions within the context of the BRI are negligible. In addition, studies on the relationship between these variables under the BRI have utilized data only for selected countries but not the entire sample. Moreover, the BRI belongs to different regions like Asian countries, European countries, Southeast Asian countries, etc. To our knowledge, no studies have investigated the impact of technological innovation on CO2 emission separately for each region. For regional policy implications, empirically analyzing data for each region is essential. The present study aims to fill this gap by examining the relationship between these two variables across different regions and BRI. The results of previous studies related to this puzzle were extracted from panel data; however, results derived from panel data analysis are not applicable to specific countries. The policy implications or suggestions for a particular country can only be meaningful if those are made according to the results derived from analyzing that country’s data. The present study also focused on this issue to address the limitations of previous studies by analyzing the data at the country level. Based on this gap in the literature, this study applied a panel heterogeneous methodology to assess the effects of technological innovation related to environmental pollution in BRI partner economies.
Technology is an essential factor in the evolution of any economy and can increase the economy’s growth. The theoretical work of Fields (2004) on technological innovation was based on the efforts of Hagedoorn (1996), who noted that novel and modern technology could arrive at the market through invention, innovation, and diffusion methods. He also reported that the process of innovation and invention can be determined through the activities of research and development (R&D) in an economy. The adoption and execution of this innovation by individuals and firms can be defined as technology distribution. Thus, variations in technology in economies and the environment can be considered the combined effects of inventions, innovations, and diffusion. Often recognized as the “endogenous growth theory,” this new economic growth theory considers technology as an endogenous variable in the model. Technologies are conceived by individuals, firms, and industries to directly address environmental issues. The endogenous growth theory suggests that technology affects economic activities and the environment. At the same time, environmental innovation focuses on technologies for a green environment. Technologies for reducing pollution can be more helpful in a green and clean environment given the registration of patents.
This empirical study analyzed the impact of technological innovation on environmental quality among BRI economies from 1990 to 2017. Our econometric model formulation was based on earlier studies (Mensah et al., 2018; Ibrahiem 2020; Usman et al., 2021; Kamal et al., 2021). Studies on technology innovation policy and environmental quality have been performed in recent decades. Early studies have examined the effects of R&D on economic growth and environmental quality in developing economies (Fisher-Vanden and Wing 2007; Yang et al., 2022). The extension of this research has considered the links between R&D investments in energy and environmental quality in advanced economies. For example, Yi (2012) reported the role of technology innovation in reducing environmental pollution in China and endorsed technology innovation as a major catalyst for environmental quality. In this study, the panel model can be formulated as follows:
In Eq. 1, “i” = 1, 2, 3, … , 45 and refers to a country; “t” is the time period from 1991 to 2019, and CO2; and
Step 1 is a precondition for the execution of the cross-sectional dependence (CD) test to classify the cross-sectional support in the panel analysis. The cross-sectional dependence test reduces the means in the calculation of correlations. The null hypothesis of the CD test is that there is no cross-sectional dependence in the residuals, while cross-section dependence occurs in residuals. The Pesaran (2004) dependence test is considered, as below:
where
Owing to the presence of cross-section dependence in our data, we used panel unit root tests to detect the order of cointegration. As traditional panel tests of unit root cannot deliberate the cross-sectional dependence, we have applied a new panel unit root for the existence of cross-section dependence CIPS and CADF tests to compute the cross-sectional support.
The Padroni panel data cointegration test is used to identify links among data series. The Pedroni (2004) test is suitable for data with many Ns and Ts. The null hypothesis was that there is no cointegration exhibited in our data; rejection of the null hypothesis implied that our data showed cointegration. The Westerlund cointegration test, developed by Westerlund (2007),was applied to counter panel cross-sectional dependence. One advantage of this method is that the technique does not depend on the order of integration of the variables. The OLS and instrumental variable (IV) methodologies can be used to calculate the Durbin–Hausman statistics.
After determining the long-run cointegration among model indicators, the next phase was to estimate the long-run coefficient of the proposed hands. This analysis used FMOLS regression to estimate the long-run parameters. The FMOLS approach is better than other approaches because it controls for the problem of serial correlation and endogeneity in the parameters of panel data. FMOLS is also suitable for a small sample of data and is the most appropriate technique for panel data.
This study also applied the Dumitrescu and Hurlin (2012) causality test to determine the possible causal connections between model variables. The test is the modified version of that described by Granger (1969) in econometrics; however, the DH causality test is superior to others. This methodology provides consistent and reliable results in cases of cross-sectional dependence and small samples. The DH causality test null hypothesis is that there is no homogeneous causality in the panel.
Based on the above empirical model and methodology, this study composed annual panel data from 1991 to 2019 for 45 selected BRI countries. The selection of these 45 countries was based on data availability. We chose these economies from the South Asia, East and Southeast Asia, MENA, Europe, and Central Asia regions, as listed in Table 1. All datasets were taken from World Development Indicators (WDI). We chose these variables in the model from previous studies to more deeply understand technology innovation and climate change. Therefore, studying the outlook and challenges observed by host BRI economies regarding environmental quality is important. Each variable is described in Table 2. We used the log values of CO2, patent, trademark, and GDP, but not FDI.
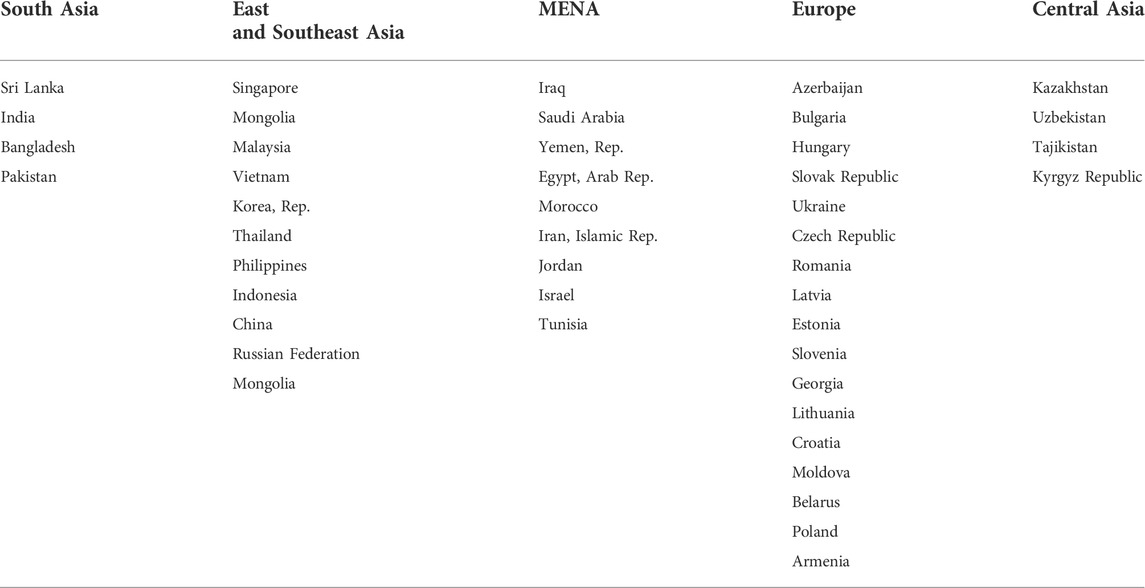
TABLE 1. List of a selected panel of BRI countries.
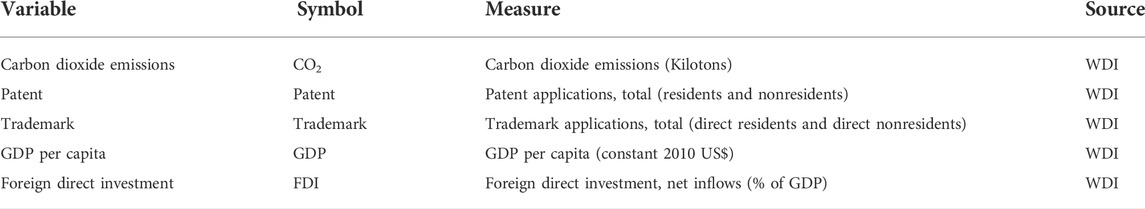
TABLE 2. Description of the variables.
The descriptive figures and correlation matrix results are shown in Table 3. The mean CO2, patent, trademark, GDP, and FDI values were 315745.1 ± 1109338 kilotons, 11115.7 ± 84089.3, 35088.3 ± 180469, $7396.51 ± 8594.82, and 3.961% ± 6.165%, respectively. The CO2 emissions and trademark were more volatile than patents, GDP, and FDI. Positive relationships were observed between CO2 emissions, patents, trademarks, and GDP and negative relationships between FDI and CO2 emissions, patents, and trademarks.
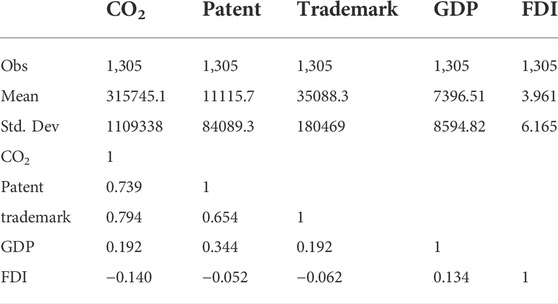
TABLE 3. Descriptive statistics and correlation matrix of the BRI countries.
The panel regression analysis comprised assessments of panel cross-sectional dependence, unit root, cointegration tests, and FMOLS to estimate the panel-type second-generation model. The first stage of panel data estimation suggested that CD statistics were the focus in environmental economics. Table 4 shows the results of the CD tests. The CD tests nullified the cross-sectional independence and confirmed the presence of the cross-sectional dependence in the BRI sample. However, these outcomes varied in each sample. These outcomes suggested that a shock in one of the sample economies would likely spread to other economies. Thus, country decisions and policy implications are concerned with CO2 emissions and technology innovation and their influences on other BRI economies.
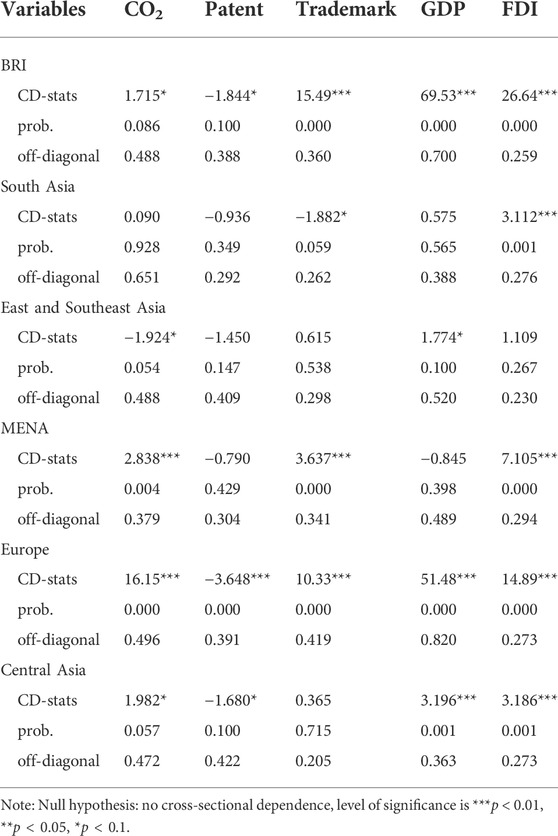
TABLE 4. CD test results.
After confirmation of CD among the BRI panel, the next step was to apply the CIPS and CADF tests to confirm the order of integration in the unit root. Table 5 shows the outcomes of CIPS and CADF unit root tests applied at level I (0) and the first difference I (1) in the entire sample. The results confirmed that the CO2, patent, trademark, and GDP variables were stationary at I (1), while FDI is static at I (0) in the CIPS test. Similar results were observed in the CADF test, except for one variable. We observed identical outcomes to those reported in other data samples.
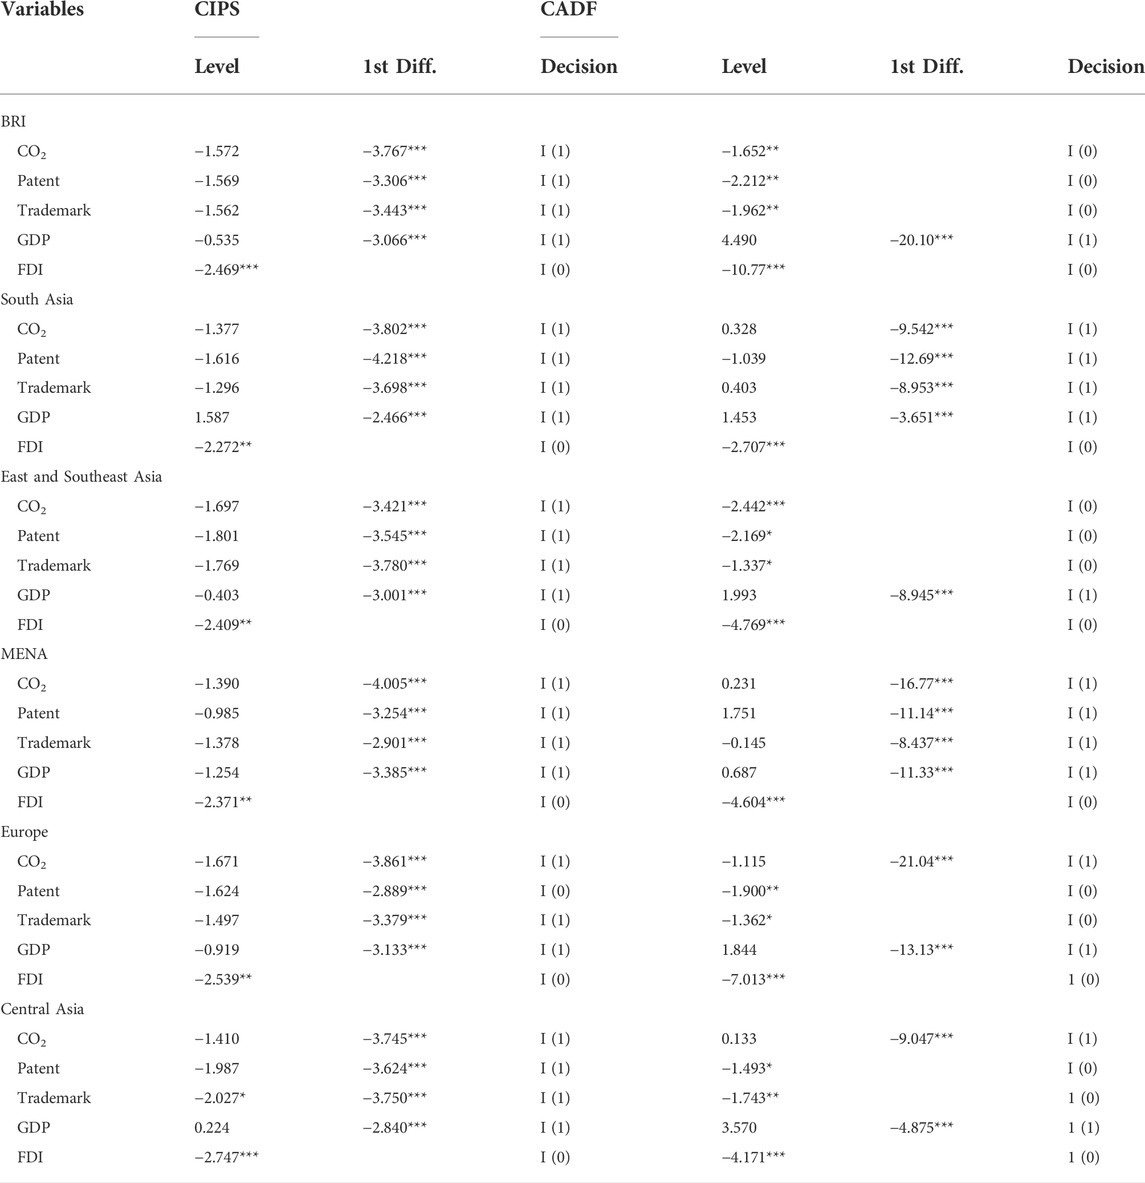
TABLE 5. Panel unit root statistics.
For cointegration analysis, we used Westerlund’s (2005) test of no cointegration among groups of variables in the full sample and subgroups in Table 6. This specific finding resulted in an enormous significance level and offers firm support in favor of the study variables that suggest their long-run relationships based on cointegration. Our results nullified the no cointegration in Ga (within-group), Gt (between-group), Pa (within-panel), and Pt (between-panel) statistics. Thus, the results of the Westerlund cointegration test supported a long-run link between the BRI and its host regions.
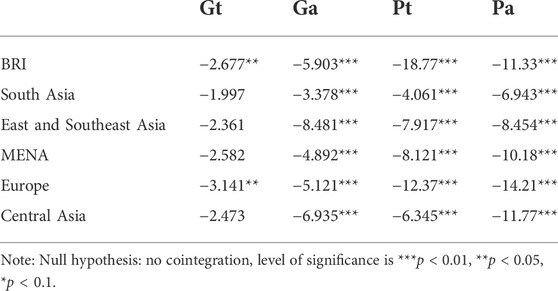
TABLE 6. Results of Westerlund cointegration test.
Table 7 shows the long-run estimates of the FMOLS of regions of BRI. The FMOLS estimator suggests a significantly positive coefficient for patents on CO2 emissions in BRI South Asia, East, and Southeast Asia, and MENA economies. This indicates that patents do not help reduce environmental pollution in these regions. Meanwhile, the coefficient of patents is negative in Europe, indicating a 0.08% decrease in CO2 emissions due to a 1% increase in patents. This finding is consistent with those reported by Pazienza (2015). The long-run outcomes revealed that technological innovation is negatively linked to environmental pollution in Europe. The production process is a crucial element of economic growth and a source of environmental corrosion. Technology change has a healthy positive effect on the environment; however, this beneficial effect is more prominent in each stage of economic development in advanced economies.
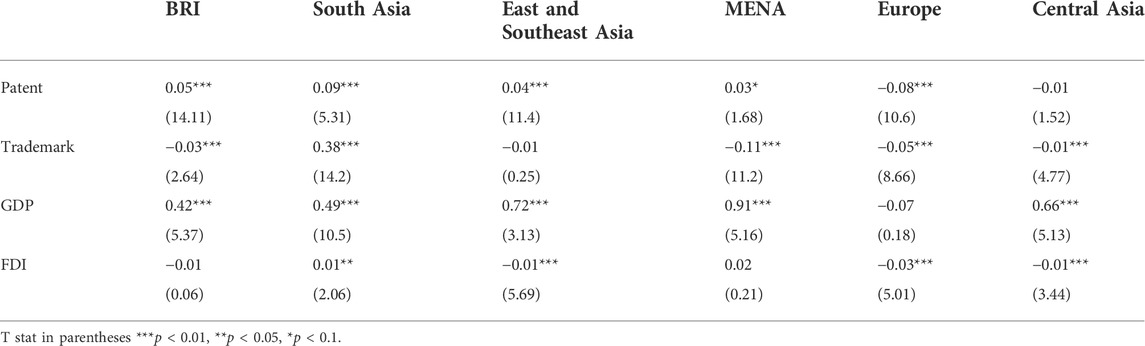
TABLE 7. FMOLS estimates (sample-wise).
Table 7 shows that trademarks significantly positively influenced CO2 emissions in South Asia. While the coefficients of BRI, MENA, Europe, and Central Asia are negative, this finding implies that firm trademarks are correcting the environment. These outcomes are consistent with those reported by Piao and ID (2020) and suggest that innovation as trademarks continues to change energy, travel, tourism, and logistics to promote the environment. Another method through which technology innovation is changing existing less-efficient energy consumption is increased efficiency and environmental friendliness. This implies that economies with income levels have a higher technology innovation gap compared to countries with higher income levels, leading to challenges in workable green technologies. Consequently, CO2 emissions are higher in poor economies.
Economic growth positively impacted CO2 emissions in BRI, East, and Southeast Asia, South Asia, MENA, and Central Asia, suggesting every economy still consumes large amounts of fossil fuels to accelerate its economic growth, which enhances CO2 emissions. This also indicates that GDP increases the economic size and dirty economic activities, which creates more pollution. Overall similar outcomes were observed in all regions except for Europe. European economic size showed an insignificant negative impact on environmental pollution.
While the negative coefficient of FDI in BRI, East and Southeast Asia, Europe, and Central Asia support the “pollution halo” hypothesis, these findings are consistent with those reported by Pazienza (2015) in OECD economies. Zhang and Zhou (2016) and Liu et al. (2017) concluded that FDI regulates the quality of the environment in China. Thus, FDI inflow is a main catalyst for the diffusion of technological skills and innovation in green production. These economies allow only green FDI, which provides a more positive effect on environmental quality. Another channel of FDI is improving technological innovation by inducing social, human, and physical capital, thus affecting environmental pollution. The spillover influence of FDI also enhances the environmental efficiency of host nation enterprises through social, human, and physical capital. FDI is also positively influenced by CO2 emissions in South Asia, suggesting that South Asia economies can serve as “pollution havens” for polluting industries worldwide. This also means that developed economies have harsh pollution rules; therefore, industrial sector pollution may likely be shifted to developing economies. This result of FDI indicates that foreign investors in South Asia economies must focus not on the quantity but rather on the quality of the environment.
Regional causality is validated in Table 8. The DH causality indicated a bi-directional causality between patents and CO2 in BRI, East and Southeast Asia, MENA, Europe, and Central Asia but not in South Asia. Similarly, bi-direction causality was observed between trademarks and CO2 in BRI, South Asia, East and Southeast Asia, MENA, and Europe but not in Central Asia.

TABLE 8. Panel heterogenous causality results.
The findings presented in Table 9 revealed that patents negatively affected CO2 emissions in seven of the 45 BRI economies, with the economies of Mongolia, Philippines, Mongolia, Jordan, Azerbaijan, Croatia, Hungary, Latvia, Poland, Romania, and Uzbekistan showing emission increases of 0.23%, 0.08%, 0.21%, 0.28%, 0.07%, 0.08%, 0.06%, 0.14%, 0.11%, 0.11% and 0.05, respectively. In contrast, patents positively affected CO2 emissions in 20 of the 45 BRI economies. Innovations due to patents showed positive effects on CO2 emissions by 11% in Pakistan, 12% in Sri Lanka, 17% in China, 0.09% in Indonesia, 15% in Malaysia, 0.11% in Thailand, 0.07% in Korea, 0.16% in Russia, 0.09 in Iran, 0.18% in Iraq, 0.17% in Saudi Arabia, 0.09% Source: Author's estimation in Yemen, 0.04% in Morocco, 0.04% in Tunisia, 0.11% in Armenia, 0.15% in Belarus, 0.19% in Bulgaria, 0.05% in Estonia, 0.15% in Lithuania, 0.37% in Ukraine.
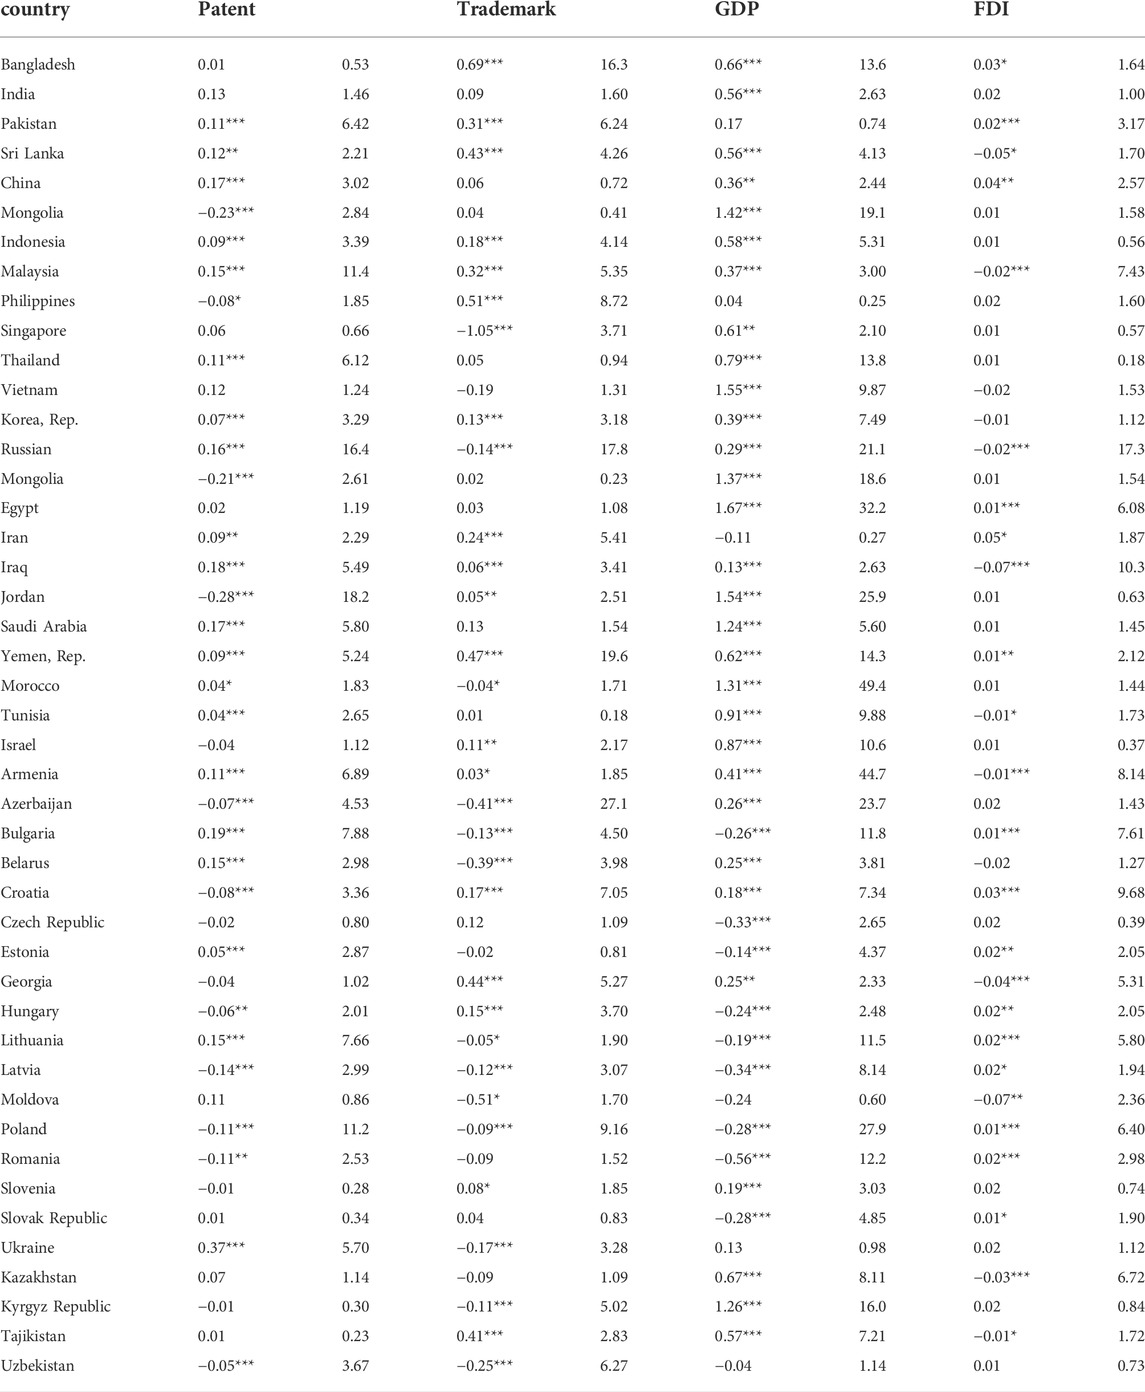
TABLE 9. FMOLS estimates (economy-wise).
An increase in innovations by trademark led to carbon emission decreases of 1.05% in Singapore, 0.14% in Russia, 0.04% in Morocco, 0.41% in Azerbaijan, 0.39% in Belarus, 0.13% in Bulgaria, 0.12% in Latvia, 0.05% in Lithuania, 0.51% in Moldova, 0.09% in Poland, 0.17% in Ukraine, 0.11% in the Kyrgyz Republic, and 0.25% in Uzbekistan. In contrast, increased trademarks led to upsurges in carbon emissions of 0.69% in Bangladesh, 0.31% in Pakistan 0.43% in Sri Lanka, 0.18% in Indonesia, 0.32% in Malaysia, 0.51% in the Philippines, 0.13% in Korea, 0.24% in Iran, 0.06% in Iraq, 0.05% in Jordan, 0.47% in Yemen, 0.11% in Israel, 0.03% in Armenia, 0.17% in Croatia, 0.44% in Georgia, 0.15% in Hungary, 0.08% in Slovenia, and 0.41% in Tajikistan.
GDP enhanced CO2 emissions in 33 BRI countries: Bangladesh, India, Sri Lanka, China, Mongolia, Indonesia, Malaysia, Singapore, Thailand, Vietnam, Korea, Russia, Mongolia, Egypt, Iraq, Jordan, Saudi Arabia, Yemen, Morocco, Tunisia, Israel, Armenia, Azerbaijan, Belarus, Croatia, Georgia, Slovenia, Ukraine, Kazakhstan, Kyrgyz Republic, and Tajikistan. The GDP alleviated pollution emissions in Bulgaria, the Czech Republic, Estonia, Hungary, Lithuania, Latvia, Poland, Romania, and the Slovak Republic. Overall, these outcomes showed that GDP created more environmental problems in BRI economies.
However, FDI positively affected environmental pollution in Bangladesh, Pakistan, China, Egypt, Iran, Yemen, Bulgaria, Croatia, Estonia, Hungary, Lithuania, Latvia, Poland, Romania, and the Slovak Republic, consistent with previous literature. In contrast, FDI negatively affected environmental pollution in Sri Lanka, Malaysia, Russia, Iraq, Tunisia, Armenia, Georgia, Moldova, Kazakhstan, and Tajikistan.
BRI economies contain 39% of the land area, 64% of the population, 50% of the energy consumption, 35% of the international trade, 30% of the GDP, and 54% of the CO2 emissions worldwide. As a foremost sponsor of BRI, China holds the main share in world trade volume, GDP, and energy consumption and is the most significant CO2 producer. Technology innovation and the environment are a fresh debate among policymakers and environmental scientists. The key focus of the present study was to offer strategies for BRI economies regarding the technology innovation-environmental quality nexus of BRI regions and countries. Our analysis employed FMOLS estimators to account for heterogeneity, providing robust results. No previous studies have assessed technology innovation and CO2 emissions in BRI host economies.
The results of the empirical analyses of the BRI regions showed that trademarks and patents combated carbon emissions in the BRI economies, with trademarks better controlling pollution emissions compared to patents. We also found that GDP increased CO2 emissions in the BRI regions of South Asia, East, and Southeast Asia, MENA, and Central Asia. While FDI improved the environmental quality in East and Southeast Asia, Europe, and Central Asia, different outcomes were observed in South Asia. The results of the country-wise analysis of BRI indicated that patents had a positive effect on CO2 emissions in 20 economies and led to decreased CO2 emissions in seven economies. Trademarks improved and deteriorated the environmental quality in 13 and 18 economies, respectively.
We recommend some policies based on our results. Government authorities and policymakers should inspire firms, individuals, and industries to register their brand names after demonstrating their competencies in providing products, services, and technology for climate alleviation. Environmentally related technologies will stimulate the industrial sector and improve production methods, among others which could earn more from trademarks. Technological innovation can help the environment and provide increased profit, encouraging individuals, firms, and industries to innovate at all stages. This process would assist in the pollution emission problems in the BRIs. Patent and trademark applicants should be encouraged in all segments of Europe and all others along with BRI. At the same time, patent and trademark applications should focus on environmental quality in South Asia. In BRI and MENA host economies, patent applicants should emphasize pollution abatement products and clean and green environments. BRI host government authorities should also reduce the hurdles in patent innovation.
Patents caused increased environmental pollution in 20 countries, which enhanced both economic activities and pollution. Therefore, sustainable environmental policies are needed in BRI countries to alleviate environmental quality through the green production of patents. Considering BRI regional and country-wise policies, government authorities and policymakers should focus on green production through patents in the economy.
Publicly available datasets were analyzed in this study. This data can be found here: https://databank.worldbank.org/source/world-development-indicators.
ZN: validation, formal analysis, investigation, resources, and project administration; LX: supervision, methodology, and software; AB: conceptualization, methodology, software, validation, and writing—original draft preparation; MS: writing—review and editing. All authors have read and agreed to the published version of the manuscript.
This research was funded by the National Natural Science Foundation of China (Grant Nos 71961031 and 71872160).
The authors declare that the research was conducted in the absence of any commercial or financial relationships that could be construed as a potential conflict of interest.
All claims expressed in this article are solely those of the authors and do not necessarily represent those of their affiliated organizations, or those of the publisher, the editors, and the reviewers. Any product that may be evaluated in this article, or claim that may be made by its manufacturer, is not guaranteed or endorsed by the publisher.
Ahmad, U. S., Usman, M., Hussain, S., Jahanger, A., and Abrar, M. (2022). Determinants of renewable energy sources in Pakistan: An overview. Environ. Sci. Pollut. Res. 29, 29183–29201. doi:10.1007/s11356-022-18502-w
Aung, T. S., Fischer, T. B., and Shengji, L. (2020). Evaluating environmental impact assessment (EIA) in the countries along the belt and road initiatives: System effectiveness and the compatibility with the Chinese EIA. Environ. Impact Assess. Rev. 81, 106361. doi:10.1016/j.eiar.2019.106361
Azevedo, V. G., Sartori, S., and Campos, L. M ( (2018). CO2 emissions: A quantitative analysis among the BRICS nations. Renew. Sustain. Energy Rev. 81, 107–115. doi:10.1016/j.rser.2017.07.027
Beeson, M. (2018). Geoeconomics with Chinese characteristics: The BRI and China's evolving grand strategy. Econ. Polit. Stud. 6 (3), 240–256. doi:10.1080/20954816.2018.1498988
Chishti, M. Z., Ahmad, M., Rehman, A., and Khan, M. K. (2021). Mitigations pathways towards sustainable development: Assessing the influence of fiscal and monetary policies on carbon emissions in BRICS economies. J. Clean. Prod. 292, 126035. doi:10.1016/j.jclepro.2021.126035
Chishti, M. Z., and Sinha, A. (2022). Do the shocks in technological and financial innovation influence the environmental quality? Evidence from BRICS economies. Technol. Soc. 68, 101828. doi:10.1016/j.techsoc.2021.101828
Chishti, M. Z., Ullah, S., Ozturk, I., and Usman, A. (2020). Examining the asymmetric effects of globalization and tourism on pollution emissions in South Asia. Environ. Sci. Pollut. Res. 27 (22), 27721–27737. doi:10.1007/s11356-020-09057-9
de Bruyn, S. M. (1998). Explaining the Environmental Kuznets Curve: Structural Change and International Agreements in Reducing Sulphur Emissions. Environ. Dev. Econ. (2), 485–502. doi:10.1017/s1355770x97000260
Dogan, E., Chishti, M. Z., Alavijeh, N. K., and Tzeremes, P. (2022). The roles of technology and Kyoto Protocol in energy transition towards COP26 targets: Evidence from the novel GMM-PVAR approach for G-7 countries. Technol. Forecast. Soc. Change 181, 121756. doi:10.1016/j.techfore.2022.121756
Dumitrescu, E. I., and Hurlin, C ( (2012). Testing for Granger non-causality in heterogeneous panels. Econ. Model. 29 (4), 1450–1460. doi:10.1016/j.econmod.2012.02.014
Ehrlich, P. R., and Holdren, J. P ( (1971). Impact of population growth. Science 171 (3977), 1212–1217. doi:10.1126/science.171.3977.1212
Evangelista, R., Guerrieri, P., and Meliciani, V ( (2014). The economic impact of digital technologies in Europe. Econ. Innovation New Technol. 23 (8), 802–824. doi:10.1080/10438599.2014.918438
Fan, J. L., Da, Y. B., Wan, S. L., Zhang, M., Cao, Z., Wang, Y., et al. (2019). Determinants of carbon emissions in 'belt and road initiative'countries: A production technology perspective. Appl. Energy 239, 268–279. doi:10.1016/j.apenergy.2019.01.201
Fernández-caramés, T. M., and Member, S. (2018). A Review on the Use of Blockchain for the Internet of Things., 32979–33001. doi:10.1109/ACCESS.2018.2842685
Fisher-vanden, K., and Wing, I. S. (2007). Accounting for Quality: Issues with Modeling the Impact of R&D on Economic Growth and Carbon Emissions in Developing Economies. 64204, 1–28.
Frees, E. W. (1995). Assessing cross-sectional correlation in panel data. J. Econom. 69 (2), 393–414. doi:10.1016/0304-4076(94)01658-m
Frees, E. W. (2004). Longitudinal and panel data: Analysis and applications in the social sciences. Cambridge University Press.
Friedman, M. (1937). The use of ranks to avoid the assumption of normality implicit in the analysis of variance. J. Am. Stat. Assoc. 32 (200), 675–701. doi:10.1080/01621459.1937.10503522
Gillingham, K., Newell, R. G., and Pizer, W. A. (2008). Modeling endogenous technological change for climate policy analysis. 30, 2734–2753. doi:10.1016/j.eneco.2008.03.001
Granger, C. W. (1969). Investigating causal relations by econometric models and cross-spectral methods. Econometrica 37, 424–438. doi:10.2307/1912791
Grossman, G. M., and Krueger, A. B ( (1991). Environmental impacts of a North American free trade agreement (No. w3914). National Bureau of economic research.
Hübler, M., Baumstark, L., Leimbach, M., Edenhofer, O., and Bauer, N ( (2012). An integrated assessment model with endogenous growth. Ecol. Econ. 83, 118–131. doi:10.1016/j.ecolecon.2012.07.014
Ibrahiem, D. M. (2020). Do technological innovations and financial development improve environmental quality in Egypt? Environ. Sci. Pollut. Res. 27, 10869–10881. doi:10.1007/s11356-019-07585-7
Innes, R., and Carrio, C. E. (2010). Environmental innovation and environmental performance 59, 27–42. doi:10.1016/j.jeem.2009.05.003
Jaffe, A. B., and Stavins, R. N. (1994). The energy-efficiency gap what does it mean? Energy policy 22 (10), 804–810. doi:10.1016/0301-4215(94)90138-4
Jahanger, A. (2022). Impact of globalization on CO2 emissions based on EKC hypothesis in developing world: The moderating role of human capital. Environ. Sci. Pollut. Res. 29 (14), 20731–20751. doi:10.1007/s11356-021-17062-9
Jahanger, A. (2021). Influence of FDI characteristics on high-quality development of China's economy. Environ. Sci. Pollut. Res. 28 (15), 18977–18988. doi:10.1007/s11356-020-09187-0
Jahanger, A., Usman, M., and Balsalobre-Lorente, D. (2021). Autocracy, democracy, globalization, and environmental pollution in developing world: Fresh evidence from STIRPAT model. J. Public Aff., e2753. doi:10.1002/pa.2753
Jahanger, A., Usman, M., and Balsalobre‐Lorente, D. (2022b). Linking institutional quality to environmental sustainability. Sustainable Development.
Jahanger, A., Usman, M., Murshed, M., Mahmood, H., and Balsalobre-Lorente, D. (2022a). The linkages between natural resources, human capital, globalization, economic growth, financial development, and ecological footprint: The moderating role of technological innovations. Resour. Policy 76, 102569. doi:10.1016/j.resourpol.2022.102569
Jahanger, A., Yang, B., Huang, W. C., Murshed, M., Usman, M., and Radulescu, M. (2022c). “Dynamic linkages between globalization, human capital, and carbon dioxide emissions: Empirical evidence from developing economies,” in Environment, development and sustainability, 1–29.
Jahanger, A., Yu, Y., Awan, A., Chishti, M. Z., Radulescu, M., and Balsalobre-Lorente, D. (2022d). The impact of hydropower energy in Malaysia under the EKC hypothesis: Evidence from quantile ARDL approach. SAGE Open 12 (3), 215824402211095. doi:10.1177/21582440221109580
Jiang, T., Li, S., Yu, Y., and Peng, Y. (2022). Energy-related carbon emissions and structural emissions reduction of China’s construction industry: The perspective of input–output analysis. Environ. Sci. Pollut. Res. 29 (26), 39515–39527. doi:10.1007/s11356-021-17604-1
Jiang, T., Yu, Y., Jahanger, A., and Balsalobre-Lorente, D. (2022). Structural emissions reduction of China's power and heating industry under the goal of" double carbon": A perspective from input-output analysis. Sustain. Prod. Consum. 31, 346–356. doi:10.1016/j.spc.2022.03.003
Jones, A. (2002). An environmental assessment of food supply chains: A case study on dessert apples 30 (4), 560–576. doi:10.1007/s00267-002-2383-6
Kamal, M., Usman, M., Jahanger, A., and Balsalobre-Lorente, D. (2021). Revisiting the role of fiscal policy, financial development, and foreign direct investment in reducing environmental pollution during globalization mode: Evidence from linear and nonlinear panel data approaches. Energies 14 (21), 6968. doi:10.3390/en14216968
Ke, J., Jahanger, A., Yang, B., Usman, M., and Ren, F. (2022). Digitalization, financial development, trade, and carbon emissions; implication of pollution haven hypothesis during globalization mode. Front. Environ. Sci. 211. doi:10.3389/fenvs.2022.873880
Khan, A., Muhammad, F., Chenggang, Y., Hussain, J., Bano, S., and Khan, M. A. (2020). The impression of technological innovations and natural resources in energy-growth-environment nexus : A new look into BRICS economies Science of the Total Environment The impression of technological innovations and natural resources in energy-growth-environment nexus : A new look into BRICS economies. Sci. Total Environ. 727, 138265. doi:10.1016/j.scitotenv.2020.138265
Khattak, S. I., Ahmad, M., Khan, Z. U., and Khan, A ( (2020). Exploring the impact of innovation, renewable energy consumption, and income on CO2 emissions: New evidence from the BRICS economies. Environ. Sci. Pollut. Res. 27, 13866–13881. doi:10.1007/s11356-020-07876-4
Levinson, A. (2009). Technology, international trade, and pollution from US manufacturing. Am. Econ. Rev. 99 (5), 2177–2192. doi:10.1257/aer.99.5.2177
Li, S., Yu, Y., Jahanger, A., Usman, M., and Ning, Y. (2022). The impact of green investment, technological innovation, and globalization on CO2 emissions: Evidence from MINT countries. Front. Environ. Sci. 156. doi:10.3389/fenvs.2022.868704
Lin, B., and Zhu, J. (2019). Determinants of renewable energy technological innovation in China under CO2 emissions constraint. J. Environ. Manage. 247, 662–671. doi:10.1016/j.jenvman.2019.06.121
Liu, H. Y., Tang, Y. K., Chen, X. L., and Poznanska, J. (2017). The determinants of Chinese outward FDI in countries along "one belt one road. Emerg. Mark. Finance Trade 53 (6), 1374–1387. doi:10.1080/1540496x.2017.1295843
Lucas, R. E. (1988). On the mechanics of economic development. J. Monet. Econ. 22 (1), 3–42. doi:10.1016/0304-3932(88)90168-7
Malamud, S., and Zucchi, F ( (2019). Liquidity, innovation, and endogenous growth. J. Financ. Econ. 132 (2), 519–541. doi:10.1016/j.jfineco.2018.11.002
Mensah, C. N., Long, X., Boamah, K. B., Bediako, I. A., Dauda, L., and Salman, M. (2018). The effect of innovation on CO 2 emissions of OCED countries from 1990 to 2014. Environ. Sci. Pollut. Res. 25 (29), 29678–29698. doi:10.1007/s11356-018-2968-0
Metz, B., Davidson, O., Bosch, P., Dave, R., and Meyer, L. (2007). Climate change 2007: Mitigation of climate change. Cambridge Univ. Press.
Mingyong, L. A. I., Shuijun, P., and Qun, B. A. O. (2006). Technology spillovers, absorptive capacity and economic growth. China Econ. Rev. 17 (3), 300–320. doi:10.1016/j.chieco.2006.04.005
Pazienza, P. (2015). The relationship between CO2 and Foreign Direct Investment in the agriculture and fishing sector of OECD countries: Evidence and policy considerations. Intellect. Econ. 9 (1), 55–66. doi:10.1016/j.intele.2015.08.001
Pedroni, P. (2004). Panel cointegration: Asymptotic and finite sample properties of pooled time series tests with an application to the PPP hypothesis. Econ. Theory 20, 597–625. doi:10.1017/s0266466604203073
Pesaran, H. M. (2004). General diagnostic tests for cross-sectional dependence in panels. University of Cambridge. Cambridge Working Papers in Economics 435.
Piao, Z., and Id, Y. L. (2020). Financing innovation and enterprises’ efficiency of technological innovation in the internet industry: Evidence from China. PLoS One. 15 (9), 1–19. doi:10.1371/journal.pone.0239265
Qayyum, M., Ali, M., Nizamani, M. M., Li, S., Yu, Y., and Jahanger, A. (2021). Nexus between financial development, renewable energy consumption, technological innovations and CO2 emissions: The case of India. Energies 14 (15), 4505. doi:10.3390/en14154505
Qiang, O., Tian-Tian, W., Ying, D., Zhu-Ping, L., and Jahanger, A. (2022). The impact of environmental regulations on export trade at provincial level in China: Evidence from panel quantile regression. Environ. Sci. Pollut. Res. 29 (16), 24098–24111. doi:10.1007/s11356-021-17676-z
Raiser, K., Naims, H., and Bruhn, T ( (2017). Corporatization of the climate? Innovation, intellectual property rights, and patents for climate change mitigation. Energy Res. Soc. Sci. 27, 1–8. doi:10.1016/j.erss.2017.01.020
Romer, P. M. (1990). Endogenous technological change. J. Polit. Econ. 98 (52), 71–102. doi:10.1086/261725
Saudi, M. H. M., Sinaga, O., Roespinoedji, D., and Razimi, M. S. A ( (2019). The role of renewable, non-renewable electricity consumption and carbon emission in development in Indonesia: Evidence from Distributed Lag Tests. Int. J. Energy Econ. Policy 9 (3), 46–52. doi:10.32479/ijeep.7730
Sohag, K., Begum, R. A., Abdullah, S. M. S., and Jaafar, M. (2015). Dynamics of energy use, technological innovation, economic growth and trade openness in Malaysia. Energy 90, 1497–1507. doi:10.1016/j.energy.2015.06.101
Solow, R. M. (1957). Technical change and the aggregate production function. Rev. Econ. Stat. 39, 312–320. doi:10.2307/1926047
Stokey, N. L. (1998). Are there limits to growth? Int. Econ. Rev. Phila. 39, 1–31. doi:10.2307/2527228
Su, H. N., and Moaniba, I. M ( (2017). Does innovation respond to climate change? Empirical evidence from patents and greenhouse gas emissions. Technol. Forecast. Soc. Change 122, 49–62. doi:10.1016/j.techfore.2017.04.017
Tursun, O. T., Akyüz, A. O., Erdem, A., and Erdem, E. (2015). The state of the art in hdr deghosting: A survey and evaluation. Comput. Graph. Forum 34 (2), 683–707. doi:10.1111/cgf.12593
Ullah, S., Chishti, M. Z., and Majeed, M. T. (2020). The asymmetric effects of oil price changes on environmental pollution: Evidence from the top ten carbon emitters. Environ. Sci. Pollut. Res. 27 (23), 29623–29635. doi:10.1007/s11356-020-09264-4
Usman, M., Anwar, S., Yaseen, M. R., Makhdum, M. S. A., Kousar, R., and Jahanger, A. (2021). Unveiling the dynamic relationship between agriculture value addition, energy utilization, tourism and environmental degradation in South Asia. J. Public Aff., e2712. doi:10.1002/pa.2712
Usman, M., Balsalobre-Lorente, D., Jahanger, A., and Ahmad, P. (2022b). Pollution concern during globalization mode in financially resource-rich countries: Do financial development, natural resources, and renewable energy consumption matter? Renew. Energy 183, 90–102. doi:10.1016/j.renene.2021.10.067
Usman, M., and Jahanger, A. (2021). Heterogeneous effects of remittances and institutional quality in reducing environmental deficit in the presence of EKC hypothesis: A global study with the application of panel quantile regression. Environ. Sci. Pollut. Res. 28 (28), 37292–37310. doi:10.1007/s11356-021-13216-x
Usman, M., Jahanger, A., Makhdum, M. S. A., Balsalobre-Lorente, D., and Bashir, A. (2022a). How do financial development, energy consumption, natural resources, and globalization affect arctic countries' economic growth and environmental quality? An advanced panel data simulation. Energy 241, 122515. doi:10.1016/j.energy.2021.122515
Usman, M., Jahanger, A., Radulescu, M., and Balsalobre-Lorente, D. (2022c). Do nuclear energy, renewable energy, and environmental-related technologies asymmetrically reduce ecological footprint? Evidence from Pakistan. Energies 15 (9), 3448. doi:10.3390/en15093448
Wan, X., Jahanger, A., Usman, M., Radulescu, M., Balsalobre-Lorente, D., and Yu, Y. (2022). Exploring the effects of economic complexity and the transition to a clean energy pattern on ecological footprint from the Indian perspective. Front. Environ. Sci. 9, 736. doi:10.3389/fenvs.2021.816519
Weimin, Z., Chishti, M. Z., Rehman, A., and Ahmad, M. (2022). A pathway toward future sustainability: Assessing the influence of innovation shocks on CO2 emissions in developing economies. Environ. Dev. Sustain. 24 (4), 4786–4809. doi:10.1007/s10668-021-01634-3
Westerlund, J. (2007). Testing for error correction in panel data. Oxf. Bull. Econ. Stat. 69 (6), 709–748. doi:10.1111/j.1468-0084.2007.00477.x
Xiao, Y., Tylecote, A., and Liu, J. (2013). Why not greater catch-up by Chinese firms? The impact of IPR, corporate governance and technology intensity on late-comer strategies. Res. Policy 42 (3), 749–764. doi:10.1016/j.respol.2012.11.005
Yang, B., Ali, M., Hashmi, S. H., and Jahanger, A. (2022). Do income inequality and institutional quality affect CO2 emissions in developing economies? Environ. Sci. Pollut. Res. 29 (28), 42720–42741. doi:10.1007/s11356-021-18278-5
Yang, B., Jahanger, A., and Ali, M. (2021b). Remittance inflows affect the ecological footprint in BICS countries: Do technological innovation and financial development matter? Environ. Sci. Pollut. Res. 28 (18), 23482–23500. doi:10.1007/s11356-021-12400-3
Yang, B., Jahanger, A., and Khan, M. A. (2020). Does the inflow of remittances and energy consumption increase CO2 emissions in the era of globalization? A global perspective. Air Qual. Atmos. Health 13 (11), 1313–1328. doi:10.1007/s11869-020-00885-9
Yang, B., Jahanger, A., Usman, M., and Khan, M. A. (2021a). The dynamic linkage between globalization, financial development, energy utilization, and environmental sustainability in GCC countries. Environ. Sci. Pollut. Res. 28 (13), 16568–16588. doi:10.1007/s11356-020-11576-4
Yang, B., Usman, M., and jahanger, A. (2021c). Do industrialization, economic growth and globalization processes influence the ecological footprint and healthcare expenditures? Fresh insights based on the STIRPAT model for countries with the highest healthcare expenditures. Sustain. Prod. Consum. 28, 893–910. doi:10.1016/j.spc.2021.07.020
Yii, K. J., and Geetha, C ( (2017). The nexus between technology innovation and CO2 emissions in Malaysia: Evidence from granger causality test. Energy procedia. 105, 3118–3124. doi:10.1016/j.egypro.2017.03.654
Young, A. (1991). Learning by doing and the dynamic effects of international trade. Q. J. Econ. 106 (2), 369–405. doi:10.2307/2937942
Yu, Y., and Du, Y. (2019). Impact of technological innovation on CO2 emissions and emissions trend prediction on 'New Normal'economy in China. Atmos. Pollut. Res. 10 (1), 152–161. doi:10.1016/j.apr.2018.07.005
Yu, Y., Li, S., Sun, H., and Taghizadeh-Hesary, F. (2021). Energy carbon emission reduction of China’s transportation sector: An input–output approach, Economic Analysis and Policy. Elsevier B.V. doi:10.1016/j.eap.2020.12.014
Yu, Y., Jiang, T., Li, S., Li, X., and Gao, D. (2020). Energy-related CO2 emissions and structural emissions’ reduction in China’s agriculture: An input–output perspective. J. Clean. Prod. 276, 124169. doi:10.1016/j.jclepro.2020.124169
Zhang, C., and Zhou, X ( (2016). Does foreign direct investment lead to lower CO2 emissions? Evidence from a regional analysis in China. Renew. Sustain. Energy Rev. 58, 943–951. doi:10.1016/j.rser.2015.12.226
Zhang, L., Yang, B., and Jahanger, A. (2022). The role of remittance inflow and renewable and non-renewable energy consumption in the environment: Accounting ecological footprint indicator for top remittance-receiving countries. Environ. Sci. Pollut. Res. 29 (11), 15915–15930. doi:10.1007/s11356-021-16545-z
Zhang, Y., Cheng, Z., and He, Q. (2020). Time lag analysis of FDI spillover effect. Int. J. Emerg. Mark. 15 (4), 629–650. doi:10.1108/ijoem-03-2019-0225
Keywords: technology innovation, environmental quality, one belt and road initiative, FMOLS, clean energy
Citation: Nanli Z, Xiaoping L, Sohail Akhtar M and Bilal A (2022) Clean technology and the environment: Key issues and implications in belt and road initiative economies. Front. Environ. Sci. 10:1009155. doi: 10.3389/fenvs.2022.1009155
Received: 01 August 2022; Accepted: 05 September 2022;
Published: 20 September 2022.
Edited by:
Magdalena Radulescu, University of Pitesti, RomaniaReviewed by:
Joshua Chukwuma Onwe, Federal Polytechnic Ohodo, NigeriaCopyright © 2022 Nanli, Xiaoping, Sohail Akhtar and Bilal. This is an open-access article distributed under the terms of the Creative Commons Attribution License (CC BY). The use, distribution or reproduction in other forums is permitted, provided the original author(s) and the copyright owner(s) are credited and that the original publication in this journal is cited, in accordance with accepted academic practice. No use, distribution or reproduction is permitted which does not comply with these terms.
*Correspondence: Ahmer Bilal, YWhtZXJiaWxhbDE5ODdAZ21haWwuY29t
Disclaimer: All claims expressed in this article are solely those of the authors and do not necessarily represent those of their affiliated organizations, or those of the publisher, the editors and the reviewers. Any product that may be evaluated in this article or claim that may be made by its manufacturer is not guaranteed or endorsed by the publisher.
Research integrity at Frontiers
Learn more about the work of our research integrity team to safeguard the quality of each article we publish.