 Bingjie Yu
 Xu Cui1*
- 1School of architecture, Southwest Jiaotong University, Chengdu, China
- 2Changsha Planning and Design Institute Co., Ltd., Changsha, China
Urban vibrancy is described by the activities of residents and their spatio-temporal dynamics. The metro station area (MSA) is one of the densest and most populous areas of the city. Thus, creating a vibrant and diverse urban environment becomes an important goal of transit-oriented development (TOD). Existing studies indicate that the built environment decisively determines MSA-level urban vibrancy. Meanwhile, the spatio-temporal heterogeneity of such effects requires thoroughly exploration and justification. In this study, we first apply mobile signaling data to quantify and decipher the spatio-temporal distribution characteristics of the MSA-level urban vibrancy in Chengdu, China. Then, we measure the built environment of the MSA by using multi-source big data. Finally, we employ geographically and temporally weighted regression (GTWR) models to examine the spatio-temporal non-stationarity of the impact of the MSA-level built environment on urban vibrancy. The results show that: 1) The high-vibrant MSAs concentrate in the commercial center and the employment center. 2) Indicators such as residential density, overpasses, road density, road network integration index, enterprise density, and restaurant density are significantly and positively associated with urban vibrancy, while indicators such as housing price and bus stop density are negatively associated with urban vibrancy. 3) The GTWR model better fits the data than the stepwise regression model. The impact of the MSA-level built environment on urban vibrancy shows a strong non-stationarity in both spatial and temporal dimensions, which matches with the spatio-temporal dynamic patterns of the residents’ daily work, leisure, and consumption activities. The findings can provide references for planners and city managers on how to frame vibrant TOD communities.
1 Introduction
Urban vibrancy has constantly been a hot topic in the research field of urban geography and urban planning (Yue et al., 2017; Niu et al., 2022). Many cities regard the construction of a vibrant urban environment as the leading objective during the development process (Zhang et al., 2021). The conception of urban vibrancy originated from Jacobs’ idea of urban diversity and Gehl’s theory of street space vibrancy. Jacobs (1961) considers that “liveliness and variety attract more liveliness; deadness and monotony repel life”. Gehl (2011) divides human activities into three categories: necessary activities, optional activities, and social activities. He also points out that optional activities and social activities are the keys to the public space vibrancy. In general, the spatial distribution of people and their activities act as the core of urban vibrancy, which reflects the quality of space and the vibrancy of the city (Montgomery, 1998). A vibrant city is able to promote residents’ life qualities, stimulate the consciousness of communities, and enhance the city’s attractiveness (Xiao et al., 2021). In this regard, the research on urban vibrancy will help urban planners to understand the spatial structure of cities, recognize the pattern of citizens’ activities, and optimize the layout of facilities.
Since the 21st century, with rapid urbanization and urban rail transit construction, TOD has become an important concept that guides urban development and enhances urban vibrancy in China (Yang et al., 2022a; Qiang et al., 2022). TOD transit nodes are generally located in developed areas with multiple functions such as transportation, commerce, resident, and office. These also are areas with the most advanced urban transportation network and the most intensive travel activities. Also, relevant studies reveal that the proximity to metro stations and corridors exerts significant positive effects on urban vibrancy (Long and Huang, 2019; Xiao et al., 2021). Meanwhile, due to the differences in development intensity and geography location (e.g., city center versus suburban area), the vibrancy of some neighborhoods around the metro stations is still at a low level and constantly attenuated. Thus, urban planners need to have an in-depth understanding of the spatio-temporal distribution patterns and influencing factors of the TOD vibrancy.
Urban built environment, as the carriers of various human activities (Chen et al., 2022a; Chen et al., 2022b), determines the evolution and spread of urban vibrancy. Previous studies (Tu et al., 2020; Peng et al., 2021) have explored the impact of the built environment (using the 3Ds and 5Ds frameworks) (Cervero and Kockelman, 1997; Ewing and Cervero, 2010) on urban vibrancy at the city scale, but few of them scrutinize such interplay from a TOD scope. Furthermore, there is a lack of human-scale built environment indicators research, especially the refine spatial indicators such as the pedestrian system of TOD and the environmental quality of streets. In addition, most existing studies use linear (Tu et al., 2022) or nonlinear (Yang et al., 2021a; Xiao et al., 2021) models to analyze the effects of the built environment on urban vibrancy. However, the above two types of models and their extensions ignore the typical time-varying tidal characteristics of human activities in the MSA. Hence, these models fail to characterize the spatio-temporal non-stationarity of the built environment impact on urban vibrancy.
To address these gaps, we use multi-source big data to measure the built environment of MSA in Chengdu, China (with the fourth largest rail transit system in China). Then, we leverage mobile phone signaling data to capture the intensity of human activities (urban vibrancy) around the metro stations for 18 separate hours (from 6:00 to 23:00). Finally, we analyze the spatio-temporal non-stationarity of the impact of the MSA-level built environment on urban vibrancy based on a geographically temporally weighted regression model (GTWR). The empirical findings can provide theoretical support and policy implications for the people-oriented built environment design of TOD and the creation of vibrant cities.
The remainder of this paper is structured as follows: Section 2 reviews and analyzes previous studies. Section 3 introduces the study area, data sources, and methodology. Section 4 analyzes and discusses the model results. Section 5 concludes and provides evidence-based policy implications.
2 Literature review
2.1 Urban vibrancy
The exploration of urban vibrancy started in the 1950s and 1960s. Jacobs and Gehl analyzed the connotation of urban vibrancy from multidimensional perspectives, including sociology, urban space, and even anthropology (Jacobs, 1961; Gehl, 2011). Since then, the definition of urban vibrancy has been widely discussed by scholars. For example, Ravenscroft (2000) argued that urban vibrancy reflects how busy neighborhoods are in different spatial and temporal dimensions. Mehta (2007) pointed out that a vibrant space requires a high density of continuous pedestrian flow and activity participation. Montgomery (1998) stated that urban vibrancy can be measured by the amount of foot traffic, use frequency of facilities, and density of activities. Dougal et al. (2015) defined urban vibrancy as the spillover effect generated from the interactions of city residents.
There is always a debate on the selection of suitable metrics that quantify urban vibrancy or the intensity of human activities. Early studies mostly used traditional methods such as manual counts and population censuses to measure urban vibrancy (Harvey, 2001; Xu and Chen, 2021). Even containing detailed information about the population and types of activities, these quantitative measures still suffer from disadvantages such as small survey sample sizes, discontinuity in time, and the subjectivity of the interviewees. In recent years, with the rapid spread of smart phones as well as the advances in location aware device (LAD) and location based service (LBS), burgeoning technologies have brought new data sources and research tools for urban vibrancy studies (Wu et al., 2022). Multiple-source spatio-temporal big data, with its characteristics of massive scale, rapid flow, and diversity (Zhou et al., 2020), enriches the human social activities and urban spatial information. Thus, urban researchers can carry out refined spatio-temporal behavior analysis of the population through multiple sources of big data. Some studies quantify the urban vibrancy through the distribution of people and activities which is obtained from big data such as the distribution and density of commercial facilities (POI, etc.) (Xia et al., 2020), social media check-in (Facebook, Twitter, Weibo, etc.) (Wu et al., 2018a), GDP (Wang et al., 2022a), heat map of mobile applications (mobile phone signaling, Baidu heat map, etc.) (Yang et al., 2021a), and traffic flow (shared bicycle, smartcard, cab GPS, etc.) (Sulis et al., 2018). For instance, Niu et al. (2022) used data from Tencent, Easygo, and Sina Weibo to assess the distribution of the community vibrancy index in Guangzhou. Li et al. (2021) used urban sensor data to detect street vibrancy in historic districts (Baitasi Area) in Beijing. Sulis et al. (2018) leveraged bus smartcard data from a mobility perspective to reveal the characteristics of London’s urban vibrancy distribution. Gómez-Varo et al. (2022), based on Jacobs’ urban vibrancy framework, added another two dimensions of indicators including accessibility and distance to border vacuums, and then integrated the urban vibrancy index of the Nou Barris district in Barcelona. Kim (2018) used Wi-Fi data, mobile phone signaling data, and bank card transactions to measure virtual, social, and economic vibrancy in Seoul, and then analyzed the interplay between these three types of urban vibrancy.
2.2 The relationship between the built environment and urban vibrancy
The built environment has a significant impact on the generation and persistence of urban vibrancy. In Jacobs (1961) seminal text, The Death and Life of America’s Great Cities, she highlighted the crucial role of the physical spatial built environment on urban vibrancy in terms of diversity, neighborhood scale, building form, and density. Previous research launches extensive analysis of the interplay between the built environment and urban vibrancy. Wu et al. (2018b) found a significant contribution of high-density development to neighborhood vibrancy in Beijing. Meanwhile, excessive population density may exert a negative impact on urban vibrancy. Simmel (2012) pointed out that the high concentration of population in industrial cities may inhibit urban vibrancy and lead to negative life attitudes of residents. Moreover, the land-use mix implies a diversity of urban forms and functions. Theories such as New Urbanism, Compact Cities, and Smart Growth all see land-use mix as an important means of urban vibrancy creation. For example, the research of Jacobs-Crisioni et al. (2014), Yue et al. (2017), and Ye et al. (2018) showed that neighborhoods with higher land-use diversity are more vibrant, for land-use mix provides abundant functions for residents’ daily activities, employment, and consumption, thus meets their diverse needs. In addition, the design of street space form is also important to urban vibrancy. Relevant studies analyze the impact of the built environment on urban vibrancy in dimensions including density, scale, order, and connectivity of street networks. They argue that topographic, cultural, and socioeconomic conditions combine to shape the spatial structure and geometric order of urban street networks (Kostof, 1991), which in turn affect the intensity of human travel activities (Rose-Redwood and Bigon, 2018). Natural movement theory also suggests that the density of pedestrian flow on a street is influenced primarily by the spatial structure and accessibility to this area (Hillier et al., 1987). For instance, Huang et al. (2020) found that spatial accessibility of the road network contributes to the human activity intensity. The work of Li et al. (2022) revealed that the proportion of sidewalks, the number of streetlights, and the proximity of public transit exert a positive effect on urban vibrancy.
2.3 The relationship between the transit-oriented development and urban vibrancy
The founder of TOD, Calthorpe, aimed to create vibrant, equitable, and station-centered communities through high-density, land-use mix, walkable development patterns (Ibraeva et al., 2020; Sun et al., 2022). In recent years, with the rapid construction of urban rail transit all over the world and the comprehensive promotion of the TOD concept, some scholars have started to delve from macro-scale vibrancy (city-level) research to micro-scale vibrancy (MSA-level) research. Previous studies mostly considered ridership as the manifestation of TOD vibrancy, and analyzed the impact of MSA-level built environment on ridership to guide the built environment construction and low-carbon travel of residents. Some scholars have studied the interactions between the built environment and metro ridership in mega-cities such as Shanghai (An et al., 2019), Shenzhen (Taylor and Morris, 2015; Shao et al., 2020), Guangzhou (Li et al., 2020a), Hong Kong (Loo et al., 2010), Seoul (Choi et al., 2012), Washington, D.C. (Ding et al., 2019), and Chicago (Yang et al., 2020a). However, recent research has shown that ridership only represents the “T" (Transportation) in “TOD”, but ignores the “D” (Development) which represents the TOD vibrancy (Yang et al., 2021a). Thus, several scholars start to shift from “point-based” metro ridership to “area-based” MSA-level human activities. They leverage burgeoning datasets such as social media, heat map of mobile applications, and POI to analyze the impact of the built environment on the MSA-level human activities intensity (Tu et al., 2022). For example, Xiao et al. (2021) and Yang et al. (2021a) both investigated the non-linear relationship between TOD and MSA-level vibrancy in Shenzhen based on the Gradient Boosted Decision Tree (GBDT) model, and their study revealed that indicators such as transportation accessibility, building density, and land-use mix are non-linearly positively correlated with vibrancy around the MSA. Tu et al. (2022) explored the interplay between MSA built environment and urban vibrancy using a spatial lag model and found that the differences of land-use mix, road network density, and commercial land area affect urban vibrancy. Xu and Chen (2021) characterized the population density and activities of MSA underground spaces and found that the human activities in the underground spaces are affected by the combination of spatial comprehensibility, accessibility, functional mix, business organization, and entrance/exit layouts.
Although the above studies analyze the interplay between built environment indicators (population density, FAR, road density, land-use mix, etc.) and MSA-level vibrancy from the macroscopic scale of cities and the microscopic scale of MSAs, little has been done on the microscopic scale from the human-scale perspective. For example, pedestrian system indicators including the three-dimensional indicators such as metro entrances/exits number and overpass facilities, and visual perception indicators of street space such as green view rate and sky rate are usually ignored (Yang et al., 2021b). In addition, the traditional linear models (OLS, SEM, etc.) and the burgeoning nonlinear models (GBDT, RF) employed in relevant studies are all global models. These models fail to explain the local spatial effects of the built environment on vibrancy. Some previous studies employed GWR models to reveal the spatial heterogeneity of built environment effects on vibrancy. While due to the time-varying tidal characteristics of MSA-level human activities with typical morning and evening peak fluctuations, this phenomena lead to significant spatio-temporal heterogeneity of the influencing factors. Hence, the GWR model fails to explain the spatio-temporal non-stationarity of the impact factors. For the above reasons, there is a need to establish a modeling approach that considers both spatial and temporal effects.
3 Study area and data
3.1 Study area
Chengdu, located in southwest China and as one of the largest cities in the west of the country, is selected as the case study in this work. With a population of 21,192,000, Chengdu becomes the fourth largest city in China, only after Chongqing, Shanghai, and Beijing. Chengdu currently has one of the fast-developed metro systems in the world, with the rail network has grown to 518.5 km in 2021 since the opening of the 1st subway line (Line 1, Phase 1, 18.5 km) in 2010. Considering the dramatic impact of the Covid-19 epidemic on the city’s human activities, we chose November 2019 as the time point of this study. As of November 2019, the length of the Chengdu metro lines in service is 226 km, and the average daily ridership reaches 3.834 million. A total of 6 lines are opened, namely metro lines 1, 2, 3, 4, 7, and 10, with 156 metro stations in all (Figure 1). In recent years, Chengdu has released development strategies such as “TOD City”, TOD has become an important mean to achieve low-carbon city development and cultivate urban vibrancy. In this study, we use an 800 m buffer zone outward from the core of the station as the scale of MSA.
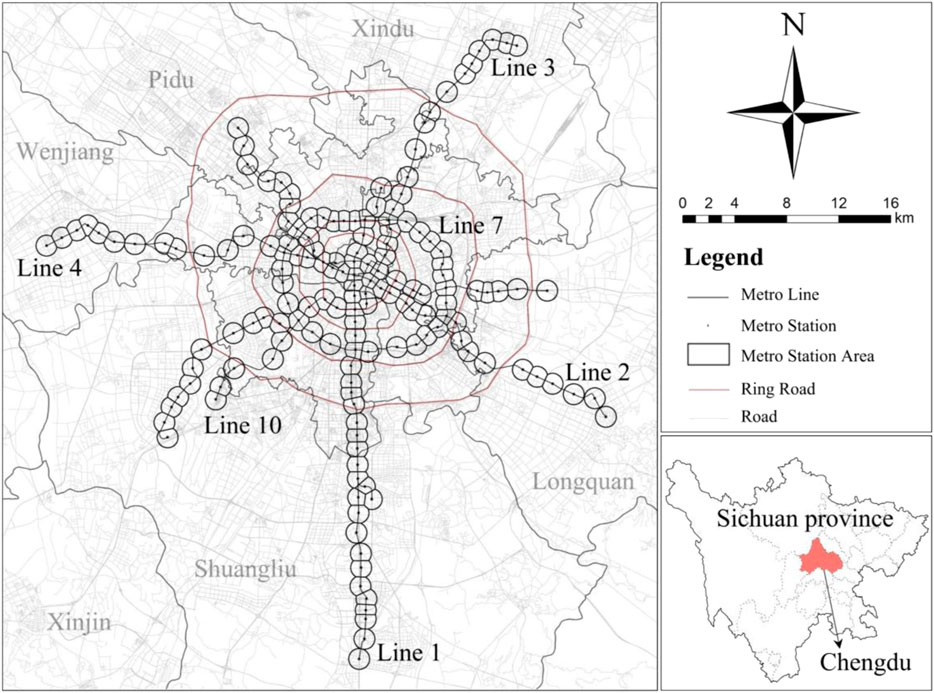
FIGURE 1. Study area of Chengdu.
3.2 Data sources
According to the definition of urban vibrancy by previous studies of Jacobs (1961) and Montgomery (1998), we consider the intensity of human activities in a certain area, or the total number of vibrant populations at different times periods through the day, as the concentrated expression of this area’s vibrancy. Mobile Signaling Data (MSD) has the advantages of large sample size, wide coverage, and real-time continuity and serves as an important data basis for travel trajectory identification and spatio-temporal behavior calculation (Shi et al., 2020). In order to ensure the continuity and smoothness of mobile phone signals, cellular networks have been recording the real-time location of users at the mobile station (MS). Therefore, the mobile phone signaling data contains information related to the cell phone base stations which are associated with the subscribers (where the location area code (LAC) is located) and also contain rich information on crowd attributes. Compared with other emerging big data such as social media, POI, and business reviews, mobile phone signaling data can continuously record people’s activity trajectories and activity time (Tu et al., 2020). Hence, the human activity information recorded by mobile phone signaling is more abundant and more accurate.
Moreover, since most of the metro stations are built underground, a large number of human activities in MSA are in the city’s underground spaces. It is worth noting that most of the big data is unable to record the pedestrian flow in underground spaces. Given that mobile operators such as China Mobile, China Unicom, and China Telecom, have built a large number of underground base stations in China’s major cities to secure mobile communication networks, the mobile signaling data not only records the MSA ground-level pedestrian flow but also the underground-level pedestrian flow. Thus, the mobile signaling data can further ensure the accuracy of the human activity intensity recorded.
For the above reasons, in this study we use mobile phone signaling data dating from 11–17 November 2019 in Chengdu as the data basis of urban vibrancy characterization. The mobile phone signaling data are obtained from DASS platform of SmartSteps, which is owned by China Unicom (one of the three major communication companies in China). We consider that the pedestrian flow which generates staying activities (leisure, consumption or employment, etc.) is the real vibrancy of the MSAs (Figure 2). Therefore, we use the time periods kept by the mobile phone signaling data to record the vibrant populations that stay within 800 m of the MSA for more than 30 min as the manifestation of urban vibrancy. Also, according to the daily routines of city residents and the operating hours of the metro system, we only record the MSA-level vibrant populations of each hour from 6:00 to 23:00. Then we divide the number of vibrant populations by the area of each MSA to obtain its density, and treat it as an indicator of urban vibrancy.

FIGURE 2. The results of the vibrant populations for 18 h at different times.
In the past few years, multi-source big data has greatly enriched the set of built environment elements and promoted the refinement and three-dimensionality of built environment indicator calculation (Li et al., 2021). For the selection of built environment indicators, we use Jacobs’ four conditions for the built environment that influence the diversity of urban activities as theory basis. Then we refer to the “5D” model of the built environment from Ewing and Cervero (2010). Finally, combined with the situations of the study area, we select six dimensions including density, diversity, pedestrian system, function, transportation accessibility, and economic attributes as the MSA-level built environment indicators. The data of the built environment in this study are mainly obtained from open online maps, mobile phone signaling data, and the official website of Chengdu Metro. The sources of indicators and data are as follows:
(1) Density: The density indicators of the MSAs are mainly measured using building footprint data (https://www.baidu.com/) and mobile phone signaling data (provided by SmartSteps). Based on these data we calculate the floor area ratio and resident population density of the MSAs respectively. In addition, we correct the resident population data using the seventh census data.
(2) Pedestrian system: We use Gaode Map (https://www.amap.com/), the structure of Chengdu metro stations(https://www.chengdurail.com), Baidu Street View (http://quanjing.baidu.com), road network data of OSM, Chengdu transport development annual report (2019), and field investigation to calculate the number of entrances/exits, road density, green view index (Yang et al., 2021c), and the overpass facilities around the MSA. These data are considered as the indicators of the MSA-level pedestrian system. The green view index is calculated by
We selected four orientations for each point. In this equation, where “VGI” is the average green view index of each point. We use the semantic segmentation method to recognize the green space in each image, and the recognition effect is shown in Figure 3.
(3) Diversity: We calculate the land-use mix (obtained from POI) of the MSAs based on the land mix calculation method of relevant research (Yue et al., 2017).
(4) Function: According to the POI data, seven categories of facilities such as density of commercial facilities, parks, restaurant facilities, financial facilities, enterprises, educational facilities, and medical facilities in the MSA are calculated separately. Then we treat these data as the function indicators.
(5) Transportation accessibility: In this work, the bus stop density of the MSA, which is calculated based on the bus stop distribution and route data provided by the map service provider, serves as the MSA-level transportation accessibility indicators.
(6) Economic attributes: Using the points of housing price data on the internet, we calculate the average housing price around MSAs and treat it as the economic attributes indicator (Yang et al., 2020b). The descriptive statistics of all indicators are shown in Table 1.
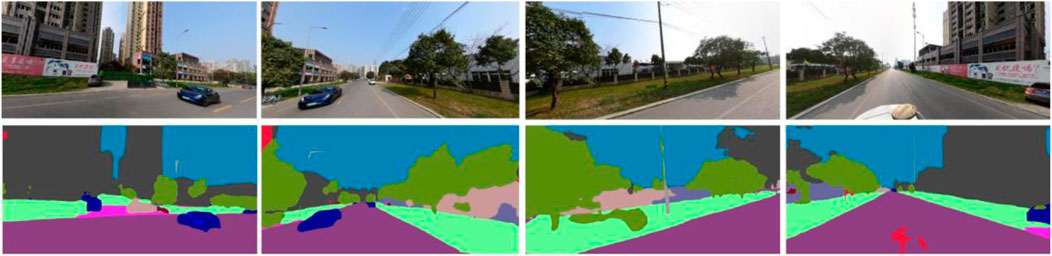
FIGURE 3. The recognition effect of green space in MSA.
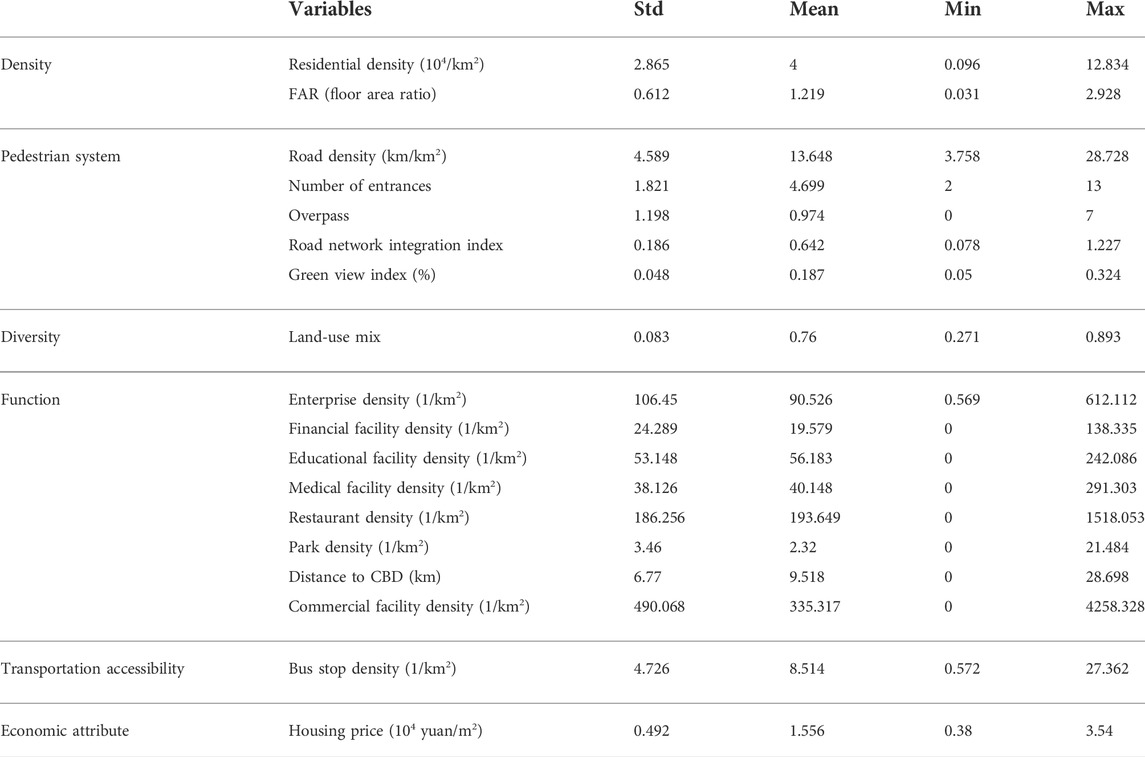
TABLE 1. Descriptive statistics.
3.3 Methodology
We use the stepwise regression method (Li et al., 2020b) to filter the 18 built environment variables. However, stepwise regression models fail to reflect the spatio-temporal non-stationarity and spatio-temporal dynamics of variables. Therefore, to reveal the spatio-temporal impact of MSA-level built environment factors on urban vibrancy, we employ the GTWR model formulating weekdays (14 independent variables) and weekends (15 independent variables) separately to investigate their effects on urban vibrancy. The overall research framework is shown in Figure 4. The GTWR model incorporates the spatio-temporal structure into the regression analysis (Huang et al., 2010), and its regression coefficients serve as the function of spatio-temporal coordinates. The coordinates of spatio-temporal location “i" are denoted as (ui, vi, ti) in the spatio-temporal coordinate system. There is strong randomness and rhythm in urban residents’ activities, so GTWR is more suitable for analyzing the impact of built environment characteristics on urban vibrancy (Chen et al., 2022c), and the model expression is
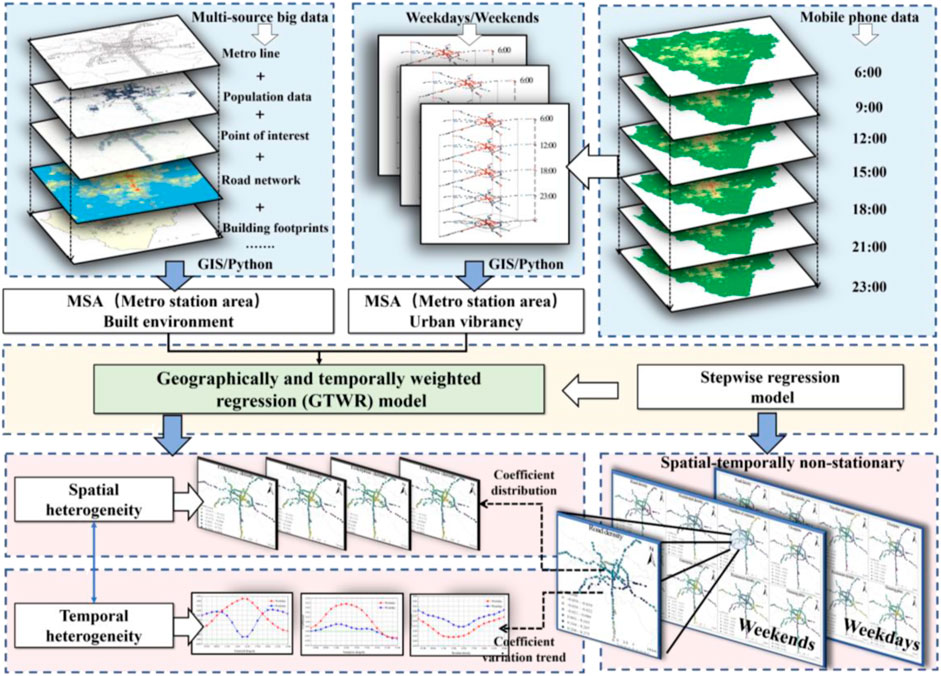
FIGURE 4. Research framework of the spatio-temporal analysis for urban MSA-level vibrancy.
Where Yi is the vibrancy (intensity of human activities) of the station i; n is the number of observations; ui is the longitude coordinate of the station i; vi is the latitude coordinate of the station i; ti is the temporal coordinate of the station i; β0 (ui, vi, ti) denotes the spatio-temporal intercept term of the station i; Xik denotes the value of the kth explanatory variable of the station i; βk (ui, vi, ti) denotes the regression coefficient of the kth explanatory variable of the station i, which serve as the function of spatio-temporal coordinates; εi is the error term.
4 Results and discussion
4.1 The spatio-temporal distribution of the metro station area-level vibrancy
Figure 5 shows the spatio-temporal distribution of the MSA-level vibrancy based on mobile phone signaling data (Yue et al., 2017). The spatio-temporal distribution of vibrancy on weekdays possesses obvious dynamic characteristics of “dispersion and agglomeration”. The most vibrant MSAs are mainly concentrated in two areas which are located within the “1st Ring Road” and in “Gaoxinnan”, reflecting the “dual-core” spatial structure of Chengdu. The stations with high vibrancy during the morning peak are mainly Xipu, Guangfu, Shenxianshu, and others. These stations are mostly surrounded by large scale of residential districts, with typical characteristics of “commuter towns”. During the afternoon and evening peak, the stations with high vibrancy are mainly Tianfu Sanjie, Century City, and Gaoxin station, which are surrounded by abundant employment facilities and commercial facilities. Stations such as Chunxi Road, Tianfu Square, and Huaxiba in the central part of the city maintain a consistently high level of vibrancy throughout the day. The main reasons for this are that these stations possess strong attractiveness and influence due to their location and comprehensive service functions. In addition, some of the stations at the southern end of the city and outside the 3rd Ring Road are generally less vibrant, possibly since these stations’ development is still in its infancy.
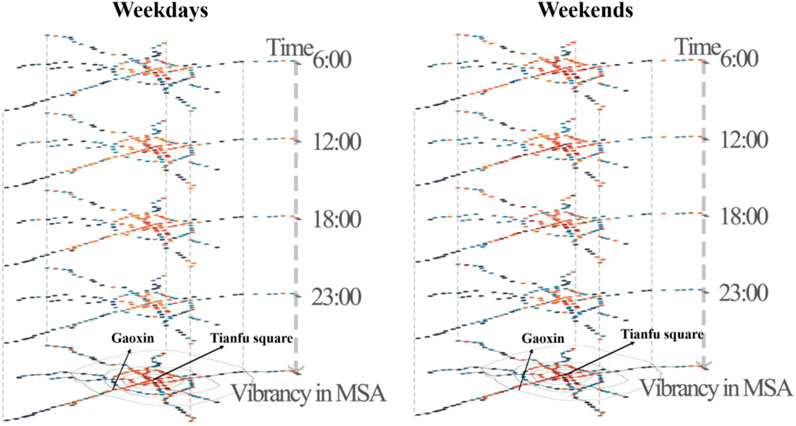
FIGURE 5. The spatio-temporal distribution of the MSA-level vibrancy.
Compared with weekdays, residents have more flexible schedule of travel and activities on weekends, and spare more time for daily leisure activities such as shopping, sports, and visiting friends. Therefore, the spatial distribution of the MSA-level vibrancy on weekends is relatively homogeneous. MSAs with high vibrancy are mainly located in the traditional central areas of the city (within the 2nd Ring Road) where commercial facilities are concentrated and transportation facilities are developed. The vibrancy around these stations shows a continuous increase from 8:00 to 14:00 and keeps at a high level from 14:00 to 23:00, which is closely related to the vibrant nightlife and thriving food culture in Chengdu. As can be seen, the distribution of the MSA-level vibrancy basically reflects the dynamic patterns of residents’ rail commuting on weekdays and consumption habits on weekends.
4.2 Results of stepwise regression and geographically temporally weighted regression model
Table 2 shows the model results of the stepwise regression and GTWR model on weekdays, and the R2 of the two models are 0.808 and 0.941, respectively. The R2 of the GTWR model is significantly higher, which indicates that the GTWR model is suitable for the spatio-temporal data structure of this study. The results of the stepwise regression method on weekdays show that density indicators (residential density) and pedestrian system indicators (road density, number of entrances, overpass, road network integration index, and green view index) are positively correlated with vibrancy. Function indicators including distance to CBD, enterprise density, financial facility density, restaurant density, and medical facility density are also positively correlated with the MSA-level vibrancy. However, housing price, bus stop density, and educational facility density are negatively correlated with the MSA-level vibrancy. Notably, the commercial facility density and park density indicators are not significantly related to vibrancy, suggesting that people traveling on weekdays are more interested in work-related facilities such as companies in MSAs, but less interested in leisure activities such as shopping and hanging out. It is believed that these findings are reasonable. The results are consistent with the research of Huang et al. (2020), Tu et al. (2022), and Xiao et al. (2021).
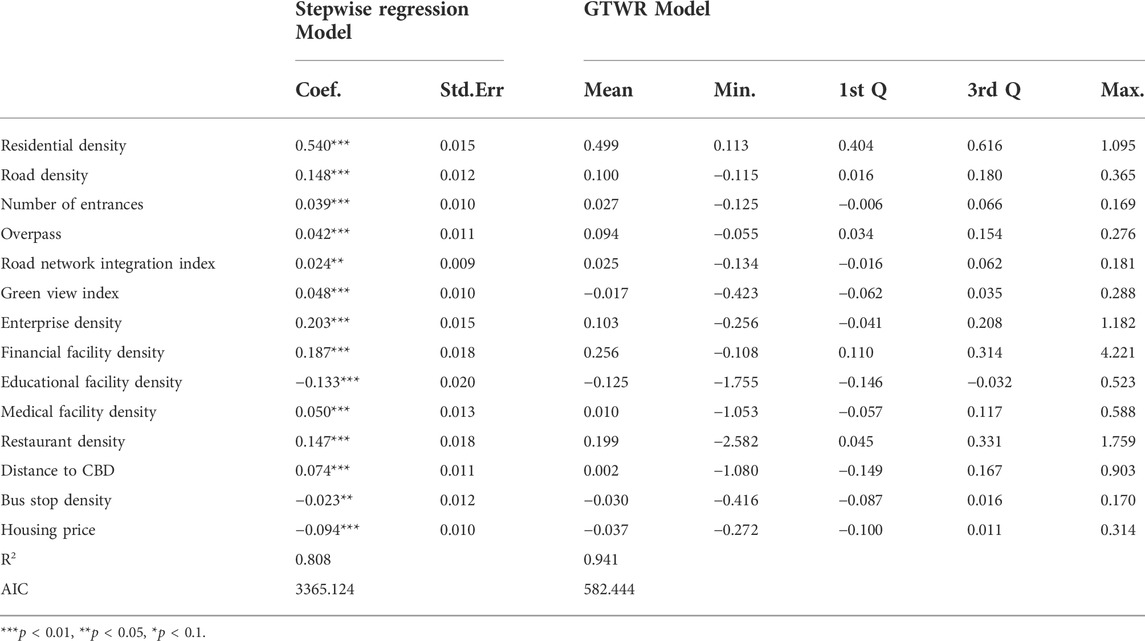
TABLE 2. Stepwise regression model and GTWR model summary results for weekdays.
Table 3 shows the model results of the stepwise regression method and GTWR model on the weekends. It can be seen that the R2 of the GTWR model (0.959) is still larger compared to the R2 of the stepwise regression model (0.852). We find that the results of the stepwise regression method are mostly relatively similar for weekdays and weekends. The difference is that both commercial facility density and park density are significantly and positively correlated with the MSA-level vibrancy on weekends. In addition, enterprise density is negatively correlated with vibrancy. This is more identical to the travel and activities routines of residents on weekends. Surprisingly, there is no significant relationship between the vibrancy and two important indicators, FAR and land-use mix, for both weekends and weekdays. The same results are obtained in the study of De Nadai et al. (2016) and Tang et al. (2018). The study of Lu et al. (2019a) based in Chengdu indicates that excessive spatial development leads to a decrease in the neighborhood vibrancy. However, in this study, we suggest that maybe the vibrancy of multiple time periods dilutes the effect of FAR and Land-use mix.
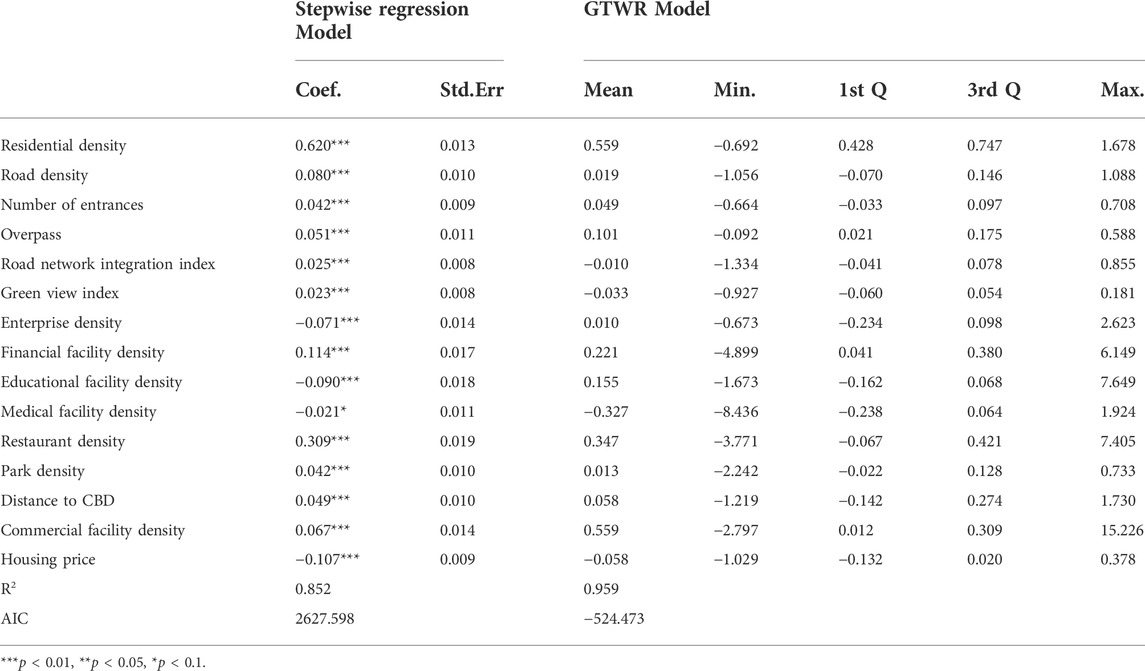
TABLE 3. Stepwise regression model and GTWR model summary results for weekends.
4.3 Analysis of the spatio-temporal variation
4.3.1 Temporal heterogeneity of average coefficients
The temporal variation trend of the influence coefficient for the MSA-level built environment indicators on vibrancy is shown in Figure 6. The red and blue lines represent variables on weekdays and weekends, respectively. It can be seen that the impact of built environment indicators on the MSA-level vibrancy has typical time-varying characteristics, and there are differences in the coefficient fluctuations between weekdays and weekends. The temporal variation of the coefficients has a strong relationship with the life patterns of Chinese urban residents (Li et al., 2019; Wang et al., 2022b). For example, we find that the coefficients generate time-varying inflection points at 9:00, 13:00, and 17:00, which are the time points for going to work, taking a lunch break, and getting off work, respectively.
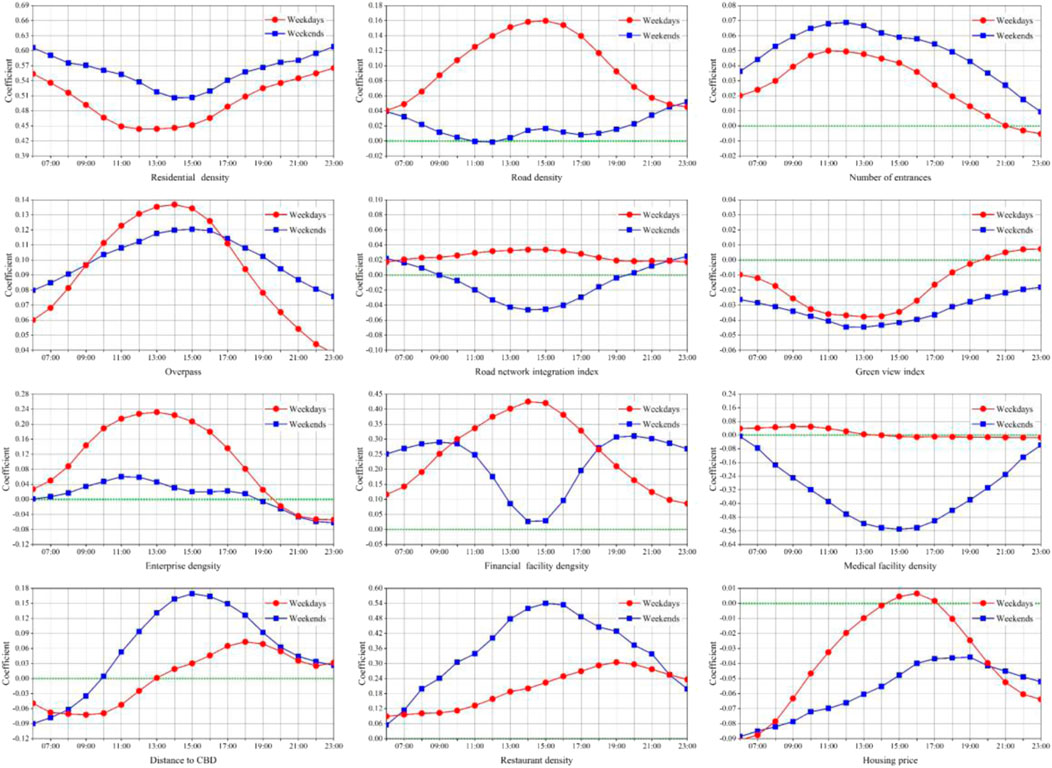
FIGURE 6. Temporal average coefficients of the built environment factors.
Firstly, residential population density possesses the largest average coefficient of all indicators (Tables 2, 3), and it has a positive influence coefficient on MSA-level vibrancy both on weekdays and weekends. A high-density residential population tends to create a scale effect and provides more social contacts, which is important for the creation of vibrancy in TOD communities. In addition, the coefficient is generally higher on weekends than on weekdays. The coefficient of residential density has a “U-shaped” characteristic, which decreases from 6:00–11:00, stays the same from 11:00–17:00, and increases after 17:00. This time pattern is significantly consistent with the “go out early and come back at dusk” travel habits of communities (Wu et al., 2018a; Huang et al., 2019). As shown in Figure 6, the separation of work and residential spaces leads to less attractive of MSAs during the daytime, despite the high accessibility provided by the TOD (Wu et al., 2018a; Li et al., 2020a).
Secondly, compared with the residential density, the variation trends of enterprise density are opposite, with a positive correlation before 19:00 and a negative correlation after 19:00. The variation trend of the coefficient on weekends basically remains flat. While, on weekdays, there is an inverted U-shaped characteristic that maintains a high coefficient value from 11:00 to 17:00. This is the time period with the highest employment population density around the TOD of the day. It can be seen that there is a certain lag in the dissipation of work-related activities in MSAs due to the “Nine-nine-six work system” (Xiao et al., 2020) working overtime culture (the usual clocking out time in China is around 17:30). The variation trends of the restaurant density coefficient are very interesting, with positive coefficient for both weekends and weekdays throughout the day. Meanwhile, the variation trend of coefficient peaks at around 16:00 on weekends and at 19:00 on weekdays, respectively. Chengdu owns a well-developed food culture and is known as the “Gastronomic Capital and City of the Night” in China. The MSAs are at core locations with high concentration of restaurants in Chengdu. Residents often choose to start lining up for dinner at around 16:00 or 17:00 on weekends due to a large number of consumers. On weekdays, the time of getting off work is usually 17:30, and those who choose to dine out usually arrive at the nearby restaurant at around 19:00.
Thirdly, in terms of pedestrian system design, the average influence coefficients of road density, number of entrances, and overpass facilities on vibrancy are positive, as is the coefficient of road network integration, on weekdays. MSA is a highly spatialized and populated neighborhood in the city, and it is also a “fast-paced area” of urban life, where people work, live, and consume with more emphasis on the efficiency of walking. Therefore, people are more focused on the spatial accessibility of the pedestrian system in MSAs. Interestingly, the coefficients of road density and integration are higher on weekdays than on weekends. Oppositely, the coefficients of the entrance number and overpass facilities are higher on weekends than on weekdays. This indicates that commuting traffic is more concerned with the plane accessibility in the MSA, while leisure and consumption traffic on weekends is more concerned with the three-dimensional accessibility of the pedestrian system. As a result, commercial complexes in MSAs generally use three-dimensional pedestrian systems to connect ground-level spaces for the introduction of pedestrian flow (Yang et al., 2021b). In the studies of Lu et al. (2019b), the positive impact of the green view index on urban vibrancy has been confirmed. In this study, however, we find that the coefficient of green view index on MSA-level vibrancy is always negative with time-varying. The possible reason is that, unlike other zones in the city, the high-density development of TOD generates the need to evacuate people quickly, and the larger volume of greenery may affect sight as well as the mobility of people to some extent. Some studies are similar to our findings: Meng and Xing (2019) pointed out that the area of ecology spaces, such as water bodies and green spaces, have a negative impact on urban vibrancy. Chen et al. (2022c) also point out that green space is not significantly related to urban vibrancy.
Fourthly, the average coefficient of housing price is negative and the negative effect of weekends is stronger than that of weekdays. The possible reason is that there exists a relationship between housing prices and floor area ratio in China’s major cities. The houses with higher prices usually have smaller floor area ratios and residential density, which means a higher quality of living space and lower population density. Also, the housing prices are higher in MSAs than in other parts of the city due to the excellent location and transportation resources. However, high housing prices are often accompanied by gentrification, which can cause the lower- and middle-income classes to relocate and thus affect the vibrancy of the community. A study by Tu et al. (2022) on TOD in Singapore reveals that high income negatively affects MSA-level vibrancy. Jia et al. (2021) also find that high housing prices have an inhibiting effect on urban vibrancy.
4.3.2 Spatial heterogeneity of average coefficients
The spatial distribution of average influence coefficients for the MSA-level built environment indicators on vibrancy is shown in Figure 7 (weekdays) and Figure 8 (weekends), respectively. Moreover, we classify the coefficients into six categories based on the natural breakpoint method (Wu et al., 2018a). In order to distinguish the positive and negative effects of the coefficients, we manually grade the values of the coefficients.
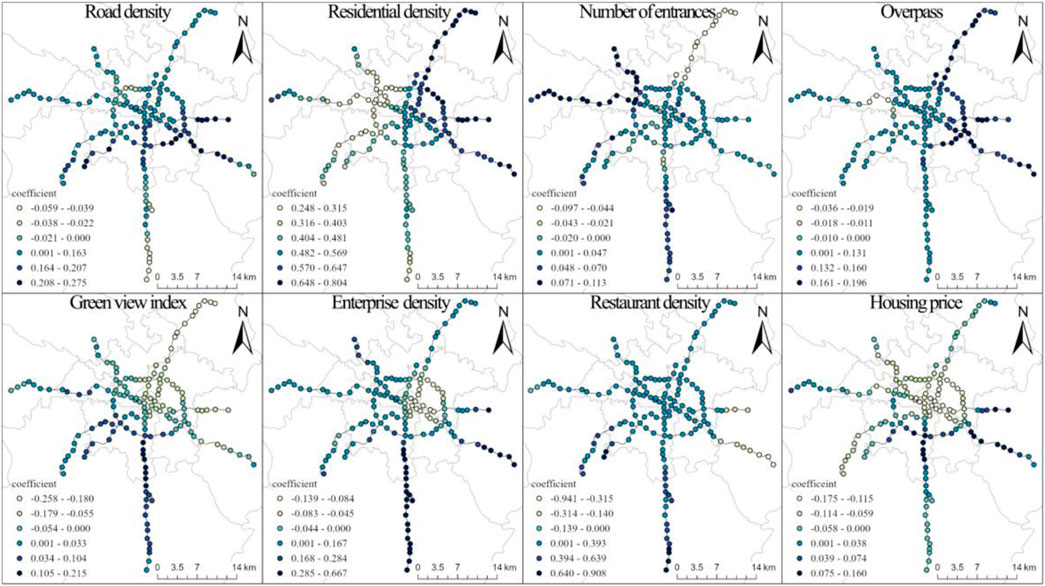
FIGURE 7. Spatial heterogeneity of average coefficients for the built environment factors on weekdays.
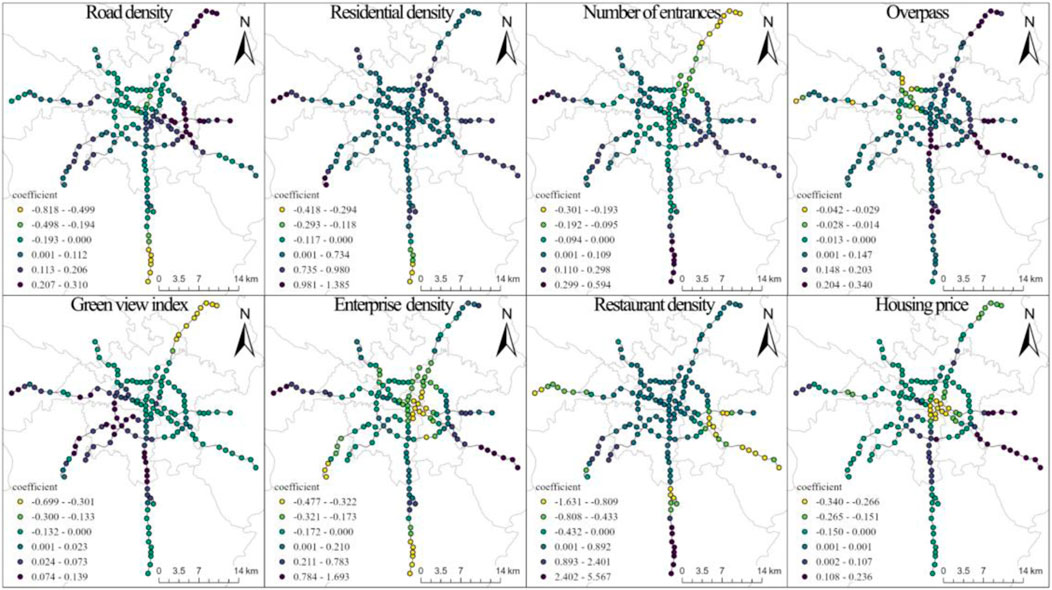
FIGURE 8. Spatial heterogeneity of average coefficients for the built environment factors on weekends.
4.3.2.1 Density
As Jacobs (1961) argues, we find that high-density development is closely related to the maintenance of urban vibrancy. The findings also show that the spatial distribution of the coefficient for the residential density on vibrancy is generally positive on both weekdays and weekends. The negative values only exist in a few undeveloped sites in the southern end of the city with relatively few residential population. Similarly, as Glaeser (2013) proposes in the “Triumph of the city”, spatial agglomeration contributes to the creation of urban vibrancy.
4.3.2.2 Pedestrian system
The spatial distribution of the coefficient for the number of entrances and overpasses is generally positive, with the highest values in areas near the “3rd Ring Road” and the expressway at the southern end of the city. The roads around MSAs in these districts are relatively wider with larger traffic flow, which is not suitable for walking. Therefore, the provision of overpass facilities and the reasonable layout of metro entrances in these areas can significantly enhance the spatial accessibility, thus meeting people’s demand for travel as well as other activities. On the contrary, the coefficients of road density at the southern end of the city, such as Science City, Xinglong Lake, and Guangzhou Road, exert a significantly negative effect on vibrancy. This may be due to the typical ring-radial city structure of Chengdu, and the road network structure here is “dense inside and sparse outside”. Furthermore, the construction of new areas in Chinese cities is usually “the road first, then the city”. Thus, the road density and the building construction around these new district sites, which are far from the city center, are at a low level and cannot attract enough people in a short time. It is worth noting that the spatial distribution of the coefficient for the green view index shows a negative correlation between the central region and the northeastern region, and the average coefficient is also negative, which is different from the previous studies (Lu et al., 2019b).
4.3.2.3 Function
The spatial distribution of the coefficient for the enterprise density is negative in the central part of the city. While the coefficient is positive in the southern part (Gaoxin and Tianfu New District) and southeastern part (Longquan) of the city. This spatially divergent feature is more obvious on weekdays. The main reason is that the development strategy of Chengdu is guiding the city to grow toward the east and south, which was enacted in the overall plan in 2016. Currently, the MSAs in the south, as well as the east of the city, are urban high-tech industrial clusters (Century City, Financial City, Tianfu Sanjie, and other sites), while the MSAs in the traditional employment centers (South Taisheng Road, Qianfeng Road, and Luomashi) are dominated by retail business and service-oriented businesses. In recent years, the vibrancy of employment clusters in urban centers has declined due to the continued impact of the burgeoning online shopping and the outward shift of high-tech industries. The spatial distribution of coefficient for restaurant density is positive in most areas on weekdays, but the coefficient on weekends shows an “inside positive and outside negative” spatial characteristic. This may be related to the difference in the demand orientation of restaurants in different locations. On the one hand, most catering service facilities in the city center are chains or well-known brands, they tend to choose these hot areas in order to attract more consumers, and generally the peak consumption periods of these restaurants occur on weekends. On the other hand, most of the catering service facilities in the urban periphery are small in scale that rely heavily on residential and employment populations, so these restaurants usually have more stable consumption during weekdays. Moreover, after comparing the spatial distribution of coefficient for the enterprise density and restaurant density on working days, we can obviously find that the spatial distribution of these two variables is basically the same in most regions, except for some sites in the central areas.
4.3.2.4 Housing price
The distribution of coefficient for housing price on the MSA-level vibrancy is also strongly spatially heterogeneous. The study by Fan and Khattak (2008) shows that higher income groups have more travel activity options. Thus, they are more likely to engage in non-work activities in the city center than in the urban periphery. However, we find the opposite result. The housing prices of MSA in the city center are negatively associated with vibrancy, both on weekdays and weekends, while the high housing prices in new areas such as Gaoxinnan have a positive impact on urban vibrancy. This is because settlements of the MSAs within the 2nd Ring Road in Chengdu have been built for a long time and there are a large number of old neighborhoods with poor environmental quality. These old neighborhoods are close to the city center and metro stations, so housing prices here are generally higher, contributing to the difficulties of urban renewal (Demolition costs are high). As a result, a large number of local people move to the suburban areas to improve their living quality, leading to the “inner city decay” (Farjam and Motlaq, 2019) and the decline of vibrancy. Conversely, new areas such as Gaoxinan are emerging as another core of Chengdu, where the government has promoted the rapid development through the TOD strategy and constructed a number of high-quality TOD communities with developed infrastructure and complete services. These areas become the new vibrant hotspots of the city. With the rapid urbanization and urban expansion in China over the past three decades, this shift of vibrant hotspots (inner city decline) has occurred in cities of many regions, including the northeast and north. Since then, urban renewal policies for inner city revitalization are being advocated in major cities.
5 Conclusion
In this study, we first use the mobile signaling data (based on staying time and mobile trajectories of cellular users) to quantify the spatio-temporal distribution of the metro station areas’ (MSA) vibrancy in Chengdu. Then, we measure the 18 built environment indicators of MSA based on Jacobs’ four conditions of vibrancy and the 5Ds built environment framework. Finally, we employ the stepwise regression model and the geographically temporal weighted regression model (GTWR) to analyze the effect that the MSA-level built environment exerts on urban vibrancy. The results show that: 1) Chengdu’s highly vibrant MSAs are concentrated in two districts: the traditional city center and the Gaoxinnan District, which are consistent with the city’s “dual core” spatial structure. 2) Density indicators (residential density), pedestrian system indicators (road density, number of entrances, overpass, road network integration index, and green view index), and function indicators (enterprise density, restaurant density) are positively associated with the MSA-level vibrancy. However, economic attributes (housing price) and transportation accessibility (bus stop density) are negatively correlated with the MSA-level vibrancy. 3) The associations between built environment factors and the MSA-level vibrancy exhibit strong spatio-temporal non-stationarity patterns. This is in line with the spatio-temporal patterns of residents’ daily work, leisure, and consumption activities in TOD communities. For example, the spatial distribution of the influence coefficients for enterprise density, housing price, and restaurant density has the characteristic of “low within the city center and high outside the city center”. The temporal variation of the influence coefficients of enterprise density and residential density embraces the symmetrical characteristics of “U-shaped” and “inverted U-shaped”, respectively. The temporal variation of the coefficients for the plane pedestrian system indicators (road density and road network integration index) and the three-dimensional indicators (overpass facilities and green view index) differ significantly between weekdays and weekends.
These findings provide theoretical support for the creation of MSA-level vibrancy. Urban planners should recognize the spatio-temporal impacts of MSA-level built environment characteristics on urban vibrancy at the micro-scale, and develop differentiated planning interventions for different types of metro stations. Based on this, we propose the following planning suggestions: First, the creation of vibrant TOD communities should not only consider the design of the built environment but also the spatio-temporal heterogeneity of its influence on vibrancy. For example, the allocation of dining service facilities needs to match the distribution of urban vibrancy and the different activity patterns (work and leisure activities) of urban residents. Secondly, appropriate neighborhood-scale and street-space design are of great importance for the enhancement of TOD vibrancy. MSA in urban peripheral areas should also be accompanied by the development of small-scale neighborhoods and complex road networks to promote sufficient spatial accessibility and attract more pedestrian flows. Thirdly, in the dense and populous MSAs of city centers, planners should establish three-dimensional pedestrian systems to connect crucial spatial nodes such as subway entrances and exits, office buildings, and commercial complexes to increase the efficiency of pedestrian flow (Yang et al., 2022b). Fourthly, this study shows that the green view index exerts a negative effect on the vibrancy of MSAs in CBD. We argue that the applicability of the ultra-high green view index in MSAs still requires further justification. Small green plants or flat green spaces (lawns, potted plants, etc.) may be more suitable for high-dense TOD neighborhoods. Considering the need for large-scale pedestrian evacuation and visual accessibility, planners may need to be cautious about the utilization of tall greenery in high-density MSAs.
The main contributions of this study are as follows: 1) providing the method that measures the urban vibrancy considering the staying time of crowd, which is oriented from human activity perspective, and analyzing the spatio-temporary distribution of MSA-level vibrancy. 2) revealing the spatio-temporary non-stationarity of the effect that the MSA-level built environment exerts on TOD vibrancy based on the plane dimension and human scale. 3) providing insights for urban planners and management departments when proceeding community plan and design of TOD.
This study has several limitations. Firstly, although the mobile phone signaling data has the advantages of wide coverage and large sample size. While, due to the different market shares of mobile operators, and the low-frequency usage of cell phones by some age groups (children and senior citizens), the study is unlikely to cover all ages. Secondly, this study only uses the mobile phone signaling data in November, while several studies have pointed out that climatic factors such as season and temperature can affect human activeness. This important factor is ignored in our study due to the difficulty of data acquisition. In this regard, the next study should add multiple months of mobile phone signaling data to explore the spatio-temporal distribution characteristics of urban vibrancy in different seasons.
Data availability statement
The original contributions presented in the study are included in the article/Supplementary Material, further inquiries can be directed to the corresponding author.
Author contributions
BY: conceptualization, funding acquisition, supervision, and writing—original draft. XC: conceptualization, funding acquisition, methodology, and writing—review and editing. HL: conceptualization, methodology, formal analysis, validation, and writing—review and editing. PL: validation and writing—review and editing. RL: formal analysis and writing—review and editing. TY: validation and writing—review and editing. All authors contributed to the article and approved the submitted version.
Funding
This study was supported by the Doctoral Innovation Fund Program of Southwest Jiaotong University (No. 2017310253) and the National Natural Science Foundation of China (No. U20A20330).
Conflict of interest
Author HL was employed by Changsha Planning and Design Institute Co., Ltd.
The remaining authors declare that the research was conducted in the absence of any commercial or financial relationships that could be construed as a potential conflict of interest.
Publisher’s note
All claims expressed in this article are solely those of the authors and do not necessarily represent those of their affiliated organizations, or those of the publisher, the editors and the reviewers. Any product that may be evaluated in this article, or claim that may be made by its manufacturer, is not guaranteed or endorsed by the publisher.
References
An, D., Tong, X., Liu, K., and Chan, E. H. (2019). Understanding the impact of built environment on metro ridership using open source in Shanghai. Cities 93, 177–187. doi:10.1016/j.cities.2019.05.013
Cervero, R., and Kockelman, K. (1997). Travel demand and the 3Ds: Density, diversity, and design. Transp. Res. part D Transp. Environ. 2 (3), 199–219. doi:10.1016/s1361-9209(97)00009-6
Chen, L., Zhao, L., Xiao, Y., and Lu, Y. (2022). Investigating the spatiotemporal pattern between the built environment and urban vibrancy using big data in Shenzhen, China. Comput. Environ. Urban Syst. 95, 101827. doi:10.1016/j.compenvurbsys.2022.101827
Chen, S., Bao, Z., and Lou, V. (2022). Assessing the impact of the built environment on healthy aging: A gender-oriented Hong Kong study. Environ. Impact Assess. Rev. 95, 106812. doi:10.1016/j.eiar.2022.106812
Chen, S., Wang, T., Bao, Z., and Lou, V. (2022). A path analysis of the effect of neighborhood built environment on public health of older adults: A Hong Kong study. Front. Public Health 10, 861836. doi:10.3389/fpubh.2022.861836
Choi, J., Lee, Y. J., Kim, T., and Sohn, K. (2012). An analysis of Metro ridership at the station-to-station level in Seoul. Transportation 39 (3), 705–722. doi:10.1007/s11116-011-9368-3
M. De Nadai, J. Staiano, R. Larcher, N. Sebe, D. Quercia, and B. Lepri (Editors) (2016). “The death and life of great Italian cities: A mobile phone data perspective,” in Proceedings of the 25th international conference on world wide web (Québec, Canada: Montréal).
Ding, C., Cao, X., and Liu, C. (2019). How does the station-area built environment influence metrorail ridership? Using gradient boosting decision trees to identify non-linear thresholds. J. Transp. Geogr. 77, 70–78. doi:10.1016/j.jtrangeo.2019.04.011
Dougal, C., Parsons, C. A., and Titman, S. (2015). Urban vibrancy and corporate growth. J. Finance 70 (1), 163–210. doi:10.1111/jofi.12215
Ewing, R., and Cervero, R. (2010). Travel and the built environment: A meta-analysis. J. Am. Plan. Assoc. 76 (3), 265–294. doi:10.1080/01944361003766766
Fan, Y., and Khattak, A. J. (2008). Urban form, individual spatial footprints, and travel: Examination of space-use behavior. Transp. Res. Rec. 2082 (1), 98–106. doi:10.3141/2082-12
Farjam, R., and Motlaq, S. M. H. (2019). Does urban mixed use development approach explain spatial analysis of inner city decay? J. Urban Manag. 8 (2), 245–260. doi:10.1016/j.jum.2019.01.003
Gehl, J. (2011). Life between buildings: Using public space. Washington, Covelo, London: Island PressGehl J.
Glaeser, E. L. (2013). Triumph of the city: How our greatest invention makes us richer, smarter, greener, healthier, and happier (an excerpt)(translated by innа kushnareva). J. Econ. Sociol. 14 (4), 75–94. doi:10.17323/1726-3247-2013-4-75-94
Gómez-Varo, I., Delclòs-Alió, X., and Jane Jacobs reloaded, Miralles-Guasch C. (2022). Jane Jacobs reloaded: A contemporary operationalization of urban vitality in a district in barcelona. Cities 123, 103565. doi:10.1016/j.cities.2022.103565
Harvey, L. (2001). Defining and measuring employability. Qual. High. Educ. 7 (2), 97–109. doi:10.1080/13538320120059990
Hillier, B., Hanson, J., and Graham, H. (1987). Ideas are in things: An application of the space syntax method to discovering house genotypes. Environ. Plann. B 14 (4), 363–385. doi:10.1068/b140363
Huang, B., Wu, B., and Barry, M. (2010). Geographically and temporally weighted regression for modeling spatio-temporal variation in house prices. Int. J. Geogr. Inf. Sci. 24 (3), 383–401. doi:10.1080/13658810802672469
Huang, B., Zhou, Y., Li, Z., Song, Y., Cai, J., and Tu, W. (2020). Evaluating and characterizing urban vibrancy using spatial big data: Shanghai as a case study. Environ. Plan. B Urban Anal. City Sci. 47 (9), 1543–1559. doi:10.1177/2399808319828730
Huang, J., Levinson, D., Wang, J., and Jin, H. (2019). Job-worker spatial dynamics in Beijing: Insights from smart card data. Cities 86, 83–93. doi:10.1016/j.cities.2018.11.021
Ibraeva, A., de Almeida Correia, G. H., Silva, C., and Antunes, A. P. (2020). Transit-oriented development: A review of research achievements and challenges. Transp. Res. Part A Policy Pract. 132, 110–130. doi:10.1016/j.tra.2019.10.018
Jacobs-Crisioni, C., Rietveld, P., Koomen, E., and Tranos, E. (2014). Evaluating the impact of land-use density and mix on spatiotemporal urban activity patterns: An exploratory study using mobile phone data. Environ. Plan. A 46 (11), 2769–2785. doi:10.1068/a130309p
Jia, C., Liu, Y., Du, Y., Huang, J., and Fei, T. (2021). Evaluation of urban vibrancy and its relationship with the economic landscape: A case study of beijing. ISPRS Int. J. Geoinf. 10 (2), 72. doi:10.3390/ijgi10020072
Kim, Y-L. (2018). Seoul's Wi-Fi hotspots: Wi-Fi access points as an indicator of urban vitality. Comput. Environ. Urban Syst. 72, 13–24. doi:10.1016/j.compenvurbsys.2018.06.004
Kostof, S. (1991). The city shaped: Urban patterns and meanings through history. New York: Thames & Hudson, P52.
Li, J., Li, J., Yuan, Y., and Li, G. (2019). Spatiotemporal distribution characteristics and mechanism analysis of urban population density: A case of xi'an, shaanxi, China. Cities 86, 62–70. doi:10.1016/j.cities.2018.12.008
Li, M., Liu, J., Lin, Y., Xiao, L., and Zhou, J. (2021). Revitalizing historic districts: Identifying built environment predictors for street vibrancy based on urban sensor data. Cities 117, 103305. doi:10.1016/j.cities.2021.103305
Li, S., Lyu, D., Huang, G., Zhang, X., Gao, F., Chen, Y., et al. (2020). Spatially varying impacts of built environment factors on rail transit ridership at station level: A case study in Guangzhou, China. J. Transp. Geogr. 82, 102631. doi:10.1016/j.jtrangeo.2019.102631
Li, S., Lyu, D., Liu, X., Tan, Z., Gao, F., Huang, G., et al. (2020). The varying patterns of rail transit ridership and their relationships with fine-scale built environment factors: Big data analytics from Guangzhou. Cities 99, 102580. doi:10.1016/j.cities.2019.102580
Li, X., Li, Y., Jia, T., Zhou, L., and Hijazi, I. H. (2022). The six dimensions of built environment on urban vitality: Fusion evidence from multi-source data. Cities 121, 103482. doi:10.1016/j.cities.2021.103482
Long, Y., and Huang, C. (2019). Does block size matter? The impact of urban design on economic vitality for Chinese cities. Environ. Plan. B Urban Anal. City Sci. 46 (3), 406–422. doi:10.1177/2399808317715640
Loo, B. P., Chen, C., and Chan, E. T. (2010). Rail-based transit-oriented development: Lessons from New York city and Hong Kong. Landsc. urban Plan. 97 (3), 202–212. doi:10.1016/j.landurbplan.2010.06.002
Lu, S., Huang, Y., Shi, C., and Yang, X. (2019). Exploring the associations between urban form and neighborhood vibrancy: A case study of Chengdu, China. ISPRS Int. J. Geoinf. 8 (4), 165. doi:10.3390/ijgi8040165
Lu, Y., Yang, Y., Sun, G., and Gou, Z. (2019). Associations between overhead-view and eye-level urban greenness and cycling behaviors. Cities 88, 10–18. doi:10.1016/j.cities.2019.01.003
Mehta, V. (2007). Lively streets: Determining environmental characteristics to support social behavior. J. Plan. Educ. Res. 27 (2), 165–187. doi:10.1177/0739456x07307947
Meng, Y., and Xing, H. (2019). Exploring the relationship between landscape characteristics and urban vibrancy: A case study using morphology and review data. Cities 95, 102389. doi:10.1016/j.cities.2019.102389
Montgomery, J. (1998). Making a city: Urbanity, vitality and urban design. J. urban Des. 3 (1), 93–116. doi:10.1080/13574809808724418
Niu, N., Li, L., Li, X., and He, J. (2022). The structural dimensions and community vibrancy: An exploratory analysis in Guangzhou, China. Cities 127, 103771. doi:10.1016/j.cities.2022.103771
Peng, Y., Liu, J., Zhang, T., and Li, X. (2021). The relationship between urban population density distribution and land use in Guangzhou, China: A spatial spillover perspective. Int. J. Environ. Res. Public Health 18 (22), 12160. doi:10.3390/ijerph182212160
Qiang, D., Zhang, L., and Huang, X. (2022). Quantitative evaluation of TOD performance based on multi-source data: A case study of Shanghai. Front. Public Health 10, 820694. doi:10.3389/fpubh.2022.820694
Ravenscroft, N. (2000). The vitality and viability of town centres. Urban Stud. 37 (13), 2533–2549. doi:10.1080/00420980020080681
Shao, Q., Zhang, W., Cao, X., Yang, J., and Yin, J. (2020). Threshold and moderating effects of land use on metro ridership in Shenzhen: Implications for TOD planning. J. Transp. Geogr. 89, 102878. doi:10.1016/j.jtrangeo.2020.102878
Shi, Y., Yang, J., and Shen, P. (2020). Revealing the correlation between population density and the spatial distribution of urban public service facilities with mobile phone data. ISPRS Int. J. Geoinf. 9 (1), 38. doi:10.3390/ijgi9010038
Simmel, G. (2012). The metropolis and mental life. The urban sociology reader. London: Routledge, 37
Sulis, P., Manley, E., Zhong, C., and Batty, M. (2018). Using mobility data as proxy for measuring urban vitality. J. Spatial Inf. Sci. 16, 137–162. doi:10.5311/josis.2018.16.384
Sun, Z., Allan, A., Zou, X., and Scrafton, D. (2022). Scientometric analysis and mapping of transit-oriented development studies. Plan. Pract. Res. 37 (1), 35–60. doi:10.1080/02697459.2021.1920724
Tang, L., Lin, Y., Li, S., Li, S., Li, J., Ren, F., et al. (2018). Exploring the influence of urban form on urban vibrancy in shenzhen based on mobile phone data. Sustainability 10 (12), 4565. doi:10.3390/su10124565
Taylor, B. D., and Morris, E. A. (2015). Public transportation objectives and rider demographics: Are transit’s priorities poor public policy? Transportation 42 (2), 347–367. doi:10.1007/s11116-014-9547-0
Tu, W., Zhu, T., Xia, J., Zhou, Y., Lai, Y., Jiang, J., et al. (2020). Portraying the spatial dynamics of urban vibrancy using multisource urban big data. Comput. Environ. Urban Syst. 80, 101428. doi:10.1016/j.compenvurbsys.2019.101428
Tu, W., Zhu, T., Zhong, C., Zhang, X., Xu, Y., and Li, Q. (2022). Exploring metro vibrancy and its relationship with built environment: A cross-city comparison using multi-source urban data. Geo-spatial Inf. Sci. 25, 182–196. doi:10.1080/10095020.2021.1996212
Wang, B., Lei, Y., Xue, D., Liu, J., and Wei, C. (2022). Elaborating spatiotemporal associations between the built environment and urban vibrancy: A case of Guangzhou city, China. Chin. Geogr. Sci. 32, 480–492. doi:10.1007/s11769-022-1272-6
Wang, X., Zhang, Y., Yu, D., Qi, J., and Li, S. (2022). Investigating the spatiotemporal pattern of urban vibrancy and its determinants: Spatial big data analyses in Beijing, China. Land Use Policy 119, 106162. doi:10.1016/j.landusepol.2022.106162
Wu, C., Ye, X., Ren, F., and Du, Q. (2018). Check-in behaviour and spatio-temporal vibrancy: An exploratory analysis in Shenzhen, China. Cities 77, 104–116. doi:10.1016/j.cities.2018.01.017
Wu, C., Zhao, M., and Ye, Y. (2022). Measuring urban nighttime vitality and its relationship with urban spatial structure: A data-driven approach. Environ. Plan. B Urban Anal. City Sci., 239980832211081. doi:10.1177/23998083221108191
Wu, J., Ta, N., Song, Y., Lin, J., and Chai, Y. (2018). Urban form breeds neighborhood vibrancy: A case study using a GPS-based activity survey in suburban beijing. Cities 74, 100–108. doi:10.1016/j.cities.2017.11.008
Xia, C., Yeh, A. G-O., and Zhang, A. (2020). Analyzing spatial relationships between urban land use intensity and urban vitality at street block level: A case study of five Chinese megacities. Landsc. Urban Plan. 193, 103669. doi:10.1016/j.landurbplan.2019.103669
Xiao, C., Silva, E. A., and Zhang, C. (2020). Nine-nine-six work system and people’s movement patterns: Using big data sets to analyse overtime working in Shanghai. Land Use Policy 90, 104340. doi:10.1016/j.landusepol.2019.104340
Xiao, L., Lo, S., Liu, J., Zhou, J., and Li, Q. (2021). Nonlinear and synergistic effects of TOD on urban vibrancy: Applying local explanations for gradient boosting decision tree. Sustain. Cities Soc. 72, 103063. doi:10.1016/j.scs.2021.103063
Xu, Y., and Chen, X. (2021). Quantitative analysis of spatial vitality and spatial characteristics of urban underground space (UUS) in metro area. Tunn. Undergr. Space Technol. 111, 103875. doi:10.1016/j.tust.2021.103875
Yang, H., Xu, T., Chen, D., Yang, H., and Pu, L. (2020). Direct modeling of subway ridership at the station level: A study based on mixed geographically weighted regression. Can. J. Civ. Eng. 47 (5), 534–545. doi:10.1139/cjce-2018-0727
Yang, J., Cao, J., and Zhou, Y. (2021). Elaborating non-linear associations and synergies of subway access and land uses with urban vitality in Shenzhen. Transp. Res. Part A Policy Pract. 144, 74–88. doi:10.1016/j.tra.2020.11.014
Yang, L., Ao, Y., Ke, J., Lu, Y., and Liang, Y. (2021). To walk or not to walk? Examining non-linear effects of streetscape greenery on walking propensity of older adults. J. Transp. Geogr. 94, 103099. doi:10.1016/j.jtrangeo.2021.103099
Yang, L., Chau, K., Szeto, W., Cui, X., and Wang, X. (2020). Accessibility to transit, by transit, and property prices: Spatially varying relationships. Transp. Res. Part D Transp. Environ. 85, 102387. doi:10.1016/j.trd.2020.102387
Yang, L., Liang, Y., He, B., Lu, Y., and Gou, Z. (2022). COVID-19 effects on property markets: The pandemic decreases the implicit price of metro accessibility. Tunn. Undergr. Space Technol. 125, 104528. doi:10.1016/j.tust.2022.104528
Yang, L., Liu, J., Liang, Y., Lu, Y., and Yang, H. (2021). Spatially varying effects of street greenery on walking time of older adults. ISPRS Int. J. Geoinf. 10 (9), 596. doi:10.3390/ijgi10090596
Yang, L., Tang, X., Yang, H., Meng, F., and Liu, J. (2022). Using a system of equations to assess the determinants of the walking behavior of older adults. Trans. GIS 26 (3), 1339–1354. doi:10.1111/tgis.12916
Ye, Y., Li, D., and Liu, X. (2018). How block density and typology affect urban vitality: An exploratory analysis in Shenzhen, China. Urban Geogr. 39 (4), 631–652. doi:10.1080/02723638.2017.1381536
Yue, Y., Zhuang, Y., Yeh, A. G., Xie, J-Y., Ma, C-L., and Li, Q-Q. (2017). Measurements of POI-based mixed use and their relationships with neighbourhood vibrancy. Int. J. Geogr. Inf. Sci. 31 (4), 658–675. doi:10.1080/13658816.2016.1220561
Zhang, A., Li, W., Wu, J., Lin, J., Chu, J., and Xia, C. (2021). How can the urban landscape affect urban vitality at the street block level? A case study of 15 metropolises in China. Environ. Plan. B Urban Anal. City Sci. 48 (5), 1245–1262. doi:10.1177/2399808320924425
Keywords: spatial-temporally non-stationary, built environment, urban vibrancy, TOD, GTWR, Chengdu, mobile phone signaling data
Citation: Yu B, Cui X, Li H, Luo P, Liu R and Yang T (2022) TOD and vibrancy: The spatio-temporal impacts of the built environment on vibrancy. Front. Environ. Sci. 10:1009094. doi: 10.3389/fenvs.2022.1009094
Received: 01 August 2022; Accepted: 29 August 2022;
Published: 29 September 2022.
Edited by:
Jun Yang, Northeastern University, ChinaReviewed by:
John Renne, Florida Atlantic University, United StatesYang Chen, The University of Hong Kong, Hong Kong SAR, China
Yu Ye, Tongji University, China
Copyright © 2022 Yu, Cui, Li, Luo, Liu and Yang. This is an open-access article distributed under the terms of the Creative Commons Attribution License (CC BY). The use, distribution or reproduction in other forums is permitted, provided the original author(s) and the copyright owner(s) are credited and that the original publication in this journal is cited, in accordance with accepted academic practice. No use, distribution or reproduction is permitted which does not comply with these terms.
*Correspondence: Xu Cui, Y3VpeHVAaG9tZS5zd2p0dS5lZHUuY24=