 Ning Yuan1
 Yuqing Feng2,3,4*
 Sihai Liang1*
 Guangjun Wang5Tao Yin1Dezhao Yan6Pan Wu7Xingxing Kuang2Li Wan1
- 1School of Water Resources and Environment, China University of Geosciences (Beijing), Beijing, China
- 2School of Environmental Science and Engineering, Southern University of Science and Technology, Shenzhen, China
- 3Hebei Province Collaborative Innovation Center for Sustainable Utilization of Water Resources and Optimization of Industrial Structure, School of Water Resources and Environment, Hebei GEO University, Shijiazhuang, China
- 4Hebei Province Key Laboratory of Sustained Utilization and Development of Water Resources, School of Water Resources and Environment, Hebei GEO University, Shijiazhuang, China
- 5School of Land Science and Technology, China University of Geosciences (Beijing), Beijing, China
- 6Institute of Tibetan Plateau Research, Chinese Academy of Sciences, Beijing, China
- 7Wuhan Center of China Geological Survey, Wuhan, China
Due to climate change, drought has caused serious impacts on the eco-environment, hydrology and agriculture, and drought events in the Qinghai-Tibet Plateau (QTP) have become more severer and frequent; therefore, understanding the characteristics and variations of drought is crucial to reduce its eco-environmental and socio-economic impacts. This study used the Standardized Precipitation Evapotranspiration Index (SPEI) to identify drought and assessed its interannual changes from 1980 to 2020. Then, the Hurst exponent and intensity analysis were used to identify future drought trend and the characteristics of drought intensity. Moreover, Empirical Orthogonal Function (EOF) analysis was performed to examine the main spatial gathering characteristics. The results indicate that: 1) the QTP was becoming wetter in general, and drying places were mainly distributed in the southeast and northeast of the QTP, as well as the Qaidam Basin accounting for 27% areas of QTP. 2) The trend of wet and dry in the future in most regions would be the same as the present, only 10% of the regions would have the reverse trend. 3) The rate of wet/drought changes was faster in the 1980s and 2000s. 4) The EOF mode1 revealed a gathering distribution structure with negative values in the southeast and east of the QTP and positive values in the center and west. The west was more sensitive to the variation of dry and wet, and most areas will continue to be wet in the future. EOF mode2 and mode3 mainly indicated opposite gathering patterns of southwest-northeast and south-north. The results provide favorable evidence for policymakers to better understand and prevent drought.
1 Introduction
Few extreme events can lead to more tremendous damage than drought (Dai, 2011). Drought can lead to serious negative impacts on water resources, agricultural production, environments, and ecosystems (Potop et al., 2014). Though the number of drought disasters amounts to only 5% of the total disasters, the loss can reach 30% of the loss resulting from all natural disasters (Wang et al., 2014). Drought brings the world about 221 billion dollars loss annually for the past 60 years (Tong et al., 2018). The number and duration of drought events would increase in the future (Blunden et al., 2011), and dryland will occupy 50% of the world’s land area before the end of the 21st century (Huang et al., 2016). So it is essential to accurately understand and identify the characteristics and variations of drought to provide an early warning for decision-making groups (Hayes et al., 2011).
Generally, there are four categories of drought: meteorological drought, hydrological drought, agricultural drought, and socio-economic drought (Mishra and Singh, 2010). Many indices have been developed to characterize different categories of drought, such as the Palmer Drought Severity Index (PDSI) (Palmer, 1965), Standardized Precipitation Evapotranspiration Index (SPEI) (Vicente-Serrano et al., 2010), Standardized Precipitation Index (SPI) (McKee et al., 1993), Surface Water Supply Index (SWSI) (Mishra and Singh, 2010), and Standardized Runoff Index (SRI) (Shukla and Wood, 2008). Meteorological drought is usually the first step in drought occurrence and also contributes to the occurrence of the other three drought categories (Eslamian et al., 2017). After considering the applicability of the meteorological drought index, SPEI is chosen to identify drought in this paper. It combines the advantages of PDSI sensitivity to potential evapotranspiration (PET) as well as takes into account the advantages of the SPI multi-time scale (Yu et al., 2014).
The Qinghai-Tibet Plateau (QTP), known as the primary water source for Asia, provides more than two billion people with water directly and indirectly (Rangwala and Miller, 2012). The QTP is sensitive and vulnerable to climate change, which will have a significant influence on the surrounding regions and the worldwide climate (Kang et al., 2010). Due to climate warming (You et al., 2021), drought is particularly prevalent in the QTP, affecting vegetation carbon uptake (Ye et al., 2020), growth (Liu et al., 2019a), and further aggravating water stress (Li et al., 2019). At the same time, the drought had a serious impact on some basins, approximately 29 drought events occurred in the Yangtze River Basin from 1979 to 2012 (Zhang et al., 2016), and the long-term average drought in the Yellow River Basin lasted nearly 5.8 months from 1953 to 2012 (Huang et al., 2015). Moreover, the discharge of rivers that originate in the QTP shrunk drastically due to drought (Wang et al., 2011). Since 1960, the Yellow River discharge has dropped to zero 3 times, and the longest duration recorded is 226 days (Liang et al., 2010). The Yangtze River Basin experienced the severest drought in the spring of 2011, and the rainfall is at the lowest level since 1961 (Lu et al., 2014). Therefore, studying the long-term drought development in the QTP is important to understand the causes and characteristics of drought better, guide the decision-making departments to monitor and analyze drought, and prevent local agriculture and animal husbandry from drought disasters.
In recent decades, drought indices are beginning to be used to identify and analyze the drought characteristics in the QTP. A study based on the SPEI found that drought intensity occurred more seriously before the 1990s in the QTP, then the degree of drought trended to ease, and the evolution of drought had noticeable interdecadal differences after 1997 (Liang et al., 2018). During the growth season, though the northeastern and southern parts experienced a significant wetting trend, the eastern fringe of the QTP tended to be dry, and this trend will continue (Zhang et al., 2019). The altitude dependence of drought characteristics was investigated based on SPEI and 4,000 m a. s. l was determined as the dividing line, the higher the altitude, the greater the changing trend (Feng et al., 2020). However, the spatial gathering characteristics of drought resulting from climate change are still unclear in the QTP, particularly in the conditions of the complex topography, environments, and lack of observational meteorological data.
In this study, the 12-month-scale SPEI over 41 years from 1980 to 2020 was used to identify the specific spatial gathering characteristics of the QTP. The objectives of this paper are: 1) to depict the changing trend of drought; 2) to predict the future change trend of drought; 3) to analyze the rate and intensity of drought transformation in each time interval and 4) to detect the spatial gathering characteristics of drought.
2 Materials and methods
2.1 Study area and data
The QTP, referred to as the “Asian water tower” and “The Third Pole,” is located in western China and covers an area of 2.5 million square kilometers (Immerzeel et al., 2010). The QTP is from 300 km to 1,500 km wide from 24°37′27″N to 41°09′13″N, and 2,800 km long from 73°18′52″E to 106°19′30″E, with an average altitude of above 4,000 m a. s. l. The plateau suffers from strong solar radiation, low temperature, and air pressure, as well as distinct seasonal and spatial precipitation heterogeneity due to its unique geographic location and large-scale terrain (Yao et al., 2012). The annual mean temperature varies between −2.2 and 0°C, and the annual mean precipitation ranges from over 1,000 mm in the southeast to less than 50 mm in the northwest. Precipitation between June and September contributes to more than 60%–90% of total yearly precipitation (Kuang and Jiao, 2016), and the mean annual potential evapotranspiration and evapotranspiration are approximately 940 mm and 380 mm, respectively (Chen et al., 2013; Feng et al., 2021). The QTP is the headwaters of many prominent rivers in Asia (Sun et al., 2021) (Figure 1). Glaciers and permafrost are widely distributed on the plateau, as well as alpine meadow and alpine grassland (Feng et al., 2019).
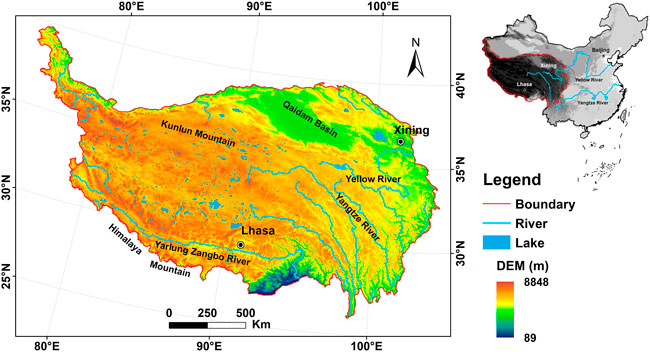
FIGURE 1. Location and elevation of Qinghai-Tibet Plateau.
This study focuses on the meteorological drought in the QTP. In order to fully understand the spatial and temporal characteristics of drought, long-term datasets related to precipitation and potential evapotranspiration are fundamental. However, there are insufficient meteorological stations covering QTP characterized by complex topography and harsh climate, so the grid datasets of potential evapotranspiration (PET), precipitation, and temperature derived from the European Centre for Medium-Range Weather Forecasts (ECMWF) were served as substitutes of station observations (Zhou et al., 2021). ERA5 is the fifth generation of the ECMWF reanalysis for the global climate and weather (https://cds.climate.copernicus.eu/cdsapp#!/home). The datasets cover the period from 1980 to 2020, and the temporal coverage is 1 month, while the spatial resolution is 0.25°× 0.25° for each pixel. We used the boundary of the QTP to extract the raster of potential evapotranspiration, temperature, and precipitation and then conduct the following post-processing.
2.2 Methods
2.2.1 SPEI calculation
SPEI is an ideal indicator to monitor drought, its principle is that the drought in a region can be aggregated by the deviation of the difference between precipitation and PET from the average state (Lu et al., 2019; Hu et al., 2021). The calculation process please refer to Vicente-Serrano et al. (2010) for details. In this study, 12 months scale of SPEI was computed as the SPEI-annual, and the drought classification based on the SPEI value is shown in Supplementary Table S1.
2.2.2 Trend analysis
Sen’s slope and Mann-Kendall trend test are employed to examine the trend of drought. Sen. slope estimation is a non-parametric trend slope calculation method, which is not affected by the singular values of a series and can well reflect the degree of change trend of the time series. Mann-Kendall trend test is a nonparametric test to assess the trend of climate and hydrological factors of a time series, using the statistic Z to check the significance of the changing trend (Gocic and Trajkovic, 2013).
2.2.3 Hurst exponent
The Hurst exponent serves as a practical statistical tool to predict the time series persistence. The rescaled range (R/S) analysis has been used by many studies to calculate the Hurst exponent, and the calculation steps are as follows (Tong et al., 2018):
Firstly, the time series of SPEI {Xi} (i = 1, 2, 3, … , n) is grouped into a number of sub-series and then calculate the average value.
The cumulative deviation is calculated by
The range of each sub-series is computed by
The standard deviation series is given as
Finally, we calculate the rescaled range R/S
The value of H is in the range of 0–1. The value in the range of 0–0.5 means that there is anti-persistence in the time series, 0.5-1 indicates long-term memory, and H = 0.5 is an independent process (García and Requena, 2019).
2.2.4 Intensity analysis
The intensity analysis was initially applied to the analysis of land use and land cover change (Huang et al., 2012), then it was used as an effective method to analyze drought characteristics (Wang et al., 2019a). Intensity analysis can account for the change in interval, category, and conversion level. Interval intensity is used to analyze the change rate and identify whether the change rate is fast or not at a certain time interval, and category intensity can determine the state of category change, namely relatively active or dormant, while transition intensity is to determine which one is in the dominant position in the transition during the time interval (Abdullah and Nakagoshi, 2006; Aldwaik and Pontius, 2012). The equations related to intensity analysis are shown in Supplementary Table S2.
2.2.5 Empirical Orthogonal Function
EOF is one of the most widely used tools in meteorological research (Dai et al., 2004), and it aims to convey as much information provided by raw data as possible with fewer independent variables. EOF reduces the dimensionality of a large amount of raw data to obtain the dominant spatial pattern and temporal coefficients (Wang et al., 2019b). The significant test was conducted to determine whether the decomposed eigenvectors are physically meaningful (North et al., 1982).
3 Results
3.1 Spatial and temporal changes in drought
Figure 2 shows the annual spatial change trend of drought distribution characterized by SPEI from 1980 to 2020. About 73% of the areas showed an increasing trend, suggesting that a majority of the areas were becoming wetter, especially in the western and southwest regions. Only 27% of the areas were prone to drying, and it was mainly distributed in the southeast and northeast of the QTP, as well as the Qaidam Basin. The areas with the significant trend all passed the 95% significance test.
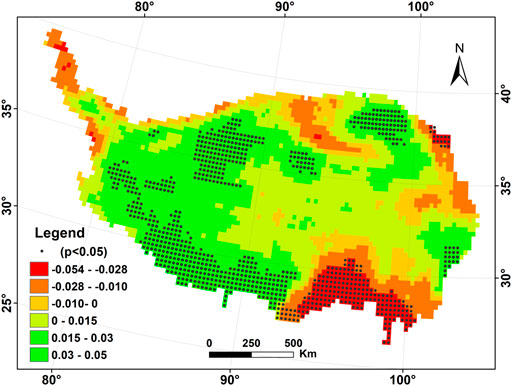
FIGURE 2. Spatial distribution of trend in annual SPEI. (·means that 95% of the significance test has passed).
3.2 Persistence analysis of drought
Figure 3 shows the Hurst exponent from 1980 to 2020. In general, 90% areas of the QTP had the value of Hurst exponent between 0.5 and 1.0, indicating that the current state would have a persistent trend in the future, and was primarily distributed in the west and the south of the QTP (Figure 3A). In the remaining 10% of the area with the Hurst exponent less than 0.5, the current state would be reversed. Combining the trend analysis of SPEI (Figure 2) and Hurst exponent, 65% areas of the QTP would continue to be wet in the future. The wetting trend would be distributed in the western regions and some of the eastern QTP. Areas with persistent drying trend accounted for around 24% of the QTP and were primarily found in the southeast and northeast of the QTP, as well as the Qaidam Basin. The remaining 10% of the QTP would be transformed from dry to wet or from wet to dry (Figure 3B).
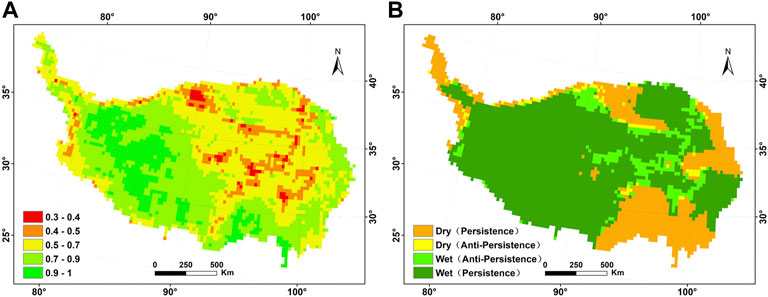
FIGURE 3. Spatial distribution of Hurst index (A) and persistence analysis (B).
3.3 Changes in drought intensity characteristics
We divided the drought into nine categories for the 1980s, 1990s, 2000s, and 2010s. The number of grids for each drought category was calculated from one-time interval to the next, as shown in Supplementary Table S3. Figure 4 shows the overall rate of change in the drought during each time interval. The horizontal axis shows the time interval, and the vertical axis displays the percentage variation in the number of pixels per year, with the horizontal solid line indicating the uniform annual change. If the bar does not exceed the uniform annual change line, it means that the interval changes slowly. On the contrary, the interval changed quickly if the bar is above the uniform annual change line. The rate of change was relatively quick for the 1980s and 2000s, and slow for the 1990s and 2010s. The 1980s was the fastest rate of change.
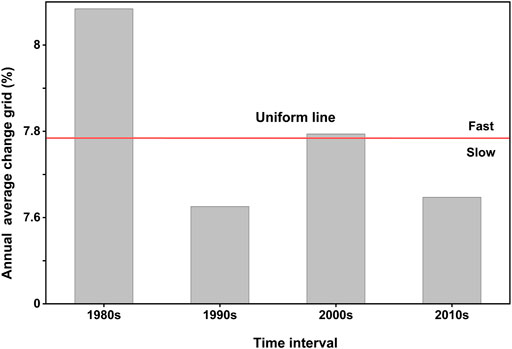
FIGURE 4. The interval intensity analysis for the 1980s, 1990s, 2000s, and 2010s.
Figure 5 shows whether the change rate of the nine drought categories in each interval was an active or dormant state. Each category has two horizontal bars, the lower bar shows the number of loss grids and the annual intensity of change, while the upper bar represents the gain. The solid line is the uniform line, if the bar finishes on the right side of the uniform line, the variation in the interval is relatively active, and if the bar ends on the left side of the uniform line, the variation in the interval is dormant.
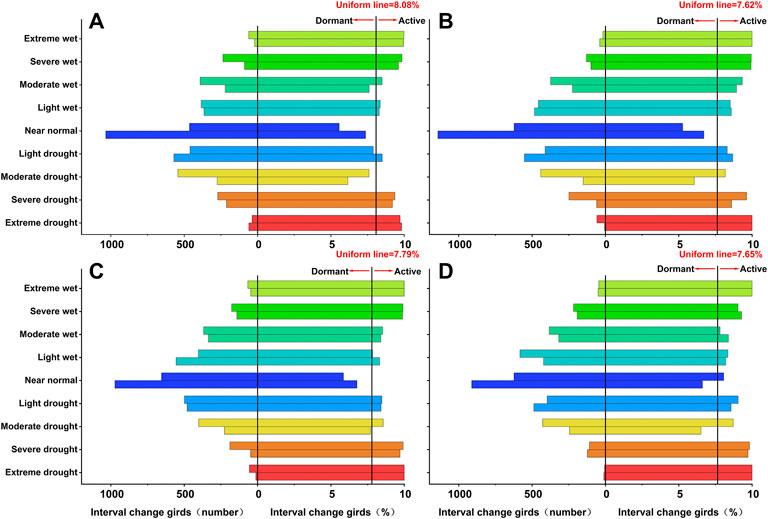
FIGURE 5. Intensity analysis of change for each category for the (A) 1980s (B) 1990s (C) 2000s and (D) 2010s.
In the 1980s interval, all wet categories gained more grids than lose grids. The intensity of both extreme wet and drought exceeded the uniform line in the interval, close to 10%, indicating that they were relatively active. The near normal was negative incomes and relatively dormant, with the largest grid changes of more than 1 k (Figure 5A). In the 1990s interval, except for near-normal and moderate drought (loss) in a dormant state, the rest were relatively active. Moderate wet and below moderate drought were positive incomes, but the light drought was negative, and the largest number of grid changes was near normal (Figure 5B). In the 2000s interval, the grids changes of each wet category were the same basically, but light wet and near-normal were negative incomes, and all drought types were positive gains (Figure 5C). In the last interval, the average intensity was relatively small, all types were above the uniform line and were in an active state, the gross gain of wet was positive, and the gross gain of the moderate drought was large, which could indicate that the number of grids transferred to moderate drought was large, and the rest were the same in general (Figure 5D).
Figure 6 demonstrates the intensity analysis of the transition level. The upper vertical bar is the transition intensity from category i to category m (gain), and the lower vertical bar is the transition intensity from category m to category i (loss, m≠i). The solid red line indicates the uniform transition intensity. If the vertical bar exceeds the uniform line, it shows that the transition intensity of this drought category is dominant.
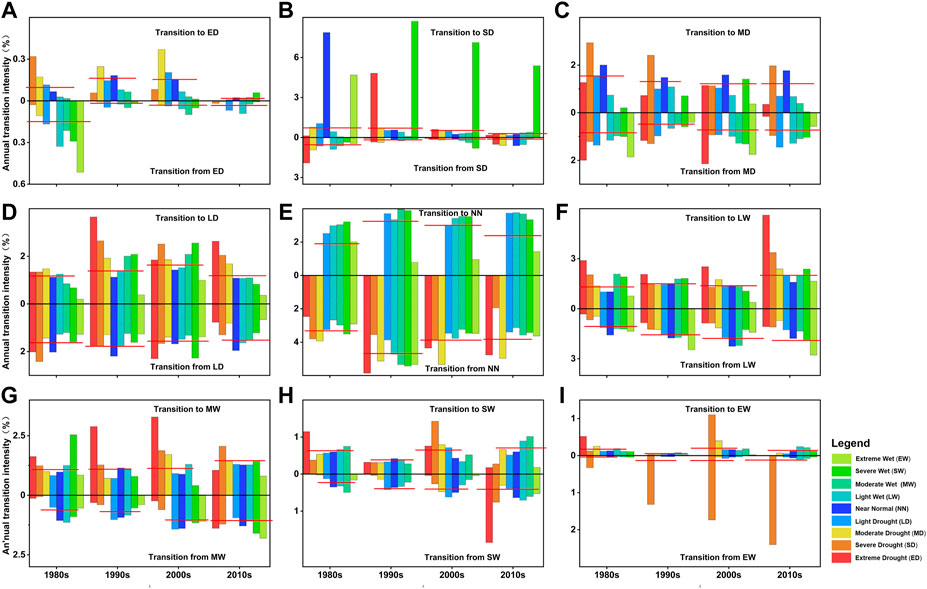
FIGURE 6. Intensity analysis of transition category in each interval.
Combining Supplementary Table S3 with Figure 6, the results indicated that the 1980s were primarily dominated by moderate drought and slight wet transition. The gross grids transformed between drying and wetting were the same, indicating there was no obvious transformation of the drying and wetting area during this interval. But in the 1990s, the drying areas were more than the wetting areas in general, light drought, near normal, and light wet were dominant, and the number of interconverted grids among near normal, severe and light drought, moderate and light wet were high. In the 2000s, it was obvious that all of them were transformed to the lower level of drought, near-normal and light wet were the dominant transition, and the drying area was increasing. It was dominated by light wet and moderate drought in the 2010s, the number of wetting grids was significantly greater than the drying grids, and the area of wetting was expanding.
3.4 Main spatial gathering patterns of drought
The 12-month-scale SPEI was used to perform EOF analysis to obtain the main spatial gathering characteristics of drought in the QTP, and the significance test was performed using the North significance test. The spatial distribution characteristics of the first few eigenvectors having passed the significance test could maximize the distribution gathering characteristics of drought. If each component of the eigenvector has the same sign, the variation of this region shows the same, while if the components of an eigenvector are distributed in a positive and negative pattern, they represent two different types of distributions. The larger absolute value is the center, and the value of the eigenvector multiplies by the value of the time coefficient represents the actual value. As shown in Supplementary Table S4, the cumulative variance contribution rate of the first five eigenvectors accounts for 70.8%. The eigenvectors with a variance contribution rate of less than 10% are not strong enough to explain, while the cumulative variance contribution rate of the first three eigenvectors close to 60%. Therefore, the first three eigenvectors are used to characterize the main spatial gathering characteristics of SPEI in the QTP.
The variance contribution rate of the EOF mode1 was the largest with 23%, which was the principal spatial gathering distribution of drought, and exhibited a gathering distribution structure with negative values in the southeast and east of the QTP and positive values in the center and west (Figure 7A). The low-value center was in the west, indicating that the variation of dry and wet was more obvious there, and the regional changes were consistent. Combined with the time coefficients, the turning point of dry and wet occurred about 1998, indicating that the west was dry before 1998 and wet afterward. Extreme drought years occurred in 1985, 1995, and 2015, respectively, and extreme wet years occur in 1998, 2000, 2002, 2017, and 2018, respectively. From the trend line of the time coefficients, we could also determine that wetting trend would continue in most areas in the future.
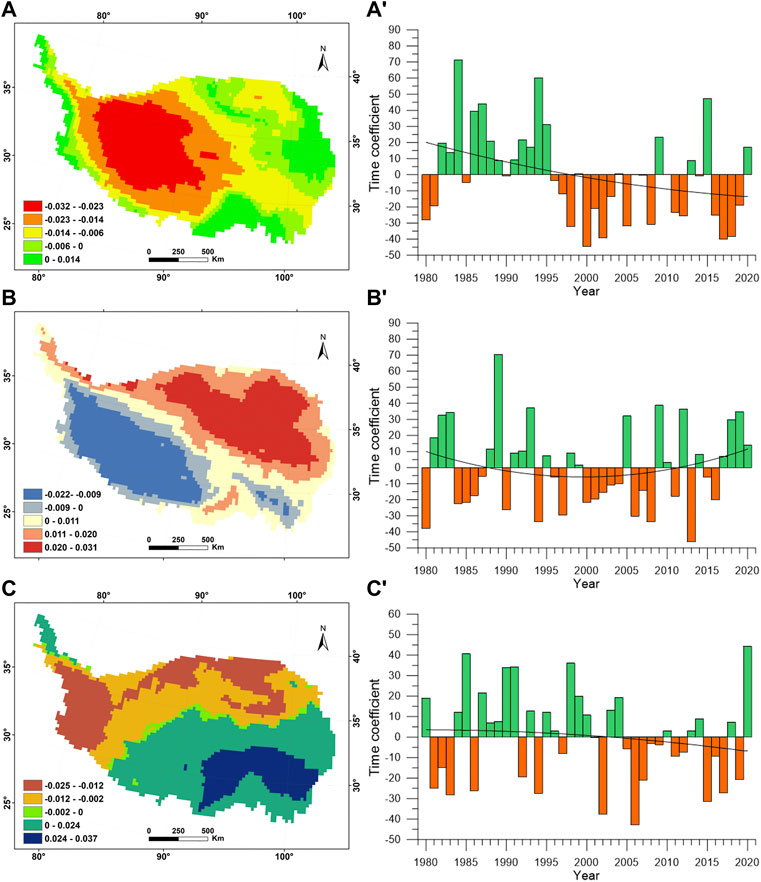
FIGURE 7. Spatial gathering distribution and time coefficients. (A,A’) EOF mode1, (B,B’) EOF mode2, (C,C’) EOF mode3.
The spatial gathering distribution of the EOF mode2 was shown in Figure 7B. The variance contribution rate reached 20%, close to the first mode, reflecting the eigenvector field of the southwest and northeast inversions with the low-value center in the southeast and the high-value center in the northeast. The time coefficients before 1987 and after 2012 were positive, indicating that the southwest was dry while the northeast was wet. The extreme drought years in the southwest were 1989, 1993, 2009, and 2012, and the extreme wet years were 1980, 1994, 1997, and 2013 respectively.
The EOF mode3 showed an opposite trend between the north and south with a 13% variance contribution rate (Figure 7C). The high-value centers were mainly located in the east and south, while the low-value centers were mainly found in the west and parts of the north. The 2004 year was a turning point. The south was in a wet situation before that, and it had been in a dry state after that. The years of extreme drought in the south occurred in 1981, 1983, 1986, 1994, 2002, 2006, and 2015, respectively, and the extremely wet ones were in 1985, 1990, 1991, 1998, and 2020, respectively.
In order to analyze the causes of the three distinct spatial gathering characteristics, we also investigated the gathering characteristics of precipitation, temperature, and potential evapotranspiration, taking into account all spatial characteristics with contribution rates of more than 5%, as shown in Supplementary Table S5. It indicates that the principal spatial gathering distribution of the EOF mode one might correspond to the altitude and temperature (Figure 8A); The southwest-northeast mode might be closely connected to potential evapotranspiration, and potential evapotranspiration changes have a greater impact on the trend of the dry and wet change (Figure 8B); Precipitation and potential evapotranspiration might be related to the south-north mode (Figure 8C), the superposition of the precipitation decreasing and potential evapotranspiration increasing might be the main reason for the north-south difference.
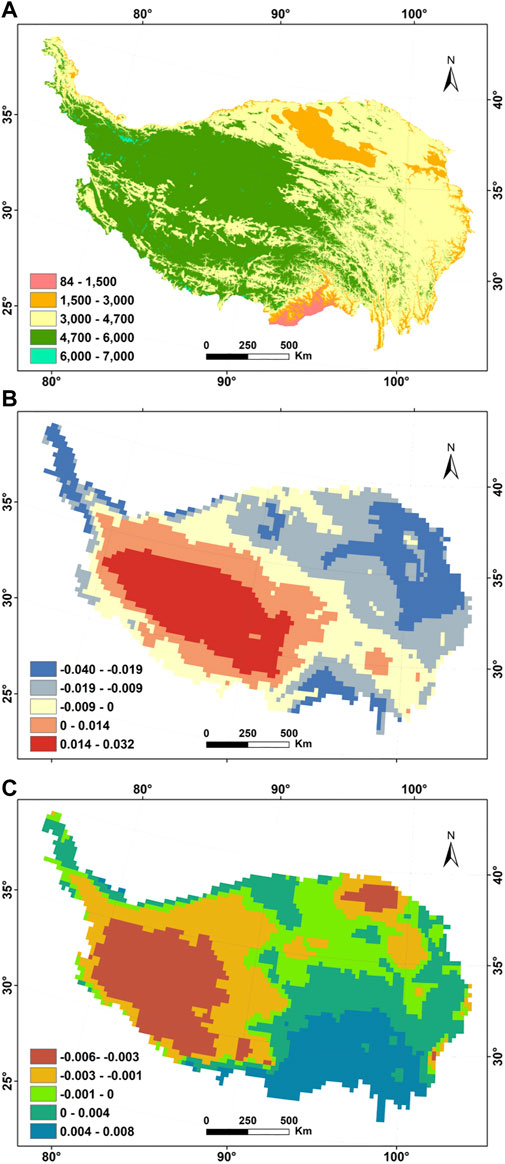
FIGURE 8. Spatial distribution of altitude(A) and the spatial gathering distribution of the second mode of PET(B), the first mode of P(C).
We also analyzed the correlation of precipitation, temperature, and potential evaporation with SPEI, as well as its trend analysis. The result showed that SPEI was strongly positively connected to precipitation but negatively associated with potential evapotranspiration. The positive correlation with the temperature only occurred in a few areas (Figure 9). Wetting regions had a significant increase in precipitation and a significant decrease in potential evapotranspiration, whereas precipitation in dry areas decreased and potential evaporation increased. The reasons of drought in these regions might be associated with the static wind and central plateau convection, which caused the unequal distribution of rainfall, while warming led land evapotranspiration to increase. The superposition caused runoff decrease and the occurrence of drought (Yang et al., 2014; Yang et al., 2011).
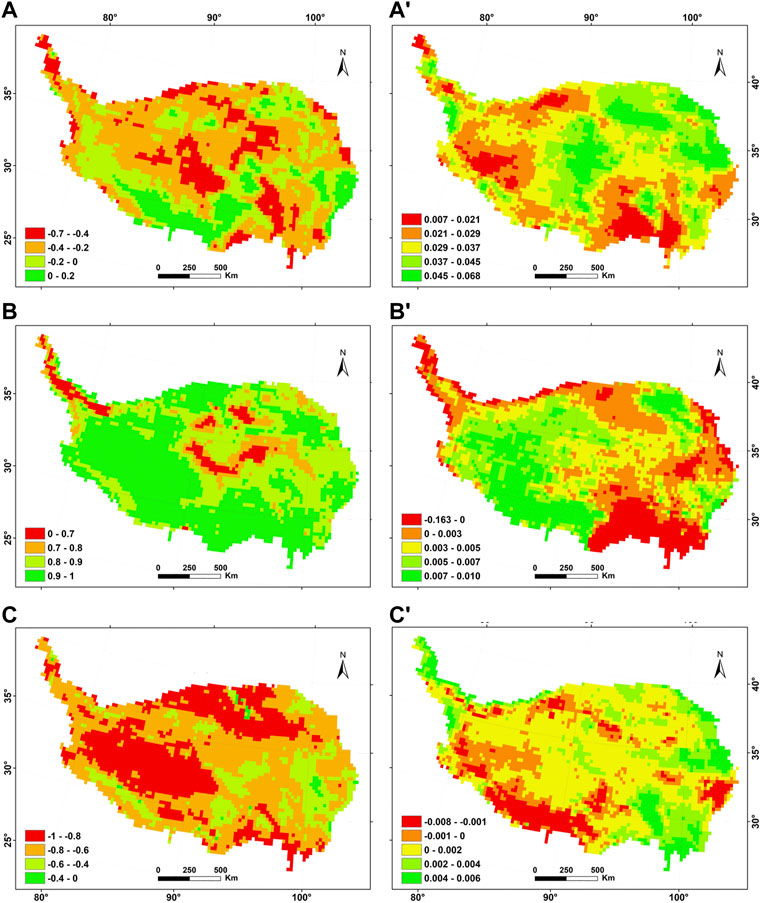
FIGURE 9. Correlation analysis of T, P and PET with SPEI (A–C) and their trend analysis (A’–C’).
4 Discussion
The QTP was wetter in general, and only 27% of the areas tended to be dry from 1980 to 2020. Several recent studies also concluded that the QTP became wetter in recent years (Li et al., 2010; Chen and Sun, 2015; Gao et al., 2015; Liu et al., 2015; Wang et al., 2015; Liu et al., 2019b). However, some studies pointed out that the southern regions were becoming wetter (Yu et al., 2014; Wang et al., 2017). To understand the differences with other studies, we also compared some studies with different drought indices and data in the QTP, and their findings were listed in Table 1. Furthermore, The PET of SPEI calculated by the Thornthwaite method would exhibit significantly greater differences than SPEI_PM (Chen and Sun, 2015). The unequal period covering the study and usage of the different datasets as well as different methods might affect the results.

TABLE 1. Previous studies on drought in the QTP.
Apparently, the causes of drought are extremely complex. Human activities, such as land use/cover change (LUCC) and urbanization, change the exchange of water and energy between the atmosphere and the soil by modifying the Earth’s surface, further aggravating drought (Meshesha et al., 2012; Yang et al., 2017). The interaction of dust-cloud, atmosphere-land, atmosphere-ocean has a significant impact on regional climate change and hydrological cycle, leading to the variations of precipitation, temperature, PET and soil moisture, which can affect drought (Huang et al., 2017). The drought might also be related to geographical environmental characteristics and elevation (Feng et al., 2020). Therefore, in order to better understand the drought, more detailed investigations in drought mechanisms are needed in future studies.
Though in this study we analyze the drought characteristics in the QTP from 1980 to 2020 using grid datasets and have made some findings, there are still some limitations. Firstly, the dataset is not as accurate as traditional meteorological data and contains some anomalies. Besides, the causes of drought are complicated, we did not accurately distinguish whether natural factors or human activities influenced the drought, e.g., the government’s afforestation project, returning farmland to forests, and protection of pastures, which may be responsible for the regional wetness (Li et al., 2013). Furthermore, the causes of the inversion of dry to wet and wet to dry are not addressed in this study. In the future, high-resolution grid data could be used to analyze different drought indices, and to compare their similarities and differences. The influence mechanism and propagation time of different climate variables on drought are also very interesting topics and need to be further explored.
5 Conclusion
Based on the trend analysis, Hurst exponent analysis, intensity analysis, and EOF analysis methods, we analyzed the dry and wet changes, future persistent changes of drought, drought intensity, and transfer, as well as spatial structure characteristics of drought from 1980 to 2020 in the QTP. The following are the main conclusions:
1) In the past 41 years, there was an overall wetting trend in the QTP, with about 27% of the southeast and some of the northeast of the QTP experiencing regional drying. In the 1980s and 2000s, the drought intensity was relatively fast, while it was slow in the 1990s and 2010s.
2) The future trend of wet and dry in most areas would be the same as the current trend, only 10% of the areas had the reverse transformation trend.
3) EOF mode1 revealed a gathering distribution structure with negative values in the southeast and east of the QTP and positive values in the center and west. The west was more sensitive to climate change, and the wet/dry changeover occurred about in 1998. Most areas will continue to be wet in most areas in the future. A contrast gathering pattern between southwest and northeast was found by analysis of EOF mode2. The southwest was dry while the northeast was wet before 1987 and after 2012, the reverse occurred between 1987 and 2012; EOF mode3 showed the opposite phases between the south and north regions, and the southern regions were prone to be dry with a high amplitude, and the year of transition was in 2004.
Data availability statement
Publicly available datasets were analyzed in this study. This data can be found here: https://cds.climate.copernicus.eu/cdsapp#!/home.
Author contributions
NY: Writing—original draft, writing—review and editing, visualization; YF: Conceptualization, data curation, writing—review and editing, formal analysis; SL: Writing—review and editing, validation; GW: writing—review and editing, validation; TY: Validation; DY: Validation; PW: Validation; XK: Validation; LW: Validation.
Funding
This research was supported by the Strategic Priority Research Program of the Chinese Academy of Sciences (Grant No. XDA2010010306), the National Natural Science Foundation of China (92047202, 41330634, 41072191, 91125011), the China Geological Survey since 2000, and the Fundamental Research Funds for Central Universities are gratefully acknowledged.
Acknowledgments
The authors greatly appreciate the valuable comments and suggestions of the editors and reviewers using their time and effort to improve this manuscript.
Conflict of interest
The authors declare that the research was conducted in the absence of any commercial or financial relationships that could be construed as a potential conflict of interest.
Publisher’s note
All claims expressed in this article are solely those of the authors and do not necessarily represent those of their affiliated organizations, or those of the publisher, the editors and the reviewers. Any product that may be evaluated in this article, or claim that may be made by its manufacturer, is not guaranteed or endorsed by the publisher.
Supplementary material
The Supplementary Material for this article can be found online at: https://www.frontiersin.org/articles/10.3389/fenvs.2022.1008886/full#supplementary-material
References
Abdullah, S. A., and Nakagoshi, N. (2006). Changes in landscape spatial pattern in the highly developing state of Selangor, peninsular Malaysia. Landsc. Urban Plan. 77 (3), 263–275. doi:10.1016/j.landurbplan.2005.03.003
Aldwaik, S. Z., and Pontius, R. G. (2012). Intensity analysis to unify measurements of size and stationarity of land changes by interval, category, and transition. Landsc. Urban Plan. 106 (1), 103–114. doi:10.1016/j.landurbplan.2012.02.010
Blunden, J., Arndt, D. S., and Baringer, M. O. (2011). State of the climate in 2010. Bull. Am. Meteorol. Soc. 92 (6), S1–S236. doi:10.1175/1520-0477-92.6.s1
Chen, H., and Sun, J. (2015). Changes in drought characteristics over China using the standardized precipitation evapotranspiration index. J. Clim. 28 (13), 5430–5447. doi:10.1175/jcli-d-14-00707.1
Chen, H., Zhu, Q., Peng, C., Wu, N., Wang, Y., Fang, X., et al. (2013). The impacts of climate change and human activities on biogeochemical cycles on the Qinghai‐Tibetan Plateau. Glob. Chang. Biol. 19 (10), 2940–2955. doi:10.1111/gcb.12277
Chen, T., Zhang, H., Chen, X., Hagan, D. F., Wang, G., Gao, Z., et al. (2017). Robust drying and wetting trends found in regions over China based on Köppen climate classifications. J. Geophys. Res. Atmos. 122 (8), 4228–4237. doi:10.1002/2016jd026168
Dai, A. (2011). Drought under global warming: A review. WIREs Clim. Change 2 (1), 45–65. doi:10.1002/wcc.81
Dai, A., Trenberth, K. E., and Qian, T. (2004). A global dataset of Palmer Drought Severity Index for 1870–2002: Relationship with soil moisture and effects of surface warming. J. Hydrometeorol. 5 (6), 1117–1130. doi:10.1175/jhm-386.1
Eslamian, S., Ostad-Ali-Askari, K., Singh, V. P., Dalezios, N. R., Ghane, M., Yihdego, Y., et al. (2017). A review of drought indices. Int. J. Constr. Res. Civ. Eng. 3, 48–66.
Feng, W., Lu, H., Yao, T., and Yu, Q. (2020). Drought characteristics and its elevation dependence in the Qinghai–Tibet plateau during the last half-century. Sci. Rep. 10 (1), 1–11. doi:10.1038/s41598-020-71295-1
Feng, Y., Kuang, X., Liang, S., Liu, S., Yao, Y., Xie, Y., et al. (2021). A simple and efficient method for correction of basin-scale evapotranspiration on the Tibetan plateau. Remote Sens. (Basel). 13 (19), 3958. doi:10.3390/rs13193958
Feng, Y., Liang, S., Kuang, X., Wang, G., Wang, X.-S., Wu, P., et al. (2019). Effect of climate and thaw depth on alpine vegetation variations at different permafrost degrading stages in the Tibetan Plateau, China. Arct. Antarct. Alp. Res. 51 (1), 155–172. doi:10.1080/15230430.2019.1605798
Gao, Y., Li, X., Leung, L. R., Chen, D., and Xu, J. (2015). Aridity changes in the Tibetan Plateau in a warming climate. Environ. Res. Lett. 10 (3), 034013. doi:10.1088/1748-9326/10/3/034013
García, M. d. l. N. L., and Requena, J. P. R. (2019). Different methodologies and uses of the Hurst exponent in econophysics. Estud. Econ. Appl. 37 (2), 96–108. doi:10.25115/eea.v37i2.2603
Gocic, M., and Trajkovic, S. (2013). Analysis of changes in meteorological variables using Mann-Kendall and Sen's slope estimator statistical tests in Serbia. Glob. Planet. Change 100, 172–182. doi:10.1016/j.gloplacha.2012.10.014
Hayes, M., Svoboda, M., Wall, N., and Widhalm, M. (2011). The lincoln declaration on drought indices: Universal meteorological drought index recommended. Bull. Am. Meteorol. Soc. 92 (4), 485–488. doi:10.1175/2010bams3103.1
Hu, W., She, D., Xia, J., He, B., and Hu, C. (2021). Dominant patterns of dryness/wetness variability in the Huang-Huai-Hai River Basin and its relationship with multiscale climate oscillations. Atmos. Res. 247, 105148. doi:10.1016/j.atmosres.2020.105148
Huang, J., Li, Y., Fu, C., Chen, F., Fu, Q., Dai, A., et al. (2017). Dryland climate change: Recent progress and challenges. Rev. Geophys. 55 (3), 719–778. doi:10.1002/2016rg000550
Huang, J., Pontius, R. G., Li, Q., and Zhang, Y. (2012). Use of intensity analysis to link patterns with processes of land change from 1986 to 2007 in a coastal watershed of southeast China. Appl. Geogr. 34, 371–384. doi:10.1016/j.apgeog.2012.01.001
Huang, J., Yu, H., Guan, X., Wang, G., and Guo, R. (2016). Accelerated dryland expansion under climate change. Nat. Clim. Chang. 6 (2), 166–171. doi:10.1038/nclimate2837
Huang, S., Qiang, H., Chang, J., Zhu, Y., Li, X., and Xing, L. (2015). Drought structure based on a nonparametric multivariate standardized drought index across the Yellow River basin, China. J. Hydrol. X. 530, 127–136. doi:10.1016/j.jhydrol.2015.09.042
Immerzeel, W. W., van Beek, L. P. H., and Bierkens, M. F. P. (2010). Climate change will affect the asian water towers. Science 328 (5984), 1382–1385. doi:10.1126/science.1183188
Kang, S., Xu, Y., You, Q., Flügel, W.-A., Pepin, N., and Yao, T. (2010). Review of climate and cryospheric change in the Tibetan Plateau. Environ. Res. Lett. 5 (1), 015101. doi:10.1088/1748-9326/5/1/015101
Kuang, X., and Jiao, J. J. (2016). Review on climate change on the Tibetan Plateau during the last half century. J. Geophys. Res. Atmos. 121 (8), 3979–4007. doi:10.1002/2015jd024728
Li, B., Chen, Y., Chen, Z., Li, W., and Zhang, B. (2013). Variations of temperature and precipitation of snowmelt period and its effect on runoff in the mountainous areas of Northwest China. J. Geogr. Sci. 23 (1), 17–30. doi:10.1007/s11442-013-0990-1
Li, L., Yang, S., Wang, Z., Zhu, X., and Tang, H. (2010). Evidence of warming and wetting climate over the Qinghai-Tibet Plateau. Arct. Antarct. Alp. Res. 42 (4), 449–457. doi:10.1657/1938-4246-42.4.449
Li, S., Yao, Z., Liu, Z., Wang, R., Liu, M., and Adam, J. C. (2019). The spatio-temporal characteristics of drought across tibet, China: Derived from meteorological and agricultural drought indexes. Theor. Appl. Climatol. 137 (3), 2409–2424. doi:10.1007/s00704-018-2733-9
Liang, J., Zhang, B., Ma, B., and Wei, H. (2018). Drought evolution characteristics on the Tibetan Plateau based on daily standardized precipitation evapotranspiration index. J. Glaciol. Geocryol. 40, 1100–1109.
Liang, S., Ge, S., Wan, L., and Zhang, J. (2010). Can climate change cause the Yellow River to dry up? Water Resour. Res. 46 (2), W02505. doi:10.1029/2009wr007971
Liu, L., Niu, Q., Heng, J., Li, H., and Xu, Z. (2019a). Transition characteristics of the dry-wet regime and vegetation dynamic responses over the yarlung zangbo River Basin, southeast Qinghai-Tibet Plateau. Remote Sens. (Basel). 11 (10), 1254. doi:10.3390/rs11101254
Liu, L., Wang, Y., You, N., Liang, Z., Qin, D., and Li, S. (2019b). Changes in aridity and its driving factors in China during 1961–2016. Int. J. Climatol. 39 (1), 50–60. doi:10.1002/joc.5781
Liu, X., Wang, S., Zhou, Y., Wang, F., Li, W., and Liu, W. (2015). Regionalization and spatiotemporal variation of drought in China based on standardized precipitation evapotranspiration index (1961–2013). Adv. Meteorol., 1–18. doi:10.1155/2015/950262
Lu, E., Liu, S., Luo, Y., Zhao, W., Li, H., Chen, H., et al. (2014). The atmospheric anomalies associated with the drought over the Yangtze River basin during spring 2011. J. Geophys. Res. Atmos. 119 (10), 5881–5894. doi:10.1002/2014jd021558
Lu, Y., Cai, H., Jiang, T., Sun, S., Wang, Y., Zhao, J., et al. (2019). Assessment of global drought propensity and its impacts on agricultural water use in future climate scenarios. Agric. For. Meteorol. 278, 107623. doi:10.1016/j.agrformet.2019.107623
McKee, T. B., Doesken, N. J., and Kleist, J. (1993). “The relationship of drought frequency and duration to time scales,” in Proceedings of the 8th Conference on Applied Climatology (California, 179–183.17).
Meshesha, D. T., Tsunekawa, A., and Tsubo, M. (2012). Continuing land degradation: Cause–effect in Ethiopia's central rift valley. Land Degrad. Dev. 23 (2), 130–143. doi:10.1002/ldr.1061
Mishra, A. K., and Singh, V. P. (2010). A review of drought concepts. J. Hydrol. X. 391 (1-2), 202–216. doi:10.1016/j.jhydrol.2010.07.012
North, G. R., Bell, T. L., Cahalan, R. F., and Moeng, F. J. (1982). Sampling errors in the estimation of empirical orthogonal functions. Mon. Weather Rev. 110 (7), 699–706. doi:10.1175/1520-0493(1982)110<0699:seiteo>2.0.co;2
Palmer, W. C. (1965). Meteorological drought. Washington, DC: U.S. Department of Commerce Weather Bureau, 58. Research Paper No. 45.
Potop, V., Boroneanţ, C., Možný, M., Štěpánek, P., and Skalák, P. (2014). Observed spatiotemporal characteristics of drought on various time scales over the Czech Republic. Theor. Appl. Climatol. 115 (3), 563–581. doi:10.1007/s00704-013-0908-y
Rangwala, I., and Miller, J. R. (2012). Climate change in mountains: A review of elevation-dependent warming and its possible causes. Clim. Change 114 (3-4), 527–547. doi:10.1007/s10584-012-0419-3
Shukla, S., and Wood, A. W. (2008). Use of a standardized runoff index for characterizing hydrologic drought. Geophys. Res. Lett. 35 (2), L02405. doi:10.1029/2007gl032487
Sun, Y., Liu, S., Liu, Y., Dong, Y., Li, M., An, Y., et al. (2021). Effects of the interaction among climate, terrain and human activities on biodiversity on the Qinghai-Tibet Plateau. Sci. Total Environ. 794, 148497. doi:10.1016/j.scitotenv.2021.148497
Tong, S., Lai, Q., Zhang, J., Bao, Y., Lusi, A., Ma, Q., et al. (2018). Spatiotemporal drought variability on the Mongolian Plateau from 1980–2014 based on the SPEI-PM, intensity analysis and Hurst exponent. Sci. Total Environ. 615, 1557–1565. doi:10.1016/j.scitotenv.2017.09.121
Vicente-Serrano, S. M., Beguería, S., and López-Moreno, J. I. (2010). A multiscalar drought index sensitive to global warming: The standardized precipitation evapotranspiration index. J. Clim. 23 (7), 1696–1718. doi:10.1175/2009jcli2909.1
Wang, A., Lettenmaier, D. P., and Sheffield, J. (2011). Soil moisture drought in China, 1950–2006. J. Clim. 24 (13), 3257–3271. doi:10.1175/2011jcli3733.1
Wang, Q., Wu, J., Lei, T., He, B., Wu, Z., Liu, M., et al. (2014). Temporal-spatial characteristics of severe drought events and their impact on agriculture on a global scale. Quat. Int. 349, 10–21. doi:10.1016/j.quaint.2014.06.021
Wang, W., Zhu, Y., Xu, R., and Liu, J. (2015). Drought severity change in China during 1961–2012 indicated by SPI and SPEI. Nat. Hazards 75 (3), 2437–2451. doi:10.1007/s11069-014-1436-5
Wang, Y., Fu, B., Liu, Y., Li, Y., Feng, X., and Wang, S. (2021). Response of vegetation to drought in the Tibetan Plateau: Elevation differentiation and the dominant factors. Agric. For. Meteorol. 306, 108468. doi:10.1016/j.agrformet.2021.108468
Wang, Y., Liu, G., and Guo, E. (2019a). Spatial distribution and temporal variation of drought in inner Mongolia during 1901–2014 using standardized precipitation evapotranspiration index. Sci. Total Environ. 654, 850–862. doi:10.1016/j.scitotenv.2018.10.425
Wang, Y., Liu, X., Ren, G., Yang, G., and Feng, Y. (2019b). Analysis of the spatiotemporal variability of droughts and the effects of drought on potato production in northern China. Agric. For. Meteorol. 264, 334–342. doi:10.1016/j.agrformet.2018.10.019
Wang, Z., Li, J., Lai, C., Zeng, Z., Zhong, R., Chen, X., et al. (2017). Does drought in China show a significant decreasing trend from 1961 to 2009? Sci. Total Environ. 579, 314–324. doi:10.1016/j.scitotenv.2016.11.098
Yang, Y., McVicar, T. R., Donohue, R. J., Zhang, Y., Roderick, M. L., Chiew, F. H., et al. (2017). Lags in hydrologic recovery following an extreme drought: Assessing the roles of climate and catchment characteristics. Water Resour. Res. 53 (6), 4821–4837. doi:10.1002/2017wr020683
Yao, T., Thompson, L. G., Mosbrugger, V., Zhang, F., Ma, Y., Luo, T., et al. (2012). Third pole environment (TPE). Environ. Dev. 3, 52–64. doi:10.1016/j.envdev.2012.04.002
Ye, C., Sun, J., Liu, M., Xiong, J., Zong, N., Hu, J., et al. (2020). Concurrent and lagged effects of extreme drought induce net reduction in vegetation carbon uptake on Tibetan Plateau. Remote Sens. (Basel). 12 (15), 2347. doi:10.3390/rs12152347
You, Q., Cai, Z., Pepin, N., Chen, D., Ahrens, B., Jiang, Z., et al. (2021). Warming amplification over the arctic Pole and Third Pole: Trends, mechanisms and consequences. Earth-Science Rev. 217, 103625. doi:10.1016/j.earscirev.2021.103625
Yu, M., Li, Q., Hayes, M. J., Svoboda, M. D., and Heim, R. R. (2014). Are droughts becoming more frequent or severe in China based on the standardized precipitation evapotranspiration index: 1951–2010? Int. J. Climatol. 34 (3), 545–558. doi:10.1002/joc.3701
Zhang, D., Zhang, Q., Werner, A. D., and Liu, X. (2016). GRACE-based hydrological drought evaluation of the Yangtze River Basin, China. J. Hydrometeorol. 17 (3), 811–828. doi:10.1175/jhm-d-15-0084.1
Zhang, H., Ding, M., Li, L., and Liu, L. (2019). Continuous wetting on the Tibetan plateau during 1970–2017. Water 11 (12), 2605. doi:10.3390/w11122605
Keywords: climate change, drought, gathering characteristics, empirical orthogonal function, Qinghai-Tibet Plateau
Citation: Yuan N, Feng Y, Liang S, Wang G, Yin T, Yan D, Wu P, Kuang X and Wan L (2022) Spatial gathering characteristics of drought in the Qinghai-Tibet Plateau. Front. Environ. Sci. 10:1008886. doi: 10.3389/fenvs.2022.1008886
Received: 01 August 2022; Accepted: 04 October 2022;
Published: 19 October 2022.
Edited by:
Claudio Fabian Szlafsztein, Federal University of Pará, BrazilReviewed by:
Junqiang Yao, China Meteorological Administration, ChinaXiuping Li, Institute of Tibetan Plateau Research(CAS), China
Copyright © 2022 Yuan, Feng, Liang, Wang, Yin, Yan, Wu, Kuang and Wan. This is an open-access article distributed under the terms of the Creative Commons Attribution License (CC BY). The use, distribution or reproduction in other forums is permitted, provided the original author(s) and the copyright owner(s) are credited and that the original publication in this journal is cited, in accordance with accepted academic practice. No use, distribution or reproduction is permitted which does not comply with these terms.
*Correspondence: Yuqing Feng, ZmVuZ3lxQGVtYWlsLmN1Z2IuZWR1LmNu; Sihai Liang, bGlhbmdzaEBjdWdiLmVkdS5jbg==