 Hanshou Zhu
 Jun Zhai
 Peng Hou
 Haifeng Gao1
94% of researchers rate our articles as excellent or good
Learn more about the work of our research integrity team to safeguard the quality of each article we publish.
Find out more
ORIGINAL RESEARCH article
Front. Environ. Sci., 27 September 2022
Sec. Drylands
Volume 10 - 2022 | https://doi.org/10.3389/fenvs.2022.1008441
This article is part of the Research TopicClimate and Land Use Change in Dryland Ecosystems: Individual and Coupled Mechanisms of ImpactView all 9 articles
In terms of ecosystem structure, quality, and service, we have constructed a total of 18 characteristic evaluation indicators that could reflect the “state change interaction” of the ecosystem and analyzed the Spatio-temporal change of the ecosystem in Hexi Corridor from 2000 to 2020. The results show that: 1. The improvement of ecosystem and service is more obvious in the areas with a better ecological background in the East. The supply and regulation services of the ecosystem are synergetic. 2. In the past 2 decades, the ecological conditions of the Hexi corridor have improved as a whole, and the hot spots for improving ecosystem quality and services have gradually moved eastward. 3. Ecosystem changes have significantly changed the quantity and relationship of ecosystem services, showing strong spatial heterogeneity. For example, the loss of natural vegetation in the central and eastern regions with good ecological backgrounds has improved the water conservation service and also enhanced the synergy between it and the supply service. From the perspective of the relationship between ecosystem regulation services and supply services, the coordination characteristics are weakened, but the performance of regions with a poor ecological background in the west is just the opposite. In short, the typical climate characteristics of dry land with little rain and the spatial pattern of water resource shortage not only jointly determine the ecosystem background of the region, but also bring significant spatial differences and greater uncertainties to the relationship between ecosystem transformation and ecosystem services. Therefore, dryland ecosystem management and protection should be based on detailed and differentiated ecosystem assessment, taking into account regional natural resource endowment, giving priority to improving the stability of the regional ecosystem and gradually increasing regional ecosystem services.
Areas, where the ratio of annual average rainfall to potential evapotranspiration is less than 0.65 are known as drylands, which is mainly distributed in fragile ecosystems such as desert and bare land (Li et al., 2021) Drylands, are generally located in the ecotone of different natural geographical units, which are often the ecological barriers of the region (Kazenel et al., 2020; Li et al., 2021). However, due to the continuous intensification of human activities such as urban construction, water resources utilization, and mineral resources development, more and more eco-environmental problems are gradually emerging in these regions under the background of climate change (Liu et al., 2019; Lian et al., 2021; Shen et al., 2021). Therefore, identifying the spatial distribution pattern and change characteristics of different ecosystems is the premise for the overall protection and management of ecosystems in drylands.
With the development of human society and economy, in addition to the protection of species and natural landscapes through publicity and education, the use of various policy tools such as ecosystem management, restoration, assessment, and monitoring has attracted much attention. (Murcia et al., 2014; Alexander et al., 2016; Fischer et al., 2021; Jiang et al., 2021). At present, ecological protection, restoration, and management decisions at regional and national scales mainly focus on two aspects. On the one hand, for areas with poor natural environment backgrounds and fragile and sensitive ecosystems, the objective of ecosystem protection and management measures is to improve the stability of ecosystem structure in these ecologically vulnerable areas. (Li et al., 2018; Liu et al., 2018). On the other hand, ecosystem management also pays more attention to process supervision, such as the supervision of unreasonable human development and construction, and timely repair of degraded areas (Cao et al., 2018; Etter et al., 2020; Copeland et al., 2021). Dryland, which accounts for a relatively wide land area, has fewer human activities. Therefore, most decision-makers of ecological protection management gradually realize that it is particularly important to evaluate the spatial difference characteristics of ecosystem patterns from the perspective of macro geographical units. In this way, targeted protection-oriented policies and measures can be implemented for vulnerable regions and sensitive ecosystems, which can not only prevent ecological degradation but also provide timely and accurate repair for damaged ecosystems.
At present, the protection and supervision of fragile ecosystems represented by drylands are two aspects of ecosystem management decision-making at the government level. Therefore, the assessment of nature reserves and ecological engineering projects has become the two main assessment tools to support ecological management decision-making. The first assessment tool includes the evaluation of the construction process, daily management, and protective effect of representative nature reserves (Le Saout et al., 2013; Assaf et al., 2021). However, due to the characteristics of small areas, scattered patches, and single protected objects, the representation of the overall characteristics of the regional ecosystem is insufficient (DeFries et al., 2010; Sigel et al., 2010; Watson et al., 2014). Another tool focuses on the ecological restoration area, which is related to specific projects (Nilsson et al., 2016; Tong et al., 2017). The assessment objects in these areas are generally relatively obvious vegetation destruction or environmental pollution events caused by the development of industrial and mining activities, which is different from the macroecological protection strategy of fragile ecosystems on a regional scale. Generally, the continuity and systematic characteristics of an ecosystem determine that ecosystem services reflect the connection and interaction of ecological elements at multiple scales (Kandziora et al., 2013). It can be seen that the essence of these two kinds of tools is to evaluate the ecological factors and ecological events, rather than an assessment of the regional ecological status. They neither represent the overall characteristics of the regional ecosystem nor depict the changing rules and interactions of the characteristics of the complex ecosystem (such as structure, quality, and service) from the changing time and space dimensions. In recent years, some of the latest research has gradually focused on the changes in the spatial and temporal patterns of ecosystems and the quantitative evaluation of the spatial and temporal characteristics of ecosystem service flows, focusing on the analysis of the relationship between the characteristics of regional ecosystems (Sun et al., 2020; Li et al., 2021; Zhang et al., 2022). This provides new content for the development of regional ecosystem-integrated assessment tools.
With the development of satellite remote sensing technology, it is possible to quickly obtain the parameter information of the terrestrial ecosystem, which brings convenience to the extraction and analysis of long-time series and multi-spatial scale ecological information. More and more studies use satellite remote sensing data to analyze regional ecosystem changes and carry out ecosystem comprehensive assessments (Ayanu et al., 2012; Araujo Barbosa et al., 2015; Pettorelli et al., 2018). In ecosystem monitoring and assessment, the information obtained from satellite remote sensing observation and inversion can not only directly represent the ecosystem structure and quality information (such as land use classification, vegetation index, vegetation productivity, etc.,) but also drive a series of ecosystem service assessment models (such as water conservation and soil conservation) to outline the ecosystem structure, quality and service characteristics from multiple perspectives. With the help of geographic information spatial analysis and statistical technology, all kinds of direct and indirect monitoring indicators of ecosystems can be used for spatiotemporal comprehensive assessment at different scales.
Therefore, it is one of the key problems to be solved urgently how to construct an effective evaluation index that can not only reflect the main characteristics of the regional ecosystem but also can be directly used to assist decision-making. In this paper, we take Hexi Corridor as an example. Based on optimizing and developing the national and regional ecological status indicators in regular investigation and assessment (Wang and Ouyang, 2014; Hou et al., 2015), we add the indicators reflecting the interaction of ecosystem structure, quality, and service into the evaluation framework as the characteristic content, and quantitatively analyze the spatial and temporal changes of various ecosystem indicators at the regional and county scales from 2000 to 2020. The purpose of this paper is to reveal the divergent trends of ecosystem status and services in time and space from a deeper level and more dimensions and help regional ecosystem protection and management decisions.
The Hexi Corridor is located in Northwest China (Figure 1), with vast deserts in the north and Qilian Mountains in the south. It is a typical oasis desert ecotone. It is located in the barrier area of the northern sand control zone of the country’s barrier area, called “Two Screens and Three Belts”. There is Qilian Mountain Glaciers and Water Conservation Ecological Function Zone inside, providing important services such as water conservation, soil conservation, and ecological supply for Western China. There are many Nature Reserves in the Hexi Corridor, including 11 provincial-level nature reserves and 10 national nature reserves, accounting for about 28% of the total area. The Hexi Corridor includes 20 counties, with a total population of 4.424 million in 2020. In recent years, with the rapid development of urbanization, the population density of the Hexi Corridor has been twice the limit of the population carrying capacity in arid areas (the standard proposed by the United Nations is seven people per km2) (Sun et al., 2021), the overall economic level is lower than the middle level in the country.

FIGURE 1. Location of the hexi corridor.
The land cover dataset used in this study is mainly from the China Land Cover Dataset (CLCD). The dataset was published by Mr. Huang Xin and produced on Google Earth Engine (GEE) platform (Yang and Huang, 2021). It is obtained by human-computer interaction based on Landsat satellite images. The time is from 2000 to 2020, the resolution is 30 m, and the overall accuracy reaches 79.31% (Yang and Huang., 2021). The dataset includes nine categories: Cropland, Forest, Shrub, Grassland, Water, Snow/Ice, Barren, Impervious, and Wetland. According to the research content, the categories are classified into six categories: Cropland, Natural vegetation, Barren, Impervious, Water and Wetland, and Other types.
The remote sensing data of this study mainly comes from the inversion of the Moderate Resolution Imaging Spectroradiometer (MODIS) (https://modis.gsfc.nasa.gov/), including Net Primary Production (NPP), Normalized Difference Vegetation Index (NDVI), Land Surface Temperature (LST), Surface Reflectance (SR), Evapotranspiration (ET), etc. Different sensors can calculate different products, including MOD09A1 V6 (SR can be inverted), MOD11A2 V6 (LST can be inverted), MOD16A2 (ET can be inverted), MOD17A3 (NPP can be inverted), MOD13Q1 (NDVI can be inverted), etc., Numerous studies indicated the NPP of the ecosystem can reflect the production capacity of the ecosystem under natural conditions (Yan et al., 2012; Wang et al., 2020).
The meteorological observation data are mainly from the daily rainfall observation data of the National Meteorological Information Center. Its spatial resolution is 0.25° × 0.25°, the daily observation data are spatially interpolated by the ANUSPLIN method, and the precipitation grid data with a spatial resolution of 1 km is obtained. The interpolation results were spatially registered with the 0.25° daily precipitation grid data. Based on the daily precipitation grid data of 0.25° resolution, the 1 km precipitation data is corrected by the total amount control method, and the 1 km precipitation grid data is finally obtained (Cao et al., 2018).
Auxiliary data includes soil types data, Digital Elevation Model (DEM), and other basic data. Soil types data is from the 1:1 million soil investigation of the Chinese Academy of Sciences, and DEM is from the geospatial data cloud (http://www.gscloud.cn). Finally, the data are preprocessed by splicing and fusion, unified coordinates, and resampling.
RSEI can quickly evaluate the quality of the regional ecological environment. It is constructed by four important natural ecological environment indicators: greenness (NDVI), humidity (WET), heat (LST), and dryness (NDSI). These four factors are closely related to human survival and are also the most important indicators to intuitively represent the quality of the ecological environment. They are often used to evaluate the ecosystem (Gupta et al., 2012; Zhao et al., 1998; Nichol., 2005). The four indexes were integrated through normalization processing and Principal Component Analysis (PCA) (Xu., 2013). In this study, an updated principal component analysis weight factor determination algorithm is applied to determine the weight coefficient of each pixel each year by constructing a unified weight matrix for all images from 2000 to 2020 (He et al., 2021).
Where, NDVI is greenness, which is calculated and obtained by the pixel dichotomy model; WET is humidity, which is obtained by tassel hat transformation of MODIS data (Zhang et al., 2002); LST is the heat, and the temperature correction is converted to the surface temperature LST through the specific emissivity (Nichol., 2005); NDSI is dryness, which is synthesized by bare soil index and building index (Xu., 2008).
Referring to the research of He et al., the results are divided into five grades: Poor, Low, Fair, Good, and Excellent (He et al., 2021). As shown in Table 1.
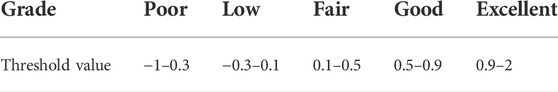
TABLE 1. RSEI classification rules.
Water conservation service is a kind of ecosystem regulation service, which reflects the functions of intercepting rainfall, storing water, and regulating runoff provided by the ecosystem dominated by vegetation. Water conservation service is related to rainfall factor (P), evapotranspiration factor (ET), surface runoff (R), and ecosystem area (A) (Sigel et al., 2010; Liu et al., 2021). This study used the water balance equation to calculate water conservation capacity (Gong et al., 2017):
where WC is water conservation (m³),
Soil conservation service is also a kind of ecosystem regulation service, which mainly reflects the role of the vegetation ecosystem in reducing rainfall erosion and retaining soil. Soil conservation services are mainly related to rainfall factors (R), soil texture factors (k), terrain factors (L, S), vegetation coverage (C), and human management factors (P) (Cai et al., 2000; Lintern et al., 2018; Wischmeier, 1971). This paper uses the Revised Universal Soil Loss Equation (RUSLE) to calculate the amount of soil erosion, and then calculates the amount of soil conservation through the difference between the potential amount of soil erosion and the real amount of soil erosion (Rao et al., 2018; Cao et al., 2019).
Sr = R × K × L × S × C × P
Sp = R × K × L × S
Sk = Sr- Sp
Where, Sk is soil conservation; Sr is the real amount of soil erosion; Sp is the potential amount of soil erosion; R is rainfall erosivity factor, which was calculated based on the method of estimating half monthly rainfall erosivity based on daily precipitation (Zhang et al., 2002); K is soil erodibility factor, which was calculated by Nomogram model (Wischmeier, 1971); L is the slope length factor and S is the slope factor, which was calculated by the calculation formula in the Revised Universal Soil Loss Equation (RUSLE) (Renard et al., 1997); C is the vegetation coverage factor, which was calculated by the relationship between vegetation coverage and factor C (Cai et al., 2000); P is the factor of water and soil conservation measures, which is calculated by the method of assigning value to the land use type based on the research experience (Cao et al., 2018).
The analysis of ecosystem trade-offs and synergies mainly focuses on the analysis of the interaction among soil conservation services (SCS), water conservation services (WCS), and supply services (SS) in the Hexi Corridor ecosystem. It mainly calculates the correlation coefficient and partial correlation coefficient between the two from the pixel scale and judges the trade-off and coordination relationship between ecosystem services according to the positive and negative relationship. If the partial correlation coefficient is positive, it is judged as a synergistic relationship, and if it is negative, it is judged as a trade-off relationship. According to the zero hypothesis test t-test of the partial correlation coefficient, judge the significance of trade-off and synergy (Zhu et al., 2020; Zhu et al., 2022). The calculation formula of the correlation coefficient is as follows:
Where x and y are variables; xm and ym are the multi-year mean values of variables x and y; r is the correlation coefficient of variable x and variable y.
According to the zero hypothesis test t-test method of the correlation coefficient, judge the significance of the correlation between two ecosystem services (Zhu et al., 2022). When t > t0.05 (n-k-2), reject the initial assumptions, and the correlation result is significant. When t > t0.01 (n-k-2), reject the initial assumptions, and the correlation result is very significant. T0.05 (n-k-2) and t0.01 (n-k-2) refer to the t-test table to determine the critical value.
Theil-Sen, a trend analysis method is used to analyze the annual change characteristics of RSEI and ecosystem services. The calculation method of the trend degree is as follows (Wu et al., 2014):
where
The Mann–Kendall (M–K) is used to test the trend significance. It is a non-parametric statistical test method for which measured values do not need to follow a normal distribution, the test is not required to be linear, and that is not affected by missing values and outliers. This study refers to the method of Mann and Kendall for M–K test (Mann., 1945; Kendall., 1975). P is the significance level value of the m-k test feedback. If p < 0.05, there was a significant trend change; if p > 0.05, the β assignment is null.
The bare land area in Hexi Corridor is the largest, accounting for about 70% of the whole region, mainly distributed in the West and North. The natural vegetation (grassland, forest, and shrub) area in the area accounts for about 23.6%, mainly distributed in the Qilian mountains. The area of cropland only accounts for 5.6% of the total area in the study area. The cropland area accounts for 5.6% and is mainly distributed in the northern foot of Qilian Mountains. The impervious composed of urban construction land is distributed in patches around the cropland (Figure 2).
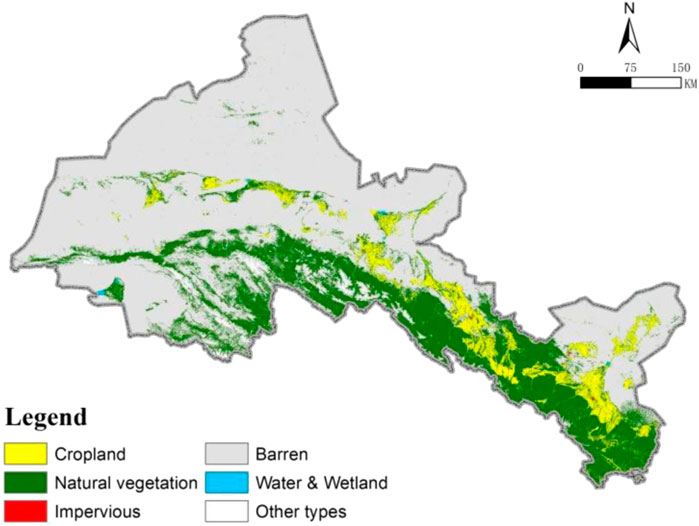
FIGURE 2. Ecosystem distribution in the Hexi Corridor (2020).
From the perspective of change characteristics, the barren area in the Hexi Corridor decreased by 9,864.94 km2 from 2000 to 2020. The area of natural vegetation, cropland, water and wetland, and impervious has increased by 7,141.45, 2281.92,159.07, and 64.59 km2 respectively (Figure 3). From different periods, The natural vegetation increased by 10.7% and 1.2% respectively in the first 10 years and the last 10 years. Water and wetland shows similar change characteristics, and the increase rates in the 2 decades were 33.1% and 17.6% respectively. The area of cropland and impervious showed a linear increase, and the increase rate remained stable during the study period.
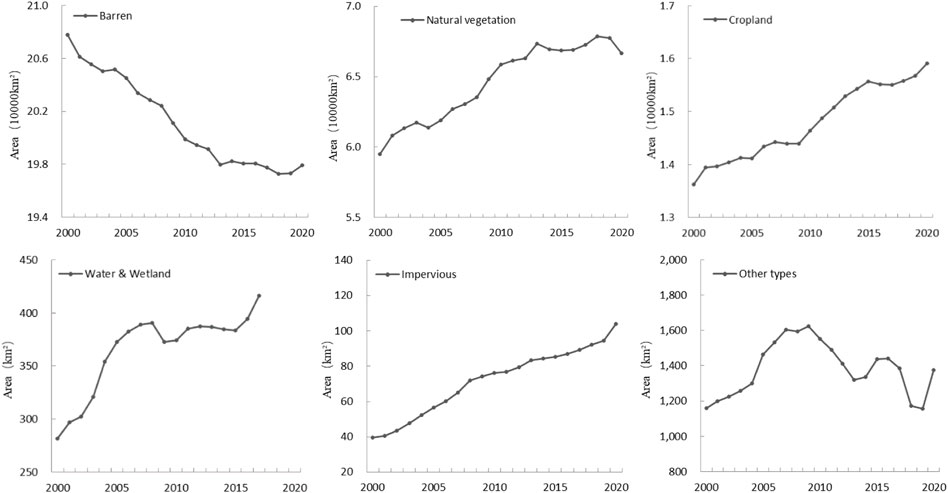
FIGURE 3. Change curves of various ecosystems (2000–2020).
RSEI is used to describe the change in regional ecosystem quality. The area of poor and low-level ecosystem quality accounts for about 90%. Among them, the areas with poor-level ecosystem quality are mainly composed of barren, and the low-level ecosystem quality is mainly distributed in the northern grassland edge of the Qilian Mountains, as well as the desert steppe in the desert and bare land (Figure 2 and Figure 4). The ecosystem quality of excellent and good levels accounts for 0.16% and 2.42% of the total area respectively, which is mainly distributed in river valleys and desert oases such as the Shule River and Heihe River, as well as mountain forests, shrubs, alpine grasslands and alpine meadows in the Qilian Mountains.
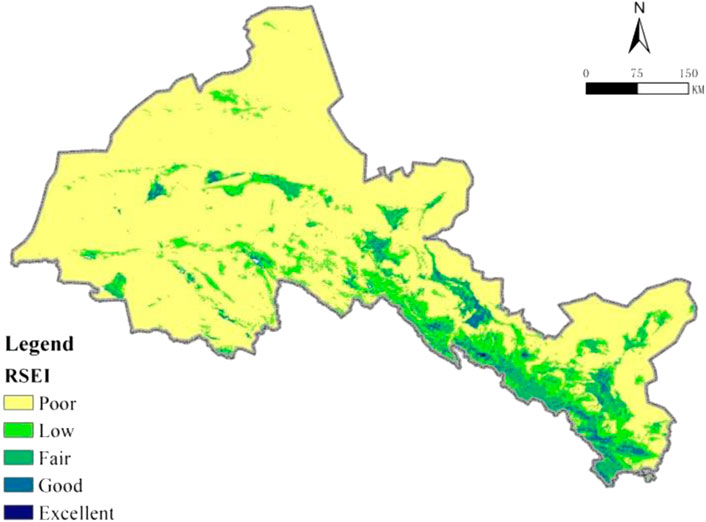
FIGURE 4. Spatial distribution of mean RSEI (2000–2020).
From 2000 to 2020, the overall ecological quality of the Hexi Corridor improved, and the growth rate of RSEI is 0.004/a (p < 0.05). Spatially, about 76.2% of the area has no significant change in RSEI value. 33.5% of the regions showed significant improvement, and only 8.4% of the regions showed a significant downward trend. The areas with significant improvement in ecological quality are distributed in strips from West to East, especially around the farmland in the Middle East. The areas with significantly reduced ecosystem quality are mainly located around the built-up areas of Zhangye, Wuwei, Minqin and other cities (Figure 5).
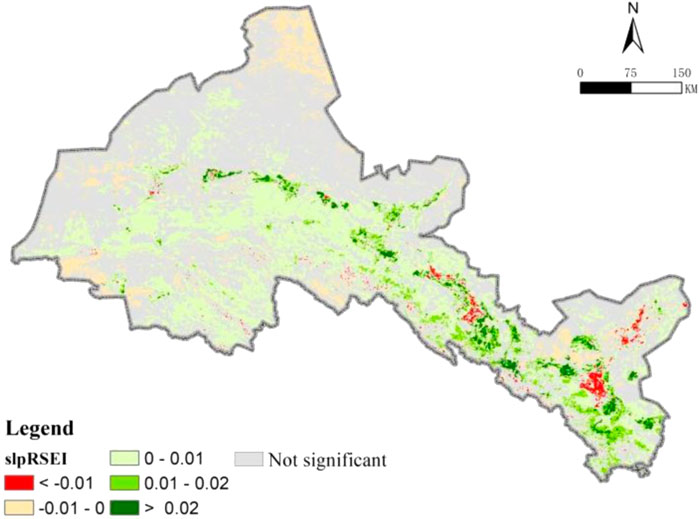
FIGURE 5. Spatial distribution of RSEI trend (2000–2020).
Water conservation capacity is used to characterize the change in water conservation services. From 2000 to 2020, the average water conservation capacity for the last 21 years in the Hexi Corridor is 8,700 m³/km2. Spatially, the areas with high water conservation capacity are mainly located in the Qilian Mountain and the densely populated areas of the Shule River and Heihe River basins, as well as desert oases. The distribution shape is a strip or patch. In these areas, the ecosystem types are mainly natural vegetation and wetlands, and the water conservation volume in some areas is more than 100,000 m³/km2 (Figure 2 and Figure 6). Areas with low water conservation capacity are mainly distributed in the desert with strong evaporation and cropland areas.
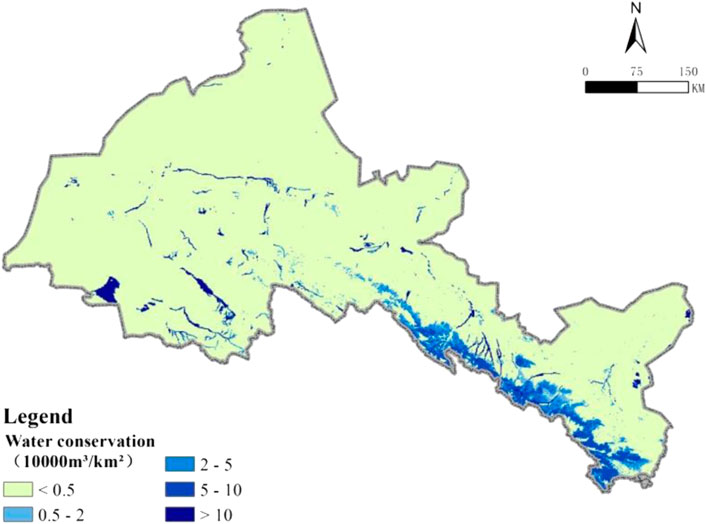
FIGURE 6. Spatial distribution of mean water conservation capacity (2000–2020).
From 2000 to 2020, the water conservation capacity of the Hexi Corridor decreased slightly, with a rate of 100/km2/a (p < 0.05). However, spatially, about 76.2% of the region has no significant change in water conservation services. The area of water conservation services significantly increased by 20.3%, which is more consistent with the high-value area of water conservation dominated by natural vegetation in the Qilian Mountains. The proportion of areas with a significant reduction in water conservation services is only 3.5%. It is distributed in strips at the edge of water bodies and wetlands in the west of the region (Figure 7).
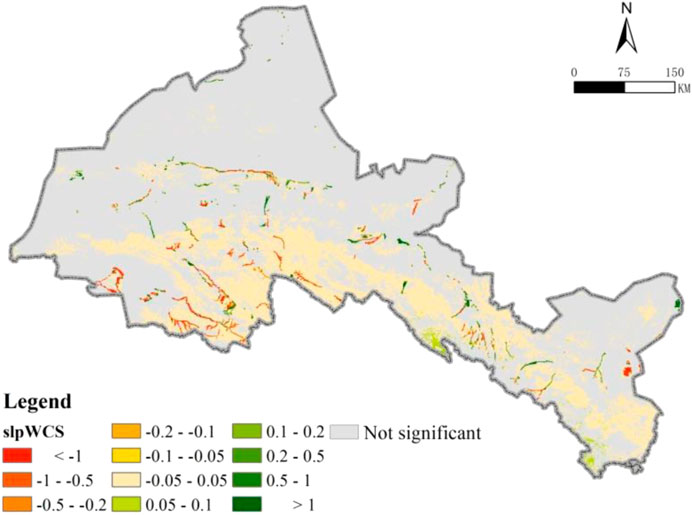
FIGURE 7. Spatial distribution of water conservation capacity trend (2000–2020).
Soil conservation capacity is used to characterize the change in soil conservation services. From 2000 to 2020, the average soil conservation capacity for the last 21 years in the Hexi Corridor is 16.32 t/hm2. The region with high soil conservation capacity is located in the south of the region and distributed along the mountains. It includes not only the areas with good natural vegetation growth in Qilian Mountains but also the strip areas with grassland ecosystem distribution in the central and western regions. Soil conservation in some areas that exceed 100 t/hm2. Areas with low soil conservation capacity are mainly located in widely distributed desert areas, and the value is less than 10 t/hm2 (Figure 8).
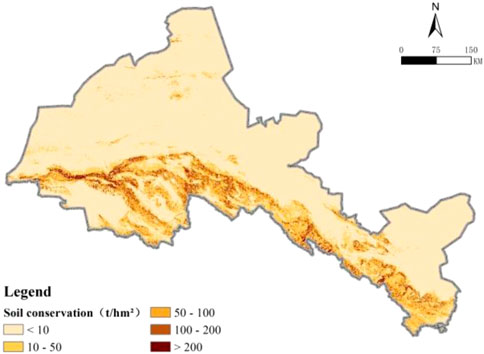
FIGURE 8. Spatial distribution of mean soil conservation capacity (2000–2020).
From 2000 to 2020, the soil conservation capacity in the Hexi Corridor decreased at a rate of -0.04 t/hm2/a (p < 0.05). However, spatially, about 94.3% of the region has no significant change in soil conservation services (Figure 9). The area of soil conservation services significantly increased by 4.0%, which is mainly distributed in the ecotone between farmland, grassland, and desert in the north foot of the Qilian Mountains. The proportion of area with a significant reduction in soil conservation services is only 1.6%. It is mainly distributed in the valley area in the west of the Qilian Mountains and the south of the Shule River Basin.
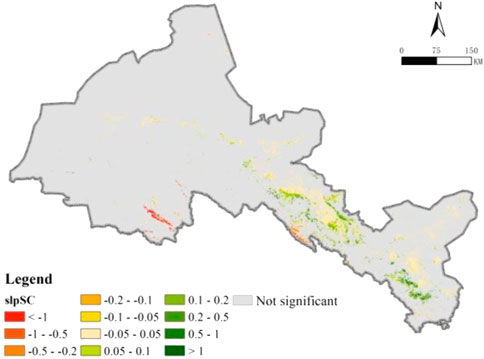
FIGURE 9. Spatial distribution of soil conservation capacity trend (2000–2020).
In this study, NPP was used to characterize the change in ecosystem supply services. From 2000 to 2020, the multi-year average NPP in the Hexi Corridor is 0.05 kgC/m2. The high NPP value area is mainly located in the southeast of the Hexi Corridor, including not only the natural vegetation distribution area of Qilian Mountain but also the farmland ecosystem distribution area in the middle and eastern parts (Figure 10). The NPP of the forest ecosystem in some areas exceeds one kgC/m2. The low-value area of NPP is mainly distributed in a wide range of deserts, and the value is lower than 0.05 kgC/m2.
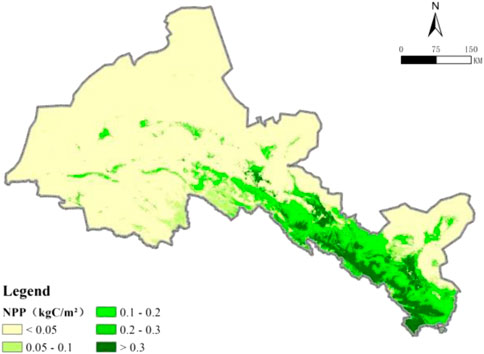
FIGURE 10. Spatial distribution of NPP (2000–2020).
From 2000 to 2020, the increase rate of NPP in the Hexi Corridor is -0.04 t/hm2/a (p < 0.05). Spatially, about 79.7% of the region has no significant change in ecosystem supply service (Figure 11). The proportion of regional areas with significantly improved ecosystem supply services is 20.2%, which is consistent with the spatial distribution of NPP high-value areas. It is mainly located in the southeast of the Hexi Corridor, where the ecosystem is mainly natural vegetation and cropland. The area proportion of ecosystem supply services decreased significantly is only 0.07%, which is more consistent with the desert areas distributed with low NPP value.
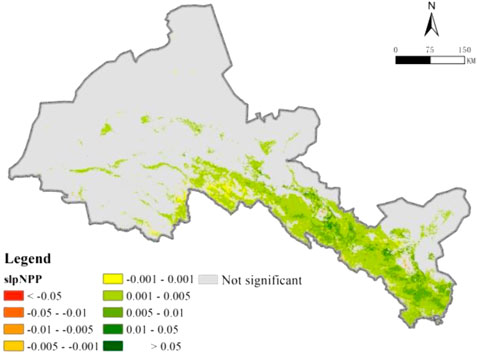
FIGURE 11. Spatial distribution of NPP trend (2000–2020).
Based on the above analysis results, we selected a total of 17 quantitative indicators covering “state change interaction”, and quantitatively estimated the index values of 20 counties in the Hexi Corridor during 2000–2010 and 2010-2020 to comprehensively evaluate the characteristics and laws of spatial-temporal differentiation of ecosystems.
The “Status” indicator shows that there is no significant difference between the two time periods of 2000–2010 and 2010-2020 (Figure 12). Consistent with the previous analysis results, ecosystem structure, quality, and service indicators show a spatial pattern that gradually improves from northwest to southeast on the county scale. The ecosystem background of counties (such as SN, ML, SD, LZ, GL, and TZ) located in the Middle East of the Hexi Corridor and adjacent to the Qilian Mountains is better. Due to the concentrated distribution of water bodies and wetlands, Aksai (AKS) County in the West also has higher water conservation and soil conservation services.
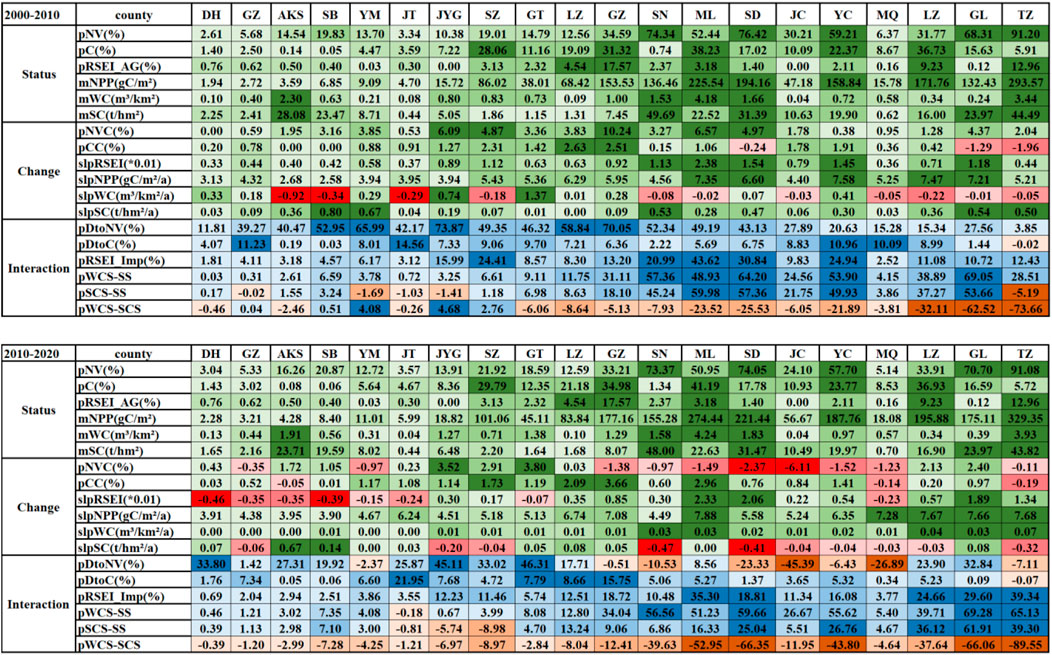
FIGURE 12. Characteristics and changes of ecological assessment indicators in the Hexi Corridor (For the status indicator, green indicates a positive value, red indicates a negative value, and the positive and negative values are classified into four grades and colored. The Change indicator is consistent with the status indicator. The Interaction indicator blue is positive and brown is negative. The coloring rules are consistent with the Status).
The “Change” indicator shows that except for the proportion of natural vegetation area and the change rate of soil conservation, other indicators show spatial gradient gradually increasing from northwest to Southeast, which is similar to the “Status” indicator (Figure 12). However, the changes in natural vegetation and ecosystem services in counties in the central and eastern regions showed significant spatial diversity between 2000-2010 and 2010-2020. In the first decade, the vegetation structure and quality changes in counties with better ecosystem background in the central and eastern regions have improved, but in the next decade, the natural vegetation area of eight counties (GZ, SN, ML, SD, JC, YC, MQ, and TZ) in these counties show a decrease. Combined with the “Interaction” indicator, the main reason is the change of ecosystem structure caused by the type transformation of natural vegetation and desert in these counties. In the first decade, the change in the ecosystem is mainly from desert to natural vegetation, and in the last decade, it is mainly from natural vegetation to desert. Accordingly, water conservation services in five counties (SN, ML, JC, MQ, TZ) have decreased in the first decade and increased in the second decade. Soil conservation services in six counties (SN, SD, JC, YC, MQ, and TZ) showed opposite change characteristics, that is, they increased in the first decade and decreased in the second decade. On the whole, in the past 2 decades, the hotspots of ecosystem quality and service improvement have gradually moved Eastward.
The “Interaction” indicator shows that in the counties located in the Middle East of the Hexi Corridor, the intensity of ecosystem interaction is significantly greater than that in the western region. For example, natural vegetation turns into a desert (mainly in 2010–2020), and the quality level of the ecosystem is significantly improved (Figure 12). At the same time, there is a strong synergy between ecosystem regulation services and supply services in these regions, but there are obvious trade-offs within ecosystem regulation services. Compared with 2000–2010, during 2010–2020, counties with reduced natural vegetation in the central and eastern region (GZ, SN, ML, SD, JC, YC, MQ, and TZ) played a promoting role in the synergy between water conservation and supply services. The synergy between six counties (GZ, ML, JC, YC, MQ, and TZ) is enhanced. However, the synergy between soil conservation and supply services in these eight counties is significantly reduced, and even some regions show trade-offs (such as TZ). For ecosystem regulation services, the trade-off characteristics of water conservation and soil conservation in these eight counties have been significantly strengthened.
For western counties (such as DH, GZ, AKS, SB, YM, and JT), compared with 2000–2010, the ecosystem quality decreased from 2010 to 2020 (RSEI showed a downward trend). “Change” and “Interaction” indicators show that soil conservation and water conservation also show opposite changes. That is, the amount of water conservation increases while the amount of soil conservation decreases. At the same time, the trade-off between water conservation and soil conservation is more obvious. However, different from the counties in the middle and eastern regions, the synergy of ecosystem regulation and supply services has been strengthened on the whole.
pNV: Proportion of natural vegetation area (%); pC: Proportion of cropland area (%); mRSEI: Proportion of area above good grade RSEI (%); mNPP: Mean value of NPP(gC/m2); mWC: Mean value of Water Conservation (m³/km2); mSC: Mean value of Soil Conservation (t/hm2); pcNV: Proportion change of natural vegetation area (%); pCC: Proportion change of cropland area (%); slpRSEI: Slope of RSEI (*0.01); slpNPP: Slope of NPP(gC/m2); slpWC: Slope of Water Conservation (m³/km2); slpSC: Slope of Soil Conservation (t/hm2); pDtoNV: Proportion of desert to natural vegetation area in total area change (%); pDtoC: Proportion of desert to cropland area in total area change (%); pRSEI_Imp: Proportion of RSEI grade improvement area (%); pWCS-SS: Proportion of synergy minus trade-off area between WCS and SS; pSCS-SS: Proportion of synergy minus trade-off area between SCS and SS(%); pWCS-SCS: Proportion of trade-off minus synergy area between WCS and SCS(%).
Analyzing the characteristics and long-term sequence changes of ecosystem structure, quality, and service in the Hexi Corridor from the macro-regional scale is beneficial to grasp the basic characteristics of the regional ecosystem from the perspective of arid and semi-arid complete geographical unit and put forward strategic decisions from the perspective of regional ecosystem protection and ecological security maintenance (Scholes et al., 2013; Turner et al., 2016). At the same time, we put more emphasis on the quantitative analysis of the spatial differentiation characteristics and laws of ecosystems. For example, taking the county as the basic unit in space, we analyzed the ecosystem characteristics and changes of the Hexi Corridor in 2000–2010 and 2010-2020. These analyses not only refine the characteristics of macroecological changes but also help to analyze the causes of these changes. It also reveals some characteristics of ecosystem laws that have been covered up in the macro pattern analysis. For example, ecosystem services synergies and trade-offs, spatial differentiation, and differences in influencing factors. It can be seen that multi-scale ecosystem comprehensive assessment, especially the scale coupling analysis of geographical units and administrative units, is beneficial to the integration of strategic decisions and the implementation of specific policies and measures for ecosystem protection.
Our results show that compared with the regions with poor ecosystem backgrounds, the regions with good ecosystem backgrounds in the Hexi Corridor show better spatial similarity. It includes not only the consistent changes in the structure, quality, and services of natural ecosystems, but also the more obvious synergy or trade-off effects of ecosystem services in these regions. This is consistent with the typical climatic characteristics of drought and little rain in drylands and the spatial pattern of water resource shortage. In other words, the capacity of resources and the environment is the basis and main determinant of the ecosystem and services in the Hexi Corridor. Previous studies have shown that the increase of vegetation in arid and semi-arid areas can fix the soil to a certain extent, but it will also bring greater vegetation evaporation, increase regional water consumption, and change the local hydrological characteristics and hydrological cycle process (Lian et al., 2021; Yao et al., 2021; Zhao et al., 2021). This is consistent with the changing trend of water conservation and soil conservation services in the opposite direction found in our study. There are also obvious spatial differences between the East and west of the Hexi Corridor in terms of the impact of ecosystem changes on the synergy and trade-off between ecosystem services, especially the relationship between ecosystem regulation and supply services. This spatial difference is related to the way of ecosystem change in the East and west of the region. For example, the change in the ecosystem in the eastern part of the region is mainly due to the transformation of natural vegetation into the desert, and in the western part is mainly due to the reduction of the quality of the vegetation ecosystem. Therefore, soil conservation services may be more sensitive to changes in land use patterns than changes in vegetation quality (Quétier et al., 2007; Liu et al., 2020; Wuepper et al., 2020). However, the desert in the west of the Hexi Corridor is widely distributed and covers a large area, and the ecosystem is fragile as a whole, which is vulnerable to the impact of interannual climate fluctuations. Coupled with the superposition effect of a small increase in natural vegetation in the region (such as GZ and YM), it may significantly change the relationship between ecosystem services in the region. For example, we found that the natural vegetation area of YM and GZ decreased by 0.97%, but the trade-off between ecosystem regulation and supply services changed in the opposite direction.
First, we choose comprehensive ecosystem assessment indicators as far as possible and also focus on ecosystem services and the relationship between them. The evaluation results reflect the high spatial-temporal consistency of the region. The cause analysis of these characteristics and change laws is still insufficient, which needs more ground investigations and even control experiments at the level of ecological process mechanism to prove and explain (Díaz et al., 2007; Lavorel et al., 2011; Lavorel and Grigulis., 2012; Carlucci et al., 2020). Therefore, in more space-time scales, integrating multi-source data to build quantitative ecosystem assessment indicators and frameworks is an important means and development direction to solve such problems. Second, this study mainly uses satellite remote sensing images with a medium and low spatial resolution (30 m–1000 m), and the detailed description of ecosystems in arid and semi-arid regions with less and sparse vegetation distribution is still limited. In the future, relying on multi-source satellite remote sensing data, we will develop more sensitive ecosystem change assessment indicators to improve the spatial-temporal resolution and information extraction accuracy of the indicators, It is one of the key ways to improve the scientificity and effectiveness of evaluation from technical means (Pettorelli et al., 2018; Río-Mena et al., 2020). Third, the dryland ecological environment is fragile, the relationship between man and land is tense, and it is very sensitive to climate change. It is also an important region for global sustainable development. The urban expansion and resource utilization of drylands have a greater impact on the natural ecosystem, and the indirect impact of urban expansion is even much greater than the direct impact (Zeng et al., 2021; Ren et al., 2022). Therefore, in the future, it is necessary to further effectively couple ecosystem assessment with socio-economic development characteristics and sustainable development goals, and build more operable decision-making tools for dryland ecosystem protection and management (Fu et al., 2021).
According to the background characteristics of the dryland ecosystem, quantitatively evaluating the spatial-temporal pattern and change law of ecosystem elements and relationships from different spatial-temporal scales is the scientific basis and prerequisite for formulating regional ecosystem protection and management strategies according to local conditions. Our research has three main conclusions:
1) From west to East, the ecosystem status, change, and interaction in the Hexi Corridor have similar spatial distribution patterns. Counties with good ecosystem backgrounds in the East (such as SN, ML, SD, LZ, GL, and TZ) have the most obvious improvement in ecosystem quality and services, which can provide more ecosystem services for the region. At the same time, the synergy of ecosystem supply and regulation services and the trade-off within ecosystem regulation services are the most obvious areas in the Hexi Corridor. In the counties with poor ecosystem backgrounds in the west, the fragile ecosystem represented by desert accounts for a relatively large area, the fluctuation characteristics of ecosystem quality are obvious, and the capacity of regulation and supply services are insufficient.
2) From 2000 to 2020, the ecosystem condition of the Hexi Corridor improved as a whole. The natural vegetation area in the Hexi Corridor has increased by 7,141.45 km2 as a whole, and the desert area has decreased by 9,864.94 km2. The quality of the regional ecosystem in more than one-third of the Hexi Corridor has been significantly improved. Although the mean water conservation and soil conservation in the Hexi Corridor decreased slightly, the areas of water conservation services and soil conservation services significantly increased were more than 6 times and 3 times the significantly reduced areas, respectively. From the perspective of different periods, the spatial differences between ecosystem changes in the first decade (2000–2010) and the second decade (2010-2020) are obvious. It is mainly reflected in the transformation of natural vegetation into the desert in most counties in the East in the next decade, resulting in a decline in the proportion of natural vegetation area. The research shows that compared with the previous decade, the hotspots of improving ecosystem quality and services in the Hexi Corridor have gradually moved eastward in the latter decade.
3) Ecosystem change can significantly change the quantity and relationship of ecosystem services, but the impact mode and spatial differences are obvious. In the region with good ecosystem background in the Middle East of the region, the loss of natural vegetation not only improves water conservation services but also enhances its synergy with product supply services. On the contrary, soil conservation services in these areas have declined, and the synergy with supply services has been significantly weakened. The trade-off between water conservation and soil conservation has also been strengthened. However, in the region with poor ecosystem background in the west of the region, although the reduction of ecosystem quality has also strengthened the trade-off characteristics of water conservation and soil conservation services, the synergy of ecosystem regulation and supply services has been strengthened.
The raw data supporting the conclusion of this article will be made available by the authors, without undue reservation.
HZ: Conceptualization, formal analysis, methodology, and writing—original draft. JZ and PH: Conceptualization, methodology, designing, supervision, project administration, and writing—review and editing. HG: Methodology, validation, and writing—review, and editing. YH, DJ, and NX: Data collection. All authors discussed the results and conclusion.
This work was supported by the National Key R&D Program of China (2021YFF0703903) and Regular Remote Sensing Survey and Assessment of National Ecological Status of China (Grant No. 22110499001001).
The authors would like to thank the editors and reviewers for their detailed and constructive comments, which helped to significantly improve the manuscript.
The authors declare that the research was conducted in the absence of any commercial or financial relationships that could be construed as a potential conflict of interest.
All claims expressed in this article are solely those of the authors and do not necessarily represent those of their affiliated organizations, or those of the publisher, the editors and the reviewers. Any product that may be evaluated in this article, or claim that may be made by its manufacturer, is not guaranteed or endorsed by the publisher.
Alexander, S., Aronson, J., Whaley, O., and Lamb, D. (2016). The relationship between ecological restoration and the ecosystem services concept. Ecol. Soc. 21 (1), art34. doi:10.5751/es-08288-210134
Araujo Barbosa, C. C., Atkinson, P. M., and Dearing, J. A. (2015). Remote sensing of ecosystem services: A systematic review. Ecol. Indic. 52, 430–443. doi:10.1016/j.ecolind.2015.01.007
Assaf, C., Adams, C., Ferreira, F. F., and França, H. (2021). Land use and cover modeling as a tool for analyzing nature conservation policies–A case study of Juréia-Itatins. Land use policy 100, 104895. doi:10.1016/j.landusepol.2020.104895
Ayanu, Y. Z., Conrad, C., Nauss, T., Wegmann, M., and Koellner, T. (2012). Quantifying and mapping ecosystem services supplies and demands: A review of remote sensing applications. Environ. Sci. Technol. 46 (16), 8529–8541. doi:10.1021/es300157u
Cai, C. F., Ding, S. W., Shi, Z. H., Huang, L., and Zhang, G. Y. (2000). Study of applying USLE and geographical information system IDRISI to predict soil erosion in small watershed. J. Soil Water Conservation 14 (02), 19–24. doi:10.3321/j.issn:1009-2242.2000.02.005
Cao, S., Xia, C., Yue, H., Ma, H., and Lin, G. (2018). Targeted control measures for ecological restoration in Western Fujian, China. Land Use Policy 76, 186–192. doi:10.1016/j.landusepol.2018.05.012
Cao, W., Liu, L. L., Wu, D., and Huang, L. (2019). Spatial and temporal variations and the importance of hierarchy of ecosystem functions in the Three-River-Source National Park. Acta Ecol. Sin. 39 (4), 1361–1374. doi:10.5846/stxb201807311629
Cao, W., Liu, L. L., and Wu, D. (2018). Soil erosion changes and driving factors in the Three - river Headwaters region. Acta Prataculturae Sin. 27 (06), 10–22. doi:10.11686/cyxb2017359
Carlucci, M. B., Brancalion, P. H., Rodrigues, R. R., Loyola, R., and Cianciaruso, M. V. (2020). Functional traits and ecosystem services in ecological restoration. Restor. Ecol. 28 (6), 1372–1383. doi:10.1111/rec.13279
Copeland, S. M., Baughman, O. W., Boyd, C. S., Davies, K. W., Kerby, J., Kildisheva, O. A., et al. (2021). Improving restoration success through a precision restoration framework. Restor. Ecol. 29 (2), e13348. doi:10.1111/rec.13348
DeFries, R., Karanth, K. K., and Pareeth, S. (2010). Interactions between protected areas and their surroundings in human-dominated tropical landscapes. Biol. Conserv. 143 (12), 2870–2880. doi:10.1016/j.biocon.2010.02.010
Díaz, S., Lavorel, S., de Bello, F., Quétier, F., Grigulis, K., and Robson, T. M. (2007). Incorporating plant functional diversity effects in ecosystem service assessments. Proc. Natl. Acad. Sci. U. S. A. 104 (52), 20684–20689. doi:10.1073/pnas.0704716104
Etter, A., Andrade, A., Nelson, C. R., Cortés, J., and Saavedra, K. (2020). Assessing restoration priorities for high-risk ecosystems: An application of the IUCN red list of ecosystems. Land Use Policy 99, 104874. doi:10.1016/j.landusepol.2020.104874
Fischer, J., Riechers, M., Loos, J., Martin-Lopez, B., and Temperton, V. M. (2021). Making the UN decade on ecosystem restoration a social-ecological endeavour. Trends Ecol. Evol. 36 (1), 20–28. doi:10.1016/j.tree.2020.08.018
Fu, B., Stafford-Smith, M., Wang, Y., Wu, B., Yu, X., Lv, N., et al. (2021). The global-DEP conceptual framework—Research on dryland ecosystems to promote sustainability. Curr. Opin. Environ. Sustain. 48, 17–28. doi:10.1016/j.cosust.2020.08.009
Gong, S. H., Xiao, Y., Zheng, H., Xiao, Y., and Ouyang, Z. Y. (2017). Spatial patterns of ecosystem water conservation in China and its impact factors analysis. Acta Ecol. Sin. 37, 2455–2462. doi:10.5846/stxb201512012406
Gupta, K., Kumar, P., Pathan, S. K., and Sharma, K. P. (2012). Urban Neighborhood Green Index–A measure of green spaces in urban areas. Landsc. Urban Plan. 105, 325–335. doi:10.1016/j.landurbplan.2012.01.003
He, Y. L., You, N. S., Cui, Y. P., Xiao, T., Hao, Y. Y., and Dong, J. W. (2021). Spatio-temporal changes in remote sensing-based ecological index in China since 2000. J. Nat. Resour. 36 (05), 1176–1185. doi:10.31497/zrzyxb.20210507
Hou, P., Wang, Q., Shen, W. M., Zhai, J., Liu, H. M., and Yang, M. (2015). Progress of integrated ecosystem assessment: Concept, framework and challenges. Geogr. Res. 34 (10), 1809–1823. (in Chinese). doi:10.11821/dlyj201510001
Jiang, H., Wu, W., Wang, J., Yang, W., Gao, Y., Duan, Y., et al. (2021). Mapping global value of terrestrial ecosystem services by countries. Ecosyst. Serv. 52, 101361. doi:10.1016/j.ecoser.2021.101361
Kandziora, M., Burkhard, B., and Müller, F. (2013). Interactions of ecosystem properties, ecosystem integrity and ecosystem service indicators—a theoretical matrix exercise. Ecol. Indic. 28, 54–78. doi:10.1016/j.ecolind.2012.09.006
Kazenel, M. R., Wright, K. W., Bettinelli, J., Griswold, T. L., Whitney, K. D., and Rudgers, J. A. (2020). Predicting changes in bee assemblages following state transitions at North American dryland ecotones. Sci. Rep. 10 (1), 708–715. doi:10.1038/s41598-020-57553-2
Lavorel, S., and Grigulis, K. (2012). How fundamental plant functional trait relationships scale‐up to trade‐offs and synergies in ecosystem services. J. Ecol. 100 (1), 128–140. doi:10.1111/j.1365-2745.2011.01914.x
Lavorel, S., Grigulis, K., Lamarque, P., Colace, M. P., Garden, D., Girel, J., et al. (2011). Using plant functional traits to understand the landscape distribution of multiple ecosystem services. J. Ecol. 99 (1), 135–147. doi:10.1111/j.1365-2745.2010.01753.x
Le Saout, S., Hoffmann, M., Shi, Y., Hughes, A., Bernard, C., Brooks, T. M., et al. (2013). Protected areas and effective biodiversity conservation. Science 342 (6160), 803–805. doi:10.1126/science.1239268
Li, C., Fu, B., Wang, S., Stringer, L. C., Wang, Y., Li, Z., et al. (2021). Drivers and impacts of changes in China’s drylands. Nat. Rev. Earth Environ. 2 (12), 858–873. doi:10.1038/s43017-021-00226-z
Li, D., Wu, S., Liu, L., Zhang, Y., and Li, S. (2018). Vulnerability of the global terrestrial ecosystems to climate change. Glob. Chang. Biol. 24 (9), 4095–4106. doi:10.1111/gcb.14327
Li, R., Zheng, H., O’Connor, P., Xu, H., Li, Y., Lu, F., et al. (2021). Time and space catch up with restoration programs that ignore ecosystem service trade-offs. Sci. Adv. 7 (14), eabf8650. doi:10.1126/sciadv.abf8650
Li, T., Jia, Y., Fava, F., Xu, Z., Zhu, J., Yang, Y., et al. (2021). A geographic identification of sustainable development obstacles and countermeasures in drylands: A case study in inner Mongolia, China. Ecol. Indic. 132, 108257. doi:10.1016/j.ecolind.2021.108257
Lian, X., Piao, S., Chen, A., Huntingford, C., Roderick, M. L., Li, L. Z. X., et al. (2021). Multifaceted characteristics of dryland aridity changes in a warming world. Nat. Rev. Earth Environ. 2 (4), 232–250. doi:10.1038/s43017-021-00144-0
Lintern, A., Webb, J., Ryu, D., Liu, S., Bende‐Michl, U., Waters, D., et al. (2018). Key factors influencing differences in stream water quality across space. WIREs Water 5 (1), e1260. doi:10.1002/wat2.1260
Liu, H., Liu, Y., Wang, K., and Zhao, W. (2020). Soil conservation efficiency assessment based on land use scenarios in the Nile River Basin. Ecol. Indic. 119, 106864. doi:10.1016/j.ecolind.2020.106864
Liu, J., Milne, R. I., Cadotte, M. W., Wu, Z. Y., Provan, J., Zhu, G. F., et al. (2018). Protect Third Pole's fragile ecosystem. Science 362 (6421), 1368. doi:10.1126/science.aaw0443
Liu, S., Ryu, D., Webb, J. A., Lintern, A., Guo, D., Waters, D., et al. (2021). A Bayesian approach to understanding the key factors influencing temporal variability in stream water quality- a case study in the Great Barrier Reef catchments. Hydrol. Earth Syst. Sci. 25, 2663–2683. doi:10.5194/hess-25-2663-2021
Liu, Z., Ding, M., He, C., Li, J., and Wu, J. (2019). The impairment of environmental sustainability due to rapid urbanization in the dryland region of northern China. Landsc. Urban Plan. 187, 165–180. doi:10.1016/j.landurbplan.2018.10.020
Mann, H. B. (1945). Nonparametric tests against trend. Econometrica 13 (3), 245–259. doi:10.2307/1907187
Murcia, C., Aronson, J., Kattan, G. H., Moreno-Mateos, D., Dixon, K., and Simberloff, D. (2014). A critique of the ‘novel ecosystem’concept. Trends Ecol. Evol. 29 (10), 548–553. doi:10.1016/j.tree.2014.07.006
Nichol, J. (2005). Remote sensing of urban heat islands by day and night. Photogramm. Eng. remote Sens. 71 (6), 613–621. doi:10.14358/pers.71.5.613
Nilsson, C., Aradottir, A. L., Hagen, D., Halldórsson, G., Høegh, K., Mitchell, R. J., et al. (2016). Evaluating the process of ecological restoration. Ecol. Soc. 21 (1), art41. doi:10.5751/es-08289-210141
Pettorelli, N., Tulloch, A., Dubois, G., Macinnis-Ng, C., Queiróueir, H., and Nicholson, E. (2018). Schulte to BhhneSatellite remote sensing of ecosystem functions: Opportunities, challenges and way forward. Remote Sens. Ecol. Conserv. 4 (2), 71–93. doi:10.1002/rse2.59
Quétier, F., Lavorel, S., Thuiller, W., and Davies, I. (2007). Plant - trait - based modeling assessment of ecosystem‐service sensitivity to land-use change. Ecol. Appl. 17 (8), 2377–2386. doi:10.1890/06-0750.1
Rao, E. M., and Xiao, Y. (2018). Spatial characteristics and effects of soil conservation service in Sichuan Province. Acta Ecol. Sin. 38 (24), 8741–8749. doi:10.5846/stxb201806011217
Ren, Q., He, C., Huang, Q., Shi, P., Zhang, D., and Güneralp, B. (2022). Impacts of urban expansion on natural habitats in global drylands. Nat. Sustain. 2022, 1–10. doi:10.1038/s41893-022-00930-8
Renard, K. G., Foster, G. R., and Weesies, G. A. (1997). Predicting soil erosion by water: A guide to conservation planning with the revised universal soil loss equation (RUSLE). Washington, US: Department of Agriculture.
Río-Mena, T., Willemen, L., Tesfamariam, G. T., Beukes, O., and Nelson, A. (2020). Remote sensing for mapping ecosystem services to support evaluation of ecological restoration interventions in an arid landscape. Ecol. Indic. 113, 106182. doi:10.1016/j.ecolind.2020.106182
Scholes, R. J., Reyers, B., Biggs, R., Spierenburg, M. J., and Duriappah, A. (2013). Multi-scale and cross-scale assessments of social–ecological systems and their ecosystem services. Curr. Opin. Environ. Sustain. 5 (1), 16–25. doi:10.1016/j.cosust.2013.01.004
Shen, Z., Zhang, Q., Piao, S., Peñuelas, J., Stenseth, N. C., Chen, D., et al. (2021). Mining can exacerbate global degradation of dryland. Geophys. Res. Lett. 48 (21), e2021GL094490. doi:10.1029/2021gl094490
Sigel, B. J., Robinson, W. D., and Sherry, T. W. (2010). Comparing bird community responses to forest fragmentation in two lowland Central American reserves. Biol. Conserv. 143 (2), 340–350. doi:10.1016/j.biocon.2009.10.020
Sun, Q. K., Zhou, L., Tang, X. L., Sun, D. Q., and Dang, X. W. (2021). Spatial influence and prediction of oasis urban expansion oncultivated land in arid areas:A case study of the Hexi Corridor. J. Nat. Resour. 36 (04), 1008–1020. doi:10.31497/zrzyxb.20210415
Sun, Y. X., Liu, S. L., Shi, F. N., An, Y., Liu, Y. X., and Yixuan, L. (2020). Spatio-temporal variations and coupling of human activity intensity and ecosystem services based on the four-quadrant model on the Qinghai-Tibet Plateau. Sci. Total Environ. 743, 140721. doi:10.1016/j.scitotenv.2020.140721
Tong, X., Wang, K., Yue, Y., Brandt, M., Liu, B., Zhang, C., et al. (2017). Quantifying the effectiveness of ecological restoration projects on long-term vegetation dynamics in the karst regions of Southwest China. Int. J. Appl. Earth Observation Geoinformation 54, 105–113. doi:10.1016/j.jag.2016.09.013
Turner, K. G., Anderson, S., Gonzales-Chang, M., Costanza, R., Courville, S., Dalgaard, T., et al. (2016). A review of methods, data, and models to assess changes in the value of ecosystem services from land degradation and restoration. Ecol. Model. 319, 190–207. doi:10.1016/j.ecolmodel.2015.07.017
Wang, Q., and Ouyang, Z. Y. (2014). Eeo-environment investigation and assessment from 2000 to 2010 with remote sensing of China. Beijing: Science Press. (in Chinese).
Wang, S. H., Huang, L., Xu, X. L., and Xu, S. W. (2020). Spatial and temporal evolution of ecosystem services and its trade-offs and synergies in Guangdong-Hongkong-Macao Greater Bay Area. Acta Ecol. Sin. 40 (23), 8403–8416. doi:10.5846/stxb202003270717
Watson, J. E., Dudley, N., Segan, D. B., and Hockings, M. (2014). The performance and potential of protected areas. Nature 515 (7525), 67–73. doi:10.1038/nature13947
Wischmeier, W. H. (1971). A soil erodibility nomograph for farmland and construction sites. J. Soil Water Conservation 26, 189–193. doi:10.2307/3896643
Wu, D. H., Wu, H., Zhao, X., Zhou, T., Tang, B., Zhao, W. Q., et al. (2014). Evaluation of spatiotemporal variations of global fractional vegetation cover based on GIMMS NDVI data from 1982 to 2011. Remote Sens. (Basel). 6, 4217–4239. doi:10.3390/rs6054217
Wuepper, D., Borrelli, P., and Finger, R. (2020). Countries and the global rate of soil erosion. Nat. Sustain. 3 (1), 51–55. doi:10.1038/s41893-019-0438-4
Xu, H. Q. (2008). A new index for delineating built-up land features in satellite imagery. Int. J. Remote Sens. 29 (14), 4269–4276. doi:10.1080/01431160802039957
Xu, H. Q. (2013). Remote sensing index for assessment of regional ecological changes. China Environ. Sci. 33 (05), 889–897. doi:10.3969/j.issn.1000-6923.2013.05.019
Yan, H. M., Zhen, L., Li, F. Y., Du, B. Z., Pan, L. H., Xiang, Q., et al. (2012). Measurement method of reasonable consumption for ecosystem productivity supply service:A case study of Inner Mongolia grassland transect. Resour. Sci. 34 (06), 998–1006.
Yang, J., and Huang, X. (2021). The 30 m annual land cover dataset and its dynamics in China from 1990 to 2019. Earth Syst. Sci. Data 13 (8), 3907–3925. doi:10.5194/essd-13-3907-2021
Yao, Y., Fu, B., Liu, Y., Wang, Y., and Song, S. (2021). The contribution of ecosystem restoration to sustainable development goals in asian drylands: A literature review. Land Degrad. Dev. 32 (16), 4472–4483. doi:10.1002/ldr.4065
Zeng, H., Wu, B., Zhang, M., Zhang, N., Elnashar, A., Zhu, L., et al. (2021). Dryland ecosystem dynamic change and its drivers in Mediterranean region. Curr. Opin. Environ. Sustain. 48, 59–67. doi:10.1016/j.cosust.2020.10.013
Zhang, W. B., Xie, Y., and Liu, B. Y. (2002). Rainfall erosivity estimation using daily rainfall amounts. Sci. Geogr. Sin. 22 (6), 705–711. doi:10.13249/j.cnki.sgs.2002.06.705
Zhang, X. Y., Schaaf, B., Friedl, M. A., Strahler, A. H., and Hodges, J. (2002). MODIS tasseled cap transformation and its utility. IEEE Int. Geoscience Remote Sens. Symposium 2002, 1063–1065. doi:10.1109/IGARSS.2002.10257765
Zhang, Y., Zhao, Z., Fu, B., Ma, R., Yang, Y., Lü, Y., et al. (2022). Identifying ecological security patterns based on the supply, demand and sensitivity of ecosystem service: A case study in the yellow River basin, China. J. Environ. Manag. 315, 115158. doi:10.1016/j.jenvman.2022.115158
Zhao, M., Zhang, J., Velicogna, I., Liang, C., and Li, Z. (2021). Ecological restoration impact on total terrestrial water storage. Nat. Sustain. 4 (1), 56–62. doi:10.1038/s41893-020-00600-7
Zhu, H. S., Zai, J., Hou, P., Wang, Q., Chen, Y., Jin, D. D., et al. (2022). The protection characteristics of key ecological functional zones from the perspective of ecosystem service trade-off and synergy. Acta Geogr. Sin. 77 (5), 1275–1288. doi:10.11821/dlxb202205016
Keywords: ecosystem, ecosystem service, trade-offs and synergies, county, Hexi Corridor
Citation: Zhu H, Zhai J, Hou P, Gao H, He Y, Jin D and Xu N (2022) Divergent trends of ecosystem status and services in the Hexi Corridor. Front. Environ. Sci. 10:1008441. doi: 10.3389/fenvs.2022.1008441
Received: 31 July 2022; Accepted: 05 September 2022;
Published: 27 September 2022.
Edited by:
Hongbo Ling, Xinjiang Institute of Ecology and Geography (CAS), ChinaReviewed by:
Shuci Liu, Nanjing University of Information Science and Technology, ChinaCopyright © 2022 Zhu, Zhai, Hou, Gao, He, Jin and Xu. This is an open-access article distributed under the terms of the Creative Commons Attribution License (CC BY). The use, distribution or reproduction in other forums is permitted, provided the original author(s) and the copyright owner(s) are credited and that the original publication in this journal is cited, in accordance with accepted academic practice. No use, distribution or reproduction is permitted which does not comply with these terms.
*Correspondence: Jun Zhai, emhhaWpAbHJlaXMuYWMuY24=; Peng Hou, aG91cGN5QDE2My5jb20=
Disclaimer: All claims expressed in this article are solely those of the authors and do not necessarily represent those of their affiliated organizations, or those of the publisher, the editors and the reviewers. Any product that may be evaluated in this article or claim that may be made by its manufacturer is not guaranteed or endorsed by the publisher.
Research integrity at Frontiers
Learn more about the work of our research integrity team to safeguard the quality of each article we publish.