- 1College of Landscape Architecture, Northeast Forestry University, Harbin, China
- 2Key Laboratory for Garden Plant Germplasm Development and Landscape Eco-Restoration in Cold Regions of Heilongjiang Province, Harbin, China
- 3School of Design, The University of Western Australia, Perth, WA, Australia
China, like many other countries in the world, has declining biodiversity caused by urbanization. Urban parks are a patchwork of distinct biotopes and have significant conservation value for biodiversity. Biotope mapping is an essential tool for urban biodiversity conservation, ecological spatial planning and ecosystem management, however there are few studies on it in China. This study explores a practical scheme of biotope classification, assessment and application for urban parks. The classification scheme which integrated vegetation structure was updated to make it clearer and more appropriate for urban parks in factor selection and grade. To identify problems in the biotope, the assessment tool assessed biotope fragmentation and spontaneous vegetation diversity. The number of patches (NP), mean patch size (MPS) and fragmentation index (FI) were used to measure biotope fragmentation, and for species level the richness index and the Jaccard index were selected. These methods were applied to Riverside Park, Yichang as a case study site to verify the applicability and explore methods for biodiversity conservation and restoration based on biotope mapping. The results show that this classification scheme has the potential to become a standard system for urban parks in China, according to the advantages of recognition of human activities and other species, and easy learning. It is also shows that the evaluation method integrating fragmentation and diversity is feasible and reliable to identify the problems of biotope types, and practical strategies are developed according to the assessment results. Our findings provide guidance and reference for professionals on a new method to take urban biodiversity conservation and restoration from research to practice.
Introduction
Biodiversity is the basis of human survival and development. However, the intense and frequent human activities brought by rapid urbanization leads to the loss and fragmentation of natural biotope in city, which is the main reason for the decline of biodiversity (Mckinney, 2002; Hanski, 2006). Urban parks provide a high number of ecosystem services, such as reducing urban heat island effect (Sukopp and Werner, 1983) and mitigating extreme climate (Deutscher et al., 2019), which are one of the valuable components of urban green infrastructure (Czortek and Pielech, 2020). They are not only recreation places for urban dwellers and playgrounds for children, but also habitats and shelters for wildlife in the city (Palliwoda et al., 2017), which can be a hotspot of urban biodiversity (Tertilt, 2011). Most studies on urban parks include biodiversity assessment methods (Hermy and Cornelis, 2000; Cornelis and Hermy, 2004) and their driving factors (Li et al., 2018; Czortek and Pielech, 2020), sustainable planning and management schemes (Stewart et al., 2009; Ignatieva and Hedblom, 2018) and ecological service functions (Palliwoda et al., 2017). However, biotope loss has a negative impact on biodiversity (Hanski, 2006), but little is known about the composition, spatial pattern, quality and problems of biotopes in urban parks.
Biotope mapping is a process of obtaining and interpreting the ecological data dominated by animals and plants through investigation, so as to form a comprehensive information map (Li et al., 2003; Qiu et al., 2010). The mapping not only reveals the spatial distribution characteristics of different biotope types, but also provides some ecological data for urban ecological planning and biodiversity conservation strategies formulation (Sukopp and Weiler, 1988; Mansuroglu et al., 2006). In the 1980s, Germany was the first to carry out biotope mapping in cities (Sukopp and Weiler, 1988), and constantly updated and improved the standardized scientific methods of it. Rapidly, the “German experience” spread to United Kingdom (Sotheran et al., 1997), Sweden (Cousins and Ihse, 1998) and Greece (Boteva et al., 2004) and other countries, and these countries have explored new methods for the classification and assessment of biotope to make it applicable in their countries, according to their characteristics of geography, culture, scale and research objectives. Biotope mapping has contributed the sustainable innovative development in urban biodiversity conservation, ecological space planning and ecosystem management in these countries. Nevertheless, there are few studies on biotope mapping in China, which also has a serious biodiversity crisis.
Classification is the basis of biotope mapping (Sukopp and Werner, 1983) Considering different scales, objectives or perspective of research, the classification methods are diverse, which will also affect the mapping results (Hermy and Cornelis, 2000). However, in China, only a few scholars (Zhao et al., 2007; Zhang, 2011; Lu, 2017) have put biotope mapping into practice in cities such as Shanghai, Xi’an and Nanjing, and most of them use land cover types, for example, residential land, industrial land and green space as basic classification. This classification is applicable to large-scale study areas, such as cities or regions, but not for urban parks. The park is not classified in detail and regarded as one type of land cover, ignoring its internal biotope heterogeneity, which will affect the accuracy of biodiversity maintenance and conservation in urban parks. Zhang et al. (Zhang and Zhu, 2021) developed classification with landscape architecture elements and applied it at the park scale, but it focused more on the landscape perspective and less on ecological processes. Green space is the main biotope type in urban parks. The difference of vegetation structure constitute a variety of micro biotope types, which have a significant impact on species richness (Nally et al., 2001) and human behavior preference (Wang et al., 2017; Suppakittpaisarn et al., 2019). Therefore, it is more applicable for urban park to take vegetation structure as the main basis for biotope classification. However, this method has been applied in urban area only (Qiu et al., 2010), and its reliability and scientificity in urban parks are unknown because the number of factors, levels and coding method are relatively complex for small-scale. In addition, the classification of other land cover types such as hard surface and water is not clear.
Assessment is the core of biotope mapping due to its results are the basis for formulating relevant strategies (Sukopp and Werner, 1983). Previous assessment methods focused on identifying the biotope types with conservation value (Boteva et al., 2004; Choi, 2008; Gao et al., 2009; Lu, 2017). While reflecting the spatial distribution characteristics and problems were rare. Moreover, how to apply the evaluation results to practice also needs further research. Riverside Park is a typical urban park in China. It is not only the largest park in the most uranized area of Yichang, but also an open and comprehensive park completely designed by planner. Therefore, taking Riverside Park, Yichang as an example for biotope mapping to reveal its internal biotope heterogeneity characteristics in this paper. The aim of this study is to establish a system of biotope classification, evaluation and application that is applicable for urban parks in China. Hopefully in the future, can provide new guidance for professionals to make urban biodiversity conservation and planning from research to practice.
Materials and methods
Study area
Yichang is located in the southwest of Hubei, China, between 110°15′–112°04′E, 29°56′–31°34′N. It is an important city in the Urban Agglomeration in the Middle Reaches of Yangtze River, with a long history of over 2,700 years. Over two-thirds (67.4%) of this city are mountainous, which covered primarily by secondary pine forests such as Pinus massoniana and Pinus armandii. The landform of the downtown area, which is located on the left bank of the Yangtze River, is dominated by hills. Yichang has a subtropical humid monsoon climate wiht an average temperature of 16.9°C, ranging from 9.8°C in January to 41.4°C in July. The average annual precipitation in this area is 1,215.6 mm, and the average annual sunshine hours is 1,538–1883 h, which provides a good habitat for fauna and flora.
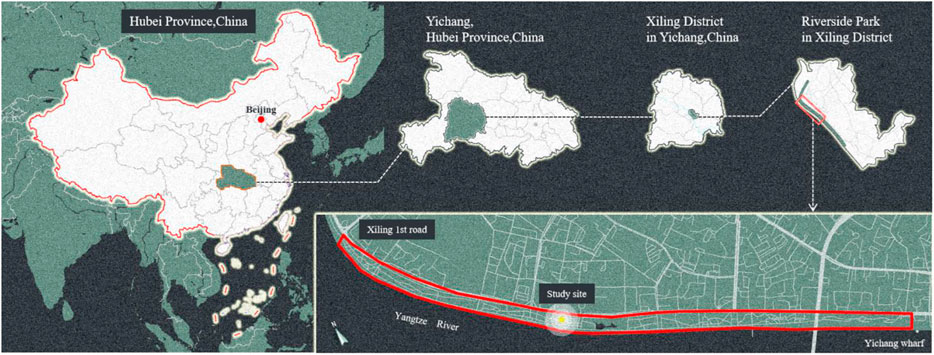
The case study site of Riverside Park in Yichang is a key site of Yangtze River Ecological Protection Strategy, because it is very close to the spawning ground of Acipenser sinensis (Chinese sturgeon), a critically endangered (CR) fish species listed in Red List of IUCN. Riverside Park was constructed along the Yangtze River in 1984 during the construction of Gezhouba Hydropower Station to use up a large quantity of excavated soil, and is visited by a large number of residents and tourists because of its linear spatial and geographical location The area of Riverside Park studied in this paper is from Xiling 1st road to Yichang wharf, with a total length of 3.8 km, average width of 65 m and a total area of 29.1 ha. This section was the earliest constructed, has the largest average width and services the largest number of people of the whole Riverside Park (Figure 1).
Classification and identification of biotope types
The updated classification integreted vegetation structure factor was used in this study (Qiu et al., 2010). Compared with previous method, the improvements was done to make it more reasonable for urban park as follows: 1) forest type was removed from the original four factors because more than 90% of the study area is covered by broad-leaved trees.; 2) the classification system was simplified from the original five levels to three levels; 3) the classification basis of grey and blue spaces and coding method for biotope types were adjusted.
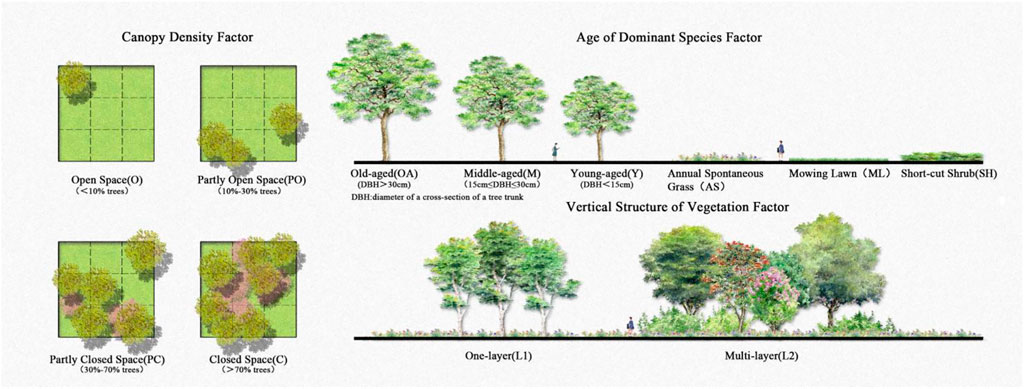
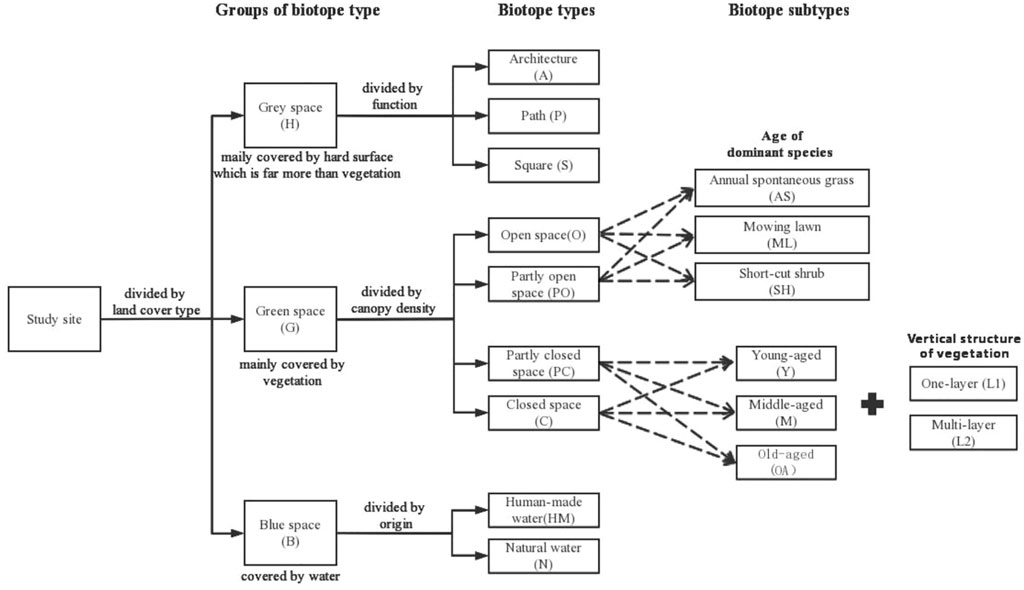
Canopy density, vertical structure of vegetation and the age of dominant species factors are selected as the basis of the biotope classification due to their impact on species diversity and the main factors considered in plant design. The description of all factors are shown in Figure 2. The concept of “patch” in landscape ecology is used to describe the minimum biotope unit in this paper. This scheme consists of “groups of biotope type”, “biotope types” and “biotope subtypes”. First, the whole study area is divided into three groups of biotope type: green space (G), grey space (H) and blue space (B), according to land cover type (Figure 3). Second, on the basis of different dominant factors, each group can be further divided into many biotope types. For example, the green space group is divided into four biotope types due to the difference in canopy density: open space (O), partly open space (PO), partly closed space (PC) and closed space (C). The grey space and blue space groups are divided into three and two biotope types, respectively, according to function and origin. Third, green space is the main habitat for most species, and as a result, all the biotope types in the green space group are divided into subtypes in detail based on the combination of vertical structure of vegetation and the age of the dominant plant species. Finally, each biotope type is coded by combining abbreviations of factors. In this paper, codes are used to represent biotope types for easy description. For example, “G-PC-Y + L1” means the biotope subtype of young-aged trees and one-layered forest in partly closed green space. The entire list of classification scheme can be found as Supplementary Table S1 online.
A field survey was done in the study area using the biotope classification scheme above. The geographical position and area of each patch was determined using a GPS instrument and the canopy density, vertical structure of vegetation and the age of dominant trees were recorded by observation. Then, the field survey data were superimposed with the 2020 GeoEye-1 high-resolution satellite remote sensing image data of Yichang (with a resolution of 0.5 m) and the 1:1,000 topographic map of the study area. The data were stored, edited and analyzed, with the support of ArcGIS software platform, to complete the biotope map of Riverside Park, Yichang.
Assessment system of biotope
The assessment system of biotope focuses on two aspects: biotope fragmentation and spontaneous vegetation diversity. Biotope fragmentation involves two processes: area reduction and chopping the area into isolated patches (Laurance, 2008), and this study refers to the second process of changes in spatial configuration of biotope. The following three indicators were selected: number of patches (NP) (Hu et al., 2012), mean patch size (MPS) (Bascompte and Rodríguez, 2010; Colson et al., 2011) and fragmentation index (FI) (Colson et al., 2011).
Spontaneous vegetation, which grow naturally rather than being intentionally propagated by humans (Kühn, 2006; Cervelli et al., 2013), are common in urban parks. Spontaneous vegetation is an important indicator to evaluate the biodiversity of urban parks (Millard, 2000; Millard, 2004). The field survey was conducted with a random sampling method. The sample sites were selected in each biotope type, with a total of 46 sample sites. A small sample of 1 m × 1 m was chosen randomly in each sample site, and the number of small sample can be adjusted according to the area of sample sites, but most of them had more than 10 small samples. Information was recorded on the biotope type and area of each sample site, and the spontaneous vegetation and the dominant species in each sample. Then, on the basis of survey data, the richness index (Hurlbert, 1971) and the Jaccard index (Yin et al., 2009) were selected to calculate the biodiversity of each biotope type.
Results
Biotope composition of Riverside Park
All of the biotope types are shown in the biotope map of Riverside Park, Yichang as the mapping scale was 1:10,000 (Figure 4). The results show that there are three biotope type groups and eight biotope types in Riverside Park (see Supplementary Table S1 online). Of the eight biotopes, four biotope types (O, PO, PC and C) are in the green (G) biotope group, three (S, P and A) are in the grey (H) biotope group and the last one (HM) is in the blue (B) biotope group. Only the G biotope group was divided into 16 biotope subtypes.
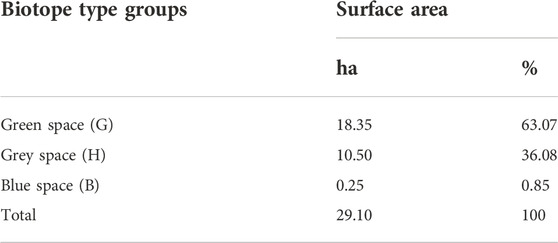
The total area of biotopes in Riverside Park is 29.1 ha. The green (G) biotope group is 18.35 ha (63.07%), while the grey (H) biotope group is 10.5 ha (36.08%). The blue (B) biotope group covers a very small area of only 0.25 ha (0.85%) because the study site is located along the Yangtze River, which likely reduces its proportion in landscape planning (Table 1).
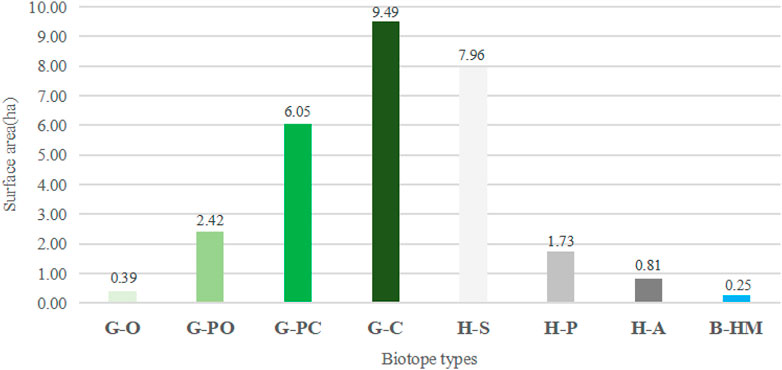
The size of biotope types varies (Figure 5). The largest biotope type in green (G) biotope group is type C with an area of 9.49 ha. It is the dominant type in green space. However, type O has the smallest area of 0.39 ha in this biotope group. In the grey (H) biotope group, type S is the largest biotope type with 7.96 ha, likely because a large number of squares were designed for tourists and residents at the beginning of the park construction as Yichang is a famous tourist city. The areas of type P and A are similar, at 1.73 ha and 0.81 ha respectively.
Biotope fragmentation characteristics of Riverside Park
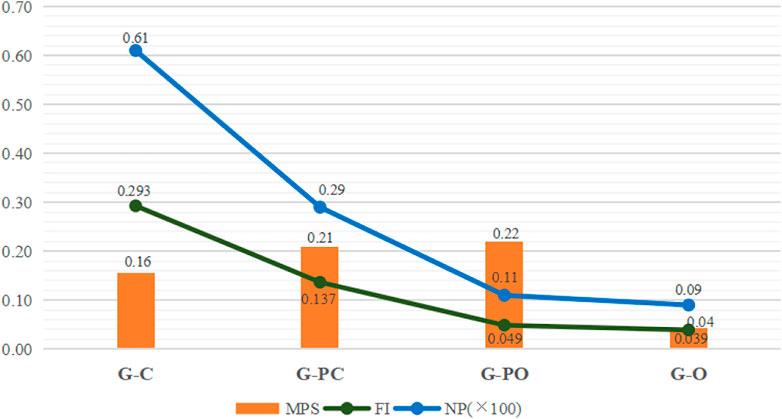
Due to the fact that the green (G) biotope group is the dominant and the main habitat of most species, it is selected as an example for biotope assessment. It can be seen that MPS of all biotope types were significantly negatively corrected with FI and NP except G-O (Figure 6). FI and NP had the highest values in G-C type which indicated that this type had the highest fragmentation. Figure 4 also shows that some patches were clustered, but most of them were chopped up by paths. This probably be explained that new paths were added to G-C after initial completion to accommodate the increase in tourists arising from urban development, resulting in its increased fragmentation. G-PO has the largest MPS combined with a lower FI and NP which demonstrated its lowest fragmentation. Significantly, the metrics of FI and NP had their lowest values for G-O type, but the type also had a relatively high fragmentation due to its much lower MPS. The G-PC type was intermediate in this aspect of pattern.
Response of spontaneous vegetation diversity to biotope heterogeneity
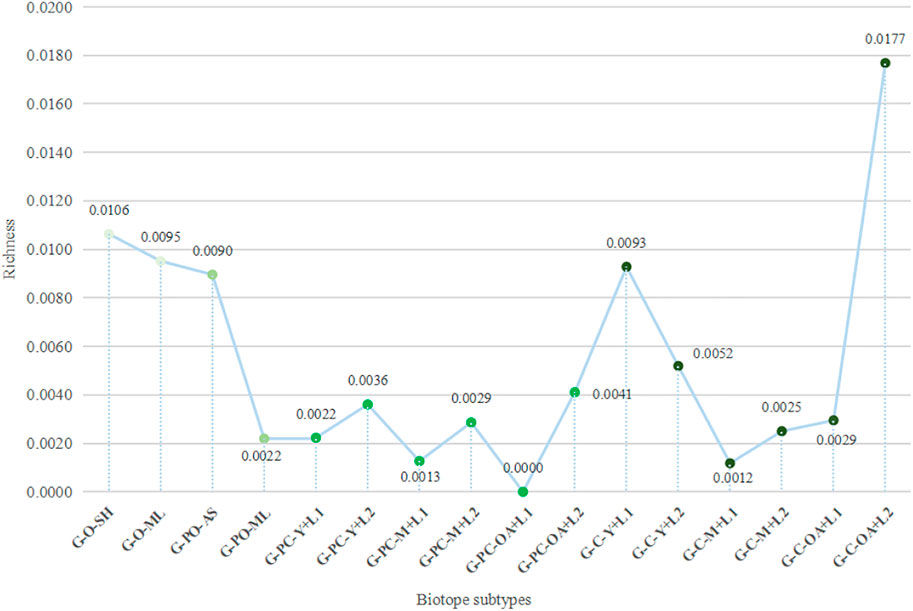
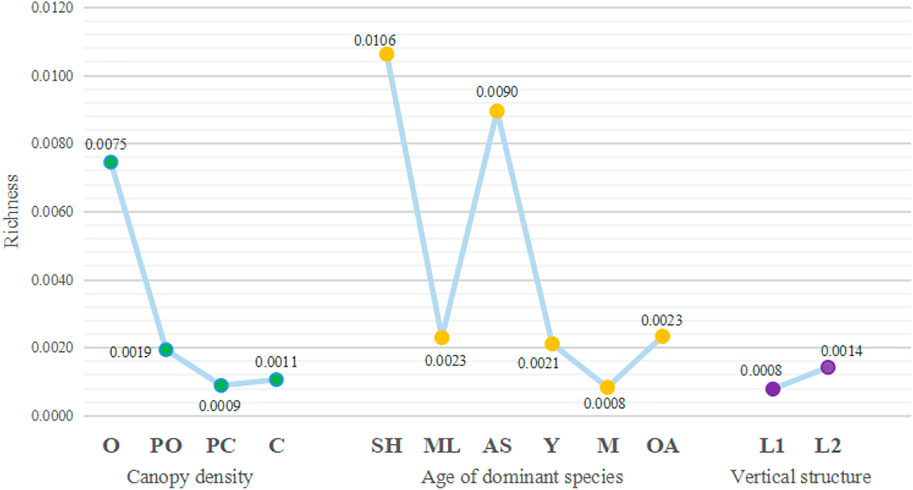
A total of 118 spontaneous vegetation were recorded in the 46 sample sites. The species richness variables differed significantly between biotope subtypes and single vegetation structure factor. Of all biotope subtypes (Figure 7), G-C-OA + L2 had the highest value of richness (R = 0.0177), followed by G-O-SH, G-O-ML, G-PC-M + L1 and G-PO-AS, with similar values. It is worth mentioning that the value of G-PC-OA + L1 was 0, because it only has one patch and its surface was trampled hard by human activity, making it difficult for plants to survive. For the single vegetation structure factor (Figure 8), factor SH in the age of dominant species factor had the highest value of richness. This is likely because the light intensity and structure are moderate under the shrubs, and low-intensity management provided a better micro habitat for spontaneous vegetation (Figure 9). There were three factors (PO, M and L1) with the lowest values, and all of them were less than 0.001. All the factors affect the preferences of people in undertaking activities in different areas of the park, and this has a serious negative impact on species survival. However, contrary to the species richness index, there were no significant differences in the distribution of spontaneous vegetation between biotope types due to their similar and median Jaccard index value, except for the pair of G-O and G-C (Table 2).
Discussion
Classification scheme applicable for urban parks
Biotope classification scheme is different and flexible for different research objectives, characteristics and scales of study sites. For instance, the scheme at a large scale, such as region or urban, can be based on land cover (Frey, 1999), while a scheme based on vegetation types is more appropriate for nature reserves (Boteva et al., 2004). Urban park provide space for residents recreation and wildlife survival (Palliwoda et al., 2017). Therefore, the previous method was updated by selecting only three factors (canopy density, vertical structure of vegetation and the age of dominant species) of them as the basis for classification because of their significant interaction. The results show that the richness of spontaneous vegetation is significantly different in G-O and G-C types, which is affected by canopy density. Also, the difference of spatial sense and light intensity arising from this factor affect people’s activity preference in these biotope types. For example, more people were found to prefer flying kites and playing football in green open space (G-O), talking and meditating in green closed space (G-C) during the field survey. In addition, The difference of disturbance caused by the diversity of human activities has an impact on the distribution of spontaneous in the two habitat types. Therefore, the classification scheme integreted vegetation structure factors has the advantage of reflecting the interaction between human activities and species diversity, which contribute to the exploration of ways to balance the needs of human and biodiversity conservation.
In addition to being scientific, the classification used in this study has the characteristic of easy learning, too. The data of the three vegetation structure factors can be obtained directly by visual inspection or simple measurement, and the sub-classification of each factor is clear and objective, avoiding ambiguous division caused by subjectivity. For example, the age of dominant species can be classified by measuring diameter of a cross-section of a tree trunk, and the vertical structure can be divided into one-layer or multi-layer by visual inspection. After simple training, the investigators can conduct field survey with accuracy and efficiency. In addition, compared with coding biotope types with numbers (Frey, 1999; Boteva et al., 2004) or words (Mansuroglu et al., 2006; Choi, 2008), it is easier to understand and convenient when mapping and interpreting by coding with word abbreviations. Therefore, the classification integreted vegetation structure can be widely used by researchers who needs to recognize the site characteristics from an ecological perspective but has limited understanding of ecology, such as landscape designers.
This classification method has some limitations. Although most vegetation communities in urban parks are designed and the design ideas for the structural collocation of plants are similar, for example, one-layer or multi-layer, the age of trees, and open or closed space according to the function or aesthetics of the site, the wide applicability of this classification in other Chinese cities with large geographical differences needs to be verified.
Assessment system applicable for urban parks
Previous studies (Boteva et al., 2004; Lu, 2017) evaluated the biotope quality by comparing the species richness of them. The higher species richness of some biotope types, which means that it can provide more space for more living organisms, the higher quality of them, and vice versa. For example, the quality of G-PC is the worst, while that of G-O is the highest due to the richness of spontaneous vegetation in this study. However, it is not enough for urban parks to find out the high or low quality biotope types. It is also necessary to know the causes of this result, so as to formulate more specific and targeted strategies for conversation or restoration. Wu (Wu, 2007) proposed that spatial patterns affect ecological processes, such as biodiversity and ecosystem processes. By analyzing the spatial patterns characteristics of biotope type, such as the fragmentation used in this paper, the dominant factors that affect the high or low quality could be found. For example, the results show that the reason for the poor quality of G-C is the highest fragmentation, and the target type that leads to this status will be identified by the further comprehensive analysis of the fragmentation and species richness of subtypes in G-C. Therefore, the assessment scheme for urban parks should be carried out from two aspects and the further evaluation on biotope type or subtype can be done if necessary.
The selection of indicator species and indexes are flexible and adjustable in practice according to the budget, research objectives and site characteristics. Compared with other species such as butterfly or bird, spontaneous vegetation are common in Riverside Park and easy to identify and count, so it is a relatively scientific and reasonable choice as indicator species for this study. As for index selection, take species richness as an example, it is a direct and widely used index for evaluating biotope quality. Moreover, this article also uses Jaccard index to measure biotope heterogeneity. In addition to the quality of biotope, whether there are some biotope types that provide unique shelter for some special wildlife is included in the aim of this study. If this type exists in the study area, it should be focused. However, there are no significant differences in the distribution of spontaneous vegetation between biotope types according to the results.
The method of biodiversity conservation and restoration on the basis of biotope mapping
Biotope mapping is consist of two parts: ecological resource survey and data analysis, and the evaluation results are the scientific basis for formulating biodiversity conservation and restoration strategies (Sukopp and Weiler, 1988). Lacking of research on the application methods of mapping results, relevant departments are unable to apply the research results to practice (Chen et al., 2022). Therefore, the method of biodiversity conservation and restoration on the basis of biotope mapping was put forward according to the characteristics of urban parks, the data analysis process and the research questions revealed by the results.
First, the priority of protection or restoration is determined based on a meta-analysis of all evaluation results. For instance, the top priority of restoration in this study is given to G-C because it is the dominant biotope type with the most serious fragmentation and the lowest richness, and it is reasonable to focus on conservation for G-PO due to its lowest fragmentation and higher richness.
Second, the biotope types of top priority restoration will be analyzed in detail. The target type that leads to this status was identified by the comprehensive analysis of the fragmentation and species richness of subtypes in G-C. M + L1 in G-C is the target type because it is the dominant type with lowest richness. Moreover, it was found that evergreen trees are dominant in this subtype during field survey, such as Photinia serrulata Lindl and Ficus virens Aiton with low branching points and thick leaves, resulting in extremely low light transmission in the forest and making it difficult for other species to survive.
Finally, formulate specific strategies. Reducing the canopy density of M + L1 by transplanting plants, and replanting with shrubs will be a scientific and reasonable strategies for G-C, because this method offers a better micro habitat for wildlife. G-PO can be protected with adjusted management. Riverside Park is an open green space and the residents’ activities are completely unrestricted. Disturbance of human activities to this habitat type could be controlled by plant design, such as hedges which could restrict human accessibility.
Conclusion
It is crucial to improve both biodiversity and people’s recreation satisfaction in urban parks that protect important biotope types and restore degraded biotopes. Biotope mapping is an effective tool for these targets. The classification scheme which integrated vegetation structure has the potential to become a standard system for urban parks in China, according to the advantages of recognition of human activities and other species and easy learning. The multifaceted assessment method using biotope fragmentation and species diversity and the application of the biotope mapping is shown by using Riverside Park, Yichang as an example. The results of this paper can be helpful for biodiversity conservation in other urban parks in China.
Data availability statement
The original contributions presented in the study are included in the article/Supplementary Material, further inquiries can be directed to the corresponding author.
Author contributions
CZ: writing—original draft, ideas, methodology, conceptualization, investigation, data curation, formal analysis. YY: review and editing, validation. YH: writing—review and editing, resources, supervision, funding acquisition. All authors reviewed the manuscript.
Funding
This work was supported by the Fundamental Research Funds for the Central Universities (No.2572020BK04, No.2572017CA12).
Acknowledgments
We all grateful to all the field investigators, including Shu-yu Li and Gui-xuan You of our laboratory.
Conflict of interest
The authors declare that the research was conducted in the absence of any commercial or financial relationships that could be construed as a potential conflict of interest.
Publisher’s note
All claims expressed in this article are solely those of the authors and do not necessarily represent those of their affiliated organizations, or those of the publisher, the editors and the reviewers. Any product that may be evaluated in this article, or claim that may be made by its manufacturer, is not guaranteed or endorsed by the publisher.
Supplementary material
The Supplementary Material for this article can be found online at: https://www.frontiersin.org/articles/10.3389/fenvs.2022.1008362/full#supplementary-material
References
Bascompte, J., and Rodríguez, M. A. (2010). Habitat patchiness and plant species richness. Ecol. Lett. 4, 417–420. doi:10.1046/j.1461-0248.2001.00242.x
Boteva, D., Griffiths, G., and Dimopoulos, P. (2004). Evaluation and mapping of the conservation significance of habitats using GIS: An example from crete, Greece. J. Nat. Conservation 12, 237–250. doi:10.1016/j.jnc.2004.09.002
Cervelli, E. W., Lundholm, J. T., and Du, X. (2013). Spontaneous urban vegetation and habitat heterogeneity in Xi’an, China. Landsc. Urban Plan. 120, 25–33. doi:10.1016/j.landurbplan.2013.08.001
Choi, S. H. (2008). Biotope mapping and evaluation in gangseo-gu of busan metropolitan city. J. Korea Geogr. Inf. Soc. 11, 92–106.
Chen, T., Zhao, C., Wen, S., and Hu, Y. (2022). Research progress in urban biotope mapping and its application in biodiversity conservation. Landsc. Archit. 29, 12–17. doi:10.14085/j.fjyl.2022.01.0012.06
Colson, F., Bogaert, J., and Ceulemans, R. (2011). Fragmentation in the Legal Amazon, Brazil: Can landscape metrics indicate agricultural policy differences? Ecol. Indic. 11, 1467–1471. doi:10.1016/j.ecolind.2010.12.020
Cornelis, J., and Hermy, M. (2004). Biodiversity relationships in urban and suburban parks in Flanders. Landsc. Urban Plan. 69, 385–401. doi:10.1016/j.landurbplan.2003.10.038
Cousins, S. A. O., and Ihse, M. (1998). A methodological study for biotope and landscape mapping based on CIR aerial photographs. Landsc. Urban Plan. 41, 183–192. doi:10.1016/s0169-2046(98)00057-7
Czortek, P., and Pielech, R. (2020). Surrounding landscape influences functional diversity of plant species in urban parks. Urban For. Urban Green. 47, 126525–525. doi:10.1016/j.ufug.2019.126525
Deutscher, J., Kupec, P., Kucera, A., Urban, J., Ledesma, J. L., and Futter, M. (2019). Ecohydrological consequences of tree removal in an urban park evaluated using open data, free software and a minimalist measuring campaign. Sci. Total Environ. 655, 1495–1504. doi:10.1016/j.scitotenv.2018.11.277
Frey, J. (1999). Practical aspects of biotope mapping in cities: Methods, problems and solutions. An example of mainz, Germany. Deinasea 5, 41–56.
Gao, D., Chen, Y., Lu, H., and Shi, M. (2009). Application of biotope mapping in assessment of biotope quality in Minhang district, Shanghai. Environ. Sci. Technol. 32, 179–182. doi:10.3969/j.issn.1003-6504.2009.05.045
Hanski, I. (2006). The shrinking world: Ecological consequences of habitat loss. Beijing, China: Higher Education Press.
Hermy, M., and Cornelis, J. (2000). Towards a monitoring method and a number of multifaceted and hierarchical biodiversity indicators for urban and suburban parks. Landsc. Urban Plan. 49, 149–162. doi:10.1016/s0169-2046(00)00061-x
Hu, G., Wu, J., Feeley, J. K., Xu, G., and Yu, M. (2012). The effects of landscape variables on the species-area relationship during late-stage habitat fragmentation. Plos One 7, e43894. doi:10.1371/journal.pone.0043894
Hurlbert, S. H. (1971). The nonconcept of species diversity: A critique and alternative parameters. Ecology 52, 577–586. doi:10.2307/1934145
Ignatieva, M., and Hedblom, M. (2018). An alternative urban green carpet. Science 362, 148–149. doi:10.1126/science.aau6974
Kühn, N. (2006). Intentions for the unintentional. J. Landsc. Archit. 1, 46–53. doi:10.1080/18626033.2006.9723372
Laurance, W. F. (2008). Theory meets reality: How habitat fragmentation research has transcended island biogeographic theory. Biol. Conserv. 141, 1731–1744. doi:10.1016/j.biocon.2008.05.011
Li, J., Schulte, W., and Sukopp, H. (2003). Biotope mapping in cities, towns and villages-a national program in Germany. Acta Ecol. Sin. 23, 588–597. doi:10.3321/j.issn:1000-0933.2003.03.023
Li, X., Dong, L., and Guan, J. (2018). Temporal and spatial characteristics of spontaneous plant composition and diversity in a Beijing urban park. Acta Ecol. Sin. 38, 581–594. doi:10.5846/stxb201610272193
Lu, X. (2017). A methodological study on urban biotope mapping: The case of xuanwu district, nanjing city. Nanjing, China: Southeast University. doi:10.14627/537642022
Mansuroglu, S., Ortacesme, V., and Karaguzel, O. (2006). Biotope mapping in an urban environment and its implications for urban management in Turkey. J. Environ. Manag. 81, 175–187. doi:10.1016/j.jenvman.2005.10.008
Mckinney, M. L. (2002). Urbanization, biodiversity, and conservation. Bioscience 52, 883–890. doi:10.1641/0006-3568(2002)052[0883:ubac]2.0.co;2
Millard, A. (2004). Indigenous and spontaneous vegetation: their relationship to urban development in the city of Leeds, UK, 3. Urban Forestry & Urban Greening, 39–47. doi:10.1016/j.ufug.2004.04.004
Millard, A. (2000). The potential role of natural colonisation as a design tool for urban forestry — A pilot study. Landsc. Urban Plan. 52, 173–179. doi:10.1016/s0169-2046(00)00131-6
Nally, R. M., Parkinson, A., Horrocks, G., Conole, L., and Tzaros, C. (2001). Relationships between terrestrial vertebrate diversity, abundance and availability of coarse woody debris on south-eastern Australian floodplains. Biol. Conserv. 99, 191–205. doi:10.1016/s0006-3207(00)00180-4
Palliwoda, J., Kowarik, I., and von der Lippe, M. (2017). Human-biodiversity interactions in urban parks: The species level matters. Landsc. Urban Plan. 157, 394–406. doi:10.1016/j.landurbplan.2016.09.003
Qiu, L., Gao, T., Gunnarsson, A., Hammer, M., and Bothmer, R. v. (2010). A methodological study of biotope mapping in nature conservation. Urban For. Urban Green. 9, 161–166. doi:10.1016/j.ufug.2010.01.003
Sotheran, I. S., Foster-Smith, R. L., and Davies, J. (1997). Mapping of marine benthic habitats using image processing techniques within a raster-based geographic information system. Estuar. Coast. Shelf Sci. 44, 25–31. doi:10.1016/s0272-7714(97)80004-2
Stewart, G. H., Ignatieva, M. E., Meurk, C. D., Buckley, H., Horne, B., and Braddick, T. (2009). Urban biotopes of aotearoa New Zealand (URBANZ) (I): Composition and diversity of temperate urban lawns in christchurch. Urban Ecosyst. 12, 233–248. doi:10.1007/s11252-009-0098-7
Sukopp, H., and Weiler, S. (1988). Biotope mapping and nature conservation strategies in urban areas of the Federal Republic of Germany. Landsc. Urban Plan. 15, 39–58. doi:10.1016/0169-2046(88)90015-1
Sukopp, H., and Werner, P. (1983). Urban environment and vegetation. Urban environment and vegetation. Berlin, Germany: Springer. doi:10.1007/978-94-009-7269-8_19
Suppakittpaisarn, P., Jiang, B., Slavenas, M., and Sullivan, W. C. (2019). Does density of green infrastructure predict preference? Urban For. Urban Green. 40, 236–244. doi:10.1016/j.ufug.2018.02.007
Tertilt, T. M. (2011). Urban parks-a chance for biodiversity in cities-guiding principles for cities with former native forest cover. Chin. Landsc. Archit. 27, 63–67. doi:10.3969/j.issn.1000-6664.2011.07.015
Wang, R., Zhao, J., and Meitner, M. J. (2017). Urban woodland understory characteristics in relation to aesthetic and recreational preference. Urban For. Urban Green. 24, 55–61. doi:10.1016/j.ufug.2017.03.019
Wu, J. (2007). Landscape ecology: Pattern, process, scale and hierarchy. Higher Education Press. Beijing, China.
Yin, K., et al. (2009). Human-induced disturbance on the understory plant diversity of urban forest: A case study of xiamen. Acta Ecol. Sin. 29, 563–572. doi:10.3321/j.issn:1000-0933.2009.02.002
Zhang, J. (2011). Study on the spatial pattern of urban biotopes in typical area of Xi'an City of China. Ecol. Sci. 30, 65–69. doi:10.3969/j.issn.1008-8873.2011.01.012
Zhang, Y., and Zhu, J. (2021). Biotope mapping with landscape architecture elements and its application in the research of park avian microhabitats. Landsc. Archit. 28, 96–102. doi:10.14085/j.fjyl.2021.02.0096.07
Keywords: urban park, biotope classification and assessment, biotope mapping, urban biodiversity, landscape architecture
Citation: Zhao C-c, Yang Y-Q and Hu Y-D (2022) Methodology, assessment and application of biotope mapping for urban parks in China: A case study on Riverside Park, Yichang. Front. Environ. Sci. 10:1008362. doi: 10.3389/fenvs.2022.1008362
Received: 31 July 2022; Accepted: 07 November 2022;
Published: 18 November 2022.
Edited by:
Marco Malavasi, Czech University of Life Sciences Prague, CzechiaReviewed by:
Kankan Shang, Shanghai Botanical Garden, ChinaLe Zhong, Huazhong Agricultural University, China
Fengping Yang, Southwest University, China
Copyright © 2022 Zhao, Yang and Hu. This is an open-access article distributed under the terms of the Creative Commons Attribution License (CC BY). The use, distribution or reproduction in other forums is permitted, provided the original author(s) and the copyright owner(s) are credited and that the original publication in this journal is cited, in accordance with accepted academic practice. No use, distribution or reproduction is permitted which does not comply with these terms.
*Correspondence: Yuan-Dong Hu, aHV5dWFuZG9uZ0BuZWZ1LmVkdS5jbg==
 Cong-cong Zhao
 Yu-Qi Yang3