- 1Institute of Desert Meteorology, China Meteorological Administration, Urumqi, China
- 2Xinjiang Key Laboratory of Tree-Ring Ecology, Urumqi, China
- 3Key Laboratory of Tree-ring Physical and Chemical Research, China Meteorological Administration, Urumqi, China
- 4Field Scientific Observation Base of Cloud Precipitation Physics in West Tianshan Mountains, Urumqi, China
The extreme precipitation threshold is fundamental to extreme precipitation research, directly affecting the cognition of extreme characteristics. Based on the daily precipitation data of 62 meteorological stations from 1985 to 2005, this study uses parametric and non-parametric approaches to determine the extreme precipitation threshold in Central Asia, analyzes the statistics and spatial distribution of different threshold criteria, and discusses the trend of extreme precipitation. The capability of the grid dataset of APHRODITE and GPCC in the extreme precipitation analysis in Central Asia is evaluated from the threshold perspective. The results are as follows: 1) Contrary to the parametric approach, the threshold determined by the percentile indices in the warm season is slightly higher than in the cold season. The mean threshold of the warm (cold) season in Central Asia is defined by the 95th percentile index and the 10-year return period, which are 14.0 mm (13.5 mm) and 24.2 mm (25.7 mm), respectively. 2) The spatial distribution of extreme precipitation threshold in Central Asia is higher in the southeast and lower in the north during the cold season; In the warm season, it is high in the north and southwest and low in the center. 3) Although both APHRODITE and GPCC datasets can basically reproduce the spatial distribution of extreme precipitation threshold, they underestimate the magnitude of the threshold, especially APHRODITE. 4) There is no obvious extreme precipitation trend in Central Asia during the study period. Furthermore, the trend in characteristics of extreme precipitation based on different thresholds shows a consistent trend in time but not spatially. We suggest that the threshold selection should adjust the balance between sufficient samples and extreme values according to actual conditions. The results of this study can provide a reference for extreme precipitation threshold criteria under specific application conditions in Central Asia.
1 Introduction
Central Asia is a strongly heterogeneous area where mountains, basins, and oases coexist with deserts; it has a complex climate pattern and vulnerable environment (Chen et al., 2013; Hu R. et al., 2014), and is sensitive to climate change. Previous studies have indicated that Central Asia is one of the specific regions strongly affected by global warming (Solomon et al., 2007). It displays a clear warming trend over the last century and is more sensitive to the second warming period following the 1970s (Wang et al., 2008). From 1979 to 2011, it exhibited a warming rate of about 0.36–0.42°C/10a, much faster than the global land average (Hu Z. et al., 2014). Precipitation is an essential source of water resources in Central Asia (Chen et al., 2013). The amount of precipitation will affect the regional water cycle and is critical for ecosystems and society (Lu et al., 2021; Hu et al., 2022). Influenced by global warming, inter-decadal and inter-annual precipitation in Central Asia has increased abnormally in recent decades (Chen et al., 2011; Guan et al., 2022a, 2022b). Total annual precipitation has increased significantly (1.39 mm/10a) from 1949 to 2018, higher than the global mean (1.225 mm/10a) (Yan et al., 2021). In the summer and winter, the seasonal tendency is more pronounced (Chen et al., 2011, 2018; Bothe et al., 2012; Ma et al., 2020; Zhang and Fan, 2022). There has been a notable increase in precipitation over mountainous areas (Hu et al., 2017; Xu et al., 2022). Furthermore, some studies found that extreme precipitation in Central Asia has been increasing since the 20th century (Zhang et al., 2017; Yao et al., 2020) and that the intensity and frequency of extreme precipitation have increased significantly (Hu et al., 2016; Hu et al., 2019a; Lai et al., 2020; Yao et al., 2020). Moreover, these trends will likely continue in the future (Zhang et al., 2019; Yao et al., 2020). The increased extreme precipitation may lead to flooding and disaster, especially in arid areas. Extreme precipitation changes will impact the development of the natural environment, ecosystems, and society of Central Asia. In contrast to the monsoon areas, the total precipitation in Central Asia will consist of a few extreme events, and more information needs to be considered.
Threshold criteria are the core research issue on precipitation extremes; they directly impact on the cognition of characteristics and variations in extreme events. Several methods have been applied to determine extreme precipitation thresholds, and they can generally be divided into parametric and non-parametric approaches (Wang Z. et al., 2020). The parametric approach describes the extreme using probability distribution functions fitted on the series constructed with the annual maximum method or the peaks-over-threshold method (Zhang et al., 2017; Wang Z. et al., 2020). Some researchers have used this approach to analyze extreme precipitation in Xinjiang (Jiang et al., 2017; Yang et al., 2018; Shan et al., 2021). The non-parametric approach typically utilizes the fixed-value method and percentile indices. The extreme is defined as the precipitation that exceeds a specific value or percentile index, in absolute values such as 50 mm and percentile indices such as the 95th percentile. The fixed-value method is simple to use; hence, it is commonly employed in meteorological services. Percentile indices, on the other hand, allow for spatial comparison across a vast expanse, which is the most popular comparison in extreme precipitation analyzes (Zhai et al., 2005, 2020; Wang Q. et al., 2020; Lai et al., 2020; Ma et al., 2021; Zou et al., 2021). Other methods or criteria are also used in extreme precipitation research. Xu et al. (2022) used regional mean daily precipitation as an extreme criterion. Typical extreme events, defined as record-breaking events, have been applied in recent studies (Shan et al., 2021). All these methods have advantages and disadvantages, and there are no universal criteria for selecting an extreme threshold.
Different datasets and threshold selections create significant uncertainty in the knowledge of extreme precipitation extremes in Central Asia. It hinders comparisons and connections between different findings. Due to the difficulty of obtaining observational data in Central Asia, the former studies about extreme precipitation depended on gridded datasets. The assessment of gridded datasets is usually carried out from a precipitation perspective, with less mention of extreme precipitation. In this study, we aimed to gain relatively comprehensive knowledge of extreme precipitation thresholds in Central Asia by computing commonly used extreme precipitation threshold criteria using observation and grid datasets. And assess the capability of grid datasets in Central Asia from the perspective of extreme precipitation threshold. In particular, we aimed to answer the following questions: 1) What are the characteristics of different extreme precipitation threshold criteria in Central Asia? 2) Are the trends of characteristics by the different threshold criteria consistent? 3) Is the distribution of the grid dataset under different threshold criteria consistent with the observations? This information will help provide a more accurate and reliable standard for extreme precipitation thresholds in Central Asia. Furthermore, it allows for comparison between findings applying different threshold criteria.
2 Data and methods
2.1 Study area
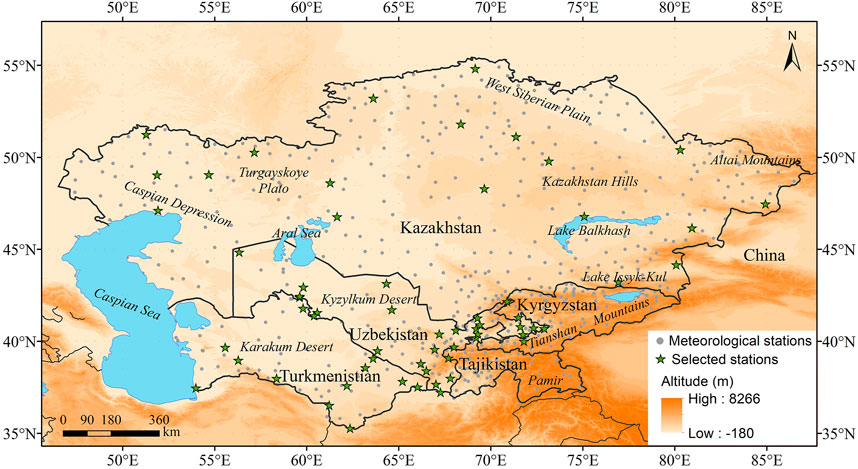
Central Asia in this paper denotes five countries: Kazakhstan, Kyrgyzstan, Tajikistan, Turkmenistan, and Uzbekistan (hereinafter, “CA5”); their total area is nearly 4.0 × 10⁶ km (Hu R. et al., 2014). This region is located in the hinterland of the Eurasian continent, which is an important part of the Central Asian arid zone. The geographical topography of Central Asia is complex and unique, including the mountains (Turgayskoye Plato, Pamirs Plateau, Tianshan Mountains), basins (Fergana Valley), deserts (Kyzylkum Desert, Karakum Desert), and oasis (Figure 1). Central Asia is vast with complex climate conditions and is influenced by prevailing westerly and stationary waves (Chen et al., 2011; Chen et al., 2013; Dai and Wang, 2017). It is a typical temperate continental climate. Precipitation is an essential water source for society and ecology in Central Asia (Chen et al., 2013). However, it is deficient and concentrated in mountainous areas, for the water vapor from the ocean is blocked by the giant mountains. Regional differences in annual precipitation are evident in Central Asia. It is fairly even in the northern regions, while mainly in winter and spring in southern regions (Chen et al., 2011). In this paper, we consider (May-October) as the warm season and (November-April) as the cold season to assess the extreme precipitation.
2.2 Data
The meteorological observation dataset used in this study was obtained from the Global Historical Climatology Network - Daily (GHCN-D, Menne et al., 2012), which is available from the NCDC (ftp://ftp.ncdc.noaa.gov/pub/data/ghcn/daily/) and has more than 500 station records covering Central Asia. Owing to the breakdown of the Soviet Union, most meteorological observations stopped in the 1990s, making it challenging to access long-term observational data in Central Asia. The scarcity and uneven distribution of meteorological datasets are disastrous for characterizing climate change, especially extremes. To increase the number of samples, we referred to the NMIC dataset from the Chinese Meteorological Administration (CMA, http://data.cma.cn). This dataset refers to 10 daily datasets from Russia, South Korea, and other countries after standardized processing by data quality control and homogeneous tests. In addition, some selections were applied to the data records in this study. A missing data rate of no more than 1 month per year was required, selecting a period as close to the current climate status as possible. For comparing the differences in extreme precipitation in different regions of Central Asia, the data obtained as extensive a spatial coverage as possible while ensuring that each station had long-term observation records (more than 20 years). Finally, 62 station records from 1985 to 2005 for Central Asia were used in this study.
However, the weakness of meteorological observations to assess climate change in Central Asia forced us to use the gridded data more in previous research. Earlier studies on the evaluation of grid datasets (Hu et al., 2016,2018; Yu et al., 2020; Dilinuer et al., 2021) found that the Global Precipitation Climatology Centre (GPCC) and Asian Precipitation Highly-Resolved Observational Data Integration Towards Evaluation (APHRODITE) datasets have a better capability to represent the changes in precipitation across Central Asia. The GPCC dataset was constructed based on a combination of observations from meteorological and hydrological services. The GPCC dataset (Schneider et al., 2017; Yu et al., 2020) used in this study was the GPCC Full Data Daily Product Version 2018, with a spatial resolution of 1° and a period from form1982 to 2016. The APHRODITE dataset (Yatagai et al., 2012) was created using rain gauge observations of the entire Asian continent from 1951 to 2007. Daily datasets at 0.5° were applied. Gridded datasets were used over the same period of 1985–2005 in this paper.
2.3 Method
2.3.1 Extreme threshold criteria
Two approaches were applied to define the extreme precipitation threshold: parametric and non-parametric. The non-parametric approach utilized the fixed-value method and percentile indices. Owing to the similarity in climatic conditions between Xinjiang and CA5, the selection of fixed-value criteria was referred to the local precipitation standards of Xinjiang (Xiaokaiti et al., 2011). The local precipitation standards of Xinjiang define 6–12 mm/day as medium rain, 12–24 mm/day as heavy rain, and 24–48 mm/day as torrential rain. Hence, this study defined 12 mm (R12) and 24 mm (R24) as the fixed value criteria of extreme precipitation in CA5. The percentile indices were defined as the 90th, 95th, and 99th percentiles (R90p, R95p, and R99p) of the precipitation of wet days. A wet day is defined as a day with total rainfall greater than 0.1 mm. The percentile indices depend on the station observation records and are distributed inconsistently and meaningfully in regions.
The parametric approach calculates the precipitation threshold based on the extreme value theory, often used in hydrometeorology. It is based on the precipitation sequence and uses a statistical distribution function, such as the generalized extreme value, to fit the outputs of precipitation extremes with different return periods. This study constructed a precipitation sequence using the annual maximum method (AM). Owing to the relatively short record of precipitation in Central Asia (21 years), the complementary sequence was defined as the 30 largest precipitation events, except for the AM of each station, to enlarge the precipitation sequence. The optimum fitting model for each station was selected from 43 extreme value fitting models (Supplementary Table S1) by the Kolmogorov-Smirnov test. The threshold of the given return period was calculated using the optimal fitting models based on the precipitation sequences. The return periods of the parametric approach were selected 5 years (5-year) and 10 years (10-year) (Zhang et al., 2017).
2.3.2 Extreme characteristic and trends calculation
The extreme precipitation day is defined as the day with daily precipitation amount greater than the extreme threshold. To assess the characteristics of extreme precipitation by different threshold criteria across Central Asia from 1985 to 2005, we calculated the intensity, frequency and extent trend. The frequency is the extreme precipitation days of all stations (grids). The intensity is defined as the ratio of extreme precipitation amount to total precipitation amount. And the ratio of stations (grids) where extreme precipitation occurred to all stations, is referred to as the extent of extreme precipitation. The trends of intensity, frequency and extent of extreme precipitation are estimated using the Mann-Kendall test (MK test) (Mann, 1945; Kendall, 1975). The statistical significance of the trend was assessed at the 10% level.
2.3.3 Distance between indices of simulation and observation index
In this study, we used a new index to quantify the performance of the simulations of gridded datasets, termed Distance between Indices of Simulation and Observation (DISO), proposed by Hu et al., (2019). The DISO is a combination of multiple statistical metrics and gives a single normalized result for a comprehensive judgment of simulation capability. The statistical combination was flexible and can be selected according to the research needs. It effectively overcomes the limitations of a single indicator. The further advantage of DISO is that the overall performance of the different simulations is quantified by a simple normalized value. It makes complex comparisons simple, intuitive, and understandable.
In this study, DISO is composed of four widely used statistical metrics: correlation coefficient (R), Mean Absolute Error (MAE), Root Mean Squared Error (RMSE) and Mean Absolute Percentage Error (MAPE); the R, RMSE, MAE, and DISO are calculated as follows:
Where Mi and Oi are the simulated precipitation values from gridded datasets and observed precipitation values respectively;
3 Results
3.1 Precipitation climatology
Understanding the regional differences in precipitation is essential to develop an appropriate extreme threshold criterion for different regions. Figure 2 illustrates the spatial distribution of the annual and wet daily mean precipitation in Central Asia, respectively. In the warm season (Figure 2A), annual precipitation in Central Asia prevails less. It was found that the stations in central and southwestern CA5 record less than 100 mm/year and that 20 stations around the Kyzylkum Desert and the Karakum Desert in Uzbekistan and Turkmenistan records less than 50 mm/year. In contrast, the stations record more than 200 mm in northern Kazakhstan. Compared with the warm season, precipitation in the cold season (Figure 2B) is more concentrated in mountainous areas. There are 18 stations in the Tianshan Mountains across Uzbekistan, Tajikistan, and Kyrgyzstan that record precipitation greater than 200 mm/year, and seven stations with precipitation greater than 300 mm/year. The stations located south of the desert and north of Kazakhstan record precipitation ranging from 100 to 200 mm/year. The mean precipitation of the entire area in the cold season is greater than that in the warm season; the lower annual mean precipitation is less than 100 mm/year in central CA5, and no stations record precipitation less than 50 mm/year. Notably, the station in the 45°N-50°N latitudinal area is different from other stations and records uniform precipitation in the cold and warm seasons, between 50 and 100 mm/year.
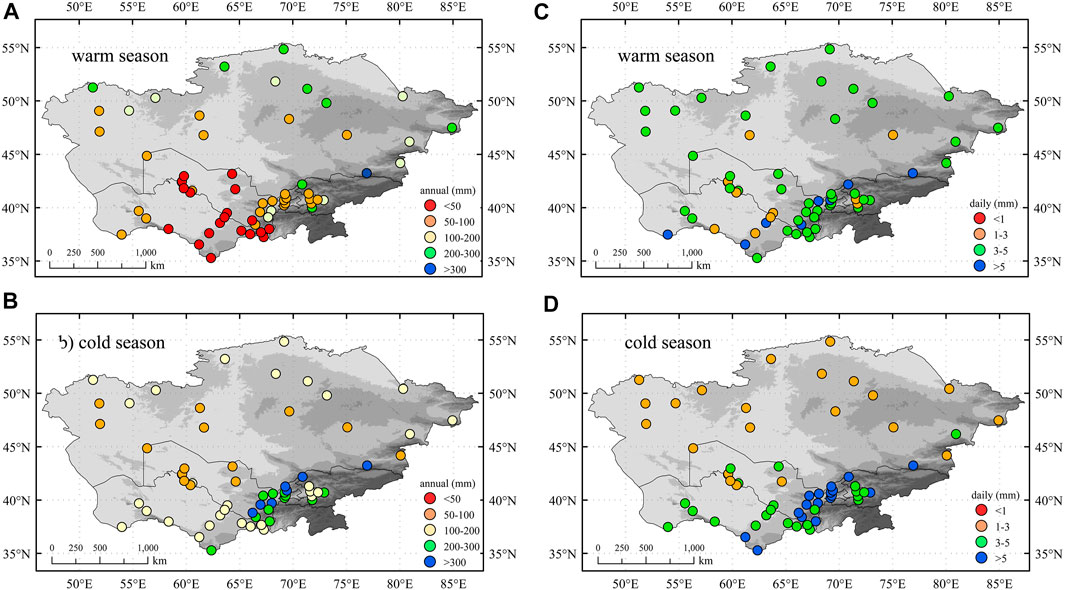
FIGURE 2. Spatial distribution of annual mean precipitation (A,B) and wet-day mean precipitation (C,D) in warm and cold season over Central Asia.
The spatial distribution of wet-day mean precipitation is shown in Figures 2C,D, which provides detailed information on the stations’ precipitation. The wet-day mean precipitation of the stations overall is less than 10 mm, with a maximum of 6.9 mm/day in the warm season and 6.1 mm/day in the cold season. The spatial distribution of daily precipitation is relatively evenly in the warm season (Figure 2C); 69% of the stations’ record wet-day mean precipitation between 3 and 5 mm/day, and 13% of stations record more than 5 mm/day in southeastern CA5 around the Tianshan Mountains. In addition, 18% of the stations’ daily record precipitation is less than 3 mm, mainly located in southwest Central Asia. In contrast, there is a spatial distribution pattern with an apparent difference between the north and south in the cold season (Figure 2D). Kazakhstan stations in northern Central Asia record less than 3 mm/day. In southern CA5, the stations in the west record between 3 and 5 mm/day, and those in the east record more than 5 mm/day. The spatial pattern of precipitation in Central Asia shows higher values in the south during the cold season and higher in the north during the warm season. And the precipitation in the southeast is greater than that in the southwest. The wet-day mean precipitation shows this more clearly.
3.2 Daily extreme precipitation threshold in observations
3.2.1 Statistics of multi-station threshold
Firstly, we overview the threshold across Central Asia during the cold and warm seasons using percentile indices. The extreme thresholds in CA5 are 9.4, 13.6, and 23.9 mm in the 90th, 95th, and 99th percentile indices, respectively. In the warm season, they are 9.9, 14.6, and 27.7 mm. The magnitude of the thresholds was evaluated by taking the absolute value as the criterion; the value of the 90th percentile was less than 12 mm, and the intensity was equal to that of medium rain. R95p was greater than 12 mm, equivalent to heavy rain, and the 99th percentile was at the torrential rain level. Moreover, the thresholds calculated using the annual series with R90p, R95p, and R99p were 9.6, 14.0, and 25.2 mm, respectively; they were nearly equivalent to the mean of the cold and warm seasons.
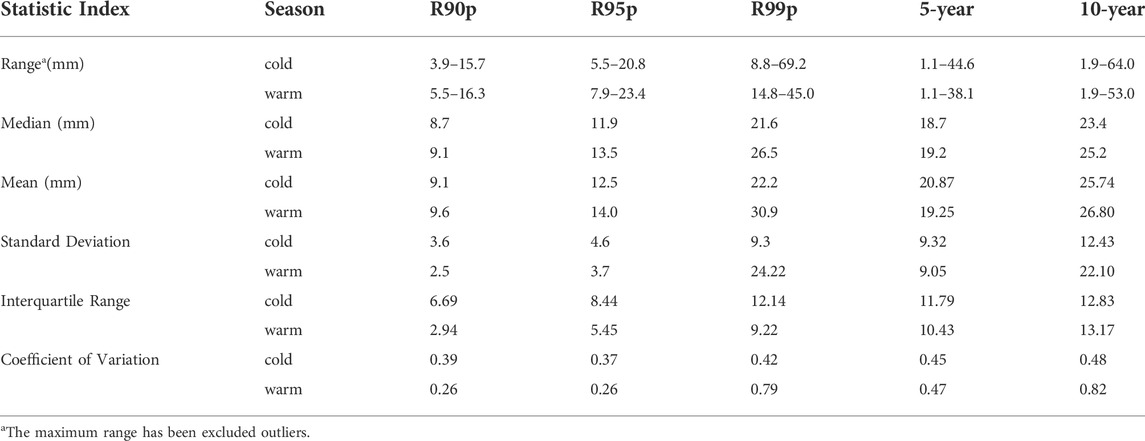
The extreme precipitation thresholds for each of the 62 meteorological stations in Central Asia based on different threshold methods were calculated. The statistics of the distribution are shown in Figure 3. The mean and median thresholds of multi-station are lower than those calculated by the entire Central Asia series mentioned above. More specifically, the results for R90p and R95p were relatively concentrated, with little difference in the precipitation thresholds among the observation stations. In contrast, the threshold selections of the R99p, 5-year, and 10-year indices were more dispersed and had a wide range. The R90p values were generally less than 12 mm, equal to medium rain levels. The median and average values were 8.7 and 9.1 mm (9.1 and 9.6 mm), respectively, in the cold (warm) season. The threshold determined using R95p classified half the stations as having recorded heavy rain in the cold season and more than 67% in the warm season, with medians of 11.9 and 13.5 mm, respectively. The distribution of R99p for the warm and cold seasons was clearly different. In the cold season, 48% of the stations had less than 24 mm (heavy rain), whereas 60% had thresholds of more than 24 mm (torrential rain) in the warm season. The 5-year distribution was mainly concentrated in the heavy rainfall level, with the 10-year values being classified as heavy and torrential rainfall levels close to 50%. Detailed information regarding the statistics of the multi-station extreme thresholds is presented in Table 1.
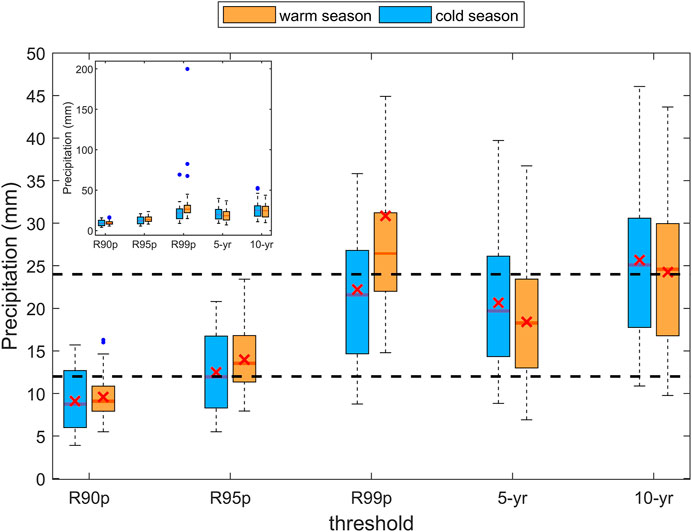
FIGURE 3. Statistics of the different threshold distribution for each station (Red line: median of the thresholds at multiple stations, X: the mean, Point: the outlier, black line: the fixed-value of 12mm, 24 mm respectively).
The statistics results indicate that the concentration is higher when the extreme threshold is relatively small. The dispersion increased when the threshold value was larger, and the number of outliers increased. A higher concentration indicates a lower disparity among the multi-station threshold magnitudes, opposite to dispersion. The dispersion of the thresholds was generally greater in the cold than in the warm season. The distribution of the different threshold criteria was right-skewed in both the cold and warm seasons, with a slightly larger mean than the median. The coefficient of variation (Table 1) shows that both maximum and minimum dispersion appear in the warm season and that the R99p and 10-year dispersion are the largest in the warm season. This was inconsistent with the relatively uniform spatial pattern of wet-day mean precipitation in the warm. Moreover, for the different threshold criteria, the dispersion was lower in the warm than cold seasons according to the percentile indices, and the disparity was not apparent in the parametric approach. In addition, the dispersion of the parametric approach was higher than that of the non-parametric approach, as revealed by the standard deviation (SD), interquartile range (IQR), and coefficient of variation (CV).
The outliers appear in the thresholds defined using the R90p, R99p, and 10-year indices, as shown by the blue points in Figure 3. Outliers were defined as the values with gaps from the upper (lower) quartile more than 1.5 times the IQR. Notably, extreme precipitation thresholds defined by R99p appeared as outliers much larger than three times the IQR. This indicates that the threshold calculated using R99p at some stations is the daily precipitation of record-breaking events that deviate far from the precipitation distribution for those stations. The extreme defined by this criterion significantly constrained the sample of extreme precipitation events, with reduced generalizability and increased specificity. For stations with low mean annual precipitation and frequent extreme precipitation events in recent years, the characteristics of extreme precipitation events captured based on these thresholds were peculiar.
3.2.2 Spatial distribution of different extreme precipitation threshold criteria
A higher threshold concentration indicates that the thresholds have a slight variability in the spatial distribution. Figure 4 represents the spatial distribution of the extreme precipitation thresholds calculated using percentile indices and the parametric approach for the 62 stations in Central Asia; the fixed-value thresholds did not exhibit any difference in spatial distribution and were not considered. For a clearer analysis of the threshold spatial distribution, the threshold magnitudes were divided into four classes, starting at six and going up to 24 mm with 6 mm steps. It refers to the local precipitation criteria in Xinjiang Province, as shown in the legend.
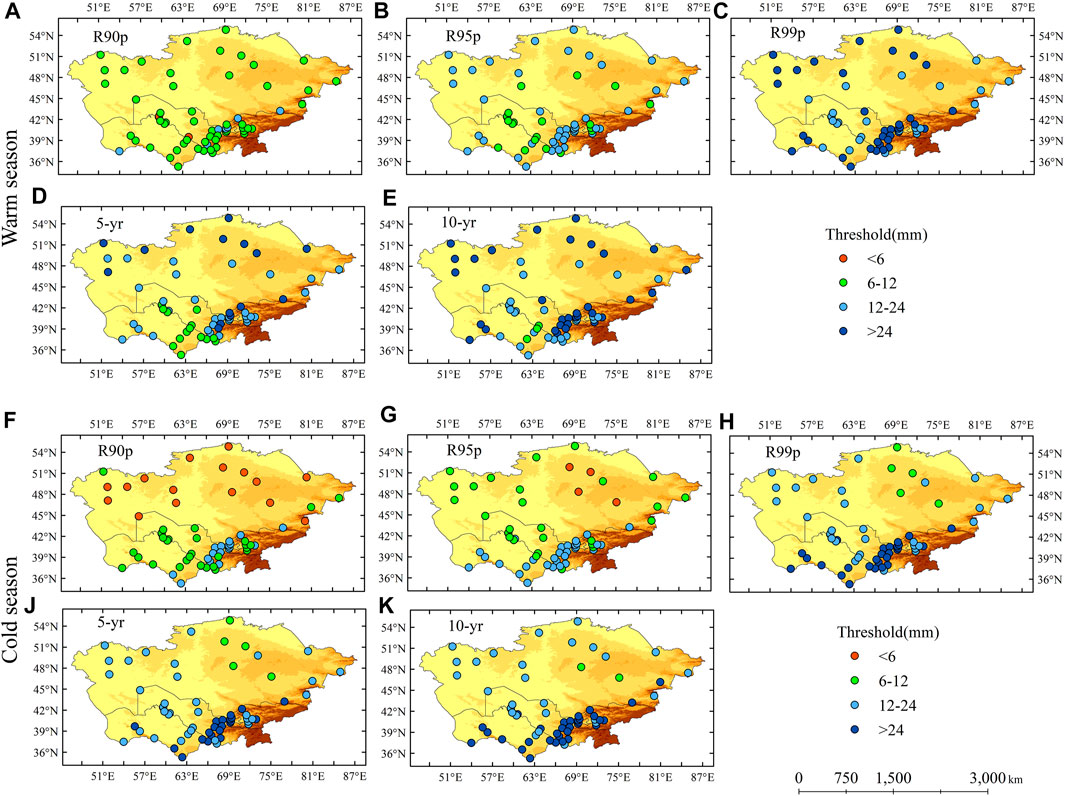
FIGURE 4. Spatial distribution of non-parametric (A–C,F–H) and parametric (D,E,J,K) approaches threshold criteria in warm (A–E) and cold (F–H,J,K) season over Central Asia.
Whether the season was cold or warm, all threshold criteria revealed a non-uniform spatial distribution of the threshold. In the cold season, the spatial pattern of the parametric and non-parametric approaches shows a clear divergence between the north and south; meanwhile, a divergence between the east and west occurred in southern CA5. This pattern was apparent with the 90th percentile indices. The maximum value was for the Tianshan Mountains over southeastern Central Asia, followed by the stations around the Karakum and Kyzylkum Deserts in southwestern CA5; the minimum value was observed at the stations north of the 45°N latitudinal zone. There are four stations located in the Kazakhstan Hills that always exhibit a lower threshold and marked differences from surrounding stations. More specifically, the magnitude of R90p has a clear spatial distribution, with differences between the north and south (Figure 4F). The threshold of less than 6 mm was at the latitudinal zone north of 45°N, except for three stations belonging to class 2 (6–12 mm). The south of the 45°N latitudinal zone was divided into two parts around 66°E, with the east having high threshold values of greater than 12 mm (class 3), while most western areas have threshold values ranging from 6 to 12 mm (class 2). For the R95p indices, the divided line of the value magnitude moved towards south to latitude 42°N.The value belonged to class 2 (6–12 mm) in the north area, whereas four stations had a threshold value of less than 6 mm in the Kazakhstan Hills; the values ranged from 12 to 24 mm (class 3) in the south. A similar spatial distribution was detected for the R99p indices. No station exhibited thresholds less than 6 mm; the threshold values were raised into the next class, greater than 12 mm (except for five stations), and 43.5% of the values were higher than 24 mm in southeast CA5. The spatial distribution of the parametric approach was closely approximated that of R99p, showing a pattern like higher thresholds in the southeast and lower in the north and southwest. The disparity between the north and southwest was slight. Both the 5-year and 10-year indices indicated no stations with thresholds lower than 6 mm; 8.1% of the stations had a threshold value magnitude of class 2, 58.1% of class 3, and 33.9% of class 4 based on the 5-year indices. The percentages of the 10-year indices changed to 3.2%, 45.2%, and 51.6%, respectively.
Unlike the cold season, the high-value areas in the warm season are in northern and southeastern Central Asia, with lower values in central and southwestern CA5. In the warm season, a relatively even spatial pattern was displayed by R90p, with threshold values of 87.1% belonging to class 2, except for two stations in deserts lower than 6 mm and six stations in the Tianshan Mountains exceeding 12 mm. However, the spatial distribution patterns of the R95p, R99p, 5-year, and 10-year indices are approximately the “high-low-high” pattern from north to south. The thresholds in northern Central Asia were higher, approximately more than 24 mm, as calculated using R99p and the parametric approach. They were lower in central CA5; the thresholds were to class 2 based on R95p and class 3 based on the R99p, 5-year, and 10-year indices. The threshold of southern CA5 was higher in the southeast, with the value of extreme precipitation being more than 12 mm (R95p and 5-year) or 24 mm (R99p and 10-year), and lower in the southwest, with values ranging from 6 to 24 mm.
In general, the extreme precipitation threshold in Central Asia showed a spatial distribution pattern of “higher in the south and lower in the north” during the cold season. While in the warm, it exhibited an approximately “higher-lower-higher” pattern from north to south. The spatial distributions of the parametric and non-parametric methods are generally consistent. In particular, R90p shows a clear pattern difference between the north and south in the cold season and a region-wide consistency in the warm season, which is inconsistent with other threshold criteria.
3.2.3 Trends of extreme precipitation characteristics by different thresholds
To compare the performance of different threshold criteria in Central Asia, we computed the intensity, frequency, and extent of extreme precipitation and explored its temporal and spatial trends. Figure 5 shows the interannual variability and trends of intensity, frequency, and extent of extreme precipitation in Central Asia from 1985 to 2005 using seven different threshold criteria. The result indicates a slightly increasing trend, albeit insignificant, in the intensity, frequency, and extent of extreme precipitation during the warm and cold seasons from 1985 to 2005. And the trend determined by different threshold criteria was generally consistent. It is interesting that, as shown in Figure 5B, the intensity determined by seven threshold criteria was divided into three groups. R90p is the minor threshold and captures the largest intensity values; the R95p and R12 capture medium values; R24, R99p, 5-year, and 10-year were almost identical and were lower than that of other thresholds. And the intensity value gap among the larger threshold group (R24, R99p, and 10-year), the medium threshold group (R95p and R12), and the lower threshold group (R90p) is noticeable. The warm season also has a similar pattern (Figure 5A), but the intensity magnitude gap of groups is lower than that in the cold. Similar features were also observed for the frequency (Figures 5C,D) and extent (Figures 5E,F) of extreme precipitation. The magnitude gap between the lower and medium threshold groups is small in the extent and frequency of extreme precipitation. And extent determined by R90p shows extreme precipitation occurring over a large range (even the whole area) during the cold season in some years. This information need to be considered when selecting the threshold.
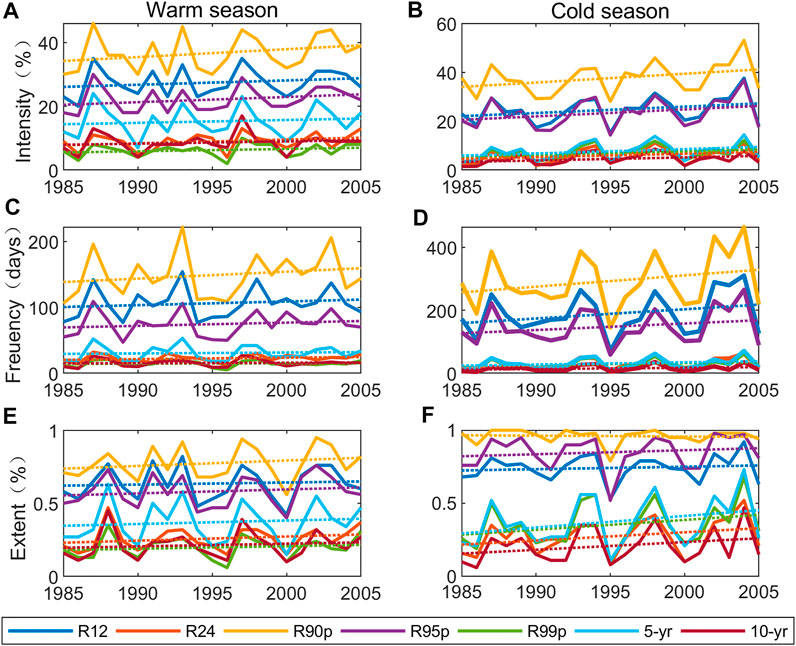
FIGURE 5. The variation (solid line) and trend (dotted line) of intensity (A,B), frequency (C,D) and extent (E,F) of extreme precipitation by seven threshold criteria in Central Asia from 1985 to 2005.
However, the characteristics of extreme precipitation at each station did not exhibit a consistent trend in spatial. Figure 6 reflects the trend of intensity (a, b) and frequency (c, d) at each station in Central Asia from 1985 to 2005. Most stations in Central Asia show no obvious trend in intensity and frequency. For the intensity of extreme precipitation, MK trend test results indicate that only six stations exhibited increase trends and three stations showed decrease trends in the warm. While there were16 stations that showed an increase, three stations showed a decreasing trend in the cold season. The results of frequency showed that only 4 (9) stations exhibited a positive trend and 3 (3) stations exhibited a negative trend in the warm (cold) season. The significance of the trend was assessed at the 10% level. The pie chart in Figure 6 displayed the threshold criteria that exhibited the same significant trend and its amounts in each station. Most stations could only show significant increasing or decreasing trends under one or two threshold criteria. None of the stations showed a consistent significant trend across all seven threshold criteria. The choice of thresholds will influence the conclusion of extreme precipitation spatial trends.
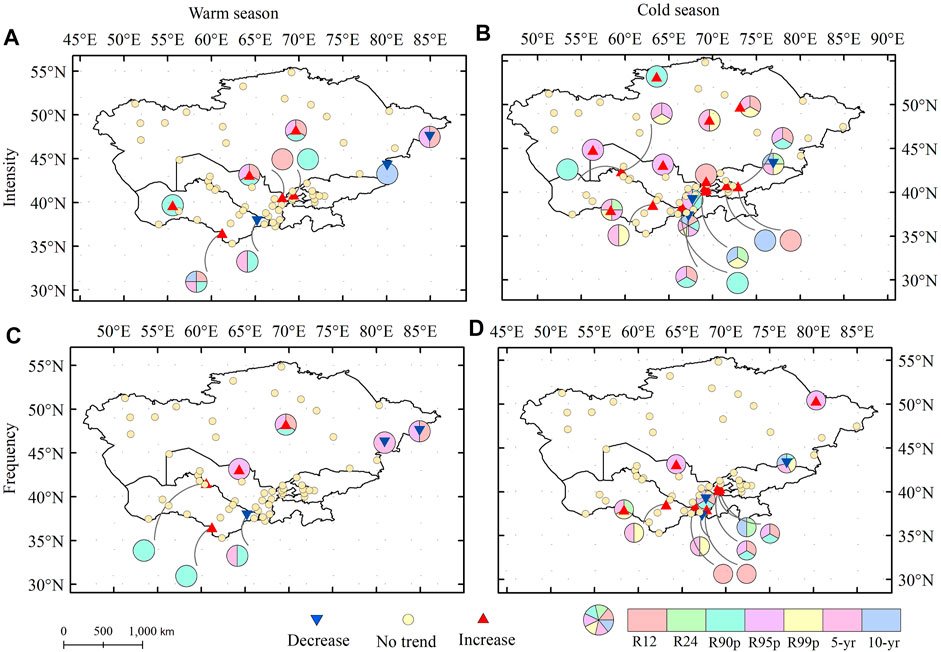
FIGURE 6. Spatial map for intensity (A,B) and frequency (C,D) of extreme precipitation trend with significance in Central Asia from 1985 to 2005. (The pie: threshold criteria that exhibited the same significant trend and its amounts; trend: at a significance level of 10% by the MK test).
3.3 Daily extreme precipitation threshold in gridded datasets
3.3.1 Threshold in gridded datasets
Before the calculation of extreme threshold, we evaluated the performance of the APHRODITE and GPCC gridded datasets from an annual and daily precipitation perspective using the four statistic metrics (R, MAE, RMSE and MAPE) and DISO index (Table 2). The gridded data were interpolated to 62 stations. The DISO values for daily precipitation of the APHRODITE and GPCC datasets are 0.27 and 0.34, respectively. It is clear that both datasets exhibit good simulation capabilities in the precipitation of Central Asia.
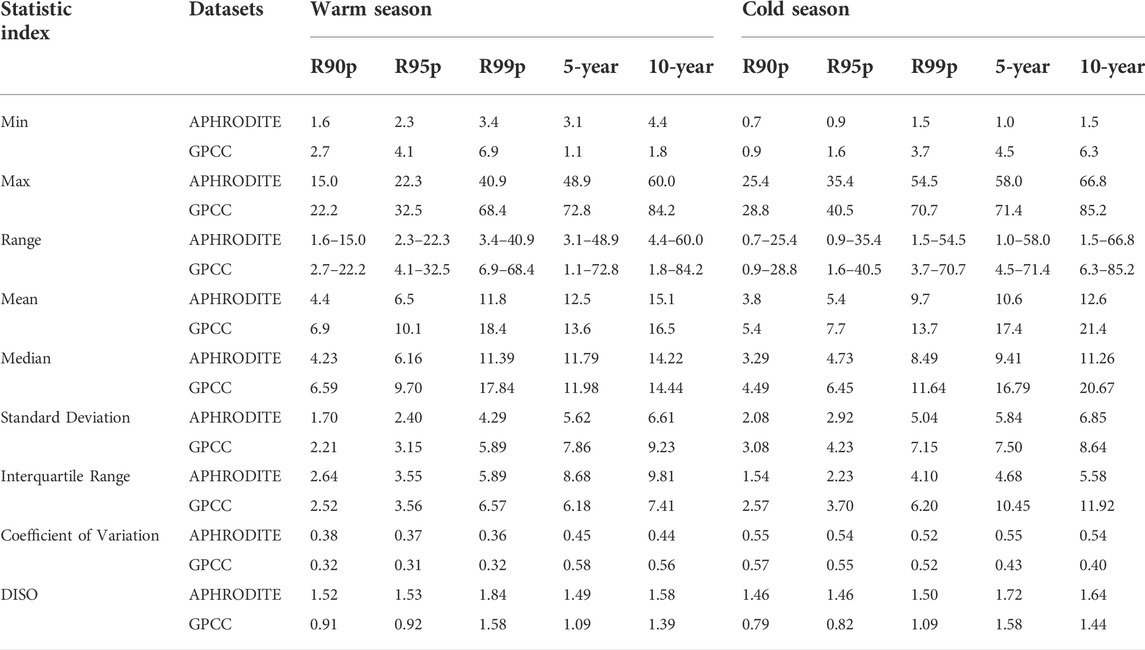
Figure 7 illustrates the spatial distribution of percentile indices in Central Asia from 1985 to 2015, based on two grid datasets (APHRODITE and GPCC). The first (a, b, and c) and third rows (g, h, and i) represent the APHRODITE dataset, and the second (d, e, and f) and fourth rows (j, k, and l) represent the GPCC dataset. In the warm season, the spatial distribution pattern for APHRODITE shows high values in the northern and southeastern mountainous regions of Central Asia, mainly in the Tianshan Mountains, Altai Mountains, Turgay Plato, and West Siberian Plain. The lower-value areas were located around the Aral Sea and the Karakum Desert in central and southwestern Central Asia. Furthermore, the extreme precipitation threshold value in Central Asia based on the R90p was small; the value was less than 6 mm for 79% of the region, and the maximum was greater than 12 mm only for 0.2% of the region. The threshold of R90p, R95p, and R99p across Central Asia were calculated based on the APHRODITE dataset to be about 4.7, 7.0, and 13.11 mm, respectively, and they were nearly 52.3% lower on average than the observations. A relatively uniform spatial distribution was displayed with the GPCC dataset in the warm season, especially with the R95p and R99p criteria, which classified more than 70% of the area in the same precipitation threshold class. This dataset exhibited a peak value for the Tianshan Mountains of southeastern Central Asia. The threshold values for the percentile threshold of the GPCC dataset were about 6.9, 10.1, and 18.7 mm using threshold criteria of R90p, R95p, and R99p, respectively, which were about 31.1% lower on average than the observations. In the cold season, the threshold calculated by the APHRODITE dataset showed a distinct spatial distribution, with a high-value region located in the mountainous areas of southeastern Central Asia. There also has a peak value in southeastern Central Asia in the GPCC dataset, but a sub-large region occurs in the southwest. The threshold values across Central Asia for R90p, R95p, and R99p are 3.9, 5.9, and 11.8 mm, respectively, based on the APHRODITE grid dataset; they were about 55% lower on average than the observations. The GPCC values (5.3, 7.9, and 15.5 mm) were about 40% lower on average than the observations.
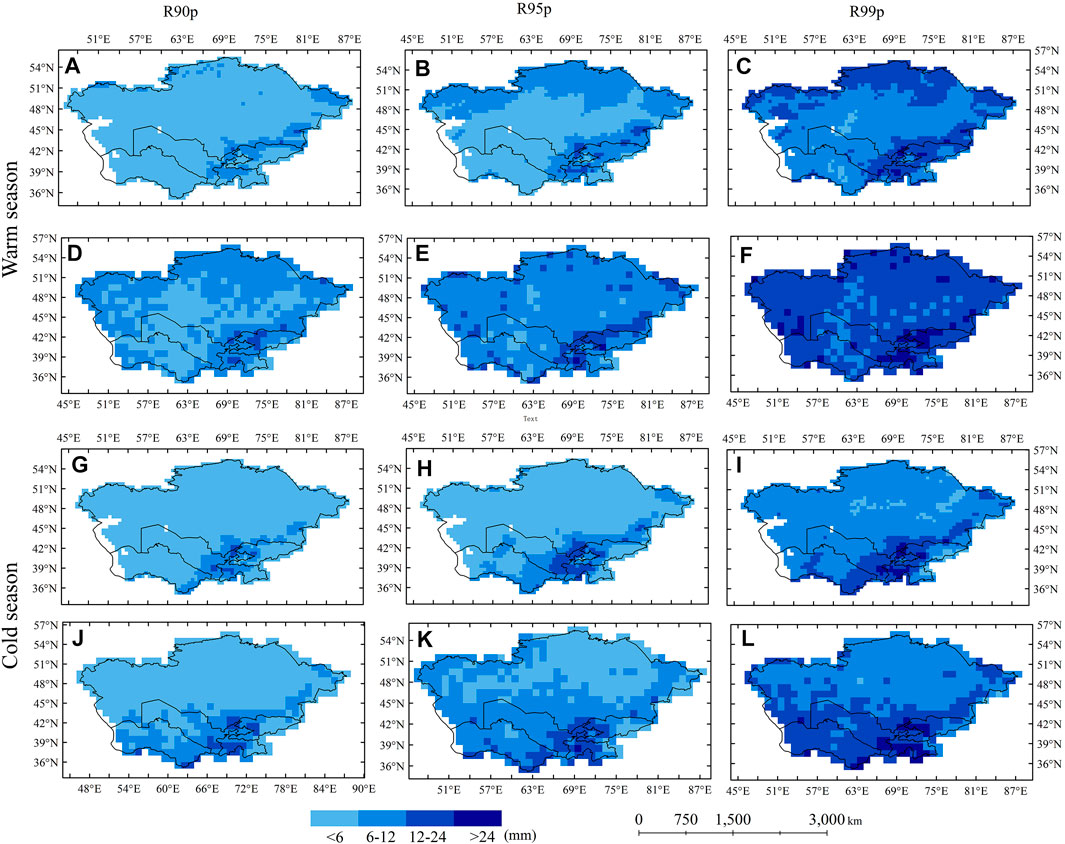
FIGURE 7. The threshold spatial distribution of APHRODITE (A–C,G–I) and GPCC (D–F,J–L) datasets by the percentile indices in warm and cold season over Central Asia.
Figure 8 shows the spatial distribution of the extreme precipitation threshold by the parametric approach. The spatial distribution pattern of the APHRODITE dataset obtained using the parametric approach was similar to that obtained using the percentile method. However, the distinction between high- and low-value regions was more apparent. In Turgayskoye Plato, northeast of CA5, the 10-year criterion reveals a sub-high-value area in the cold season, which did not appear for other threshold criteria. The spatial distribution of the parametric approach and percentile indices for the GPCC dataset were approximate. The parametric approach distribution showed more evidence of the low-value area in the southwest during the warm season than that in percentile indices. The 5-year and 10-year extreme thresholds of the APHRODITE dataset were 12.5 and 15.1 mm (10.6 and 12.6 mm) in the warm (cold) season, respectively, which are 39.4% (50.1%) lower than the observed average. The thresholds for the GPCC dataset in the warm (cold) season were17.4 and 21.4 mm (13.6 and 16.5 mm), which were about 16.5% (33.8%) lower than the observed values on average. Detailed information regarding the statistics of extreme thresholds by APHRODITE and GPCC datasets is presented in Table 3.
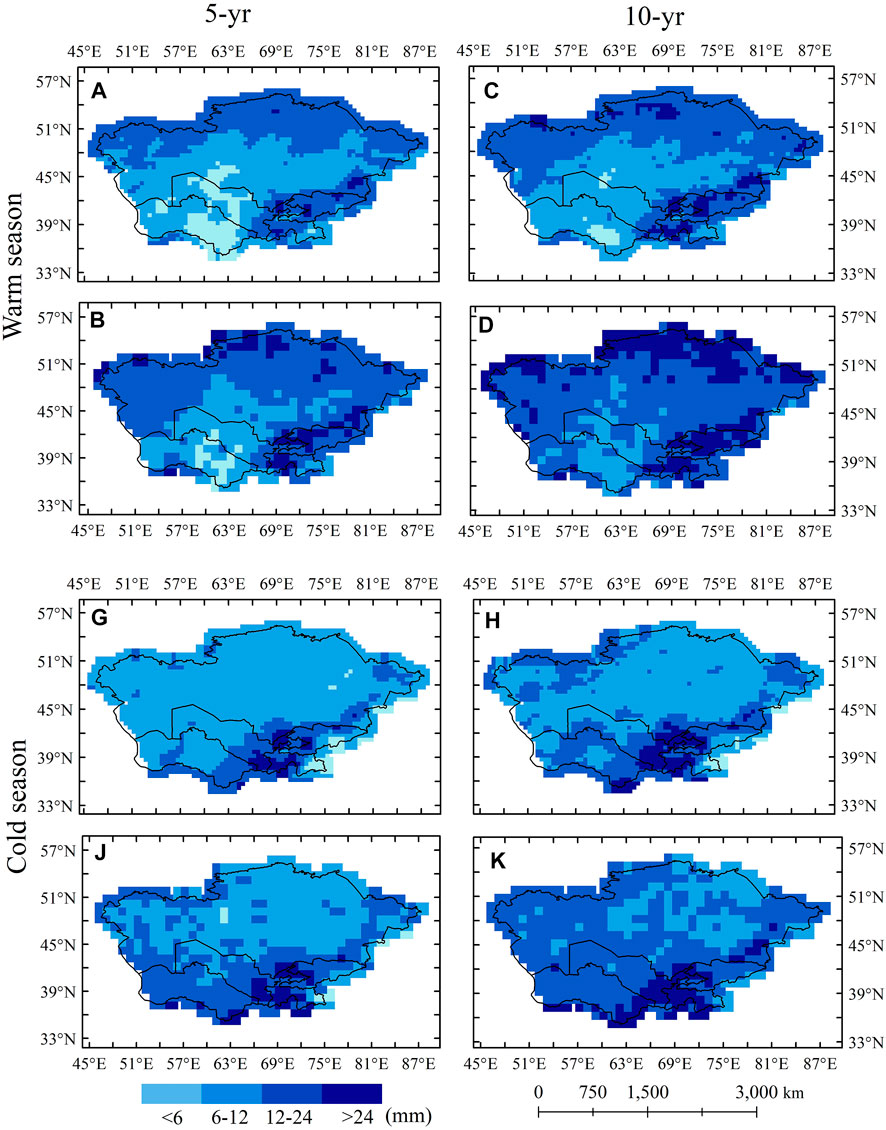
FIGURE 8. The threshold spatial distribution of APHRODITE (A,C,G,H)and GPCC (B,D,J,K) datasets by the parametric apporach in warm and cold season over Central Asia.
In summary, both the APHRODITE and GPCC grid datasets appropriately describe the spatial distribution of extreme precipitation thresholds in Central Asia, both in the cold and warm seasons. The APHRODITE dataset was more precise and realistic than the GPCC dataset because of its higher resolution. However, the threshold value of the gridded datasets is underestimated compared to the observations, and the APHRODITE dataset underestimates more. The magnitude of the threshold value based on the GPCC dataset under the same criteria was higher than that of the APHRODITE dataset, especially in the central and southwestern regions of Central Asia. The DISO index (Table 3) for each extreme precipitation threshold gives an intuitive comparison of the two datasets. The GPCC dataset was superior at reproducing all the extreme precipitation thresholds to APHRODITE dataset, whether in cold or warm seasons. Additionally, both datasets perform relatively best in simulating the percentile indices.
3.3.2 Trends of extreme precipitation in gridded datasets
Based on the APHRODITE and GPCC datasets, we calculated the intensity, frequency, and extent of extreme precipitation in Central Asia using different threshold criteria. As shown in Figure 9, there have been no significant trends in intensity, frequency, and extent of extreme precipitation from 1985 to 2005. Opposite to observations, APHRODITE shows a weak decreasing trend in intensity and frequency in the warm season. Furthermore, smaller values of extreme precipitation characteristics were obtained for all thresholds except R90p and R95p. The absolute value of R24 does not apply to extreme precipitation for the APHRODITE dataset due to its difficulty obtaining valid information. The GPCC datasets show a weak increase trend in both the cold and warm seasons, which is consistent with observations. The extent by R90p both exhibited a high proportion of both APHRODITE and GPCC dataset, whether warm or cold season.
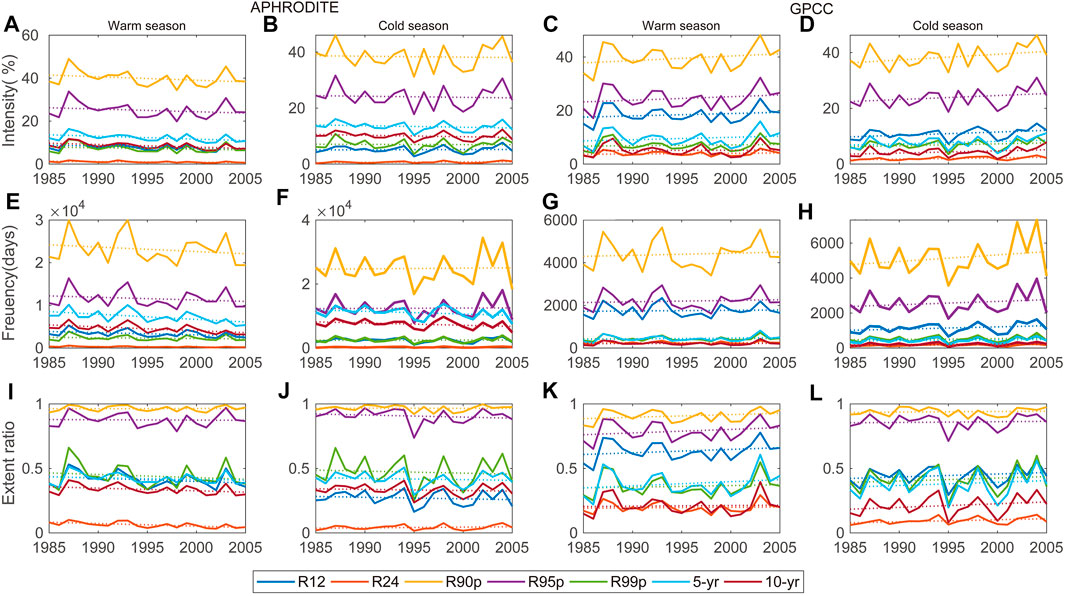
FIGURE 9. The variation (solid line) and trend (dotted line) of intensity (A–D), frequency (E–H), and extent (I–L) of extreme precipitation by seven threshold criteria based on APHRODITE and GPCC datasets over Central Asia from 1985 to 2005.
The spatial distribution of extreme precipitation intensity and frequency trends is shown in Figure 10. A grid is drawn in red (blue), which means that there is at least one threshold for a significant increase (decrease)trend in this grid. And it has a consistent trend in seven threshold criteria when the grid is drawn with shadow. For the APHRODITE dataset, the spatial distribution of intensity trends is generally similar to frequency. There were 7.62% (9.05%) areas with an increasing trend and 15.28% (11.98%) with a decreasing trend in intensity (frequency) in the warm season. The decrease was mainly in the mountainous areas in southeastern CA5 and Kazakhstan Hills in the east. The growth trend is mainly in the Turgayskoye Plato for frequency, with no clear regional trend of increase in intensity. In the cold season,12.12% (10.99%) areas showed an increase, most in the eastern CA5 in intensity (frequency), and the decreased trend is mainly located in northwestern and southeastern CA5, with 13.34% (10.75%). Moreover, the decreased area in the mountainous regions of Tajikistan detects a consistent trend, but the number is scarce (less than 1%).
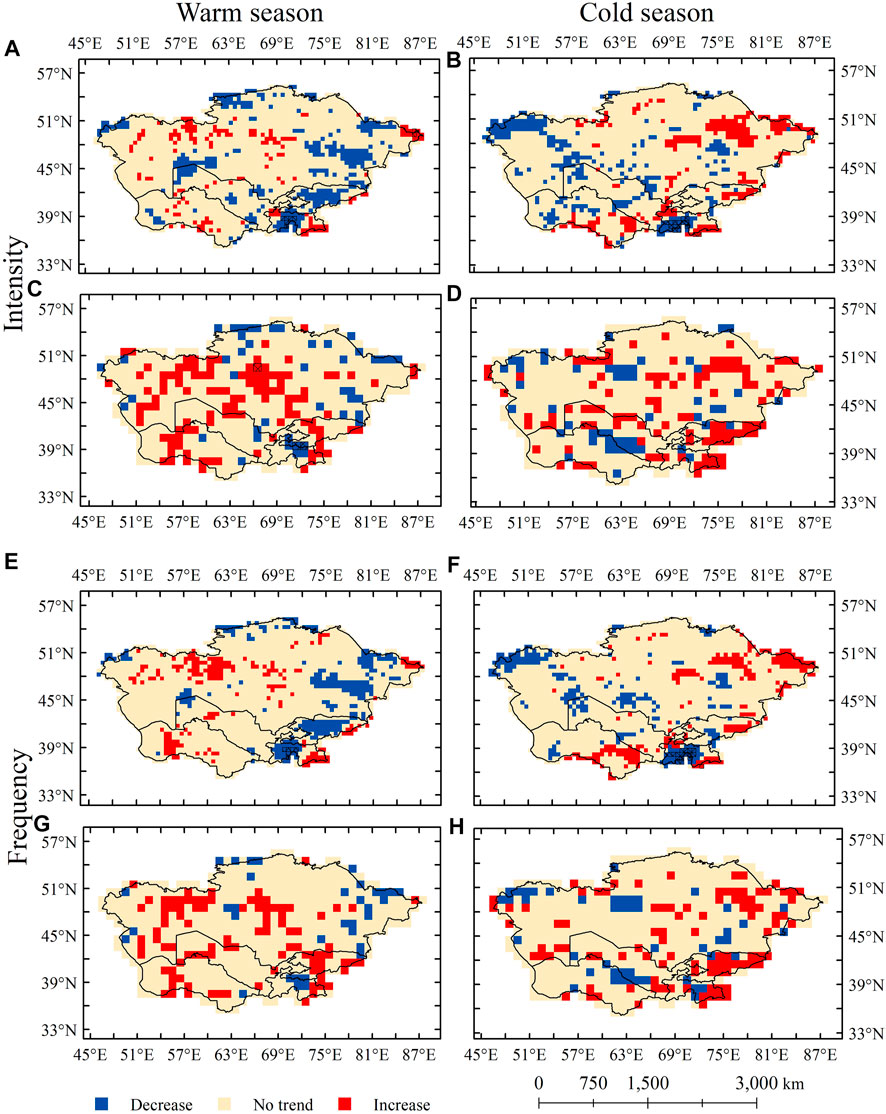
FIGURE 10. Spatial distribution for intensity and frequency of extreme precipitation trend with significance by APHRODITE (A,B,E,F) and GPCC(C,D,G,H) datasets over Central Asia from 1985 to 2005. (The trend: at a significance level of 10% by the MK test; grid with shadow: a grid with a consistent significant trend in different threshold criteria).
The GPCC dataset shows a more dispersed spatial trend than the APHRODITE dataset. In the warm season, there is an increasing trend of about 20.21% (17.17%) for intensity (frequency) mainly located in the central and southeastern CA5. While the decreasing trend has no obvious regional signal, with portion about 8.05% and 6.08% for intensity and frequency. In the cold season, a significant increasing trend was depicted in the southeastern part of Central Asia, and it was 19.5% and 17.71% for intensity and frequency; the decreasing trend with the portion about 19.5% and 17.71%. GPCC only detected a consistent decreasing trend of intensity during the warm season, with only two grids in the southeastern CA5. Different thresholds still cannot show a uniform trend in spatial distribution. Different threshold selection criteria will bring different spatial trend results. The choice of precipitation thresholds and grid datasets affects the results when analyzing the trends of precipitation characteristics in Central Asia.
4 Discussion
The determination of extreme precipitation thresholds is the beginning of extreme precipitation research. Threshold selection is generally based on the researcher’s experience and is highly subjective. In this paper, we discuss the performance of parametric and non-parametric approaches for analyzing extreme precipitation in Central Asia. Percentile indices tend to examine the moderate extremes (Zhang et al., 2011; Schär et al., 2016); the extreme thresholds defined by the parametric approach are closer to the “extremes” but are complex. We have referred to the research work of Anagnostopoulou and Tolika (2012) to briefly discuss the selection of extreme precipitation thresholds for Central Asia.
Extreme precipitation events should meet the “rare” criterion and require a sufficient sample size for subsequent analysis of such events. There are two criteria for the threshold selection in this part: a sample rate of less than 10% and a sample size larger than 21 (1 event per year). The 21 sample size was equal to the average sample rate of 7.3% and 2.4% in the warm and cold season, respectively. As shown in Figure 11, almost all the threshold criteria met the requirement of a sample rate of less than 10%, except R90p, which had an average sample rate of 10.3% (10.5%) in the cold (warm) season. On the other hand, the R24, R99p, 5-year, and 10-year criteria did not meet the requirement of a sample size greater than 21 in both cold and warm seasons. R12 and R95p were met by all stations in the cold season, whereas 58% and 45.16% of stations met in the warm season. In summary, R95p was comparatively more suitable for extreme precipitation threshold selection at most stations since it combined the spatial expression and sample size. It was consistent with the findings of Wang Z. et al (2020) which was suggested that the 93–96th percentile is optimal for determining extreme precipitation in Central Asia. Lai et al. (2020) and Ma et al. (2020) also used R95p to analyze extreme precipitation characteristics in Central Asia. Nevertheless, Schär et al. (2016) showed that the wet-day percentile index has some limitations and can underestimate heavy rainfall events. The choice of the percentile index for wet days and full days requires further detailed study.
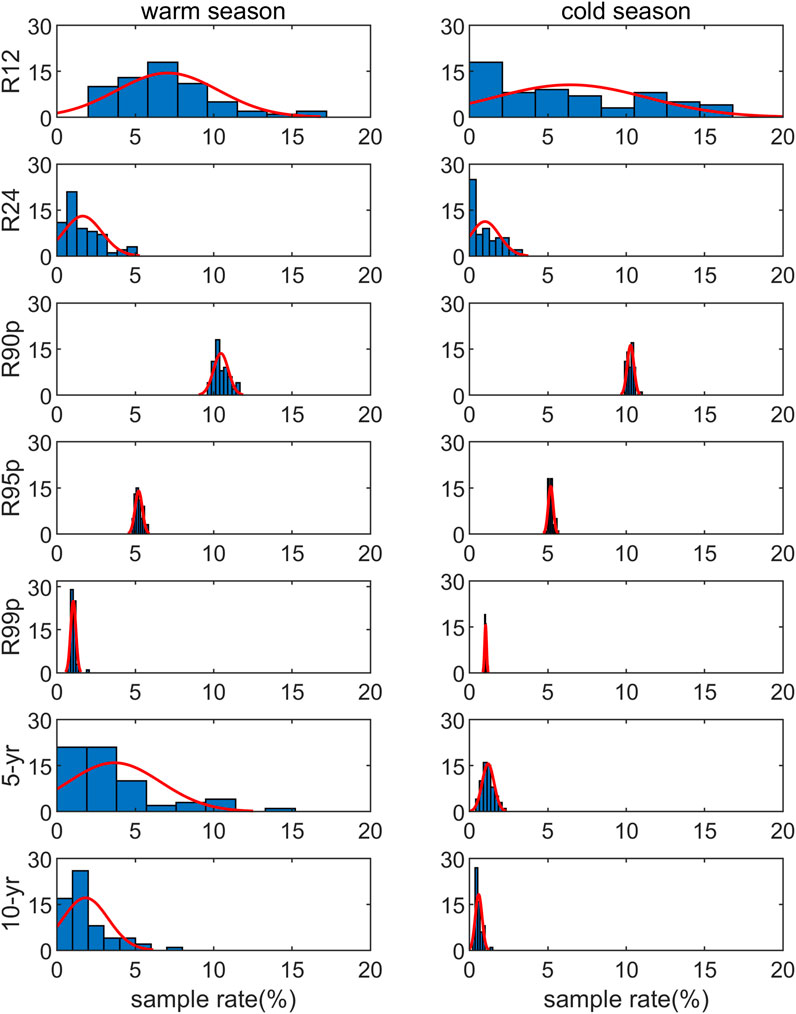
FIGURE 11. The distribution for the sample rate of different threshold criteria in multi-stations (Blue bar: histogram of sample rate; red line: distribution fit by normal function).
The shortage of long-term meteorological observation data in Central Asia has resulted in significant limitations to this study. The observation data used in this study were from 1985 to 2005. The extreme precipitation threshold cannot fully and accurately reflect the actual conditions of current extreme precipitation. However, Yao et al. (2021) indicated the stability of total precipitation and annual maximum 1-day precipitation (R1Xday) in Central Asia during a historical period based on the longest meteorological observations (1881–2006) and tree-ring reconstructed series (1756–2012 and 1760–2015). This suggests that the results of this study can be used as a reference for extreme precipitation threshold selection in Central Asia over different periods to a certain extent.
Meanwhile, we calculated the extreme precipitation thresholds for Central Asia based on the GPCC dataset using the parametric and non-parametric approaches for the period of 1982–2016 and 2006–2016, as shown in Table 4. Relative to the extreme precipitation thresholds from 1985 to 2005, the percentile method precipitation thresholds for 1982–2016 increased by approximately 8.3% (1.3 mm) in the warm season and 10.5% (1.5 mm) in the cold season. The parametric method was more extreme than percentile indices, with a higher increment. It was 15.9% (3.1 mm) in the warm season and 15.8% (2.4 mm) in the cold season. Due to global warming, heavy precipitation events have increased and intensified in Central Asia (Hu et al., 2016; Hu et al., 2019b; Lai et al., 2020; Yao et al., 2020). There is an evident increase in precipitation thresholds in the latter decade (2006–2016). Despite that, they are still much smaller than observed.
The underestimation of the threshold by the APHRODITE gridded dataset is consistent with the results of Lai et al. (2020). It may be because some stations with strong extreme events were excluded by the quality control of the APHRODITE dataset. Distribution-based interpolation (Yatagai et al., 2012) also makes the APHRODITE dataset underestimate precipitation and extreme events in Central Asia. The GPCC dataset also exhibited a systematic underestimation, resulting in low extreme precipitation thresholds. This underestimation of the daily extreme threshold values is in agreement with the underestimation of the monthly and annual precipitation of the CRU (Hu et al., 2018).
5 Conclusion
Central Asia is strongly affected by global warming, and the number of extreme events has increased significantly. The extreme threshold is the core of extreme event studies. This study determined extreme precipitation thresholds using parametric and non-parametric approaches based on daily rain records and two grid datasets (APHRODITE and GPCC) for Central Asia from 1985 to 2005. The statistical and spatial distributions of the different threshold criteria were analyzed, the trend of extreme precipitation has been discussed, and an assessment of the grid dataset from an extreme threshold perspective. The main conclusions are summarized as follows.
There are apparent differences in precipitation between the cold and warm seasons in Central Asia, with an apparent disparity in spatial distribution. Cold season precipitation is dominant in the south, warm precipitation is dominant in the north, and precipitation is uniform throughout the year at the 45°N-50°N latitudes. The problem of extreme precipitation in Central Asia should be discussed seasonally and zonally. The mean thresholds across Central Asia in the cold (warm) season are 9.1, 13.5, 26.5, 19.2, and 25.2 mm (9.6, 14.0, 30.9, 19.3, and 26.8 mm), as determined using the non-parametric approach (90th, 95th, and 99th percentile indices) and parametric approach (return periods of 5 and 10 years), respectively. The threshold determined by the percentile indices in the warm season is slightly higher than in the cold season. The parametric approach is the opposite. The spatial distribution of the extreme precipitation threshold was similar to that of precipitation. The maxima of the extreme precipitation threshold values were distributed along the mountains in Central Asia in both the observations and the two grid datasets. Northern and southeastern Central Asia are two large-value areas, whereas central and southwestern Central Asia are low-value areas. The APHRODITE and GPCC datasets well characterized the spatial distribution of extreme thresholds in Central Asia. But the threshold value was significantly underestimated, and the APHRODITE dataset underestimated it more. There is no significant trend in the intensity, frequency, and extent of extreme precipitation in Central Asia from 1985 to 2005. The different threshold criteria showed consistent trends in time but not in spatial. This feature is confirmed by both the observations and the two gridded datasets. The study showed that the choice of extreme precipitation thresholds affects the conclusion of extreme precipitation spatial trends. In general, extreme precipitation thresholds should be determined using different approaches, depending on the objectives of each study. The choice of thresholds requires adjusting the balance between sufficient samples and extremes. For Central Asia, it is evident from the present analysis that parametric and non-parametric approaches have proved effective in achieving this objective.
Data availability statement
The original contributions presented in the study are included in the article/Supplementary Material, further inquiries can be directed to the corresponding author.
Author contributions
JC performed the analysis and wrote the manuscript. JY is the Corresponding author, reviewed and edited the manuscript. LY contributed to the conception and design of the study. TD and JL organized the database. WM and SL contributed to the visualization and reviewed the manuscript.
Funding
This work was funded by the National Natural Science Foundation of China (U1903113, 42,171,038); Basic Research Operating Expenses of the Central level Non-profit Research Institutes (IDM2022002); Guiding Planning Project of the Xinjiang Meteorological Bureau (YD202207).
Conflict of interest
The authors declare that the research was conducted in the absence of any commercial or financial relationships that could be construed as a potential conflict of interest.
Publisher’s note
All claims expressed in this article are solely those of the authors and do not necessarily represent those of their affiliated organizations, or those of the publisher, the editors and the reviewers. Any product that may be evaluated in this article, or claim that may be made by its manufacturer, is not guaranteed or endorsed by the publisher.
Supplementary material
The Supplementary Material for this article can be found online at: https://www.frontiersin.org/articles/10.3389/fenvs.2022.1007365/full#supplementary-material
References
Anagnostopoulou, C., and Tolika, K. (2012). Extreme precipitation in europe: Statistical threshold selection based on climatological criteria. Theor. Appl. Climatol. 107, 479–489. doi:10.1007/s00704-011-0487-8
Bothe, O., Fraedrich, K., and Zhu, X. (2012). Precipitation climate of Central Asia and the large-scale atmospheric circulation. Theor. Appl. Climatol. 108, 345–354. doi:10.1007/s00704-011-0537-2
Chen, F. H., Huang, W., Jin, L. Y., Chen, J. H., and Wang, J. S. (2011). Spatiotemporal precipitation variations in the arid Central Asia in the context of global warming. Sci. China Earth Sci. 54, 1812–1821. doi:10.1007/s11430-011-4333-8
Chen, X., Jiang, F., Wang, Y., Li, Y., and Hu, R. (2013). Characteristics of the eco-geographical pattern in arid land of central Asia. Arid zone Res. 30 (3), 385–390. [in Chinese].
Chen, X., Wang, S., Hu, Z., Zhou, Q., and Hu, Q. (2018). Spatiotemporal characteristics of seasonal precipitation and their relationships with ENSO in Central Asia during 1901–2013. J. Geogr. Sci. 28, 1341–1368. doi:10.1007/s11442-018-1529-2
Dai, X. G., and Wang, P. (2017). A new classification of large-scale climate regimes around the Tibetan Plateau based on seasonal circulation patterns. Adv. Clim. Change Res. 8, 26–36. doi:10.1016/j.accre.2017.01.001
Dilinuer, T., Yao, J., Chen, J., Zhao, Y., Mao, W., Li, J., et al. (2021). Systematical evaluation of three gridded daily precipitation products against rain gauge observations over central Asia. Front. Earth Sci. 9, 1–17. doi:10.3389/feart.2021.699628
Guan, X., Yao, J., and Schneider, C. (2022a). Variability of the precipitation over the Tianshan Mountains, Central Asia. Part I: Linear and nonlinear trends of the annual and seasonal precipitation. Int. J. Climatol. 42, 118–138. doi:10.1002/joc.7235
Guan, X., Yao, J., and Schneider, C. (2022b). Variability of the precipitation over the Tianshan Mountains, Central Asia. Part II: Multi-decadal precipitation trends and their association with atmospheric circulation in both the winter and summer seasons. Int. J. Climatol. 42, 139–156. doi:10.1002/joc.7236
Hu, R., Jiang, F., Wang, Y., Li, J., Li, Y., Abdimijit, A., et al. (2014a). Arid ecological and geographical conditions in five countries of Central Asia. Arid. Zone Res. 31 (1), 1–12. [in Chinese].
Hu, Z., Chen, X., Zhou, Q., Yin, G., and Liu, J. (2022). Dynamical variations of the terrestrial water cycle components and the influences of the climate factors over the Aral Sea Basin through multiple datasets. J. Hydrology 604, 127270. doi:10.1016/j.jhydrol.2021.127270
Hu, Z., Chen, X., Chen, D., Li, J., Wang, S., Zhou, Q., et al. (2019a). Dry gets drier, wet gets wetter”: A case study over the arid regions of central Asia. Int. J. Climatol. 39, 1072–1091. doi:10.1002/joc.5863
Hu, Z., Chen, X., Zhou, Q., Chen, D., and Li, J. (2019b). Diso: A rethink of taylor diagram. Int. J. Climatol. 39 (5), 2825–2832. doi:10.1002/joc.5972
Hu, Z., Hu, Q., Zhang, C., Chen, X., and Li, Q. (2016). Evaluation of reanalysis, spatially interpolated and satellite remotely sensed precipitation data sets in central Asia. J. Geophys. Res. Atmos. 121, 5648–5663. doi:10.1002/2016JD024781
Hu, Z., Zhang, C., Hu, Q., and Tian, H. (2014b). Temperature changes in central Asia from 1979 to 2011 based on multiple datasets. J. Clim. 27, 1143–1167. doi:10.1175/JCLI-D-13-00064.1
Hu, Z., Zhou, Q., Chen, X., Li, J., Li, Q., Chen, D., et al. (2018). Evaluation of three global gridded precipitation data sets in central Asia based on rain gauge observations. Int. J. Climatol. 38, 3475–3493. doi:10.1002/joc.5510
Hu, Z., Zhou, Q., Chen, X., Qian, C., Wang, S., and Li, J. (2017). Variations and changes of annual precipitation in Central Asia over the last century. Int. J. Climatol. 37, 157–170. doi:10.1002/joc.4988
Jiang, Y., Yin, Y., Cheng, P., Sun, H., and JingFan, J. (2017). Study on probabilistic characteristic and uncertainty in fitting of precipitation extremes over Xinjiang during 1961-2014. Adv. Clim. Change Res. 13 (1), 52. doi:10.12006/j.issn.1673-1719.2016.162
Kendall, M. G. (1975). Rank correlation measures. Charles Griffin book series. London: Oxford University Press.
Lai, S., Xie, Z., Bueh, C., and Gong, Y. (2020). Fidelity of the APHRODITE dataset in representing extreme precipitation over central Asia. Adv. Atmos. Sci. 37, 1405–1416. doi:10.1007/s00376-020-0098-3
Lu, X. Y., Tang, G. Q., Liu, X. C., Wang, X. Q., and Wei, M. (2021). The potential and uncertainty of triple collocation in assessing satellite precipitation products in Central Asia. Atmos. Res. 252, 105452. doi:10.1016/j.atmosres.2021.105452
Ma, Q., Zhang, J., Game, A. T., Chang, Y., and Li, S. (2020). Spatiotemporal variability of summer precipitation and precipitation extremes and associated large-scale mechanisms in Central Asia during 1979–2018. J. Hydrology X 8, 100061. doi:10.1016/J.HYDROA.2020.100061
Ma, Q., Zhang, J., Ma, Y., Game, A. T., Chen, Z., Chang, Y., et al. (2021). How do multiscale interactions affect extreme precipitation in eastern central Asia? J. Clim. 34, 7475–7491. doi:10.1175/JCLI-D-20-0763.1
Menne, M. J., Durre, I., Vose, R. S., Gleason, B. E., and Houston, T. G. (2012). An overview of the global historical Climatology network-daily database. J. Atmos. Ocean. Technol. 29, 897–910. doi:10.1175/JTECH-D-11-00103.1
Schär, C., Ban, N., Fischer, E. M., Rajczak, J., Schmidli, J., Frei, C., et al. (2016). Percentile indices for assessing changes in heavy precipitation events. Clim. Change 137, 201–216. doi:10.1007/s10584-016-1669-2
Schneider, U., Finger, P., Meyer-Christoffer, A., Rustemeier, E., Ziese, M., and Becker, A. (2017). Evaluating the hydrological cycle over land using the newly-corrected precipitation Climatology from the global precipitation Climatology Centre (GPCC). Atmos. (Basel). 8, 52. doi:10.3390/ATMOS8030052
Shan, Z., Wei-Li, D., Christidis, N., Jian-Li, D., Nover, D., Jilili, A., et al. (2021). An extreme rainfall event in summer 2018 of Hami city in eastern Xinjiang, China. Adv. Clim. Change Res. 12, 795–803. doi:10.1016/j.accre.2021.10.005
Solomon, S., Manning, M., Marquis, M., and Qin, D. (2007). “Climate change 2007-the physical science basis,” in Working group I contribution to the fourth assessment report of the IPCC (Cambridge, United Kingdom: Cambridge University Press).
Wang, J. S., Chen, F. H., Jin, L. Y., and Wei, F. (2008). The response to two global warming periods in the 20th century over the arid Central Asia. J. Glaciol. Geocryol. 30 (2), 224–233. [in Chinese].
Wang, Q., Zhai, P. M., and Qin, D. H. (2020a). New perspectives on ‘warming–wetting’ trend in Xinjiang, China. Adv. Clim. Change Res. 11, 252–260. doi:10.1016/j.accre.2020.09.004
Wang, Z., Wen, X., Lei, X., Tan, Q., Fang, G., and Zhang, X. (2020b). Effects of different statistical distribution and threshold criteria in extreme precipitation modelling over global land areas. Int. J. Climatol. 40, 1838–1850. doi:10.1002/joc.6305
Xiaokaiti, D., Zhang, F., Wei, R., Chen, C., and Jia, L. (2011). DB65/T3273-2011. Precipitation scales. Xinjiang: Xinjiang Uygur Autonomous Region Meteorological service.
Xu, P., Wang, L., and Ming, J. (2022). Central Asian precipitation extremes affected by an intraseasonal planetary wave pattern. J. Clim. 2022, 2603–2616. doi:10.1175/jcli-d-21-0657.1
Yan, X., Zhang, Q., Zhang, W., Ren, X., Wang, S., and Zhao, F. (2021). Analysis of climate characteristics in the Pan-Central-Asia arid region. Arid. Zone Res. 38, 1–11. doi:10.13866/j.azr.2021.01.01
Yang, J., Pei, Y., Zhang, Y., and Ge, Q. (2018). Risk assessment of precipitation extremes in northern Xinjiang, China. Theor. Appl. Climatol. 132, 823–834. doi:10.1007/s00704-017-2115-8
Yao, J., Chen, Y., Chen, J., Zhao, Y., Tuoliewubieke, D., Li, J., et al. (2020). Intensification of extreme precipitation in arid Central Asia. J. Hydrol. X. 598, 125760. doi:10.1016/j.jhydrol.2020.125760
Yao, J. Q., Chen, J., Zhang, T. W., Dilinuer, T., Mao, W. Y., Jun-Qiang, Y., et al. (2021). Stationarity in the variability of arid precipitation: A case study of arid central Asia. Adv. Clim. Change Res. 12, 172–186. doi:10.1016/j.accre.2021.03.013
Yatagai, A., Kamiguchi, K., Arakawa, O., Hamada, A., Yasutomi, N., and Kitoh, A. (2012). Aphrodite constructing a long-term daily gridded precipitation dataset for Asia based on a dense network of rain gauges. Bull. Am. Meteorol. Soc. 93, 1401–1415. doi:10.1175/BAMS-D-11-00122.1
Yu, Y., Schneider, U., Yang, S., Becker, A., and Ren, Z. (2020). Evaluating the GPCC full data daily analysis version 2018 through ETCCDI indices and comparison with station observations over mainland of China. Theor. Appl. Climatol. 142, 835–845. doi:10.1007/s00704-020-03352-8
Zhai, J., Mondal, S. K., Fischer, T., Wang, Y., Su, B., Huang, J., et al. (2020). Future drought characteristics through a multi-model ensemble from CMIP6 over South Asia. Atmos. Res. 246, 105111. doi:10.1016/j.atmosres.2020.105111
Zhai, P., Zhang, X., Wan, H., and Pan, X. (2005). Trends in total precipitation and frequency of daily precipitation extremes over China. J. Clim. 18, 1096–1108. doi:10.1175/JCLI-3318.1
Zhang, J., and Fan, W. (2022). Future changes in extreme precipitation in central Asia with 1 . 5 – 4 C global warming based on Coupled Model Intercomparison Project Phase 6 simulations. Int. J. Climatol. 42, 1–17. doi:10.1002/joc.7740
Zhang, M., Chen, Y., Shen, Y., and Li, B. (2019). Tracking climate change in Central Asia through temperature and precipitation extremes. J. Geogr. Sci. 29, 3–28. doi:10.1007/s11442-019-1581-6
Zhang, M., Chen, Y., Shen, Y., and Li, Y. (2017). Changes of precipitation extremes in arid Central Asia. Quat. Int. 436, 16–27. doi:10.1016/j.quaint.2016.12.024
Zhang, X., Alexander, L., Hegerl, G. C., Jones, P., Tank, A. K., Peterson, T. C., et al. (2011). Indices for monitoring changes in extremes based on daily temperature and precipitation data. WIREs Clim. Change 2, 851–870. doi:10.1002/wcc.147
Zhou, Q., Chen, D., Hu, Z., and Chen, X. (2021). Decompositions of Taylor diagram and DISO performance criteria. Int. J. Climatol. 41 (12), 5726–5732. doi:10.1002/joc.7149
Keywords: extreme precipitation threshold, Central Asia, parametric approach, nonparametric approach, APHRODITE dataset, GPCC dataset
Citation: Chen J, Yao J, Dilinuer T, Li J, Li S, Yang L and Mao W (2022) Central Asia daily extreme precipitation in observations and gridded datasets: A threshold criteria perspective. Front. Environ. Sci. 10:1007365. doi: 10.3389/fenvs.2022.1007365
Received: 30 July 2022; Accepted: 26 September 2022;
Published: 11 October 2022.
Edited by:
Zengyun Hu, Chinese Academy of Sciences (CAS), ChinaReviewed by:
Jianfeng Li, Hong Kong Baptist University, Hong Kong SAR, ChinaHaijun Deng, Fujian Normal University, China
Copyright © 2022 Chen, Yao, Dilinuer, Li, Li, Yang and Mao. This is an open-access article distributed under the terms of the Creative Commons Attribution License (CC BY). The use, distribution or reproduction in other forums is permitted, provided the original author(s) and the copyright owner(s) are credited and that the original publication in this journal is cited, in accordance with accepted academic practice. No use, distribution or reproduction is permitted which does not comply with these terms.
*Correspondence: Junqiang Yao, eWFvanExOTg3QDEyNi5jb20=
 Jing Chen
 Junqiang Yao
 Tuoliewubieke Dilinuer1,2,3
 Lianmei Yang