 Dragos Sebastian Cristea1
 Cristina Gabriela Zamfir1Ira Adeline Simionov2,3
 Costinela Fortea1Romeo Victor Ionescu4Monica Laura Zlati1
 Valentin Marian Antohi1,5Dan Munteanu6
 S. M. Petrea1,2*
- 1Department of Business Administration, Faculty of Economics and Business Administration, “Dunarea de Jos” University of Galati, Galati, Romania
- 2Department of Food Science, Food Engineering, Biotechnology and Aquaculture, Faculty of Food Science and Engineering, “Dunarea de Jos” University of Galati, Galati, Romania
- 3Department of Automatic Control and Electrical Engineering, Faculty of Automatic Control and System Engineering, “Dunarea de Jos” University of Galati, Galati, Romania
- 4Department of Administrative Sciences and Regional Studies, Faculty of Juridical, Social and Political Sciences, Dunarea de Jos University, Galati, Romania
- 5Department of Finance, Accounting and Economic Theory, Faculty of Economic Sciences and Business Administration, Transylvania University, Brasov, Romania
- 6Department of Computers and Information Technologies, Faculty of Automatic Control and System Engineering, “Dunărea de Jos” University of Galati, Galati, Romania
The present research uses machine learning, panel data and time series prediction and forecasting techniques to establish a framework between a series of renewable energy and environmental pollution parameters, considering data for BRICS, G7, and EU countries, which can serve as a tool for optimizing the policy strategy in the sustainable energy production sector. The results indicates that XGBoost model for predicting the renewable energy production capacity reveals the highest feature importance among independent variables is associated with the gas consumption parameter in the case of G7, oil consumption for EU block and GHG emissions for BRICS, respectively. Furthermore, the generalized additive model (GAM) predictions for the EU block reveal the scenario of relatively constant renewable energy capacity if gas consumption increases, while oil consumption increases determine an increase in renewable energy capacity until a kick point, followed by a decrease. The GAM models for G7 revealed the scenario of an upward trend of renewable energy production capacity, as gas consumption increases and renewable energy production capacity decreases while oil consumption increases. In the case of the BRICS geopolitical block, the prediction scenario reveals that, in time, an increase in gas consumption generates an increase in renewable energy production capacity. The PCA emphasizes that renewable energy production capacity and GHG, respectively CO2 emissions, are highly correlated and are integrated into the first component, which explains more than 60% of the variance. The resulting models represent a good prediction capacity and reveal specific peculiarities for each analyzed geopolitical block. The prediction models conclude that the EU economic growth scenario is based on fossil fuel energy sources during the first development stage, followed by a shift to renewable energy sources once it reaches a kick point, during the second development stage. The decrease in renewable energy production capacity when oil consumption increases indicates that fossil fuels are in trend within the G7 economy. In the case of BRICS, it is assumed that gas consumption appears because of increasing the industrial capacity, followed by the increase of economic sustainability, respectively. In addition, the generalized additive models emphasize evolution scenarios with different peculiarities, specific for each analyzed geopolitical block.
1 Introduction
Nowadays, considering the political challenges which create massive disruptions in the global energy system and increase energy prices, the renewable energy strategy must be powered in order to increase both energy safety and security.
Thus, European Commission (EC) had elaborated the REPower Plan among which, one of the main desiderata is to diversify energy sources and to replace gas, oil and coal with renewable electricity and fossil-free hydrogen, with action on the supply side, creating, therefore, a strong capacity and framework to roll out and produce renewable energy. Also, the EC Green Deal Plan encourages the long-term transition to a modern and competitive economy, characterized by resource use efficiency for assuring sustainable development.
Thriving economies rely on high energy usage which generates environmental degradation associated with health risks on human population (Khan et al., 2021a). Based on economic crisis, the destabilized production and distribution mechanisms have generated negative effects on resource consumption and citizen wellbeing. In order to mitigate these effects, the world states have taken several measures, including the activation of already existing specific interest groups (Ibrahim and Alola, 2020). Therefore, supranational organizations with global influence as the European Union (EU), the Organization for Economic Co-operation and Development (OECD) and the organization of countries with emerging economies BRICS (Brazil, Russia, India, China and South Africa) must take action on order to elaborate proper resilience policies based on frameworks which include environment, energy and economic growth nexus. The new geopolitical context highlights the fragility of alliances and nowadays new premises for BRICS extension arise in the context of the Russian-Ukrainian war.
The main objective of the research at hand is to offer a universally applicable tool for optimizing the policy strategies pertaining to the sustainable energy production sector-by considering a multi-dimensional predictors sheet, which merges economic, environmental, and renewable energy perspectives. This will offer responses to questions as follows: How different are the prediction models associated with renewable energy within the world’s main geopolitical blocks?; Are there any forecasting instruments, based on basic indicators, that can define an accurate impact of different multi-dimensional decisions, on the renewable energy sector?; Can renewable energy consumption be predicted by using a basic group of predictors representative of the tridimensional economic-environment-energy nexus? Are there any similarities, between EU, G7 and BRICS, related to the methodologies proposed for assisting the decision management surrounding the sustainable energy sector?
Therefore, the hypothesis development within the present study is focused on economic-environment-energy nexus and considers that main parameters including in energy dimension, as oil and gas consumption, environmental dimension, as CO2 and GHG emissions and economic dimension, as GDP and GDP from industry, respectively, can represent basic independent variables in predicting total renewable energy production.
The originality of this present study is revealed, firstly, by the synergic methodology which combines supervised learning tools as generalized additive models—XGboost and panel data analysis with unsupervised learning as partial component analysis. On the secondary, it can be considered the structure of predictors dataset, transposed on a comparative analysis between the main global geopolitical blocks. However, as the final original input, all gathered results of the current study represent a high-accuracy model-driven decision support tool which can be used by policy-makers in order to optimize their decision process, especially in complex political and economic global scenarious.
2 Literature review
A bibliometric analysis was undertaken (Figure 1A) by using the connected keywords “analysis of environment”, “energy” and “economic growth” considering only Web of Science (WOS) publications. The bibliometric analysis revealed that during the years 2012–2022, 185 published articles are identified as published, which are cited in 1,461 studies with an average of 18 citations per article and a H-index of 23. This reveals the actuality of the current tridimensional nexus and its multi-dimensional applicability in different research contexts. Furthermore, in their review study, Mahy et al. pointed out the increasing interest in issues related to climate change, carbon dioxide (CO2) emissions and sustainability by conducting a thorough bibliometric analysis of the scientific papers included in Web of Science database in the last 30 years (Mahi et al., 2021).
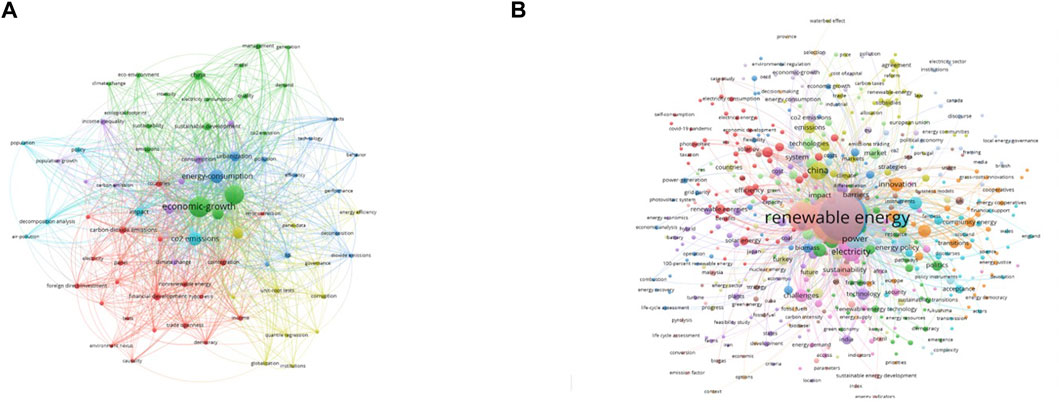
FIGURE 1. Bibliometric network correlation analysis for (A) environment—energy—economic growth nexus (B) renewable energy as search nucleum.
It is well known that these on-going environmental challenges have extended their effects on the economic environment also. However, long-term monitoring and correlation between economic and environmental indicators are needed. The fuel consumption in industrial activities has been attributable to the annual increase in CO2 emissions by up to 20 billion tons (Khan et al., 2022b). In their study, Dellink et al. developed a methodology for the projection of GDP trends based on the main indicators of economic growth (population, total factor productivity, physical capital, employment, human capital, and energy and fossil fuel resources) (Dellink et al., 2017). According to Topcu et al. energy consumption and GDP has a positive impact on the economic growth of high-income countries whereas the aforementioned indicators generate a negative impact in low-income countries (Topcu et al., 2020). Also, using renewable energy in sectors such as wastewater treatment can increase process efficiency and buffer the negative effects of economic growth on the environment (Khan et al., 2022a). In their study, Khan et al. used the econometric panel quintile regression (PQR) to describe the causal heterogeneous behaviour of treated wastewater based on the variables on environmental technology, the renewable energy consumption, GDP, trade and industrialization, in 16 OECD countries during the years 2000–2019 (Khan et al., 2022a).
Global warming is directly influenced and potentiated by energy consumption (Fu et al., 2021). Currently global warming and the energetic crisis represent the main challenges societies have to face; the need for sustainable economic development arises through limiting environmental pollution and adopting new solutions for the production of green energy. According to Sohag et al. green economic growth can be achieved by a society by using clean energy and implementing innovative technologies (Sohag et al., 2019). Khan et al. developed an equation by using the fully generalized least square (FGLS) technique and generalized method of moments (GMM) to describe the relationship between health expenditure, renewable energy consumption, economic growth, and environmental performance, in 10 Central European countries between 2005 and 2018. The variables included in the equation were: RENG (renewable energy), HLTE (number of deaths associated to water pollution and health expenditure), ECON (economic performance evaluated based on trade openness, foreign direct investments and GDP per capita) (Khan et al., 2021a). The authors highlighted the negative effect of non-renewable energy sources (fossil fuels) usage on environmental quality and human population health (Khan et al., 2021a). It has been pointed out that the use of green energy boosts economic performance and contributes to achieving environmental efficiency, by reducing the level of carbon emissions (Khan et al., 2021b; Umar et al., 2021).
Several studies (Leal et al., 2019; Akram et al., 2020b; 2020a, 2021) highlight the importance of energy efficiency for the promotion of economic growth at the level of BRICS countries. Akram et al. (2020b) conducted a study over a period of 25 years (between the years 1990–2014) in which they pointed out the positive influence of energetic efficiency on economic growth, especially the positive correlation between the consumption of green energy and the promotion of sustainable economic development (Akram et al., 2021). Another study conducted by Danish et al. focused on the BRICS countries and concluded that in these countries the development of new environmentally friendly technologies are positively correlated to green growth while the consumption of energy generated by non-renewable sources is deleterious (Danish and Ulucak, 2020).
Another study conducted in China (Ahmad and Zhao, 2018) investigating energy consumption and economic growth, highlighted that the impact of urbanization is significant and is generated by industry expansion. Moreover, the study pointed out the relationship between economic growth and the emissions of CO2 and the authors show that in the more developed regions of China, CO2 emissions decrease simultaneous with the economic growth, while in the less developed regions the effects are reversed (Ahmad and Zhao, 2018).
In India, economic growth is correlated to energy security and environmental sustainability (Zhang et al., 2020; Nepal et al., 2021). In the study of Nepal et al. the relationship between energy consumption, economic growth, CO2 emissions and foreign direct investments (FDI) was demonstrated. The authors concluded that an increase of 1% in FDI generates a decrease in energy consumption by 0.013% and thus reducing CO2 emissions in India (Nepal et al., 2021).
In the case of Asian countries, a study conducted by Mohsin et al. analysed the correlation between renewable energy, economic growth, and energy efficiency in 25 states by applying Hausman Taylor Regression and Random Effect. The authors concluded that increasing the usage of renewable energy by 1% decreases the CO2 emissions by 0.193% (Mohsin et al., 2021). A representative case study conducted in a socio-economic area where monetary trade surpluses meet energy trade deficits quantified the effects of structural changes, economic growth and energy efficiency measures (Moreau and Vuille, 2018). Another study conducted in the BRICS and OECD countries highlights the relationship between energy consumption, CO2 emissions and economic growth. During their monitoring conducted over a period of 35 years (1980–2016) the trilemma association of energy consumption, carbon emission and economic growth was estimated based on quantile regressions (Nawaz et al., 2021). The authors concluded that the use of non-renewable energy has effects on environmental health, whereas a positive correlation was observed between renewable energy and economic growth (Nawaz et al., 2021). Other studies show the impact of investment on economic growth and in correlation to optimization of green productivity in the primary, secondary and tertiary industrial sectors (Wang et al., 2020).
The bibliometric analysis related to renewable energy publications within the WOS database reveals a huge number of publications in the last 10 years, based on multiple approaches which involve environmental, economic, technological, modelling and AI aspects (Figure 2A).
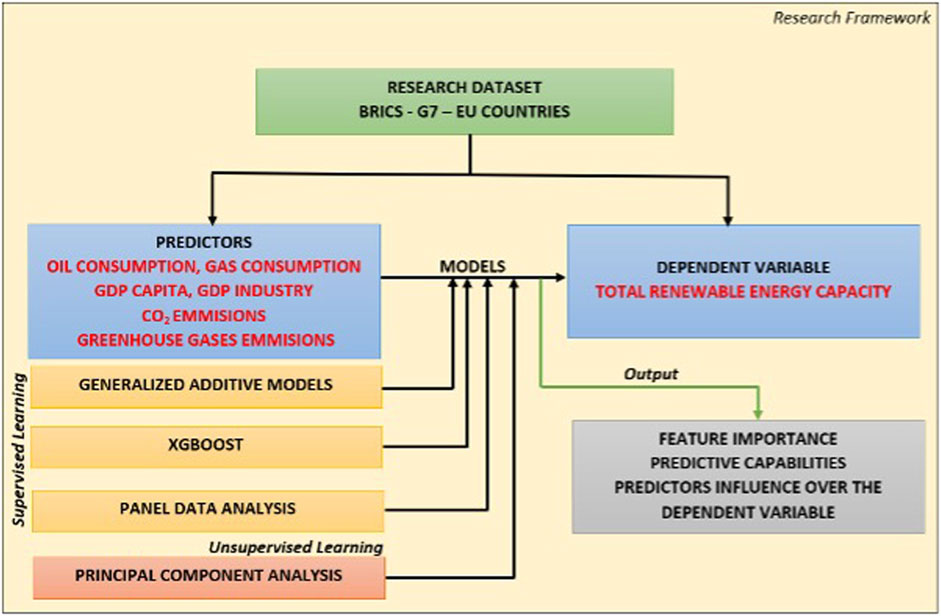
FIGURE 2. Research framework.
The study conducted by Nathaniel et al. provides a panel data analysis in which the impacts of nuclear and renewable energy use on CO2 emissions are evaluated in G7 countries. The authors stated that the consumption of renewable energy is not significant for the dynamics in the CO2 emission levels (Nathaniel et al., 2021). At the same time, they state that economic growth initially increases CO2 emission levels but mitigate it later. As a conclusion, the authors highlighted that nuclear energy significantly reduces CO2 emissions in all the countries, except in Canada and the United States (Nathaniel et al., 2021).
Carbon reduction requirements can also generate a fast expansion of renewable energy installations (Qiu et al., 2022a), a fact which indicates that possible emerging industries may rise as a consequence of adopting the new sustainable energy policies. The areas with great potential for renewable energy can contribute significantly to achieving carbon neutrality if proper infrastructures are dramatically strengthened through investments (Qiu et al., 2022a).
In the context of global carbon reduction, many countries have established carbon–neutral commitments (Qiu et al., 2022b). Some authors (Qiu et al., 2022b) that more than a quarter of the renewable energy centrally developable areas have energy synergies, indicating the applicability of renewable energy centralized co-development.
Renewable energy emerging technologies such as those based on energy piles have great potential to be adopted and increase attention due to the growing energy demand and corresponding carbon emissions (Fang et al., 2022).
The renewable energy analytical frameworks could also include in-depth environmental analysis as those performed by other authors (Tian et al., 2022) which proposed a Deep Belief - BP neural network haze prediction model based on the theory of deep learning, combining the Boltzmann machine and BP neural network, considering a wide range of air pollutants as PM2.5, PM10, O3, Co, NO2 and SO2. Also, the environmental dimension of renewable energy models can include spatial and temporal information related to pollution distribution (Liu et al., 2022), in order to identify critical hot points and analyze their impact on the regional energy and economic dimensions.
In the EU, some studies have evaluated the dependent relationship between economic growth and the consumption of renewable energy in 28 states based on panel data analysis (Soava et al., 2018). The main conclusion of the research was that there is a positive impact of renewable energy consumption on economic growth (Soava et al., 2018). As well, Magazzino et al. have conducted an investigation in 16 European countries over a period of 27 years (1990–2017) for the relationship between information and communication technology (ICT), electricity consumption, economic growth and environmental pollution through a multivariate framework (Magazzino et al., 2021). Their results point out the positive association between economic growth rate and per capita electricity consumption, which further on generates a rise in the levels of CO2 emissions and improved GDP (Magazzino et al., 2021).
The most recent findings in terms of model-driven decision support tools (MDST) which imply the renewable energy—economic—environmental nexus are summarized in Table 1.
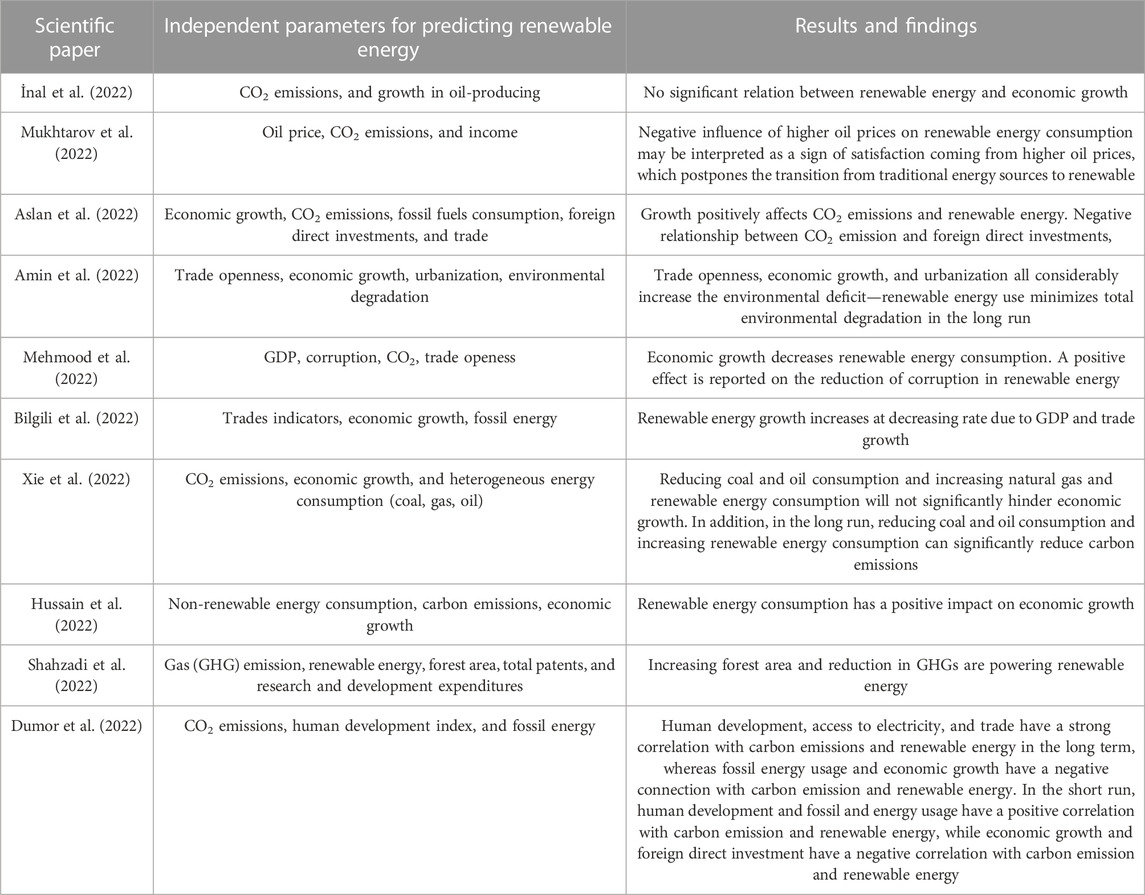
TABLE 1. The most recent studies from the year 2022 related to renewable energy MDST.
The analysis of the recent studies (Table 1) revealed various scenarios related to the influence of different economic and environmental dimensions parameters on renewable energy prediction. Thus, this confirms the knowledge gap related to renewable energy—economic growth—environmental sustainability nexus since the process is highly influenced by the area of study, time-series data that were considered for framework development and specific events that might have occurred during the analyzed period.
3 Materials and methods
3.1 Dataset description
The analytical framework elaborated in the present study is based on a series of seven economic indicators which are considered highly suggestive in order to reveal, in a simple and suggestive manner, the nexus between economic, environmental and energy production dimensions, as follows:
• Oil consumption - (oilcons) [mt] (source: https://www.bp.com): the oil consumption reported by each of the analyzed countries.
• Gas consumption—(gascons) [mtoe] (source: https://www.bp.com): the gas consumption reported by each of the analyzed countries.
• CO2 emissions—(co2) [mtCO2] (source: https://www.bp.com): the total quantity of CO2 emissions reported by each of the analyzed countries.
• Greenhouse gases emissions—(ghg_emissions) [mtCO2e] (source: https://www.bp.com): the total quantity of GHG emissions reported by each of the analyzed countries.
• Total renewable energy production—(REN_EN_TOTAL) [gwh] (source: https://www.irena.org): the total quantity of renewable energy produced by each of the analyzed countries.
• Gross domestic product per capita—(GDP_capita) [current US $] (source: https://www.oecd.org): the gross domestic product per capita reported by each of the analyzed countries.
• Gross domestic product from industry—(GDP_IN) [% of total GDP] (source: https://www.oecd.org): the share of gross domestic product provided by industry from total gross domestic product reported by each of the analyzed countries.
The selection of the variables for the current research targeted the development of a three-dimensional construct (economic—environmental—renewable energy) considered to be explanatory for getting new insights on the existing relation between the economic performance of the targeted countries and their advances towards renewable energy usage. Thus, the seven indicators considered highly suggestive for revealing the nexus between economic, environmental and energy production dimensions, were chosen based on significant studies as follows: oil consumption (Gallo et al., 2010; Mukhtarov et al., 2020; Guo et al., 2021), gas consumption (Dong et al., 2017, 2018; Ummalla and Samal, 2019; Çıtak et al., 2021), CO2 emissions (Dong et al., 2017, 2018; Ummalla and Samal, 2019; Çıtak et al., 2021), GHG (Dong et al., 2017, 2018; Ummalla and Samal, 2019; Çıtak et al., 2021), GDP per capita (Simionescu et al., 2019; Tudor and Sova, 2021) and GDP from industry (Simionescu et al., 2019; Tudor and Sova, 2021).
For the comparability and relevance of our main aim, the research must be performed on data series covering the same timeline, for each of the analyzed countries. Thus, the dataset is recorded during the years 2000–2019, the most recent period with a complete report that includes the targeted parameters for all the analyzed countries considered in this study. Therefore, the research period of the current study was imposed by several facts: 1) for the panel data analysis, the performed analysis needed a complete time series data for all countries, 2) the performed analysis needed as much data as possible. The data associated with each country from BRICS and G7 (except the United Kingdom for which a complete database that covers all the analyzed parameters during the targeted period was not available), as well as with the most important countries from EU in terms of energy production and consumption were considered.
Therefore, 30 countries were considered; these were: Brazil, Russia, India, China and South Africa for BRICS; Canada, France, Germany, Italy, Japan and the United States (US) for G7; Finland, Austria, Belgium, Czech Republic, Denmark, Estonia, France, Germany, Greece, Hungary, Ireland, Italy, Luxembourg, Netherlands, Poland, Portugal, Romania, Slovakia, Slovenia, Spain and Sweden for EU, respectively. The BRICS block dataset descriptive statistics are presented in Table 2, Section 1, EU block in Table 2, Section 2, G7 block in Table 2, Section 3 and the merged dataset (BRICS, G7 and EU) in Table 2, Section 4.
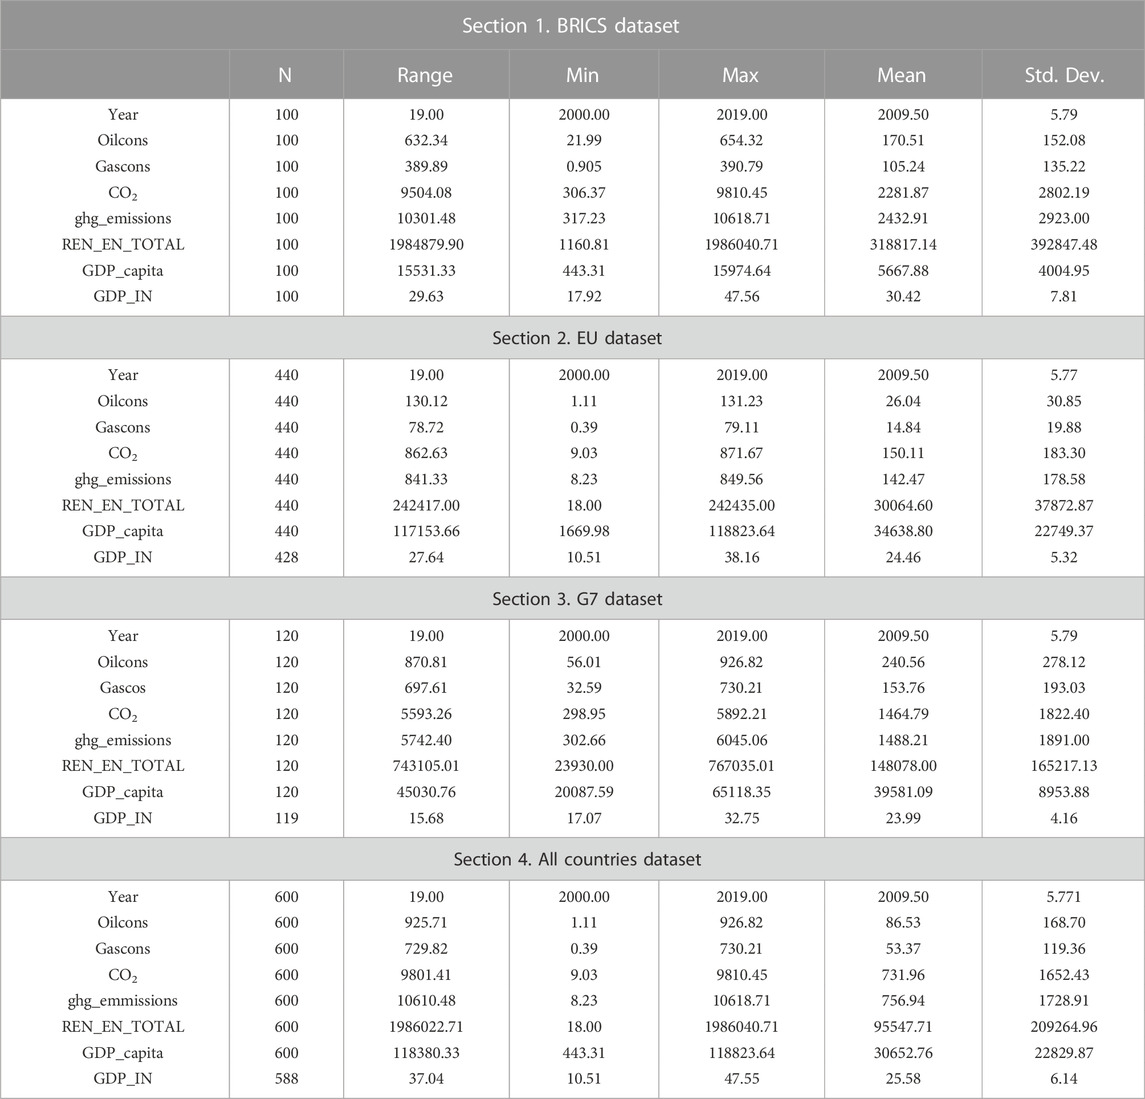
TABLE 2. Dataset descriptive statistics.
The structure of the dataset used in the present study is innovative since it covers major indicators, able to merge all three dimensions, economic—environmental—energy production, targeting to predict total renewable energy production for each of the main economic groups of interest (BRICS, G7, EU, respectively). Similar studies had regional importance, by covering a limited geographic area (eg., Pakistan, Latin-American Countries, Pearl River Delta, China) (Ur Rehman et al., 2019; Chai et al., 2020; Li et al., 2021; Razzaq et al., 2021; Dogan et al., 2022), or including complex structures of niche parameters (eg., energy use intensity related to foreign direct investments inflows, urbanization rate or international trade) (Kahia et al., 2019; Murshed et al., 2021), that make them difficult to be implemented as fast and easy to use instruments for policymakers, in a unifying policy model.
3.1.1 Development technologies
As presented in Figure 2, the methodological framework of this research used several statistical/machine learning/econometrics techniques for explaining the existing relation between renewable energy capacity and fossil energy consumption, greenhouse gases, CO2 emissions, GDP per capita, Industry GDP: The Generalized Additive Models, the XGBoost algorithm, Panel Data Analysis and Principal Component Analysis.
These methods were chosen to provide a multidimensional perspective over the renewable energy context existing in BRICS, G7 and EU countries. Thus, the generalized additive model is a powerful technique (Lin et al., 2022) as it easy to interpret and the flexible predictor functions (splines) can uncover hidden patterns in the data. The generalized additive model is flexible because the relationships between the predictors and the dependent variable are not assumed to be linear and the use of regularized, non-parametric functions avoids the higher order polynomial terms (Khamma et al., 2020).
Secondly, the XGBoost algorithm was used as a requirement to assess the feature importance when predicting the renewable energy capacity. By identifying the most influential predictors for the renewable capacity prediction, new data patterns/insights could be inferred. There are several machine learning algorithms that could be used to obtain the feature importance, like Random Forest, but as presented in (Zhang et al., 2017) from the 11 algorithms studied, that included Extreme Learning Machine (ELM), Sparse Representation based Classification (SRC), and Deep Learning (DL), it was found that Gradient Boosting Trees exceeded the prediction performance of Support Vector Machines (SVM) and Random Forests (RF), while being the fastest algorithm in terms of prediction efficiency. By using the panel data analysis, this research used the data also as time series, starting from the idea that panel data can provide more accurate inferences of model parameters, greater capacity to capture the complexity of a domain, respectively more simplified computation and statistical inference (Le and Park, 2021). The principal component analysis technique provides another facet of the renewable energy capacity context among the three geo-politically constructs as it is a unsupervised machine learning technique that, besides features reduction, can also provide a perspective on how different countries relates to different parameters, as the PCA is also useful in visualizing possible clusters and their associated data (Androniceanu et al., 2020).
The modelling output refers to three distinct aspects, among which the first implies the determination of the predictors’ feature importance during the prediction of total renewable energy production capacity. Thus, this assures the identification of the predictors that are most important in obtaining efficient/reliable predictive models. The second aspect implies the determination of efficient predictive models that could be used to assess the total renewable capacity of a region/country, based on several relevant parameters, whereas the third aspect formally quantified predictors influence over the total renewable energy production capacity for each analyzed group.
For obtaining the above-mentioned output, the current research uses four modelling techniques: two are considered supervised machine learning methods (generalized additive models—GAM, XGBoost), while the other two are statistical/econometric techniques (Panel Data Analysis, Principal Component Analysis).
3.1.2 Metrics for model validation
The current research used two different metrics for model evaluation/validation. The first validation metric is R2, a statistical measure representing how close the data can be to the fitted values, having values between 0 and 1, the closer to 1, the higher the explanatory power (Eq. 1)
The second metric, Root Mean Square Error (RMSE) measures the size of the error, giving more weight to large errors and are defined in Eq. 2.
3.1.3 Generalized additive models (GAM)
According to the GLM (general linear models) theory, an increasing number of predictors represents a key issue for various modelling scenarios as the variance also increases. A high variance will make it harder for a prediction algorithm to perform well on new data (curse of dimensionality). Stone (Stone, 1986) modified the GLM algorithm by replacing each predictor with an additive approximation term, avoiding this way the curse of dimensionality by fitting each predictor variable to the dependent variable. This way it was possible to interpret how each predictor affected the dependent variable.
In the MLR (multiple linear regression) equations, the estimated coefficients make it possible to understand the effects of differing scale/relationships to the dependent variable. Hastie and Tibshirani (An Introduction to Statistical Learning) (1990) incorporated Stone’s idea into a formal definition of GAM. Therefore, a GAM uses a non-linear link function to map input data into a solution space, similar to GLM, and represents a GLM where the linear predictor depends linearly on smooth functions of some predictor variables.
The functions fi could have a specified parametric form like a polynomial or a regression spline or may be specified non-parametrically/semi-parametrically as ‘smooth functions’ estimated through non-parametric means like kernel regression or MARS (Multivariate Adaptive Regression Splines). A GAM model could use a scatterplot smoothing function like a locally weighted mean, for f1(x1), and a factor model for f2(x2). This flexibility allows obtaining better fits to data, but with some loss of interpretability.
In this research he generalized additive model approach for obtaining a clear overview of how the aforementioned predictors (Figure 2) are influencing the total renewable capacity in BRICS, G7 and EU countries, is used. However, the GAM approach was employed in many energy-related studies. For example, in (Khamma et al., 2020), the authors used several data-driven statistical and machine learning models, including GAM, to assess the energy performance of office buildings based on historical data, as in 2018, the commercial building accounted for nearly 18.2% of the total energy consumption in the US, making it a significant contributor to the GHG emissions. According to the authors, model interpretability is essential to understand, control and manage and for this reason, they used GAM as a flexible, efficient, and interpretable alternative to existing approaches in modeling and predicting the energy consumption in office buildings. Another example can be found in (Lin et al., 2022), where the authors proposed an innovative approach to predicting optimal revenues of an integrated energy generation and storage system by examining the performance of two prediction techniques: Generalized Additive Models (GAMs) and machine learning (ML) models developed based on artificial neural networks (ANN). As presented in their paper, the revenue estimation for integrated renewable energy and energy storage systems is important for decisions related to battery sizing selection, in order to maximize the financial performance. According to the authors, the two models were able to reduce the computational time to evaluate annual revenue for one set of battery configurations from 3 h to 1–4 min per run.
In (Shirizadeh and Quirion, 2022), the research addresses the cost-effective role of the different energy sources and carriers, emphasizing that energy optimization models should consider the key energy supply, carrier, conversion, and storage options in an endogenous way. The authors developed a GAM based model, optimizing dispatch and investment, applying it to the French energy system for 2050, for a wide range of social cost of carbon (SCC) values.
3.2 XG-Boost prediction algorithm and feature importance
XGBoost represents an optimized implementation of Gradient Boosting Decision Trees (GBDT) (Chen et al., 2019), a machine learning algorithm that sequentially produces and updates base classifiers (weak learners) to build ensemble classifiers (strong learners). If the weak learner for each step is based on the gradient direction of the loss function, it can be called Gradient Boosting Machines (GBM) (Jordan, 1874). XGBoost algorithm is an ensemble learning algorithm, like Random Forest method—another popular machine learning technique. The main difference between Random Forest (RF) and Gradient Boosted Machines is that while in RF trees are built independent of each other, XGBoost adds a new tree to complement already built ones (Stewart, 1993). The XGBoost is a gradient boosting algorithm-it uses a gradient descent algorithm to minimize the loss when adding new models. Due to its high accuracy of prediction, low requirement of features and fast running speed, XGBoost is widely used for classification and regression problems in various engineering, medical or economics fields (prediction of safety assessments, power system, water absorption in different sublayers, anomalies with gene selection or behavior models for residential buildings, respectively) (Chen et al., 2019; Mo et al., 2019; Zhang et al., 2019; Gertz et al., 2020; Liu et al., 2020).
XGBoost has several important characteristics that make it one of the most efficient machine-learning predictive algorithms; specifically: handling of the sparse data—it incorporates a sparsity finding algorithm for handling different sparsity patterns; cache awareness—the algorithm was designed to make optimal use of the hardware by allocating internal buffers for each thread; parallel computing—it can make use of multiple cores on the CPU; regularization—it penalizes complex models through L1 and L2 regularization, preventing the overfitting; out-of-core computing—it optimizes the handling of huge datasets; weighted quantile sketch—it can handle weighted data.
The algorithm performs well in various cases by using the following approach: let bk(x) be a function, which is often addressed as a base learner - the additive model is, thus, the sum of base learners, as described in Eq. 4, for k = 1, 2, … M, where M is the number of base learners.
The minimization of the risk L=[f(x,y)] for base learners bk(x) of Eq. 4 can be written as Eq. 7, where D = [(x,y)] is a dataset and g(x,y), h(x, y), respectively, are presented in Eqs 5, 6, respectively.
The additive model of Eq. 7 is thus updated iteratively with the boosting as described in Eq. 8.
Here, we use XG-Boost machine learning algorithm for its prediction capabilities - testing the hypothesis that it is possible to build reliable predictive models that would help in assessing the total renewable energy capacity based on oil and gas consumption, emissions, industry GDP and GDP per capita, as well as for assessing the feature importance when predicting the total renewable energy capacity for the different geopolitical blocks in order to identify which one influences the prediction most. XG-Boost is a widely used algorithm due to its predictive power, this includes within the renewable energy sector. Considering a context where electricity is in high demand in many sectors such as transportation, households, industry, hospitals and communication, and that renewable energy is an intermediate and unpredictable natural resource, some authors (Abd El-Aziz, 2022) use a hybrid machine learning technique based on multilayer perceptron (MLP), Support Vector Regression (SVR) and Boosting algorithms to precisely predict the energy level of natural resources. As climate and weather conditions influence energy demand, in (Simoes et al., 2021) the study presents the results on how considering current and future climate variability affects the results of an energy system model for the whole European power sector, up to 2050. For each member-state, the authors considered six climate projections to generate future capacity factors for wind, solar and hydropower generation, respectively the temperature impact on electricity demand for heating and cooling. Through their model, the authors assessed how climate impacts the optimal operation of the power system and if the current EU emissions target deployment may be affected. In (Zheng et al., 2020), the authors state that predicting corporate environmental performance can help plan for environmental impact mitigation by adjusting organizational practices, but the lack of environment-related information renders it difficult to make such predictions. Hence, they developed a five-dimensional (institutional context, governance capability, information management capability, system capability, and technology-related capability) theoretical framework, populated with 14 variables and 1,100 entries to investigate the corporate environmental performance. The results demonstrate that the XGBoost model can be effective for ESCO (energy service companies) environmental performance prediction, with satisfactory prediction accuracy. Their study adopted the SHAP (SHapley Additive exPlanations) values for model interpretation, indicating that the proportion of technicians, amount of proactive environmental costs, total assets and number of patents contribute most to corporate environmental performance. Another example can be found in (Zaidan et al., 2022), a study that focuses on the patterns of energy behaviors and human-building interactions among the residents of Qatar by collecting empirical evidence and conducting a subsequent survey analysis. The XGBoost method was used to conduct a feature importance analysis to determine factors contributing to residential energy consumption. The results revealed the primary behavioral and socio-economic factors that affect residential energy consumption and confirmed the influence of human factors in Qatar while considering its diverse population. Moreover, in (Lu et al., 2021), the authors target the accurate prediction of energy price, this being useful as a reference for policymakers and market participants. They provide a review of data-driven models (including XGBoost) for energy price prediction for natural gas, crude oil, electricity, and carbon.
3.2.1 Principal component analysis (PCA)
The principal component analysis (PCA), an unsupervised multivariate statistical technique, is used to analyze a specific number of observations described by several variables, which could be inter-correlated. Important information is extracted from the data table and expressed as a set of new orthogonal variables called principal components. It is a flexible tool allowing the analysis of datasets containing missing values, imprecise measurements, multicollinearity, and categorical data. The main goals of PCA can be summarized as to: simplify the description of the data set; extract the most important information from the data table; reduce the size of the data set by keeping only this important information; analyze the structure of the observations and the variables. To materialize these goals, PCA computes principal components, new variables obtained as linear combinations of the original variables.
The first principal component has the largest possible variance; therefore, this component will ‘explain’ or ‘extract’ the largest part of the inertia of the data set. The second component is computed under the constraint of being orthogonal to the first component and having the largest possible inertia. The values of these new variables pertaining to the observations are called factor scores, and these factor scores can be interpreted geometrically as the projections of the observations onto the principal components. The current research uses the principal component analysis to analyze the structure of the observations to evaluate how the observations are intercorrelated, respectively about main component loadings. Thus, it is possible to assess the characteristics of countries according to the available parameters. PCA is widely used as a research method in energy-related sectors. For example, in (Ni et al., 2022), the authors use PCA for exploring the impact of natural resources volatility, fiscal decentralization, renewable energy (RE) R&D and institutional quality in affecting CO2 emissions for seven selected developed countries. According to their findings, there is a positive impact on income (GDP), total natural resources rent and a negative impact of fiscal decentralization, institutional quality and renewable energy R&D on CO2 emissions. In (Yasmeen et al., 2022), the authors examine, by using also PCA, the impact of business cycles (recessions and booms) on renewable and non-renewable energy consumption in the OECD states from 1996 to 2015. The study shows that institutional quality is found to support increasing renewable energy consumption even in recessions. Foreign direct investment increases renewable energy consumption with different effects during the recession and boom periods.
It follows that to develop green technologies, foreign investment in research and development is required. Another study (Assi et al., 2021) examines the influence of five major factors (environmental pollution, financial development, innovation, GDP per capita, and economic freedom) affecting renewable energy consumption for maintaining economic and environmental sustainability in the ASEAN +3 economies during 1998–2018. By using a PCA approach, the authors confirmed that environmental pollution and economic freedom have a negative correlation with renewable energy consumption. Also, the existing relationship between innovation and real GDP with renewable energy is positive.
In a context where economies must follow decarbonization policies to meet climate-policy objectives, in (Zhang et al., 2022) the authors estimated the impact of green finance and digital finance on environmental protection for G20 economies. The results provided also through a PCA analysis show that CO2 emissions in the environment are reduced by green finance, renewable energy investment, and technological innovation (negatively correlated), whereas CO2 emissions are increased by factors such as economic growth, energy consumption, trade, and foreign direct investment (positive correlations). In (Tutak and Brodny, 2022) the authors demonstrate the impact of the use of renewable energy sources-based energy on economic indicators and on the consumption of energy from conventional sources. By using Kohonen artificial neural networks and PCA analysis, this study analyzed some existing similarities between the European Union countries in terms of the use of energy from renewable energy sources in different sectors and the existing correlations between economic and environmental parameters and the consumption of energy from renewable energy sources, as well as the impact of this energy consumption on the consumption of conventional energy. As result, significant differences were identified in the use of renewable energy among the studied countries, their groups and sectors and that renewable energy consumption have a positive impact on economic growth.
3.2.2 Panel data analysis
Panel (data) analysis represents a statistical method used for analyzing two-dimensional cross-sectional and longitudinal data, data collected over time for the same individuals. Thus, a regression is performed over these two dimensions according to Eq. 9, where y is the dependent variable, x is the independent variable, a is the intercept, b represents the coefficient and εit the error term.
In panel data analysis, the error is of importance as assumptions about the error term involve using a fixed or random effects approach. In a fixed effects model, ε is assumed to vary non-stochastically over i or t, while in a random effects model,
The panel regression models are developed using the updated data of 116 countries, having economic structure, social structure, trade structure and demographic structure as both explanatory variables and threshold variables, whereas per capita renewable energy consumption is the explained variable. Through the panel data analysis, the authors verify the existence of a non-linear relationship between social-economic-demographic-trade-structure changes and renewable energy consumption.
The relationship between economic growth, CO2 emissions, fossil fuel consumption, renewable energy consumption, foreign direct investments, and trade by taking into account countries with oil reserves and countries without oil reserves is analyzed in (Aslan et al., 2022). By using panel data analysis, the study analyzes the factors impacting upon CO2 emissions in countries with and without oil production between 1990–2015. In both country groups, growth positively affects CO2 emissions, with a negative relationship between CO2 emission and foreign direct investments in the oil importing group, and a positive relationship between CO2 and trade in the oil-exporting group. In (Sikder et al., 2022), the authors use panel data analysis to analyze the combined effects of gross domestic product (GDP) growth, energy usage, industrialization and urbanization on CO2 emissions for 23 developing countries across the 1995 to 2018 period. According to their analysis, a 1% increase in energy use, economic growth, industrialization, and urbanization increases CO2 emissions by 0.23%, 0.17%, 0.54%, and 2.32%, respectively. Furthermore, the panel causality analysis identified a bidirectional causal relationship between energy use, GDP growth, urbanization, industrialization, and CO2 emissions. Another study (Oluoch et al., 2021) based on panel data analysis and centered on the renewable energy sector presents an empirical model outlining the factors able to promote renewable energy consumption in SSA (Sub-Saharan Africa’s). The authors considered the panel data analysis with data describing 23 SSA countries with annual data from 1998 to 2014. According to their analysis, the dependent variable renewable energy consumption was significantly and positively correlated with the independent variables gross domestic product (GDP) per capita and education index and negatively correlated with the CO2 emissions per capita, and life expectancy index.
3.2.3 Limitations of your methodological approach
3.2.3.1 Problems of data definition and collection
Considering that the data are cross-sectional, more time is needed to collect them. In addition, problems can also arise in that data cannot be found either for a period or for a specific section (data series).
3.2.3.2 The presence of measurement errors
Measurement errors can occur due to unclearly formulated questions, distortion of answers, inadequate sources from which statistical data are taken, wrong recording of answers.
3.2.3.3 The size of the data series is short
The data used for the temporal section of the panel data are annual data and cover a medium size period. An increase in the time interval would bring better accuracies, but for the current scenario is impossible to implement as no data is available at this granularity.
3.2.3.4 Cross-section dependence
In the case of panels on countries or regions that use large time series if the dependence between them will be considered, it will be possible to draw the most correct conclusions. Also, the panel data analysis cannot solve all cross-section or time series problems. Due to the relative low volume of data, the machine learning algorithms were tested/validated on a medium size dataset. However, this issue was mitigated by the fact that the selected algorithm’s capability was proven to provide reliable results on small datasets.
4 Results and discussions
4.1 Main parameters’ distribution within the analysed period
According to recent studies (Hasan and Raza, 2022) gas consumption plays a major role in linking fossil to renewable fuels. Some authors (Fadiran et al., 2019) pointed out that the association of gas consumption with coal and oil consumption can limit, considerably, environmental pollution. The gas consumption box-plot analysis of countries, part of the three geopolitical blocks, reveals high variation during the analyzed period, for China and US (Figure 3A). Russia records low variations in gas consumption during the targeted period. However, considering the value of this indicator, Russia is placed in second place among the analyzed countries, behind the US, which leads in terms of gas consumption and over China, Canada, Germany and Japan, which share almost the same level of consumption (Figure 3A). High variations in gas consumption are directly related to economic stability since, as emphasized by other authors (Chrulski and Łaciak, 2021), it is related to the production of chemistry, the chemical industry, and the power industry. By analyzing the countries by their geopolitical block membership, the US registers the highest gas consumption from G7, followed by Canada, Germany, and Japan, while Russia and China lead the BRICS group (Figure 3A). In the EU this is Germany, Italy, France, followed by the Kingdom of the Netherlands and Spain (Figure 3A). However, the G7 has the most homogenous distribution among the countries, except US. Oil consumption is considered an important indicator of energy-growth nexus since, as demonstrated by previous authors (Saboori et al., 2017; Adekoya, 2021), economic growth and income levels are positively driven by oil abundance and negatively affect the environmental dimension (Saboori et al., 2017). In terms of oil consumption, China presents the highest variation during the analyzed period, although the highest oil consumption is attributed to the US (Figure 3B). In the G7, US lead in terms of oil consumption, followed by Japan and Germany, while in BRICS, China is in the first place, followed by India, Russia and Brazil, which share almost the same level of consumption (Figure 3B). Among EU countries, Germany leads in terms of oil consumption followed by France, Italy and Spain (Figure 3B). However, countries such as Canada, Germany, France, Brazil and Russia that report high oil consumption, managed to maintain stable values of this parameter, during the analyzed period (Figure 3B), a fact which can reveal their economic stability.
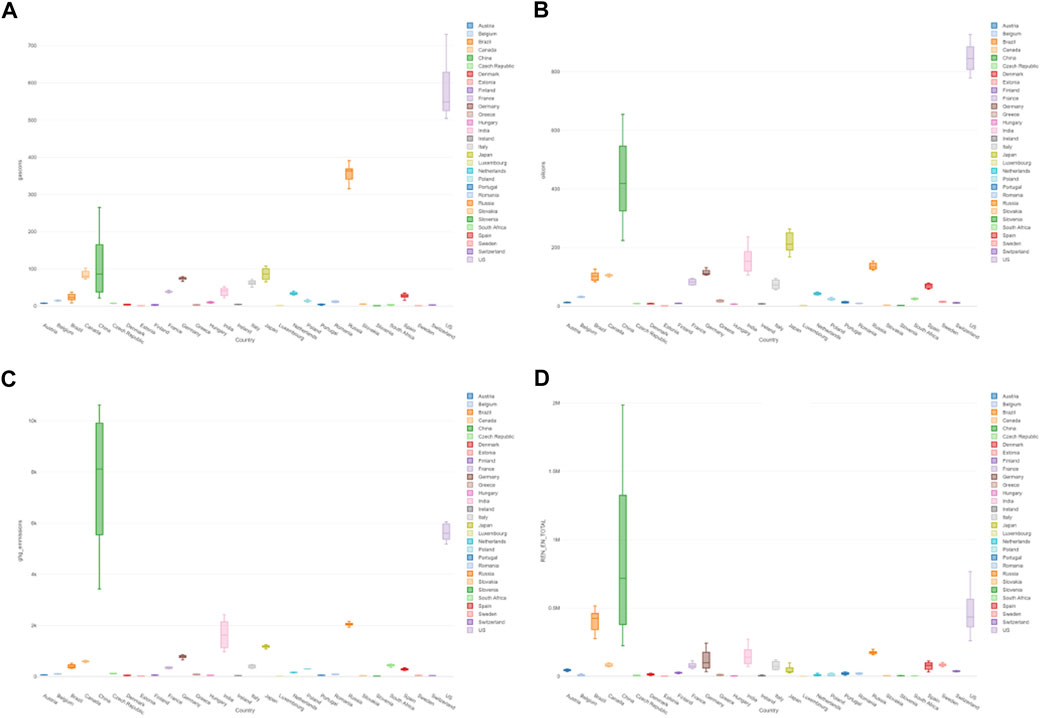
FIGURE 3. The gas consumption (A), oil consumption (B), GHG emissions (C) and renewable energy production (D) box-plots for G7, BRICS and EU countries.
The GHG emissions place China in the first place, followed by US, Russia and India (Figure 3C). However, China registers a huge variation of GHG in the analyzed period, followed by India, most probably due to the accelerated increase of industrialization, although a recent study (Welegedara et al., 2021) associates this situation with variations in primary energy source, climate, and population densities. However, BRICS cumulates higher GHG emissions compared to G7 since 3 countries from this geopolitical block are in the first 4 (Figure 3C), considering the analyzed dataset. China records also both the highest value and variation interval for renewable energy production, followed by US and Brazil (Figure 3D). A recent study (Balsalobre-Lorente et al., 2018) emphasized that if the economy starts its increasing trend, an increase in its energy requirements, a decrease in the share of renewable sources, and an increase in environmental pollution from fossil sources will be registered. Among EU geopolitical blocks, Germany, Italy, France, Spain and Sweden had reported significant renewable energy production (Figure 3D). However, Japan recorded a low level of renewable energy production, considering its high level of gas and oil consumption and GHG emission.
4.1.1 The XGBoost predictive models and feature importance
The XGBoost modeling technique was found to be suitable to be applied to the analyzed dataset since the present study targets to explain the variation of renewable energy production capacity, as the dependent variable, considering a series of independent variables related to economic and environmental dimensions. Therefore, the prediction models were applied for all 3 analyzed geopolitical blocks (G7, BRICS and EU) (Figure 4) and model accuracy and overfitting degree were evaluated for each model. The results indicate that, in the case of BRICS block, the GHG emissions record the highest feature importance value, followed by gas consumption and GDP from industry-associated activities, while oil consumption has a low to no importance in predicting renewable energy production capacity (Figure 4A). The GDP per capita and oil consumption have low importance in predicting the renewable energy production capacity (Figure 4A). The model has a good accuracy revealed by the metrics (a value of 51447.95 corresponding to RMSE within the training stage and 108544.37 for the testing stage). Considering the data presented in Table 1, it can be concluded that the training RMSE represents a percentage of 16.13% and the testing RMSE a percentage of 34.05%, respectively, in relation to the mean renewable energy production capacity, a situation which indicates the high predictive performance of the model. Also, the testing stage Rsq value (0.95) is closed to the training stage Rsq (0.97), emphasizing the low overfitting degree of the model, as it is observed also in Figure 4B.
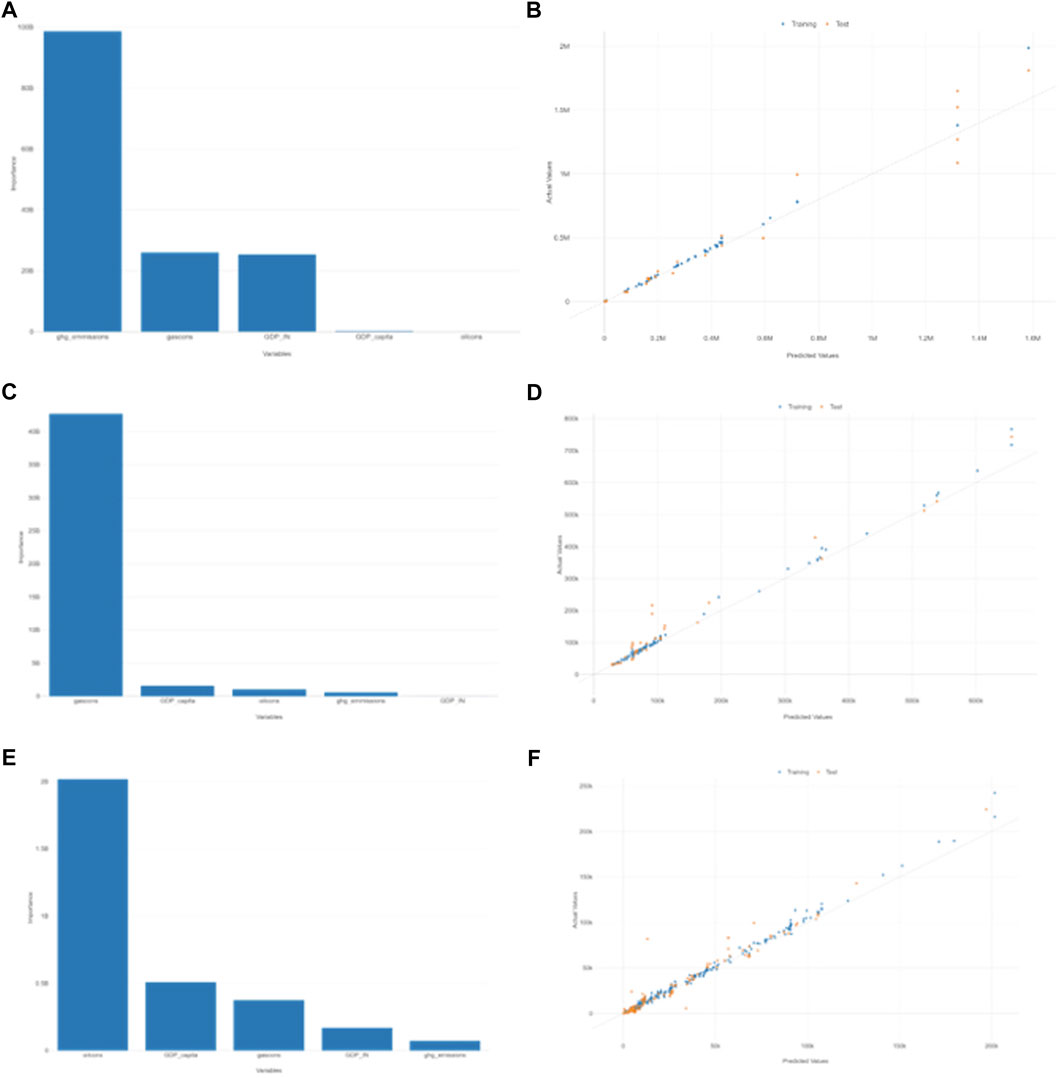
FIGURE 4. The feature importance of independent parameters in predicting renewable energy production capacity [for (A). BRICS; (C). G7; (E). EU] and the actual vs. predictive values of renewable energy production capacity XGBoost predictive model in (B). BRICS; (D). G7; (F). EU].
The XGBoost model for predicting the renewable energy production capacity of G7 emphasizes that the highest feature importance among independent variables is associated with the gas consumption parameter (Figure 4C). However, compared to the predictive model presented in Figure 4A, for BRICS geopolitical block, which emphasized the relatively significant importance of secondary variables (oil consumption and GDP industry), among the primary variable (GHG emissions), the G7 model (Figure 4B) reveals low feature importance for all secondary variables. Therefore, GDP per capita, oil consumption and GHG emissions have a low influence in predicting renewable energy production capacity, while GDP from industry has a very low to no impact (Figure 4C).
The model has a good accuracy revealed by the metrics (a value of 17758.46 corresponding to RMSE within the training stage and 37402.07 for the testing stage). Considering the data presented in Table 1, it can be concluded that the training RMSE represents a percentage of 11.99% and the testing RMSE a percentage of 25.26%, respectively, in relation to the mean renewable energy production capacity, a situation which indicates the high predictive performance of the model. Also, the testing stage Rsq value (0.94) is closed to the training stage Rsq (0.98) confirming the low overfitting degree of the model, as it is observed also in Figure 4D.
The prediction model for renewable energy production capacity based on the EU geopolitical block dataset reveals that oil consumption has the highest feature importance, followed by GDP per capita and gas consumption (Figure 4E). Compared with BRICS and G7 determined XGBoost prediction models, the EU model emphasizes higher future importance among secondary independent variables, revealing that, in the EU, an accrued prediction of renewable energy production capacity must take into consideration a wider set of parameters included in economical—environmental nexus. The model has a good accuracy revealed by the metrics (a value of 4,188.07 corresponding to RMSE within the training stage and 9,115.37 for the testing stage). Considering the data presented in Table 1, it can be concluded that the training RMSE represents a percentage of 13.93% and the testing RMSE a percentage of 30.32%, respectively, in relation to the mean renewable energy production capacity, indicating the high predictive performance of the model. Also, the testing stage Rsq value (0.93) is closed to the training stage Rsq (0.98) confirming the low overfitting degree of the model, as it is observed also in Figure 4F.
4.1.2 Generalized additive models feature influence (GAM)
The GAM models explain the dynamic variation of renewable energy production capacity, considering a series of independent parameters which characterize the environmental–economics nexus. Therefore, in the case of the BRICS geopolitical block (RMSE: 28886.49), it can be observed that an increase in gas consumption generates an increase in renewable energy production capacity (Figure 5A). However, this is valid within certain limits since the impact of renewable energy production capacity’s upward trend is not immediately emphasized as the gas consumption begins to rise. Thus, it is assumed that gas consumption appears as a consequence of increasing the industrial capacity and economic sustainability, respectively, of a certain region. However, since economic development remains a major objective for all world economies, many economies are first targeting to obtain economic growth and, after achieving a level of comfort, an increase in investments in green technologies is considered (Nuţă et al., 2021), a hypothesis which can confirm our findings. Compared with gas consumption, oil consumption within BRICS has an immediate impact on renewable energy production capacity (Figure 5B). Thus, an increase in oil consumption generates, almost simultaneously, a similar increase in the renewable energy production capacity (Figure 5B). The GDP per capita confirms the previously mentioned hypothesis and, thus, reveals that economic growth implies, at a certain maturity level, an increase in investments for maximizing the capacity of sustainable energy production (Figure 5C). Therefore, as GDP per capita increases, renewable energy capacity will increase until achieving a maximum predicted point, followed by a constant evolution (Figure 5C). The GDP from the industry indicates that investments in sustainable energy sources decrease in the first stage of economic growth (Figure 5D) since this process is characterized by high energy consumption (Nuţă et al., 2021). However, after achieving an optimum level of economic growth, a positive correlation between economic growth and energy consumption from renewable sources is observed, a situation confirmed also in other studies (Eggoh et al., 2011; Zhixin and Xin, 2011; Tang et al., 2016; Gozgor et al., 2018; Shahbaz et al., 2018; Rahman and Velayutham, 2020). Other studies suggested that renewable energy consumption has a more effective impact on economic growth (Doğan et al., 2020; Shahbaz et al., 2020). However, the environmental dimension’s influence on renewable energy production capacity reveals that the increase in GHG generates an increase in renewable energy production capacity as a measure of balancing the environmental impact (Figure 5F). However, the situation is the opposite in the case of CO2 emissions, which revealed an indirect relation in relation to renewable energy production capacity (Figure 5E). This can be explained by the excessive use of fossil fuels to assuring economic growth. However, there are studies which emphasize that CO2 emissions must be classified as a temporary indicator in the evaluation of the sustainable development degree of an economy (Bekun et al., 2019; Maneejuk et al., 2020) and recommend long period CO2 historical data for achieving high accuracy models.
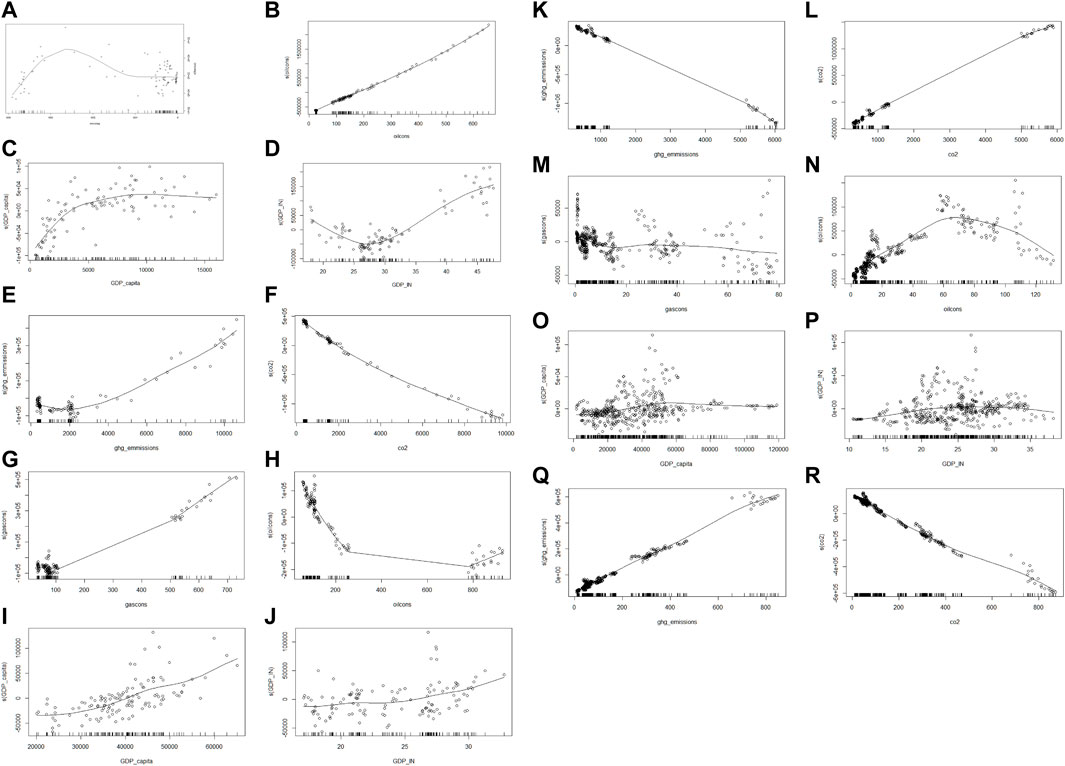
FIGURE 5. The influence of several predictors over the renewable energy production capacity within the analysed geopolitical locks (A) gas consumption predictor—BRICD; (B) oil consumption predictor—BRICS; (C) GDP per capita predictor—BRICS; (D) GDP from industry predictor—BRICS; (E) GHG emissions predictor—BRICS; (F) CO2 emissions predictor–BRICS; (G) gas consumption predictor—G7; (H) oil consumption predictor—G7; (I) GDP per capita predictor—G7; (J) GDP from industry predictor—G7; (K) GHG emissions predictor—G7; (L) CO2 emissions predictor–G7; (M) gas consumption predictor—EU; (N) oil consumption predictor—EU; (O) GDP per capita predictor—EU; (P) GDP from industry predictor—EU; (Q) GHG emissions predictor—EU; (R) CO2 emissions predictor–EU.
The GAM models for G7 (RMSE: 26135.50) revealed an upward trend of renewable energy production capacity, as gas consumption increase (Figure 5G). Also, the renewable energy production capacity decrease when oil consumption increase, fact which reveals the trend orientated to fossil fuels (Figure 5H). However, when oil consumption reaches a higher level, most probably associated to maximum economic development point, the renewable energy capacity starts to increase, as the economy is mature enough and stable, to sustain future sustainable development. However, it can be observed that the G7 economic growth policy is different when compared to BRICS, which targets economic growth by concomitant using of fossil based and renewable energy sources, as presented in Figures 5A, B. The GAM models based on GDP per capita and GDP from industry predictors (Figures 5I, J), resulting from the use of the G7 dataset, reveal almost similar observations as those obtained from BRICS geopolitical block.
Therefore, the increase of GDP per capita will determine an increase of renewable energy capacity (Figure 5I). Also, this situation is encountered in the case of GDP from industry (Figure 5J). However, compared to BRICS where the economic growth starts based on fossil energy sources, in G7 the duet economic growth—sustainable growth starts from the beginning and records a less strong dependency. Those different perspectives between BRICS and G7 are revealed also by GAM models which used environmental dimension parameters as predictors. Thus, the GHG emissions increase generates a decrease in renewable energy capacity (Figure 5K), while the CO2 emissions increase generates an increase in the dependent parameter analyzed (Figure 5L). Cointegration relations, identified among lower-middle-income economies, which involve both CO2 and GHG emissions and renewable energy were emphasized in previous studies (Apergis and Payne, 2010; Balsalobre-Lorente et al., 2018; Maneejuk et al., 2020). However, these studies revealed that in the case of several countries, economic wellbeing can influence CO2 and GHG emissions if a certain evolution point is achieved.
The GAM models for EU geopolitical block (RMSE: 18284.74) revealed a relatively constant renewable energy capacity if gas consumption increases (Figure 5M), while oil consumption increase determines an increase of renewable energy capacity until a kick point, followed by a decrease (Figure 5N). This reveals that EU economic growth is based on fossil energy sources during the first development stage, followed by a shift to renewable energy sources once it reaches a kick point, during the second development stage. According to some authors, when an economy starts its increasing trend, an increase in its energy requirements, a decrease of the share of renewable sources, and an increase in environmental pollution from fossil sources will be registered (Balsalobre-Lorente et al., 2018). The GDP per capita increase generates a low increase trend of renewable energy capacity (Figure 5O), a situation similar also if considering GDP from the industry as a predictor (Figure 5P). Other studies (Apergis and Payne, 2010; Al-Mulali et al., 2015) performed by using datasets from several European countries reported GDP as the main factor which positively influences renewable energy capacity. This reveals the necessity to segregate the modeling approach on geopolitical blocks since the EU countries’ energy policies differ compared to the rest of the European countries.
The GAM models which consider GHG and CO2 emissions, respectively, as independent predictors, reveal high similarities in the case of EU and BRICS (Figures 5E, F, Q, R). Therefore, the increase in GHG generates an increase in renewable energy production capacity (Figure 5Q). However, the increase in CO2 emissions will generate a decrease of renewable energy capacity, fact which confirms the temporary character of this predictor (Figure 5R).
4.1.3 Principal component analysis (PCA)
The PCA revealed two major components, with an eigenvalue greater than 1, which manage to explain more than 80% of data variance in the dataset (Figure 6). Additionally, it can be observed that renewable energy production capacity and GHG, respectively CO2 emissions are highly correlated and are integrated into the first component, which explains more than 60% of the variance, while the parameters related to the economic dimension are closely related to the second component, which explains about 20% of the data variance (Figure 6). Also, the PCA reveals a high correlation in terms of variance for oil and gas consumption parameters (Figure 6). Thus, it seems that environmental dimension is highly related to renewable energy production capacity.
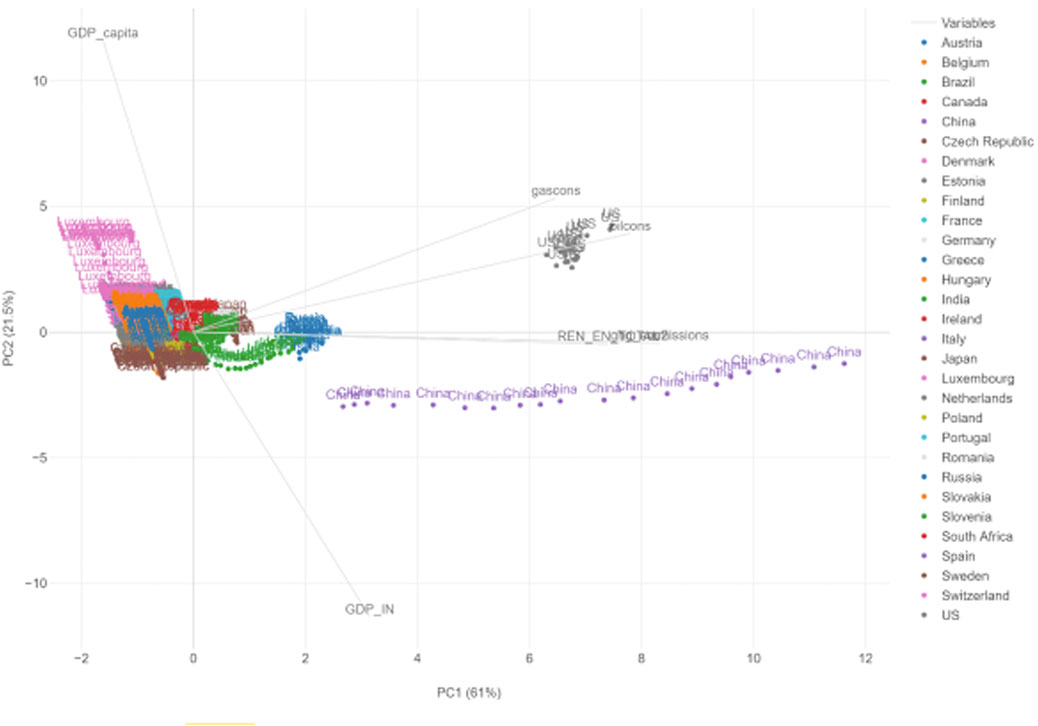
FIGURE 6. The dataset Principal Component Analysis.
4.2 Panel data analysis for BRICS
Due to non-stationary and the lack of co-integration, the model Panel VAR was used in case of BRICS (Eq. 9), which allows a short-term analysis with a regression order equal to 1.
The values obtained, by using panel least squares as a method and renewable energy production capacity as dependent variable, are presented in Table 3. The resulted model si emphasized in Eq. 10.
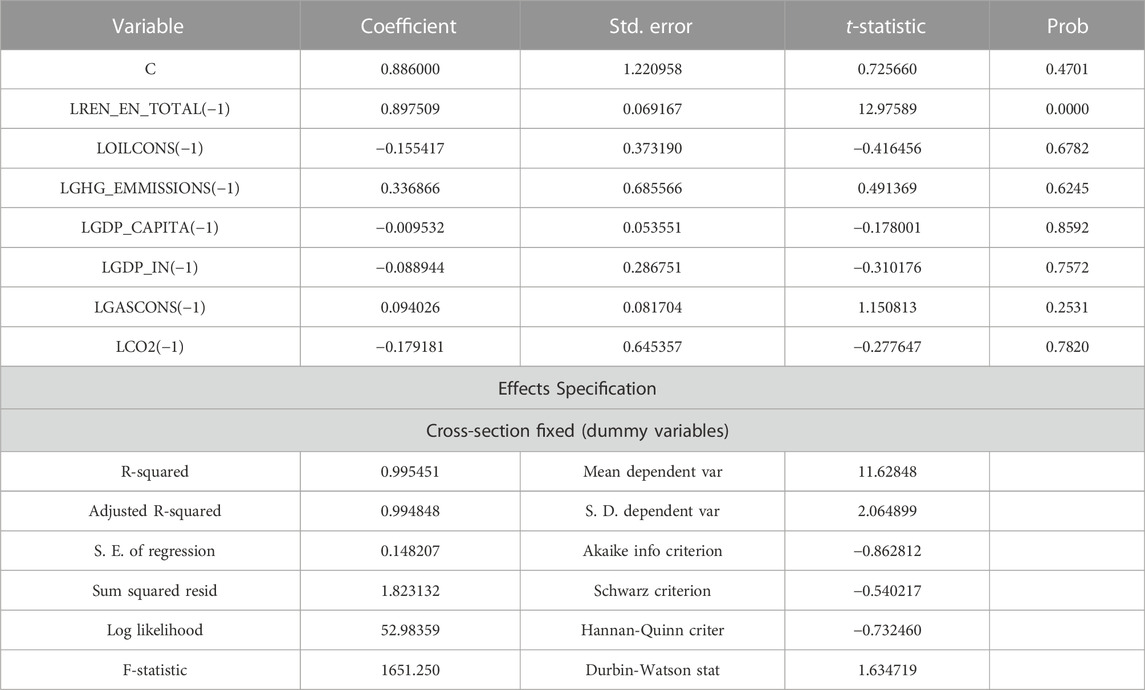
TABLE 3. Panel data analysis by using panel least squares and renewable energy production.
The model (Eq. 10) reveals that between renewable energy and oil consumption from the previous year there is a negative correlation. Thus, when the oil consumption increases by one unit, the renewable energy will decrease by 0.16 units. A positive correlation has been identified between gas consumption from the previous year and the renewable energy. Corresponding to an increase of gas consumption by one unit, the value of renewable energy will increase by 0.09 units. In terms of CO2 emissions, it was observed a negative correlation, such as the renewable energy will decrease by 0.18 if CO2 emissions from the previous year will increase by one unit. The same positive correlation is registered between the total of renewable energy and gas emissions, such as if the latter will increase by 1 unit, the renewable energy will also increase by 0.34 units. Regarding the relationship with other variables, a negative correlation with GDP per capita is observed, implying that any increase in case of GDP will lead to a decrease in the total renewable energy by 0.01 units. The GDP industry has a reverse relation with the total of renewable energy. Therefore, any increase in this indicator will lead to a drop in renewable energy by 0.089 units. The intercept calculation for each contry within BRICS geopolitical block is presented in Table 4.
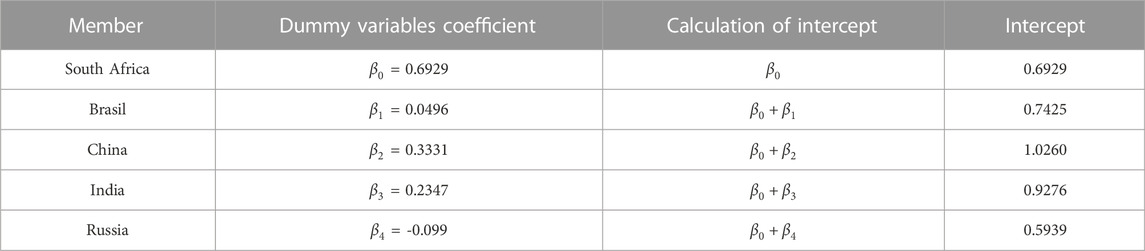
TABLE 4. Intercept calculation for each member of BRICS.
The different intercept highlights the unique characteristics of each contry. This varies for each of the studied countries and remains fix over time. Each β1, β2, β3, β4 points out how much different is the intercept in BRICS countries, compared to South Africa. In the presented model, the average value of the intercept is also estimated, which shows the mean of the total renewable energy at the level of BRICS countries, in case of which all exogenous variables of the model would be null (the value of the intercept is aproximately 0.886). The model with fixed effect was estimated by including the different intercept of each country. The intercept for South Africa is aproximately 0.69 and it is represented by the model constant with dummy type variables. This indicates the average increase of the total renewable energy if the rest would be equal to 0 (the values of the intercept are representaed in Table 3). The lowest values of the intercept compared to South Africa, is in the case of Russia, which registers a decrease by aproximately 0.099 compared to the reference country, whereas the highest is in thecase of China with aproximately 0.33 compared to the intercept of South Africa. All the intercept values point out how much different are the BRICS countries included in the present study compared to the reference country which is considered South Africa.
4.2.1 Panel data analysis for G7
Given the fact that the time dimension is bigger than the cross-sectional dimension, the stationary of variables must be validated, due to the unreliability of non-stationary variables in the asymptotic analysis. According to the data presented in Table 5, it can be observed that all 7 variables are non-stationary, however they become stationary at the difference of order 1.
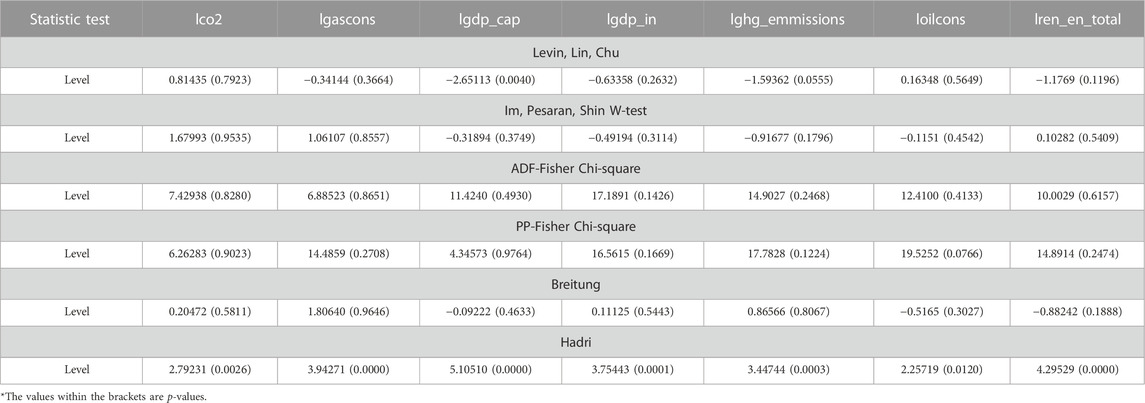
TABLE 5. Panel unit root tests for G7 countries.
After the validation of stationarity and the determination of the stationary order [I(1)], the analysis is continued by applying the Johansen test (H0 series are not co-integrated and within the alternative hypothesis, the series are co-integrated) in order to verify the co-integration. The validation of Pedroni and Kao tests lead to the conclusion that these series are not co-integrated, phenomenon which is unwanted over time since the series will not correlate with each other. In order to counteract this phenomenon and to estimate the relation between the REN_EN_TOTAL variable and independent variables, a model Panel VAR (Vector AutoRegressive) was used. The regression order of the independent variables was established at two, so that the model will estimate the relation between the variables as it follows:
The chosen model to represent the relationship between the variables is a Fixed Effects model, Panel Least Squares method, in which the individuality of each country within G7 is considered (Table 6).
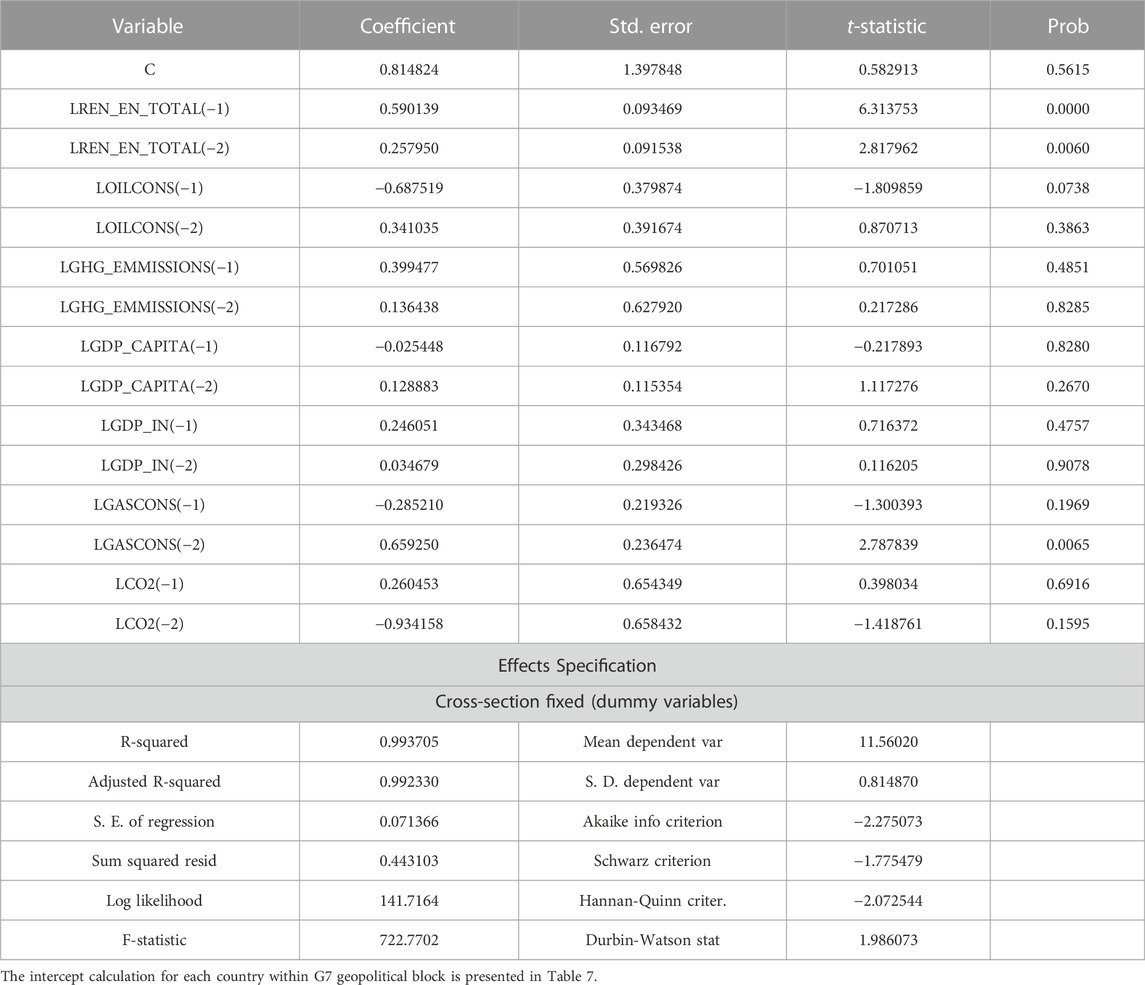
TABLE 6. Panel data analysis by using fixed effects model—Panel Least Squares method, and renewable energy production capacity as dependent variable for G7.
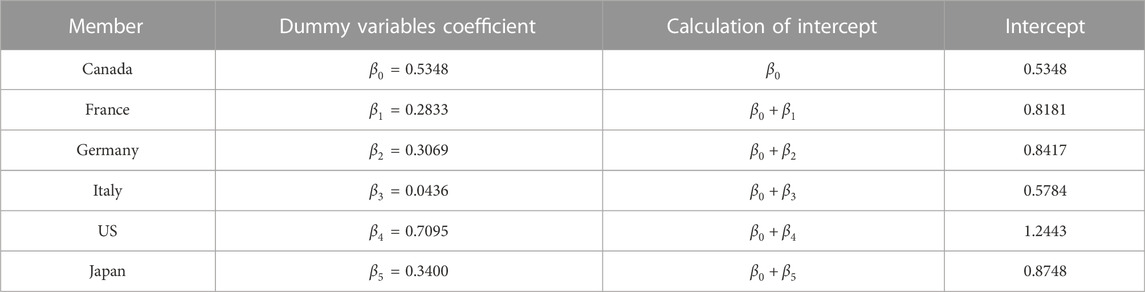
TABLE 7. The calculation of intercept values for each member of G7 geopolitical block.
The different intercept highlights the unique properties of each country. This varies for each country and remains fixed over time. Each β1, β2, β3, β4, β5 indicates how much the intercept of G7 country differs compared to Canada. By analyzing the developed model, it can be concluded that besides the oil consumption, the gas consumption from the previous period, the GDP from the previous period, as well as the CO2 emissions from 2 years previous, all the other variables manifest a positive impact on the total renewable energy. Thus, any increase in the variables will generate an increase in the total renewable energy.
The series was stationary after the first difference, and between the variables the phenomenon of co-integration is lacking; thus, the use of the short-term analysis VAR Panel was used. After the analysis of the model presented above (Eq. 12) it can be revealed that between renewable energy and oil consumption from the previous year there is a negative correlation meaning that when the oil consumption increases by 1 unit, renewable energy will decrease by 0.69 units. A positive correlation between the total renewable energy and the oil consumption from 2 years previous was observed. When the latter increases by 1 unit, the renewable energy will also increase by 0.34 units. A reverse correlation was identified between the gas consumption from the previous year and renewable energy. When the gas consumption increases by 1 unit, the value of renewable energy will decrease by 0.29 units. In the case of the relation between renewable energy and gas consumption from 2 years previous, it was observed a direct positive correlation. Thus, renewable energy will increase by 0.66 if the gas consumption will also increase by 1 unit. In the case of CO2 emissions, a positive correlation was registered with the CO2 emissions from the previous year, whereas in terms of the relationship with the values from 2 years previous, e negative correlation was observed. Thus, renewable energy will drop by 0.93 if the CO2 emissions from 2 years previous will increase by 1 unit. The same negative correlation is manifested in the case of GDP per capita. Hence, if the latter increases by 1 unit, the renewable will decrease by 0.03 units. In the case of the relation with the rest of the variables, a positive correlation is observed. Therefore, any increase of the variables will lead to an increase of the total renewable energy. The average value of the intercept was estimated for the present model (Eq. 12). This fact points out the average of the total renewable energy at the level of G7 countries, in the case of which all exogenous variables would be null (the value of the intercept is approximately 0.81). The fixed effect model was estimated by including the different intercept of each country. The intercept of Canada is approximately 0.53 and is represented by the model constant, which indicates the mean increase of the total renewable energy if the rest would be 0 (the values for the intercept are represented in Table 6. The lowest intercept value compared to Canada was registered in the case of Italy (with 0.04 higher), while the highest was observed in the case of the United States with approximately 0.71 compared to Canada. All these values of the intercept emphasize how different are the analyzed G7 countries compared to the reference country (Canada). Due to non-stationary and the lack of co-integration, the model Panel Var was used, which allows a short-term analysis (the regression order is 4).
4.3 Panel data analysis for EU
The panel data model used for EU geopolitical block is presented above (Eq. 13).
The values obtained, by using panel least squares as a method and renewable energy production capacity as a dependent variable, are presented in Table 8.
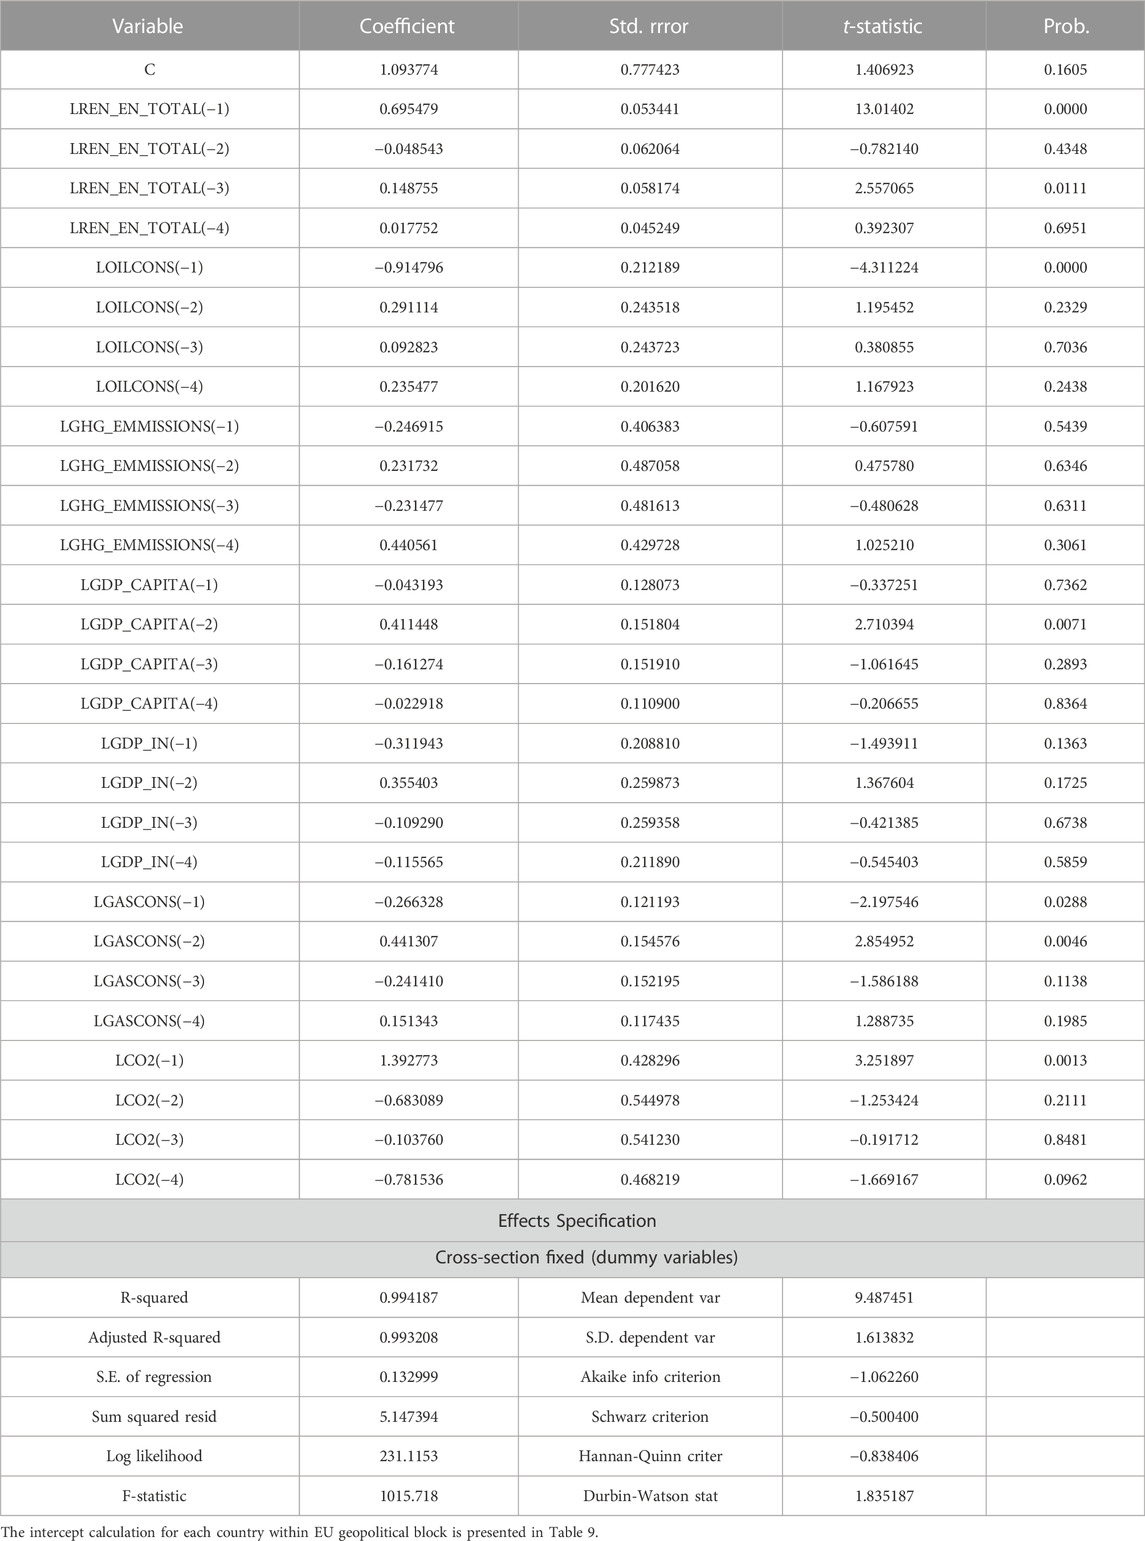
TABLE 8. Panel data analysis by using panel least squares and renewable energy production capacity as dependent variable for EU.
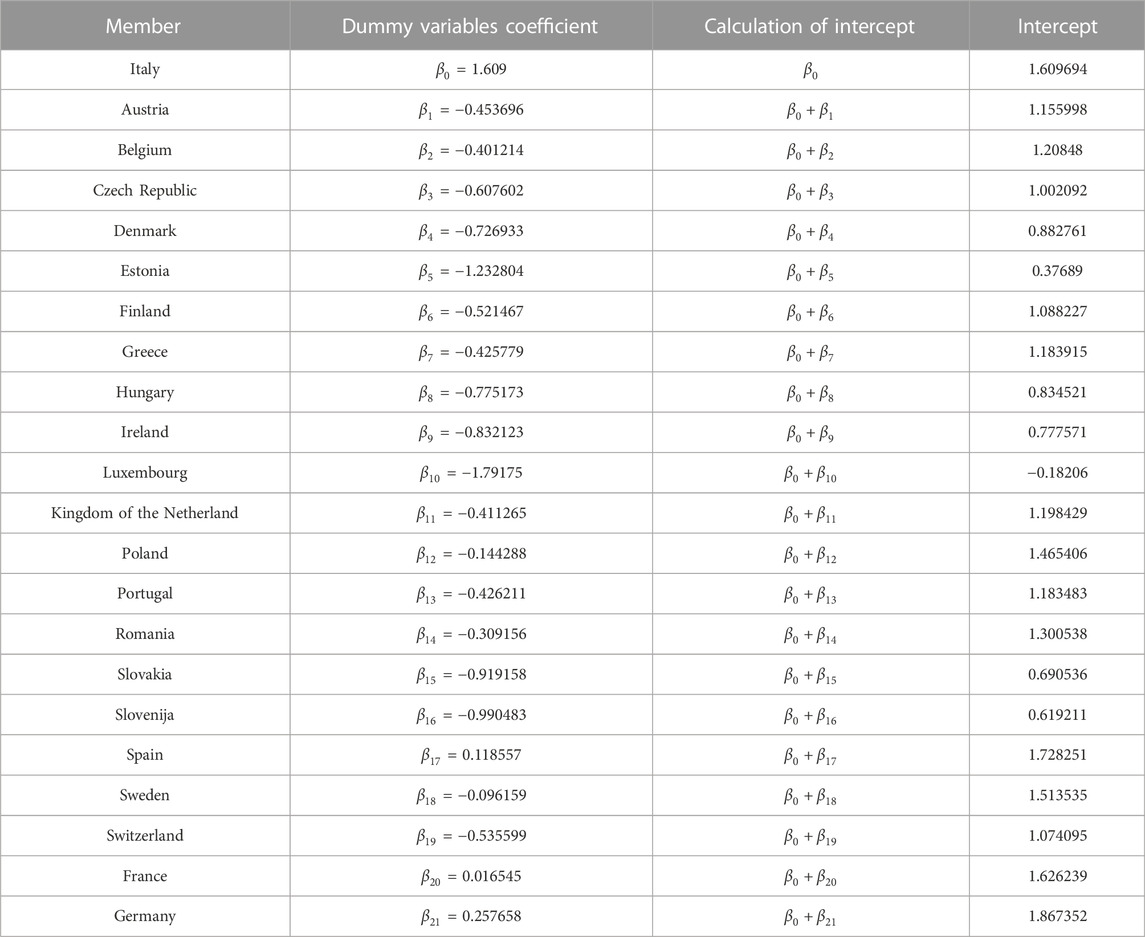
TABLE 9. Intercept calculation for each member of EU geopolitical block.
The different intercept highlights the unique characteristics of each country. This varies for each country and remains fixed over time. Each β1, β2, β3, β4 indicates how much different the intercept of EU countries compared to Italy. In the case of the presented model, the average values for the intercept were estimated, which indicates the mean of the total renewable energy at the level of G7 countries in case of all the exogenous variables would be null (the intercept value is approximately 1.093). The fixed effects model was estimated by including the different intercepts of each country. The intercept for Italy is approximately 1.609 and is represented by the model dummy constant, which shows the average increase ot the total renewable energy if the rest was 0 (the intercept values are represented in Table 8). The lowest values of the intercept compared to Italy is registered in the case of Luxembourg which has a decrease of approximately 1.79 compared to the reference country, whereas the highest is registered in the case of Germany with approximately 0.26 compared to the intercept of Italy. All these values indicate how much different are the countries from EU compared to the reference country (Italy).
5 Discussions of policy implications
The recent finding in terms of the energy-environment-economy nexus revealed that nuclear energy production capacity reduces CO2 emissions, considering a dataset valid for France (Iwata et al., 2010) and UAE (AlFarra and Abu-Hijleh, 2012). Also, a study (Dong et al., 2018) performed using China dataset revealed that an increase in nuclear and renewable energy production capacity will positively contribute to the reduction of CO2 emissions in both short and long time periods. The role of GDP is emphasized by previous authors (Wang et al., 2018) which analyse a dataset which includes parameters from random chosen G7, BRICS, South America, EU, Europe, Asian and Australian development countries and concluded that GDP per capita is a significantly positive contributor to renewable energy consumption. Another analytical framework (Kahia et al., 2019) based on MENA countries dataset revealed that renewable energy production implemented at a large scale within all economic sectors can reduce CO2 emissions. Considering the European region, some authors (Bekun et al., 2019) elaborated models considering some countries with increased economic capabilities and revealed that increasing renewable energy production capacity generated the reduction of CO2 emissions, while an economic development based on non-renewable energy decreased the environmental sustainability. These findings are also confirmed by large-scale studies (Ben Jebli et al., 2020) which analysed data provided by over 100 countries. Also, studies performed on G7 countries confirmed the possitive impact of increasing the income and, therefore, the GDP, on ecological footprint.
According to some authors (Latake et al., 2015), the process of promoting sustainable development implies massive use of renewable energy for activities such as power generation and carbon dioxide sequestration, establishing, therefore, a direct relation between renewables production and clean development mechanism efficiency. However, other authors (Bhuiyan et al., 2022) indicate that factors as renewable energy input-output costs, higher constant production and maintenance costs, labor know-how, as well as public acceptance and education oriented to sustainable development necessity could be determinant factors in predicting the dynamics of the renewable energy production. Also, the same study (Bhuiyan et al., 2022) recommends that G7 group should focus on green growth strategy in order to achieve global sustainable development goals.
The findings of the present study were also confirmed by other authors (Bhuiyan et al., 2022) that indicate that fossil fuels use to boost economic growth may be beneficial only in the early stages of production, whereas using clean energy may not be beneficial in the early stages of production in expanding production activities. Recent findings (Kilinc-Ata and Dolmatov, 2022) emphasized that it is vital to design a national policy on economic growth, research and development, and renewable energy policies that are effective in renewable energy investments, recommending, therefore, that main geopolitical blocks should focus more on the policies. This emphasizes the need for various decision support tools for assisting the decision-makers on developing proper policies in various global scenarios.
Also, commercialization and wide accessibility of renewable energies could be considered in future studies, since production is powered by demand and demand must be created through education and political decisions. However, according to some authors (Ahmad et al., 2021), the behaviors of individuals are reshaped during extraordinary events such as the pandemic times (COVID-19), situation which makes the renewable energy demand dynamics more unpredicted. However, although it is clear that renewable energy use must be promoted through political channels, other authors point out that inconsistent policies could affect renewable energy consumption in the long run.
As expected, the results of the present study confirm a hypothesis revealed by other authors (Borozan, 2022) according to which the increase in GDP per capita has a favorable and significant impact on renewable energy in the long run. However, the nexus between renewable energy—GDP was reported to differ among countries from geopolitical blocks, as emphasized in a previous study.
The current research manages to formally depict a multidimensional perspective of the existing relationship between renewable energy capacities, the general economic conditions, oil and gas consumptions, respectively GHG and CO2 emissions. Thus, the presented analysis acts as a tool which helps in understanding the main differences and similarities between the three analysed geo-political groups and can serve also, as a decision support service (DSS) that will help the adoption of optimal strategies in relation to environmental pollution, for BRICS, G7 and EU countries. Also, the model-driven decision support methodology developed within this study can be transferred at the national level, for countries which were not included in this analysis, in order to develop a common strategic goal towards a global environmentally sustainable policy. Also, the model-driven DSS can act as a tool that can assist decision-makers in the context of special or extraordinary global events marked by global conflicts. However, DSS must be used as a synergy tool within the collaborative projects between all three geopolitical blocks, targeting to develop energy-efficient and efficient frameworks, as well as to support environmental and sustainable activities, fact confirmed also in previous studies (Kilinc-Ata and Dolmatov, 2022). Future model-driven DSS may also consider indicators associated to research and development sector since it had been proven, by other authors (Borozan, 2022; Kilinc-Ata and Dolmatov, 2022) that can have a positive effect on sustainable growth, and stimulate current technology while simultaneously reducing CO2 emissions. The importance of DSS for policy-makers is vital since, according to previous study (EL-Karimi and El-houjjaji, 2022) better understanding of clean energy—economic growth nexus is important since it meets both dual objective of unlocking higher economic growth rates and preserve cleaner and sustainable production without damaging the environment.
6 Conclusion
The models elaborated in the current study present a good prediction capacity and reveal specific peculiarities for each analyzed geopolitical block. The study concludes that oil consumption has the highest future importance in predicting renewable energy production capacity among EU countries, while GHG emission and gas consumption are the most important predictors in BRICS and G7 countries, respectively. Additionally, the generalized additive models emphasize evolution scenarios with different peculiarities, specific for each analyzed geopolitical block. So, it is revealed that EU economic growth is based on fossil energy sources during the first development stage, followed by a shift to renewable energy sources once it reaches a kick point, during the second development stage. Regarding G7, the opposite evolution of the predicted renewable energy production capacity and oil consumption dynamics emphasizes the trend is orientated toward fossil fuels. The GAM dynamics in the case of BRICS indicate that gas consumption appears because of increasing industrial capacity, followed by an increase in economic sustainability.
The renewable energy production capacity and both environmental dimension predictors (GHG and CO2 emissions) are highly correlated, while the economic indicators (GDP per capita and GDP from industry) act as separate components of the analytical framework. However, to facilitate the renewable energy production extension, it is recommended that all the analyzed groups should work as a core team, optimizing, therefore, their internal strategies and policies to a common goal.
Therefore, from the managerial perspective, we emphasize the possibility of using a tridimensional tool, based on the energy-economy-environment nexus, this way adopting decisions which will maximize the optimize the strategies oriented to developing the renewable energy sector. Thus, the European governments and the G7 need to retain the use of oil fuel energy consumption as it is negatively associated with the development of the renewable energy production sector. It is emphasized that gas energy consumption has a limited influence on renewable energy production in EU, while in G7 the increase in gas consumption is associated with an increase in renewable energy production. However, BRICS shall limit its gas consumption in order to assure both an increase in renewable energy production and environmental degradation prevention, targeting especially to reduce GHG emissions which will increase in the scenario of encouraging renewable energy production without discouraging gas consumption. It is recommended therefore to adopt as a long-term target the partial replacement of fossil fuel energy consumption with renewable energy consumption, by supporting the sustainable energy production industry, at least in a manner that assures the maintenance of GHG and CO2 emissions within an optimal range. This can be achieved by elaborating more encouraging subsidy policies for the adoption of renewable energy production technologies, as well as increasing fossil fuels taxes, especially for end consumers. Outside subsidies, environmentally friendly economic activities and even households must be encouraged by applying tax concessions. Providing motivating financing schemes within the geopolitical block could be a solution for encouraging the adoption of renewable energy within the existing economy, without affecting the economic development dynamics.
7 Limitations and future research directions
Similar to most studies, the design of the current study is subject to limitations. Thus, the analytical framework can be considered limited by the number of parameters considered as independent variables or predictors. However, a limited number of parameters can increase the applicability of the resulting models, making them more accessible for policymakers. Also, another limitation can be related to the time period covered by the dataset. However, a large amount of historical data can decrease the accuracy and actuality of the models since the energy-environment-economical nexus is characterized by dynamics and long-term prediction models are not recommended to be used.
Future research direction should focus on identifying certain renewable energy categories, specific for each analyzed country, in order to better optimize the regional strategies and potentiate the specific assets of each region.
Data availability statement
Publicly available datasets were analyzed in this study. This data can be found here: https://www.bp.com; https://www.irena.org; https://www.oecd.org.
Author contributions
Conceptualization and state of the art: CF, DSC, IAS, and MLZ; Analysis, methodology: DSC, CGZ, IAS, SMP, and DM; Writing original draft—results: C.G.Z., V.M.A., R.V.I., and S.M.P.; Writing editing—discussions: VMA, RVI, MLZ, CF, and DM.; Project administration: DSC and SMP.
Funding
This work was supported by a grant from the Romanian National Authority for Scientific Research and Innovation, CNCS/CCCDI–UEFISCDI, project PN-III-P2-2.1-PTE-2019–0697, contract no 51PTE, within PNCDI III. This research was supported by the internal research grant RF 14883/11.05.2022 provided by “Dunarea de Jos” University of Galati—“Support and development of CDI-TT activities at the Dunărea de Jos University of Galati’’. The present study was supported by the project An Integrated System for the Complex Environmental Research and Monitoring in the Danube River Area, REXDAN, SMIS code 127065, co-financed by the European Regional Development Fund through the Competitiveness Operational Programme 2014–2020, contract no. 309/10.07.2021. This work was supported by grant 14882/11.05.2022 “Support and development of CDI-TT activities at the Dunărea de Jos University of Galați”. This work was supported by grant 14883/11.05.2022 “Support and development of CDI-TT activities at the Dunărea de Jos University of Galați”.
Conflict of interest
The authors declare that the research was conducted in the absence of any commercial or financial relationships that could be construed as a potential conflict of interest.
Publisher’s note
All claims expressed in this article are solely those of the authors and do not necessarily represent those of their affiliated organizations, or those of the publisher, the editors and the reviewers. Any product that may be evaluated in this article, or claim that may be made by its manufacturer, is not guaranteed or endorsed by the publisher.
References
Abd El-Aziz, R. M. (2022). Renewable power source energy consumption by hybrid machine learning model. Alexandria Eng. J. 61, 9447–9455. doi:10.1016/j.aej.2022.03.019
Adekoya, O. B. (2021). Revisiting oil consumption-economic growth nexus: Resource-curse and scarcity tales. Resour. Policy 70, 101911. doi:10.1016/j.resourpol.2020.101911
Ahmad, M., Akhtar, N., Jabeen, G., Irfan, M., Khalid Anser, M., and Wu, H. (2021). Intention-based critical factors affecting willingness to adopt novel coronavirus prevention in Pakistan: Implications for future pandemics. Int. J. Environ. Res. Public Health 18, 6167. doi:10.3390/ijerph18116167
Ahmad, M., and Zhao, Z.-Y. (2018). Empirics on linkages among industrialization, urbanization, energy consumption, CO2 emissions and economic growth: A heterogeneous panel study of China. Environ. Sci. Pollut. Res. 25, 30617–30632. doi:10.1007/s11356-018-3054-3
Akram, R., Chen, F., Khalid, F., Huang, G., and Irfan, M. (2021). Heterogeneous effects of energy efficiency and renewable energy on economic growth of BRICS countries: A fixed effect panel quantile regression analysis. Energy 215, 119019. doi:10.1016/j.energy.2020.119019
Akram, R., Chen, F., Khalid, F., Ye, Z., and Majeed, M. T. (2020a). Heterogeneous effects of energy efficiency and renewable energy on carbon emissions: Evidence from developing countries. J. Clean. Prod. 247, 119122. doi:10.1016/j.jclepro.2019.119122
Akram, R., Majeed, M. T., Fareed, Z., Khalid, F., and Ye, C. (2020b). Asymmetric effects of energy efficiency and renewable energy on carbon emissions of BRICS economies: Evidence from nonlinear panel autoregressive distributed lag model. Environ. Sci. Pollut. Res. 27, 18254–18268. doi:10.1007/s11356-020-08353-8
Al-Mulali, U., Ozturk, I., and Lean, H. H. (2015). The influence of economic growth, urbanization, trade openness, financial development, and renewable energy on pollution in Europe. Nat. Hazards (Dordr). 79, 621–644. doi:10.1007/s11069-015-1865-9
AlFarra, H. J., and Abu-Hijleh, B. (2012). The potential role of nuclear energy in mitigating CO2 emissions in the United Arab Emirates. Energy Policy 42, 272–285. doi:10.1016/j.enpol.2011.11.084
Amin, N., Song, H., and Shabbir, M. S. (2022). What factors contribute to environmental degradation in G11 economies? Emphasizing the importance of renewable and non-renewable energy sources. Int. J. Sustain. Dev. World Ecol. 29, 472–482. doi:10.1080/13504509.2022.2059720
Androniceanu, A.-M., Georgescu, I., Dobrin, C., and Drăgulănescu, I. (2020). Multifactorial components analysis of the renewable energy sector in the oecd countries and managerial implications. Pol. J. Manag. Stud. 22, 36–49. doi:10.17512/pjms.2020.22.2.03
Apergis, N., and Payne, J. E. (2010). Renewable energy consumption and economic growth: Evidence from a panel of OECD countries. Energy Policy 38, 656–660. doi:10.1016/j.enpol.2009.09.002
Aslan, A., Ocal, O., Ozsolak, B., and Ozturk, I. (2022). Renewable energy and economic growth relationship under the oil reserve ownership: Evidence from panel VAR approach. Renew. Energy 188, 402–410. doi:10.1016/j.renene.2022.02.039
Assi, A. F., Zhakanova Isiksal, A., and Tursoy, T. (2021). Renewable energy consumption, financial development, environmental pollution, and innovations in the ASEAN + 3 group: Evidence from (P-ARDL) model. Renew. Energy 165, 689–700. doi:10.1016/j.renene.2020.11.052
Azam, A., Rafiq, M., Shafique, M., Zhang, H., and Yuan, J. (2021). Analyzing the effect of natural gas, nuclear energy and renewable energy on GDP and carbon emissions: A multi-variate panel data analysis. Energy 219, 119592. doi:10.1016/j.energy.2020.119592
Balsalobre-Lorente, D., Shahbaz, M., Roubaud, D., and Farhani, S. (2018). How economic growth, renewable electricity and natural resources contribute to CO2 emissions? Energy Policy 113, 356–367. doi:10.1016/j.enpol.2017.10.050
Bekun, F. V., Alola, A. A., and Sarkodie, S. A. (2019). Toward a sustainable environment: Nexus between CO2 emissions, resource rent, renewable and nonrenewable energy in 16-EU countries. Sci. Total Environ. 657, 1023–1029. doi:10.1016/j.scitotenv.2018.12.104
Ben Jebli, M., Farhani, S., and Guesmi, K. (2020). Renewable energy, CO2 emissions and value added: Empirical evidence from countries with different income levels. Struct. Change Econ. Dyn. 53, 402–410. doi:10.1016/j.strueco.2019.12.009
Bhuiyan, M. A., Zhang, Q., Khare, V., Mikhaylov, A., Pinter, G., and Huang, X. (2022). “Renewable energy consumption and economic growth nexus—a systematic literature review,” Frontiers in environmental science 10. 412. doi:10.3389/fenvs.2022.878394Available at: https://www.frontiersin.org/articles/10.3389/fenvs.2022.878394[Accessed November 13, 2022]
Bilgili, F., Kuşkaya, S., Ünlü, F., and Gençoğlu, P. (2022). Export quality, economic growth, and renewable-nonrenewable energy use: Non-linear evidence through regime shifts. Environ. Sci. Pollut. Res. 29, 36189–36207. doi:10.1007/s11356-022-18601-8
Borozan, D. (2022). Asymmetric effects of policy uncertainty on renewable energy consumption in G7 countries. Renew. Energy 189, 412–420. doi:10.1016/j.renene.2022.02.055
Chai, J., Shi, H., Lu, Q., and Hu, Y. (2020). Quantifying and predicting the Water-Energy-Food-Economy-Society-Environment Nexus based on Bayesian networks - a case study of China. J. Clean. Prod. 256, 120266. doi:10.1016/j.jclepro.2020.120266
Chen, M., Liu, Q., Chen, S., Liu, Y., Zhang, C.-H., and Liu, R. (2019). XGBoost-based algorithm interpretation and application on post-fault transient stability status prediction of power system. IEEE Access 7, 13149–13158. doi:10.1109/ACCESS.2019.2893448
Chrulski, T., and Łaciak, M. (2021). Analysis of natural gas consumption interdependence for polish industrial consumers on the basis of an econometric model. Energies 14, 7649. doi:10.3390/en14227649
Çıtak, F., Uslu, H., Batmaz, O., and Hoş, S. (2021). Do renewable energy and natural gas consumption mitigate CO2 emissions in the USA? New insights from NARDL approach. Environ. Sci. Pollut. Res. 28, 63739–63750. doi:10.1007/s11356-020-11094-3
Danish, R., and Ulucak, R. (2020). How do environmental technologies affect green growth? Evidence from BRICS economies. Sci. Total Environ. 712, 136504. doi:10.1016/j.scitotenv.2020.136504
Dellink, R., Chateau, J., Lanzi, E., and Magné, B. (2017). Long-term economic growth projections in the shared socioeconomic pathways. Glob. Environ. Change 42, 200–214. doi:10.1016/j.gloenvcha.2015.06.004
Doğan, B., Balsalobre-Lorente, D., and Nasir, M. A. (2020). European commitment to COP21 and the role of energy consumption, FDI, trade and economic complexity in sustaining economic growth. J. Environ. Manag. 273, 111146. doi:10.1016/j.jenvman.2020.111146
Dogan, E., Majeed, M. T., and Luni, T. (2022). Revisiting the nexus of ecological footprint, unemployment, and renewable and non-renewable energy for South Asian economies: Evidence from novel research methods. Renew. Energy 194, 1060–1070. doi:10.1016/j.renene.2022.05.165
Dong, K., Sun, R., and Dong, X. (2018). CO2 emissions, natural gas and renewables, economic growth: Assessing the evidence from China. Sci. Total Environ. 640–641, 293–302. doi:10.1016/j.scitotenv.2018.05.322
Dong, K., Sun, R., and Hochman, G. (2017). Do natural gas and renewable energy consumption lead to less CO2 emission? Empirical evidence from a panel of BRICS countries. Energy 141, 1466–1478. doi:10.1016/j.energy.2017.11.092
Dumor, K., Li, Y., Amouzou, E. K., Ampaw, E. M., Kursah, M. B., and Akakpo, K. (2022). Modeling the dynamic nexus among CO2 emissions, fossil energy usage, and human development in east Africa: New insight from the novel DARDL simulation embeddedness. Environ. Sci. Pollut. Res. 29, 56265–56280. doi:10.1007/s11356-022-19546-8
Eggoh, J. C., Bangake, C., and Rault, C. (2011). Energy consumption and economic growth revisited in African countries. Energy Policy 39, 7408–7421. doi:10.1016/j.enpol.2011.09.007
El-Karimi, M., and El-houjjaji, H. (2022). Economic growth and renewable energy consumption nexus in G7 countries: Symmetric and asymmetric causality analysis in frequency domain. J. Clean. Prod. 342, 130618. doi:10.1016/j.jclepro.2022.130618
Fadiran, G., Adebusuyi, A. T., and Fadiran, D. (2019). Natural gas consumption and economic growth: Evidence from selected natural gas vehicle markets in Europe. Energy 169, 467–477. doi:10.1016/j.energy.2018.12.040
Fang, J., Kong, G., and Yang, Q. (2022). Group performance of energy piles under cyclic and variable thermal loading. J. Geotech. Geoenviron. Eng. 148, 04022060. doi:10.1061/(ASCE)GT.1943-5606.0002840
Fu, F. Y., Alharthi, M., Bhatti, Z., Sun, L., Rasul, F., and Hanif, I. (2021). The dynamic role of energy security, energy equity and environmental sustainability in the dilemma of emission reduction and economic growth. J. Environ. Manag. 280, 111828. doi:10.1016/j.jenvman.2020.111828
Gallo, A., Mason, P., Shapiro, S., and Fabritius, M. (2010). What is behind the increase in oil prices? Analyzing oil consumption and supply relationship with oil price. Energy 35, 4126–4141. doi:10.1016/j.energy.2010.06.033
Gertz, M., Große-Butenuth, K., Junge, W., Maassen-Francke, B., Renner, C., and Sparenberg, H. (2020). Using the XGBoost algorithm to classify neck and leg activity sensor data using on-farm health recordings for locomotor-associated diseases. Comput. Electron. Agric. 173, 105404. doi:10.1016/j.compag.2020.105404
Gozgor, G., Lau, C. K. M., and Lu, Z. (2018). Energy consumption and economic growth: New evidence from the OECD countries. Energy 153, 27–34. doi:10.1016/j.energy.2018.03.158
Guo, Y., Yu, C., Zhang, H., and Cheng, H. (2021). Asymmetric between oil prices and renewable energy consumption in the G7 countries. Energy 226, 120319. doi:10.1016/j.energy.2021.120319
Hasan, M. M., and Raza, M. Y. (2022). Nexus of natural gas consumption and economic growth: Does the 2041 Bangladesh development goal realistic within its limited resource? Energy Strategy Rev. 41, 100863. doi:10.1016/j.esr.2022.100863
Hussain, M. N., Li, Z., Sattar, A., and Ilyas, M. (2022). Evaluating the impact of energy and environment on economic growth in BRI countries. Energy & Environ., 0958305X2110738. doi:10.1177/0958305X211073805
Ibrahim, M. D., and Alola, A. A. (2020). Integrated analysis of energy-economic development-environmental sustainability nexus: Case study of MENA countries. Sci. Total Environ. 737, 139768. doi:10.1016/j.scitotenv.2020.139768
İnal, V., Addi, H. M., Çakmak, E. E., Torusdağ, M., and Çalışkan, M. (2022). The nexus between renewable energy, CO2 emissions, and economic growth: Empirical evidence from African oil-producing countries. Energy Rep. 8, 1634–1643. doi:10.1016/j.egyr.2021.12.051
Iwata, H., Okada, K., and Samreth, S. (2010). Empirical study on the environmental Kuznets curve for CO2 in France: The role of nuclear energy. Energy Policy 38, 4057–4063. doi:10.1016/j.enpol.2010.03.031
Jordan, C. (1874). Mémoire sur les formes bilinéaires. J. de mathématiques pures appliquées 19, 35–54.
Kahia, M., Ben Jebli, M., and Belloumi, M. (2019). Analysis of the impact of renewable energy consumption and economic growth on carbon dioxide emissions in 12 MENA countries. Clean. Technol. Environ. Policy 21, 871–885. doi:10.1007/s10098-019-01676-2
Khamma, T. R., Zhang, Y., Guerrier, S., and Boubekri, M. (2020). Generalized additive models: An efficient method for short-term energy prediction in office buildings. Energy 213, 118834. doi:10.1016/j.energy.2020.118834
Khan, S. A. R., Godil, D., Attari, M. U., Yu, Z., Akhtar, M., and Liang, Z. (2021). Investigating the nexus between energy, economic growth, and environmental quality: A road map for the sustainable development. Sustain. Dev. 29, 835–846. doi:10.1002/sd.2178
Khan, S. A. R., Ponce, P., Yu, Z., Golpîra, H., and Mathew, M. (2022). Environmental technology and wastewater treatment: Strategies to achieve environmental sustainability. Chemosphere 286, 131532. doi:10.1016/j.chemosphere.2021.131532
Khan, S. A. R., Yu, Z., and Umar, M. (2022). A road map for environmental sustainability and green economic development: An empirical study. Environ. Sci. Pollut. Res. 29, 16082–16090. doi:10.1007/s11356-021-16961-1
Khan, S. A. R., Yu, Z., Umar, M., Zia-Ul-Haq, M., Awan, M., and Janjua, L., (2021). Renewable energy and advanced logistical infrastructure: Carbon-free economic development. Sustain. Dev. 10, 693–702. doi:10.1002/sd.2266
Kilinc-Ata, N., and Dolmatov, I. A. (2022). Which factors influence the decisions of renewable energy investors? Empirical evidence from OECD and BRICS countries. Environ. Sci. Pollut. Res. Int., 1–17. doi:10.1007/s11356-022-22274-8
Latake, A., Latake, P., and Pawar, P. (2015). The greenhouse effect and its impacts on environment. Int. J. Innovative Res. Creative Technol. (IJIRCT) 1, 333–337.
Le, T.-H., and Park, D. (2021). What drives energy insecurity across the world? A panel data analysis. Energy Res. Soc. Sci. 77, 102093. doi:10.1016/j.erss.2021.102093
Leal, P. A., Marques, A. C., and Fuinhas, J. A. (2019). Decoupling economic growth from GHG emissions: Decomposition analysis by sectoral factors for Australia. Econ. Analysis Policy 62, 12–26. doi:10.1016/j.eap.2018.11.003
Li, X., Li, Y. P., Huang, G. H., Lv, J., Ma, Y., and Li, Y. F. (2021). A multi-scenario input-output economy-energy-environment nexus management model for Pearl River Delta urban agglomeration. J. Clean. Prod. 317, 128402. doi:10.1016/j.jclepro.2021.128402
Lin, Y., Li, B., Moiser, T. M., Griffel, L. M., Mahalik, M. R., and Kwon, J. (2022). Revenue prediction for integrated renewable energy and energy storage system using machine learning techniques. J. Energy Storage 50, 104123. doi:10.1016/j.est.2022.104123
Liu, W., Liu, W. D., and Gu, J. (2020). Predictive model for water absorption in sublayers using a Joint Distribution Adaption based XGBoost transfer learning method. J. Petroleum Sci. Eng. 188, 106937. doi:10.1016/j.petrol.2020.106937
Liu, Y., Tian, J., Zheng, W., and Yin, L. (2022). Spatial and temporal distribution characteristics of haze and pollution particles in China based on spatial statistics. Urban Clim. 41, 101031. doi:10.1016/j.uclim.2021.101031
Lu, H., Ma, X., Ma, M., and Zhu, S. (2021). Energy price prediction using data-driven models: A decade review. Comput. Sci. Rev. 39, 100356. doi:10.1016/j.cosrev.2020.100356
Magazzino, C., Porrini, D., Fusco, G., and Schneider, N. (2021). Investigating the link among ICT, electricity consumption, air pollution, and economic growth in EU countries. Energy Sources, Part B Econ. Plan. Policy 16, 976–998. doi:10.1080/15567249.2020.1868622
Mahi, M., Ismail, I., Phoong, S. W., and Isa, C. R. (2021). Mapping trends and knowledge structure of energy efficiency research: What we know and where we are going. Environ. Sci. Pollut. Res. 28, 35327–35345. doi:10.1007/s11356-021-14367-7
Maneejuk, N., Ratchakom, S., Maneejuk, P., and Yamaka, W. (2020). Does the environmental kuznets curve exist? An international study. Sustainability 12, 9117. doi:10.3390/su12219117
Mehmood, U., Agyekum, E. B., Tariq, S., Ul Haq, Z., Uhunamure, S. E., and Edokpayi, J. N. (2022). Socio-economic drivers of renewable energy: Empirical evidence from BRICS. Int. J. Environ. Res. Public Health 19, 4614. doi:10.3390/ijerph19084614
Mo, H., Sun, H., Liu, J., and Wei, S. (2019). Developing window behavior models for residential buildings using XGBoost algorithm. Energy Build. 205, 109564. doi:10.1016/j.enbuild.2019.109564
Mohsin, M., Kamran, H. W., Atif Nawaz, M., Sajjad Hussain, M., and Dahri, A. S. (2021). Assessing the impact of transition from nonrenewable to renewable energy consumption on economic growth-environmental nexus from developing Asian economies. J. Environ. Manag. 284, 111999. doi:10.1016/j.jenvman.2021.111999
Moreau, V., and Vuille, F. (2018). Decoupling energy use and economic growth: Counter evidence from structural effects and embodied energy in trade. Appl. Energy 215, 54–62. doi:10.1016/j.apenergy.2018.01.044
Mukhtarov, S., Mikayilov, J. I., Humbatova, S., and Muradov, V. (2020). Do high oil prices obstruct the transition to renewable energy consumption? Sustainability 12, 4689. doi:10.3390/su12114689
Mukhtarov, S., Mikayilov, J. I., Maharramov, S., Aliyev, J., and Suleymanov, E. (2022). Higher oil prices, are they good or bad for renewable energy consumption: The case of Iran? Renew. Energy 186, 411–419. doi:10.1016/j.renene.2021.12.135
Murshed, M., Alam, R., and Ansarin, A. (2021). The environmental kuznets curve hypothesis for Bangladesh: The importance of natural gas, liquefied petroleum gas, and hydropower consumption. Environ. Sci. Pollut. Res. 28, 17208–17227. doi:10.1007/s11356-020-11976-6
Nathaniel, S. P., Alam, Md. S., Murshed, M., Mahmood, H., and Ahmad, P. (2021). The roles of nuclear energy, renewable energy, and economic growth in the abatement of carbon dioxide emissions in the G7 countries. Environ. Sci. Pollut. Res. 28, 47957–47972. doi:10.1007/s11356-021-13728-6
Nawaz, M. A., Hussain, M. S., Kamran, H. W., Ehsanullah, S., Maheen, R., and Shair, F. (2021). Trilemma association of energy consumption, carbon emission, and economic growth of BRICS and OECD regions: Quantile regression estimation. Environ. Sci. Pollut. Res. 28, 16014–16028. doi:10.1007/s11356-020-11823-8
Nepal, R., Paija, N., Tyagi, B., and Harvie, C. (2021). Energy security, economic growth and environmental sustainability in India: Does FDI and trade openness play a role? J. Environ. Manag. 281, 111886. doi:10.1016/j.jenvman.2020.111886
Ni, X., Wang, Z., Akbar, A., and Ali, S. (2022). Natural resources volatility, renewable energy, R&D resources and environment: Evidence from selected developed countries. Resour. Policy 77, 102655. doi:10.1016/j.resourpol.2022.102655
Nuţă, F. M., Nuţă, A. C., Zamfir, C. G., Petrea, S. M., Munteanu, D., and Cristea, D. S. (2021). National carbon accounting—analyzing the impact of urbanization and energy-related factors upon CO2 emissions in central–eastern European countries by using machine learning algorithms and panel data analysis. Energies 14, 2775. doi:10.3390/en14102775
Oluoch, S., Lal, P., and Susaeta, A. (2021). Investigating factors affecting renewable energy consumption: A panel data analysis in sub saharan Africa. Environ. Challenges 4, 100092. doi:10.1016/j.envc.2021.100092
Qiu, L., He, L., Lu, H., and Liang, D. (2022). Pumped hydropower storage potential and its contribution to hybrid renewable energy co-development: A case study in the qinghai-tibet plateau. J. Energy Storage 51, 104447. doi:10.1016/j.est.2022.104447
Qiu, L., He, L., Lu, H., and Liang, D. (2022). Systematic potential analysis on renewable energy centralized co-development at high altitude: A case study in qinghai-tibet plateau. Energy Convers. Manag. 267, 115879. doi:10.1016/j.enconman.2022.115879
Rahman, M. M., and Velayutham, E. (2020). Renewable and non-renewable energy consumption-economic growth nexus: New evidence from South Asia. Renew. Energy 147, 399–408. doi:10.1016/j.renene.2019.09.007
Razzaq, N., Muhammad, F., Karim, R., Tariq, M., and Muhammad, K. (2021). The nexus between energy, environment and growth: Evidence from Latin-American countries. Int. J. Energy Econ. Policy 11, 82–87. doi:10.32479/ijeep.9933
Saboori, B., Rasoulinezhad, E., and Sung, J. (2017). The nexus of oil consumption, CO2 emissions and economic growth in China, Japan and South Korea. Environ. Sci. Pollut. Res. 24, 7436–7455. doi:10.1007/s11356-017-8428-4
Shahbaz, M., Raghutla, C., Chittedi, K. R., Jiao, Z., and Vo, X. V. (2020). The effect of renewable energy consumption on economic growth: Evidence from the renewable energy country attractive index. Energy 207, 118162. doi:10.1016/j.energy.2020.118162
Shahbaz, M., Zakaria, M., Shahzad, S. J. H., and Mahalik, M. K. (2018). The energy consumption and economic growth nexus in top ten energy-consuming countries: Fresh evidence from using the quantile-on-quantile approach. Energy Econ. 71, 282–301. doi:10.1016/j.eneco.2018.02.023
Shahzadi, I., Yaseen, M. R., Iqbal Khan, M. T., Amjad Makhdum, M. S., and Ali, Q. (2022). The nexus between research and development, renewable energy and environmental quality: Evidence from developed and developing countries. Renew. Energy 190, 1089–1099. doi:10.1016/j.renene.2021.10.050
Shirizadeh, B., and Quirion, P. (2022). The importance of renewable gas in achieving carbon-neutrality: Insights from an energy system optimization model. Energy 255, 124503. doi:10.1016/j.energy.2022.124503
Sikder, M., Wang, C., Yao, X., Huai, X., Wu, L., and KwameYeboah, F. (2022). The integrated impact of GDP growth, industrialization, energy use, and urbanization on CO2 emissions in developing countries: Evidence from the panel ARDL approach. Sci. Total Environ. 837, 155795. doi:10.1016/j.scitotenv.2022.155795
Simionescu, M., Bilan, Y., Krajňáková, E., Streimikiene, D., and Gędek, S. (2019). Renewable energy in the electricity sector and GDP per capita in the European union. Energies 12, 2520. doi:10.3390/en12132520
Simoes, S. G., Amorim, F., Siggini, G., Sessa, V., Saint-Drenan, Y.-M., and Carvalho, S. (2021). Climate proofing the renewable electricity deployment in Europe - introducing climate variability in large energy systems models. Energy Strategy Rev. 35, 100657. doi:10.1016/j.esr.2021.100657
Soava, G., Mehedintu, A., Sterpu, M., and Raduteanu, M. (2018). Impact of renewable energy consumption on economic growth: Evidence from European Union countries. Technol. Econ. Dev. Econ. 24, 914–932. doi:10.3846/tede.2018.1426
Sohag, K., Taşkın, F. D., and Malik, M. N. (2019). Green economic growth, cleaner energy and militarization: Evidence from Turkey. Resour. Policy 63, 101407. doi:10.1016/j.resourpol.2019.101407
Stewart, G. W. (1993). On the early history of the singular value decomposition. SIAM Rev. Soc. Ind. Appl. Math. 35, 551–566. doi:10.1137/1035134
Stone, C. J. (1986). The dimensionality reduction principle for generalized additive models. Ann. Stat. 14, 590–606. doi:10.1214/aos/1176349940
Su, M., Wang, Q., Li, R., and Wang, L. (2022). Per capita renewable energy consumption in 116 countries: The effects of urbanization, industrialization, GDP, aging, and trade openness. Energy 254, 124289. doi:10.1016/j.energy.2022.124289
Tang, C. F., Tan, B. W., and Ozturk, I. (2016). Energy consumption and economic growth in Vietnam. Renew. Sustain. Energy Rev. 54, 1506–1514. doi:10.1016/j.rser.2015.10.083
Tian, J., Liu, Y., Zheng, W., and Yin, L. (2022). Smog prediction based on the deep belief - BP neural network model (DBN-BP). Urban Clim. 41, 101078. doi:10.1016/j.uclim.2021.101078
Topcu, E., Altinoz, B., and Aslan, A. (2020). Global evidence from the link between economic growth, natural resources, energy consumption, and gross capital formation. Resour. Policy 66, 101622. doi:10.1016/j.resourpol.2020.101622
Tudor, C., and Sova, R. (2021). On the impact of GDP per capita, carbon intensity and innovation for renewable energy consumption: Worldwide evidence. Energies 14, 6254. doi:10.3390/en14196254
Tutak, M., and Brodny, J. (2022). Renewable energy consumption in economic sectors in the EU-27. The impact on economics, environment and conventional energy sources. A 20-year perspective. J. Clean. Prod. 345, 131076. doi:10.1016/j.jclepro.2022.131076
Umar, M., Khan, S. A. R., Zia-ul-haq, H., Yusliza, M., and Farooq, K. (2021). The role of emerging technologies in implementing green practices to achieve sustainable operations. TQM J. ahead-of-print 34, 232–249. doi:10.1108/TQM-06-2021-0172
Ummalla, M., and Samal, A. (2019). The impact of natural gas and renewable energy consumption on CO2 emissions and economic growth in two major emerging market economies. Environ. Sci. Pollut. Res. 26, 20893–20907. doi:10.1007/s11356-019-05388-4
Ur Rehman, S. A., Cai, Y., Mirjat, N. H., Walasai, G. D., and Nafees, M. (2019). Energy-environment-economy nexus in Pakistan: Lessons from a PAK-TIMES model. Energy Policy 126, 200–211. doi:10.1016/j.enpol.2018.10.031
Wang, B., Mi, Z., Nistor, I., and Yuan, X.-C. (2018). How does hydrogen-based renewable energy change with economic development? Empirical evidence from 32 countries. Int. J. Hydrogen Energy 43, 11629–11638. doi:10.1016/j.ijhydene.2017.03.059
Wang, X., Wei, Y., and Shao, Q. (2020). Decomposing the decoupling of CO2 emissions and economic growth in China’s iron and steel industry. Resour. Conservation Recycl. 152, 104509. doi:10.1016/j.resconrec.2019.104509
Welegedara, N. P. Y., Agrawal, S. K., Gajjar, S., and Joshi, N. (2021). Variations in direct greenhouse gas emissions across neighbourhoods: A case of edmonton in Canada. Environ. Challenges 5, 100312. doi:10.1016/j.envc.2021.100312
Xie, L., Mu, X., Lu, K., Hu, D., and Hu, G. (2022). The time-varying relationship between CO2 emissions, heterogeneous energy consumption, and economic growth in China. Environ. Dev. Sustain. doi:10.1007/s10668-022-02371-x
Yasmeen, R., Tao, R., Jie, W., Padda, I. U. H., and Shah, W. U. H. (2022). The repercussions of business cycles on renewable & non-renewable energy consumption structure: Evidence from OECD countries. Renew. Energy 190, 572–583. doi:10.1016/j.renene.2022.03.138
Zaidan, E., Abulibdeh, A., Alban, A., and Jabbar, R. (2022). Motivation, preference, socioeconomic, and building features: New paradigm of analyzing electricity consumption in residential buildings. Build. Environ. 219, 109177. doi:10.1016/j.buildenv.2022.109177
Zhang, C., Liu, C., Zhang, X., and Almpanidis, G. (2017). An up-to-date comparison of state-of-the-art classification algorithms. Expert Syst. Appl. 82, 128–150. doi:10.1016/j.eswa.2017.04.003
Zhang, D., Mohsin, M., and Taghizadeh-Hesary, F. (2022). Does green finance counteract the climate change mitigation: Asymmetric effect of renewable energy investment and R&D. Energy Econ. 113, 106183. doi:10.1016/j.eneco.2022.106183
Zhang, H., Qiu, D., Wu, R., Deng, Y., Ji, D., and Li, T. (2019). Novel framework for image attribute annotation with gene selection XGBoost algorithm and relative attribute model. Appl. Soft Comput. 80, 57–79. doi:10.1016/j.asoc.2019.03.017
Zhang, J., Alharthi, M., Abbas, Q., Li, W., Mohsin, M., and Jamal, K. (2020). Reassessing the environmental kuznets curve in relation to energy efficiency and economic growth. Sustainability 12, 8346. doi:10.3390/su12208346
Zheng, S., He, C., Hsu, S.-C., Sarkis, J., and Chen, J.-H. (2020). Corporate environmental performance prediction in China: An empirical study of energy service companies. J. Clean. Prod. 266, 121395. doi:10.1016/j.jclepro.2020.121395
Keywords: renewable energy, environmental pollution, sustainable development, BRICS, G7, EU
Citation: Cristea DS, Zamfir CG, Simionov IA, Fortea C, Ionescu RV, Zlati ML, Antohi VM, Munteanu D and Petrea SM (2022) Renewable energy strategy analysis in relation to environmental pollution for BRICS, G7, and EU countries by using a machine learning framework and panel data analysis. Front. Environ. Sci. 10:1005806. doi: 10.3389/fenvs.2022.1005806
Received: 28 July 2022; Accepted: 30 November 2022;
Published: 14 December 2022.
Edited by:
Faik Bilgili, Erciyes University, TurkeyReviewed by:
Muhammad Umar, University of Malaysia Terengganu, MalaysiaZhang Yu, Chang’an University, China
Sevda Kuskaya, Erciyes University, Turkey
Copyright © 2022 Cristea, Zamfir, Simionov, Fortea, Ionescu, Zlati, Antohi, Munteanu and Petrea. This is an open-access article distributed under the terms of the Creative Commons Attribution License (CC BY). The use, distribution or reproduction in other forums is permitted, provided the original author(s) and the copyright owner(s) are credited and that the original publication in this journal is cited, in accordance with accepted academic practice. No use, distribution or reproduction is permitted which does not comply with these terms.
*Correspondence: S. M. Petrea, c3RlZmFuLnBldHJlYUB1Z2FsLnJv