 Jingjie Li
 Shanwei Li
 Qian Liu
 Junli Ding
94% of researchers rate our articles as excellent or good
Learn more about the work of our research integrity team to safeguard the quality of each article we publish.
Find out more
ORIGINAL RESEARCH article
Front. Environ. Sci., 04 November 2022
Sec. Environmental Economics and Management
Volume 10 - 2022 | https://doi.org/10.3389/fenvs.2022.1005251
Based on the classic IPCC carbon emission calculation theory, this paper calculates the agricultural carbon emissions intensity and efficiency in Zhejiang Province from 2011 to 2020. The LMDI model is further adapted to carry out the influence factors of agricultural carbon emissions. In addition, the grey prediction model GM (1, 1) is used to predict the carbon emissions of Zhejiang Province from 2022 to 2025. The results show that the agricultural carbon emissions and carbon emission intensity in Zhejiang Province have a downward trend. Further, it is concluded that Shaoxing, Hangzhou, Jiaxing, and Huzhou are the cities with low emission and high efficiency, and Wenzhou is the city with high emission and low efficiency. Meanwhile, the improvement of Total Factor Productivity (TFP) results from the joint action of Technical Progress Efficiency (TECH) and Technical Efficiency (EFF). TECH is greater than EFF, and Scale Efficiency (SE) and Pure Technical Efficiency (PTE) contributions change with the years. In general, the contribution of PTE is more significant than that of SE, and its improvement mainly rests on technical progress. Among the factors influencing agricultural carbon emission efficiency, agricultural carbon emission intensity and labor force size have inhibiting effects on agricultural carbon emission efficiency growth. In contrast, agricultural industrial structure, economic development, and urbanization positively affect agricultural carbon emission efficiency. The prediction results show that the overall carbon emissions of Zhejiang Province will get a downward trend. Finally, based on these findings, we offer policy implications.
In recent years, global warming has led to a series of problems, such as rising sea levels, a frequent increase in flood disasters, infectious diseases, and the destruction of biodiversity, which threaten global agricultural production. At the same time, China’s population base continues to increase, and agricultural land is gradually reduced. In order to meet the growing needs of people, a large number of agricultural materials such as pesticides, agricultural films, and fertilizers are put into agricultural production. However, the excessive pursuit of high yield leads to the abuse of agricultural materials, damages the agricultural ecosystem, and produces more greenhouse gases. Agricultural production has become the second-largest carbon source of greenhouse gases. In September 2020, the Chinese government set the goal of “Peak Carbon Dioxide Emissions” by 2030. Under the future’s enormous carbon emission reduction task, agriculture, as one of the primary sources of carbon emissions, has both the dual properties of carbon sink and carbon source. There is a perfect space for emission reduction. Therefore, implementing reduced carbon agriculture is an inevitable trend for China to attain the “Peak Carbon Dioxide Emissions” goal of overall emission reduction. Zhejiang, known as “Seven mountains, two rivers, and one separate farmland,” belongs to the lower reaches of the Yangtze River Economic Belt and is the core area of the Yangtze River Economic Belt, as well as the country’s important “breadbasket,” ecological support and economic pillar. Zhejiang has more people, less land, and insufficient agricultural resource endowment, making agricultural production more dependent on chemical fertilizers, pesticides, and other agricultural materials. At the same time, Zhejiang, the only pilot province of modern ecological circular agriculture development in China, has put forward the development strategy of “Efficient Ecological Agriculture” and actively explored low-carbon agriculture. Therefore, it is of great significance to analyze and study the current situation of agricultural carbon reduction in Zhejiang Province.
Scholars from various countries have conducted in-depth studies on agricultural carbon emissions to develop a low-carbon economy. The relevant studies mainly focus on carbon emission accounting, carbon emission efficiency evaluation, and carbon emission impact factors. From carbon emission accounting, the current carbon emission measurement methods mainly include the life cycle method (Pehnt et al., 2008; Mattila et al., 2010; Berthoud et al., 2011; Turconi et al., 2014; Zhang & Li, 2022), input-output analysis method (Wiedmann et al., 2009; Davis & Caldeira, 2010; Huang & Mi, 2011; Su and Ang, 2014; Li et al., 2020), and IPCC inventory method (West & Marland, 2002; Jane et al., 2007; Tubiello et al., 2013; Goglio et al., 2017; Liu & Liu, 2022). The life-cycle approach calculates carbon emissions through carbon emission intensity and emission factors of all activities and substances in the life-cycle, which is exhaustive and global. However, the life cycle approach is subjective in defining the system boundaries and involves the entire life cycle of the system requiring massive data, which is prone to omissions (Lin et al., 2022). The input-output method is based on energy demand at each stage and extrapolates GHG emissions through energy emission factors, highlighting the holistic nature of measuring carbon emissions. However, this method is limited to measuring carbon emissions from energy consumption during agricultural production. The input-output table in China is updated every 5 years, which cannot accurately measure agricultural carbon emissions (Lin et al., 2022). The IPCC National GHG Inventory published by IPCC is the most widely accepted and applied guideline for national GHG emission inventory so far, including GHG emission sources and emission factors. According to the emission factor method provided in the guidelines, the IPCC inventory method combines the information on the degree of human activities with quantifying emissions per unit activity. It is the most widely used method to calculate greenhouse gas emissions.
From the perspective of carbon emission efficiency evaluation, combing the existing research shows that improving the carbon emission efficiency of agriculture is an effective way to reduce agricultural carbon emissions and a meaningful way to achieve China’s “Peak Carbon Dioxide Emissions” goal. Agricultural carbon efficiency refers to agricultural productivity under the carbon emission constraint. Agricultural carbon emissions are considered non-desired output to reflect the relationship between inputs and outputs of agricultural production activities under the non-desired output condition. Scholars usually use data envelopment analysis (DEA) to calculate agricultural carbon emission efficiency, which is applicable to multi-input and multi-output boundary production functions. However, the traditional DEA can only solve the static efficiency problem. In order to study the dynamic evolution of agricultural carbon emissions, the nuclear density method and malmquist index method are widely used. (Wu et al., 2014; Gao, 2015; Liu, 2015; Li, 2017; Tian & Zhang, 2017; Zhang et al., 2022a; Zhang et al., 2022b; Shang et al., 2022). For example, Wu et al. (2014) constructed a DEA-Malmquist index decomposition model containing desired and non-desired outputs to measure the changes in agricultural carbon emission efficiency in 31 provinces (cities and districts) in China. Gao (2015) used the DEA-Malmquist index method to analyze agricultural all-production factors in 31 provinces in China. The results showed that human capital, irrigated area, and agricultural fiscal expenditure promote agricultural all-production factors, while agricultural output value and grain sown area have a suppressive effect. Tian and Wang (2020) measured the carbon emission efficiency of agriculture in Hubei province using the DEA-Malmquist index decomposition method, analyzed the characteristics of its spatial and temporal differences, and found that its carbon emission efficiency showed an overall increasing trend. However, with the year-to-year changes, the carbon emission efficiency of each city and state had a large gap. Zhang et al. (2022) used the inter-provincial agricultural industry panel data from 2001 to 2017 and the three-stage measurement data based on relaxation degree to select the SBM-DEA model and Malmquist Luenberger index model to measure agricultural carbon emissions.
From the perspective of influencing factors of carbon emissions, some scholars use the Tobit model (Tian and Wang, 2020), spatial panel regression model (Zhou et al., 2022), Kaya identity deformation (Li et al., 2011), and spatial econometric model (Yang et al., 2021; Ma et al., 2022a; Ma et al., 2022b) to analyze the influencing factors of agricultural carbon emissions. However, more and more scholars decompose and study the influencing factors of carbon emissions through the LMDI decomposition method. The index decomposition method can quantitatively analyze the contribution rate of each influencing factor when the total index changes through the decomposition of factors. LMDI decomposition model is a branch of the IDA model, which is more suitable for data with few variables and time series characteristics. Compared with IDA, this model does not need to rely on the data in the input-output table. For example, He et al. (2018) used the LMDI method to analyze the influencing factors of agricultural carbon emissions in Lanzhou. The results showed that agricultural economic development positively affected the increase of carbon emissions, which was the critical factor leading to increased agricultural carbon emissions. In contrast, agricultural carbon emission intensity and industrial structure harmed the increase of carbon emissions. Hu et al. (2020) used the LMDI method to analyze the influencing factors of agricultural carbon emissions in 31 provinces of China from 1997 to 2017. The results show that production efficiency, agriculture, industrial structure, and rural population are three emission reduction factors for Eastern China. Three emission increase factors are industrial structure, regional economic development, and urbanization. For central and Western China, agricultural production efficiency and rural population are two emission reduction factors, while agricultural, industrial structure, industrial structure, regional economic development level, and urbanization are four emission increase factors.
Through the review of the above relevant literature, it is found that, in terms of content, the existing researches mainly focus on carbon emission efficiency at the national level. Most of them take 31 provinces and regions as the investigation object. At the same time, few scholars discuss the agricultural carbon emission efficiency of Zhejiang Province and its cities. In terms of methods, the IPCC inventory method, DEA method, and LMDI decomposition method are widely used by scholars, but these methods are often applied independently in relevant studies. However, relatively little literature combines the IPCC inventory method, DEA Malmquist, LMDI decomposition method, and grey prediction model GM (1,1). To make a comprehensive study from the perspectives of total agricultural carbon emissions, emission intensity, carbon emission efficiency, influencing factors and prediction. Based on this, this study aims to use appropriate methods to answer the following questions:
(Q1)What is the current trend of agricultural carbon emissions and carbon intensity in Zhejiang Province and its cities?
(Q2)What are the temporal and spatial efficiency of agricultural carbon emissions in Zhejiang Province and its municipalities? What is the relationship between carbon emission and efficiency?
(Q3)What are the inhibiting and driving factors affecting agricultural carbon emissions in Zhejiang Province?
(Q4)What predictions of agricultural carbon emission values and carbon peaking in Zhejiang Province and its cities in the next 20 years?
Firstly, this paper measures agricultural carbon emissions from the perspective of carbon sources and analyzes the current situation of agricultural carbon emissions in Zhejiang Province. Then DEA Malmquist model is used to measure the efficiency of agricultural carbon emissions, and its temporal and spatial differences are analyzed. Next, the LMDI index decomposition model is used to establish the influencing factor system of agricultural carbon emission efficiency and explore the key to affecting carbon emission efficiency. Finally, the future agricultural carbon emissions of Zhejiang Province and its cities are predicted and analyzed. To provide theoretical reference for promoting the development of low-carbon agriculture and accelerating the realization of agricultural emission reduction and efficiency by region and category in Zhejiang Province, China. The remainder of this paper is structured as follows: Section 2 introduces the study method and data. The third section presents the empirical study of agricultural carbon emissions in Zhejiang Province. The final section draws together the conclusions and policy implications.
The contributions of this study to the existing literature include: 1) As the core region of the Yangtze River Economic Belt and the only pilot province for developing modern ecological circular agriculture in China, Zhejiang’s agricultural carbon emissions deserve special attention. The investigation of existing research shows that the relevant research in this area is still in a blank stage, so this paper has solid practical significance from the research content. 2) This paper takes all 11 cities in Zhejiang Province as the research object. Compared with the general provincial research, the research on spatial resource differences between cities can better reflect the spatial pattern of agricultural carbon emission efficiency in the extended region. At the same time, the research period of the paper is just in the construction period of China’s “12th Five Year Plan” and “13th Five Year Plan”, which makes the research conclusions and suggestions more accurate and persuasive. 3) The known research is often only carried out regarding efficiency and influencing factors. This paper analyzes the static efficiency, dynamic efficiency, spatio-temporal evolution process and characteristics, influencing factors, prediction, and other aspects. The research content is more extensive, making the conclusion more targeted.
The IPCC inventory method determines the carbon emission factor coefficients for accounting according to the national greenhouse gas inventory provisions and different carbon emission sources. Agricultural carbon emissions mainly include 1) carbon emissions from the use of chemical fertilizers, pesticides, and agricultural films; 2) Using agricultural machinery to produce and consume fossil fuels directly or indirectly; 3) Farmland tillage destroys the organic carbon pool of the soil, resulting in a large amount of organic carbon loss into the air, resulting in carbon emissions 4) Carbon emissions generated by the indirect consumption of fossil fuels by the use of electric energy during irrigation. This paper accounts for agricultural carbon emissions in Zhejiang Province based on the emission indicators and calculation methods released by IPCC.
Carbon emissions are calculated as:
The formula is the total amount of agricultural carbon emission, the carbon emission from carbon sources, the amount of each carbon emission source, and the carbon emission coefficient of each carbon emission source; the agricultural carbon emission coefficients are shown in Table 1.
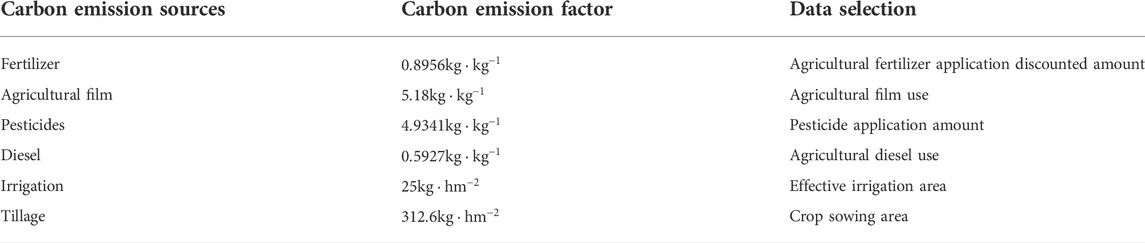
TABLE 1. Agricultural carbon emission source factor.
Data sources: Oak Ridge National Laboratory, United States; Institute of Agricultural Resources and Eco-Environment, Nanjing Agricultural University; College of Biology and Technology, China Agricultural University; And Joint Intergovernmental Panel on Climate Change.
Carbon emission intensity indicates the carbon emission generated per unit of output value and based on the above formula (2.1), the formula for calculating carbon emission intensity can be obtained as follows:
In the formula, E is the agricultural carbon emission intensity, and A is the gross agricultural output.
DEA model is used to evaluate the relative effectiveness of each decision-making unit, which is suitable for the efficiency evaluation of multi-input and multi-output decision-making units (DMU) (Luo, 2015). The traditional DEA model measures the static relative efficiency of DMUs in the same period, that is, the change of comprehensive technical efficiency, and does not apply to agricultural carbon emissions, including unintended outputs. The Malmquist index model is the dynamic efficiency analysis of the data of each DMU in different periods, including the complete technical efficiency change and technological progress index. Suppose there are n DMUs; each DMU inputs m kinds in period t and obtains s kinds of outputs.
Then the input index value of DMUi in period t is expressed as:
The expected output index value of DMUi in period t is expressed as:
Then the value of the non-desired output index for DMUi in period t is expressed as:
In the above formula,
Let the distance function of
Under the condition of the t period, the change value of technical efficiency from t period to the t+1 period is expressed as:
Under the condition of the t+1 stage, the change value of technical efficiency from t period to the t+1 period is expressed as:
The productivity change value from t period to t+1 period is expressed as:
Let the change in the efficiency of agricultural carbon emissions from period t to period t+1 be denoted by TFP, which is decomposed into EFF and TECH, and technical efficiency can be further decomposed into SE and PTE, where
Then, if TFP>1, the efficiency of agricultural carbon emission increases; if TFP = 1, the efficiency of agricultural carbon emission remains unchanged; if TFP<1, the efficiency of agricultural carbon emission decreases. Moreover, if EFF>1, technical efficiency increases; if EFF = 1, technical efficiency remains unchanged; if EFF<1, technical efficiency decreases. If TECH>1, technology improves; if TECH = 1, technology remains unchanged; if TECH<1, the technology deteriorates.
The LMDI exponential decomposition model quantifies the contribution of each influencing factor by decomposing the changes of each factor in the total index. The LMDI model can effectively solve the residuals caused by the traditional linear regression model (Ma and Shao, 2022). In this paper, the influencing factors of agricultural carbon emissions are decomposed into five factors: agricultural carbon emission intensity, agricultural, industrial structure, economic development level, urbanization level, and labor force scale, and the influence degree of each factor on agricultural carbon emissions in Zhejiang Province is analyzed. Expressed by the formula:
Among them,
In the formula, C is the agricultural carbon emission. AGDP is the total agricultural output value. BGDP is the total output value of agriculture, forestry, animal husbandry, and fishery. AP is the total population. p is the number of the agricultural population. EI is the intensity of agricultural carbon emissions, the carbon emissions per unit of agricultural output value. Ci refers to the agricultural, industrial structure, that is, the proportion of agricultural output value in the output value of agriculture, forestry, animal husbandry, and fishery. AI is the level of agricultural economic development, that is, per capita agricultural output value. Si is the urbanization level, the ratio of the total population to the agricultural population.
The results are consistent, and the LMDI model can adopt both “product decomposition” and “additive decomposition” models. The above formula is expressed as an additive decomposition model; let
The contribution values of influencing factors for each decomposition are:
Grey prediction model GM (1,1) is a prediction method that builds a mathematical model for the system with uncertain factors through a small amount of incomplete information. Based on the known development law of objective things, it describes and analyzes the future trend with the help of scientific methods. Grey prediction establishes correlation analysis through the system and processes original data to generate data with solid regularity, and then establishes differential equations to solve it (Liu et al., 2012). The specific steps are as follows:
Set the original series
If the rank ratios of the original data all fall in the interval
Establish the differential equation:
Using the least square method to solve a and b, get
Substituting the parameters, a and b, get
Then the predicted value is
According to the previous data analysis and the combing of relevant domestic and foreign literature, the agricultural material inputs and land irrigation and farmland tillage in agricultural production in Zhejiang Province were firstly used as the primary agricultural carbon emission sources to measure carbon emissions (Liu, 2014); regarding the selection of input indicators of DEA-Malmquist model, agricultural labor, total power of agricultural machinery and land tillage were recognized by more scholars (Wu et al., 2014; Tian and Wang 2020); Wang et al. (2016) also took the discounted amount of agricultural fertilizer application as an input indicator; for output indicators, the total agricultural output value is usually taken as the desired output, while agricultural carbon emissions are regarded as undesired output (Li et al., 2011; Zhou et al., 2022); and then the LMDI index decomposition model is used to construct the agricultural carbon emission influence factor system, which decomposes the influence factors into agricultural carbon emission intensity, economic development level, agricultural industrial structure, urbanization level and labor force size, in order to explore the key factors affecting carbon emission efficiency.
This paper selects the relevant data of Zhejiang Province from 2011 to 2020 as the sample. The data involved are from the National Bureau of Statistics of China, the Statistical Yearbook of Zhejiang Province, and the Statistical yearbook of Zhejiang cities.
According to the data of various indicators in Zhejiang province from 2011 to 2020 and the agricultural carbon emission accounting formula (1), the carbon emissions and annual growth rate of Zhejiang province in past years are calculated, as shown in Table 2:
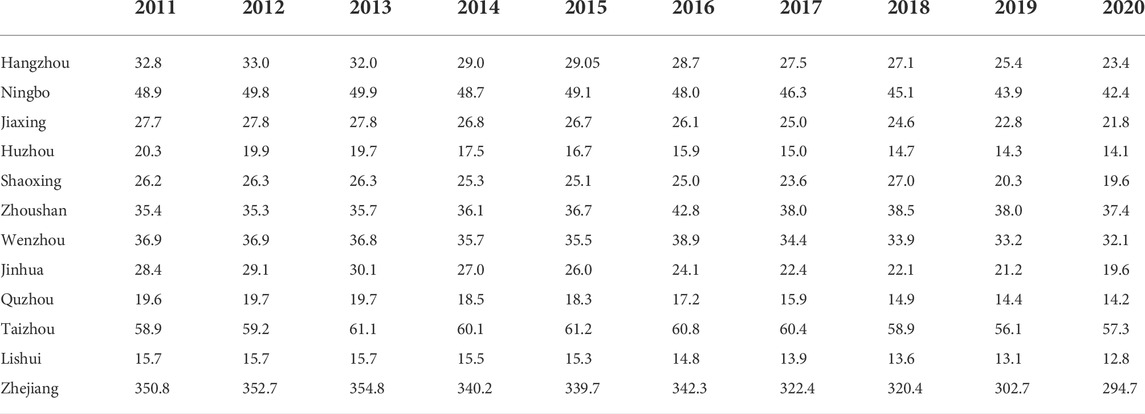
TABLE 2. Agricultural carbon emissions in 2011–2020 of Zhejiang province and its cities (unit: million tons).
From Table 2, we can see that the carbon emission from agriculture in Zhejiang Province was 3.508 million tons in 2011, which will be reduced to 2.497 million tons in 2020, with a reduced rate of 15.99%; the average annual carbon emission reduction rate from 2011 to 2020 is 1.88%. The carbon emissions of each city in Zhejiang Province show a fluctuating downward trend, and the total carbon emissions of Taizhou City, Ningbo City, and Zhoushan City are relatively high.
The carbon emission per unit agricultural output value is called agricultural carbon emission intensity, which reflects the relationship between economic development and agricultural carbon emission in Zhejiang Province. According to the calculated agricultural carbon emissions and the total agricultural output value of each city in Zhejiang province from 2011 to 2020, the intensity of agricultural carbon emissions in Zhejiang Province from 2011 to 2020 is obtained. The trend of agricultural carbon emission intensity in Zhejiang Province from 2011 to 2020 is drawn, as shown in Figure 1.
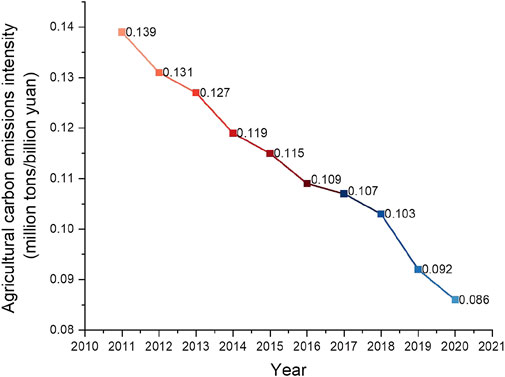
FIGURE 1. The 2011–2020 in Zhejiang province agricultural carbon intensity (unit: million tons/billion yuan).
As can be seen from Figure 1, agricultural carbon emission intensity in Zhejiang province presents a trend of continuous decline. According to the statistical yearbook data, the total agricultural output value of Zhejiang province shows an increasing trend year by year, which indicates that the agricultural carbon emission reduction effect of Zhejiang province has been significant in recent years. Further, analyze the spatial difference of agricultural carbon emission intensity, and draw the annual mean value of agricultural carbon emission intensity of cities in Zhejiang province from 2011 to 2020, as shown in Figure 2.
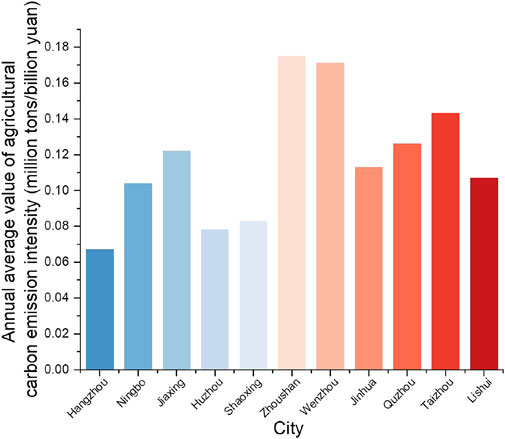
FIGURE 2. Annual mean value of agricultural carbon emission intensity of cities in Zhejiang Province from 2011 to 2020.
It can be seen from Figure 2 that the annual mean value of agricultural carbon emission intensity varies greatly among cities. Zhoushan city has the highest annual mean of agricultural carbon emission intensity, which is 0.175 million tons/billion yuan. Since the agricultural population in Zhoushan accounts for a minor proportion of Zhejiang Province, the average use of agricultural diesel is relatively high, which leads to the high agricultural carbon emission intensity in Zhoushan, which is consistent with the findings of Sun et al. (2018) in their analysis of carbon emission measurement in Zhoushan City. Hangzhou has the lowest agricultural carbon emission intensity, with an annual average of 0.067 million tons/billion yuan. As the capital city of Zhejiang Province, Hangzhou has developed rapidly in the process of modernization, and the total agricultural output value has increased significantly. In addition, as a pilot city for the development of modern ecological and circular agriculture, Hangzhou has achieved remarkable results in carbon emission reduction measures, and agricultural carbon emissions decrease yearly. Therefore, with economic growth, agricultural carbon emission intensity in Hangzhou is relatively low, forming an excellent low-carbon development model, which is consistent with the findings of Cheng et al. (2022) on the carbon emission efficiency study in Zhejiang Province from 2010 to 2019.
According to the agricultural carbon emission and index data of Zhejiang province from 2011 to 2020, the agricultural carbon emission efficiency of Zhejiang Province and each city from 2011 to 2020 is calculated using the DEA model. Considering the space, referring to Tian and Chan (2021) andWu et al. (2021), the paper extracts 4 years of (2011, 2014, 2017, 2020) data with meantime during the 10-year research period and uses ArcGIS10.7 software for visualization. The result is shown in Figure 3.
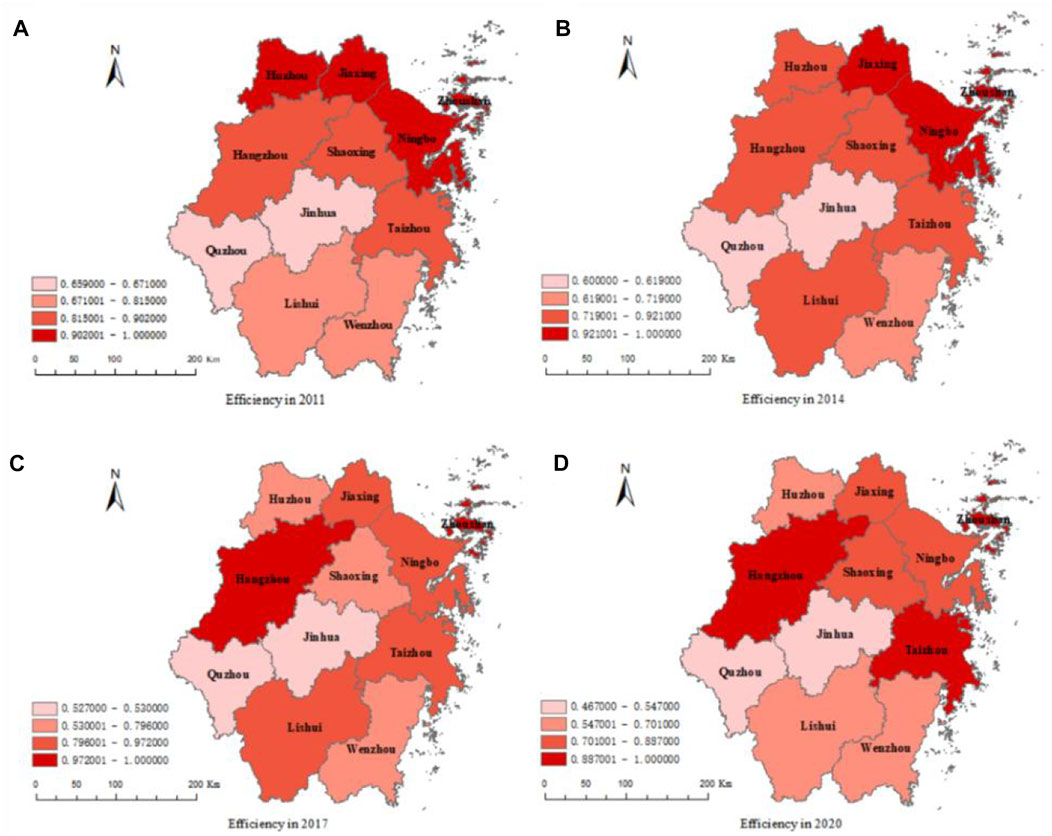
FIGURE 3. Visualization of agricultural carbon emission efficiency in Zhejiang Province and its cities. (A) 2011; (B) 2014; (C) 2017; (D) 2020.
As shown in Figure 3, the agricultural carbon emission efficiency of Zhejiang province is relatively high. However, there are still invalid emissions, indicating that agricultural carbon emission reduction still has ample space for emission reduction and excellent development potential. It is necessary to continue strengthening the control of agricultural carbon emission reduction and improving carbon emission efficiency. The efficiency of each city is dissimilar, which indicates that Zhejiang province should continue to promote its agricultural carbon emission reduction according to the geographical characteristics of each city and the characteristics of agricultural development. In specific cities, the carbon emission efficiency of Jinhua city and Quzhou City is relatively low. In increasing carbon emission reduction efforts in the future, attention should be paid to the rational allocation of agricultural production technology. The efficiency of Jiaxing, Ningbo, and Zhoushan cities is high in all years, indicating that their agricultural input factors and agricultural production technologies are reasonably distributed and highly utilized.
In order to explain the relationship between the efficiency and total amount of agricultural carbon emissions in various regions, these two indicators are expressed in the same coordinate axis. Take the average value of agricultural carbon emissions and efficiency in Zhejiang from 2011 to 2020 as the coordinate origin. Based on the dual dimensions of total agricultural carbon emissions and efficiency, cities are divided into four categories: high emission efficiency (quadrant I), high emission efficiency (quadrant II), low emission efficiency (quadrant III), and low emission efficiency (quadrant IV), as shown in Figure 4.
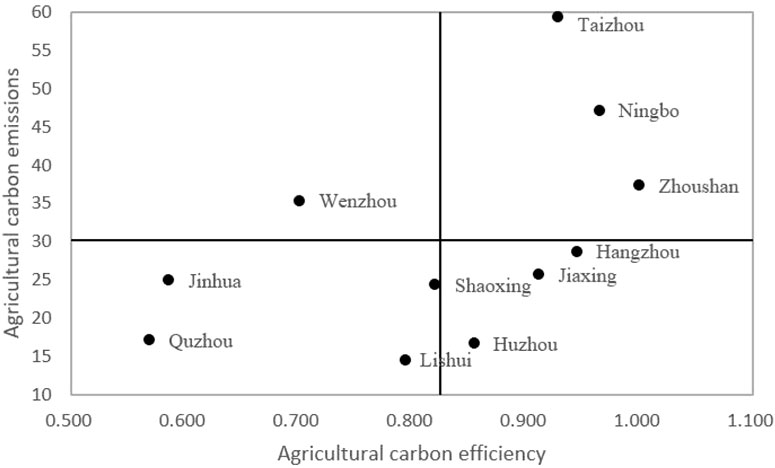
FIGURE 4. Agricultural carbon emission efficiency and agricultural carbon emission matrix in Zhejiang Province from 2011 to 2020.
In Figure 4, Taizhou, Ningbo, and Zhoushan belong to high-emission and high-efficiency areas with more agricultural carbon emissions. However, the improvement of agricultural technology production and the reasonable allocation of investment indicators in agricultural production makes the efficiency of agricultural carbon emissions very high. Such regions still need to strengthen the promotion of carbon emission reduction to avoid the efficiency reduction caused by their higher agricultural carbon emissions. Wenzhou is a high emission and low-efficiency area, its agricultural carbon emissions are high, but the carbon emission efficiency is low; this area should be a critical concern for agricultural carbon emission reduction. Jinhua, Quzhou, Lishui, and Shaoxing are low emission and low-efficiency areas. These cities’ carbon emissions are not high, but there are ineffective emissions. It must improve its input structure and agricultural production technology to improve agricultural carbon emissions’ efficiency. Hangzhou, Jiaxing, and Huzhou belong to the low-emission, high-efficiency zone, and these cities have a good performance in balancing agricultural carbon emission reduction and agricultural carbon emission efficiency. This is similar to the findings of Fang et al. (2022), who analyzed the agricultural carbon emissions in Zhejiang Province by city.
To better grasp the dynamic trend of agricultural carbon emission efficiency in Zhejiang Province, the total factor productivity and its decomposition index of agricultural carbon emission efficiency of 11 cities in Zhejiang Province from 2011 to 2020 are measured based on the Malmquist productivity index (Table 3 and Table 4).
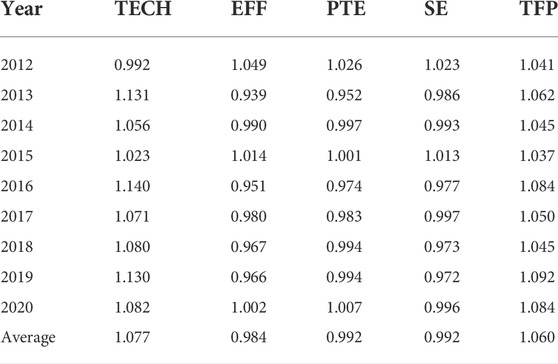
TABLE 3. Change of agricultural carbon emission efficiency in Zhejiang Province.
As can be seen from Table 3, agricultural carbon emission efficiency in Zhejiang Province showed an overall growth trend from 2011 to 2020, with an average annual growth rate of 6%. The improvement of TFP of agricultural carbon emissions mainly comes from Tech, and the annual contribution rate is 7.7%. The overall Eff is deteriorating, with an average annual decrease of 1.6%. When it is decomposed, both PTE and SE are in a deteriorating situation, with an average annual decrease of 0.8%. Each year, TFP is more significant than 1.0, indicating that all cities in Zhejiang province had an excellent agricultural carbon emission reduction development. The TFP is the highest in 2019, which is 1.092, indicating that the agricultural carbon emission efficiency of Zhejiang province in that year increased by 9.2% compared with 2018. The carbon emission efficiency of agriculture in 2015 is the lowest, at 1.037. Further analysis of its contribution rate shows that the improvement of TFP largely depends on TECH, and the loss caused by the deterioration of EFF is less than the contribution of TECH. Comprehensive, the TFP is the result of Tech and EFF. However, the contribution of TECH is slightly more significant than the contribution of EFF, decomposition of EFF, SE, and PTE changes along with the years, and the contribution of its contribution degree is not the same. However, the contribution of PTE is more significant than SE’s.
Table 4 shows the changes in TFP and decomposition efficiency of all cities in Zhejiang Province, from which it can be found that the average TFP of all cities in Zhejiang Province is more significant than 1.0. Taizhou has the highest value, reaching 1.105. From the basic agricultural situation of Taizhou, its agricultural output value proliferates and will reach its highest value in 2020, indicating that its agriculture is developing rapidly. This shows that Taizhou has made efforts to promote the integrated development of urban and rural areas, help modernize agriculture and rural areas, to attach importance to the revitalization of talents, and promote the green and low-carbon transformation of agriculture and rural areas during the study period. Overall, Taizhou’s green and low-carbon agricultural development measures have achieved remarkable results in carbon emission reduction with high efficiency. Jiaxing City is the lowest, 1.024. Compared with other cities in Zhejiang Province, Jiaxing’s land planting area accounts for the most significant proportion. However, the expected total agricultural output value is low, and its development is relatively slow compared with other cities, resulting in the low efficiency of agricultural carbon emissions. The TECH in each city is greater than 1, indicating that TECH has a significant positive effect on improving carbon emission efficiency. By decomposing the EFF of the above cities, PTE includes constant and deteriorating conditions, while SE includes improvement, constant and deteriorating conditions. The lower carbon emission efficiency regions lie in the deterioration of agricultural EFF. Although cutting-edge TECH is limited, the efficiency loss caused by the deterioration of EFF cannot be avoided. Overall, TECH plays a more prominent role in improving agricultural carbon emission efficiency in each city. EFF has a minor impact on it. The decomposition of EFF shows that the contribution of SE and PTE varies from region to region. However, the contribution of SE to agricultural carbon emission efficiency is more significant than that of PTE.
Refer to Li et al. (2011), He et al. (2018), and Hu et al. (2020). According to the calculated data of agricultural carbon emissions and each index in Zhejiang Province from 2011 to 2020, the decomposition results of the factors influencing agricultural carbon emissions in Zhejiang Province are calculated by applying the LMDI index decomposition model shown in Table 5.
From Table 5, among the factors affecting agricultural carbon emission efficiency in Zhejiang Province, the cumulative effect of agricultural carbon emission intensity is negative, indicating that this factor inhibits the growth of agricultural carbon emission efficiency in Zhejiang Province to a certain extent. Agricultural carbon emission intensity is the main factor restraining agricultural carbon emission efficiency, contributing significantly to carbon emission reduction. In addition, agricultural carbon emissions can reflect agricultural production efficiency to a certain extent. The lower the carbon emission intensity is, the higher the agricultural production efficiency is.
The factor of labor force size is another inhibiting factor of agricultural carbon emission efficiency in Zhejiang Province. Compared with the factor of agricultural carbon emission intensity, the factor of labor force size plays a minor role in agricultural carbon emission reduction. As shown by the data in the statistical yearbooks of each city, the labor force size in Zhejiang Province gradually decreases. However, the lack of agricultural resources endowment due to a large number of people and small land in Zhejiang Province may lead to a significant input of agricultural materials, increasing agricultural carbon emission. The size of the agricultural labor force in Zhejiang Province collectively inhibits the growth of agricultural carbon emission efficiency with other factors unchanged.
The cumulative effect of the agricultural industry structure factor is positive, and this factor promotes the growth of agricultural carbon emission efficiency in Zhejiang Province. There are differences in the characteristics of different industries, and their carbon emission levels are slightly different. The plantation industry has enough carbon sink functions (Wang et al., 2022). According to the analysis of the current situation of agricultural carbon emission in this paper, the plantation industry accounts for the most significant proportion of the agricultural industry structure of Zhejiang Province. The increase in the proportion of agricultural industry structure will increase the efficiency of agricultural carbon emissions in Zhejiang Province.
Economic development is the factor in promoting agricultural carbon emission efficiency in Zhejiang Province. Economic development factor reflects agricultural development level and farmers’ living standard to a certain extent, so it is an essential index of influencing factors of agricultural carbon emissions (Tian and Wang, 2020). In general, the higher the per capita income of farmers in regions with high economic development levels, the more capital will be invested in agriculture to promote agricultural production and improve the efficiency of agricultural carbon emissions.
The urbanization level also makes one of the influencing factors in promoting the efficiency of agricultural carbon emissions. With the advancement of urban industrialization, many rural populations flock to cities, increasing the proportion of the urban population in Zhejiang Province. This will significantly improve the population’s overall cultural quality and further promote modern agriculture’s development. With the deepening and improvement of the reform of China’s rural land circulation system, many people choose to transfer the land they cannot cultivate. This is conducive to the intensive management of land, mechanized farming, and the adjustment of crop planting structures. Then improve the efficiency of land output and improve the efficiency of agricultural carbon emissions.
In this part, a gray prediction model is used to calculate the agricultural carbon emissions in Zhejiang Province from 2011 to 2020. The original series is constructed to forecast the trend of agricultural carbon emissions in each city of Zhejiang Province from 2022 to 2025. Each city’s agricultural carbon emissions prediction model is obtained (Table 6).
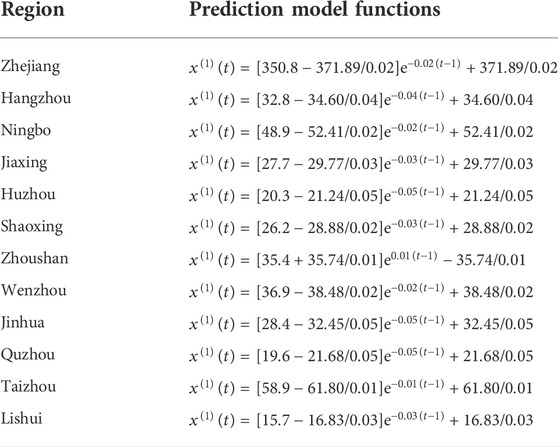
TABLE 6. Agricultural carbon emission prediction model.
Using the 2011–2020 agricultural carbon emissions of Zhejiang Province and each city as the original data, the gray prediction model GM (1, 1) is constructed to predict the agricultural carbon emissions from 2022 to 2025, as shown in Table 7.
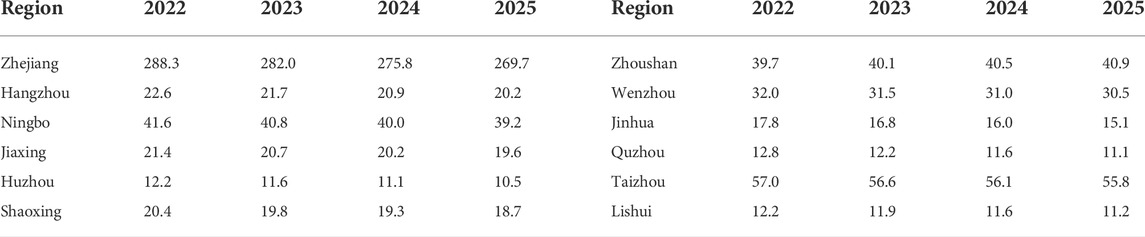
TABLE 7. Projected value of agricultural carbon emissions in zhejiang province (unit: ten thousand tons).
According to the prediction results, the overall agricultural carbon emissions in Zhejiang Province have continued to decline, indicating that the relevant measures formulated to control agricultural carbon emissions in Zhejiang Province have been significantly effective. However, the future agricultural carbon emissions in Zhoushan will continue to rise. Zhoushan City should strengthen government intervention, implement green agricultural development, formulate corresponding emission reduction measures according to the regional characteristics of Zhoushan City, and reach the peak of carbon emissions as soon as possible.
In order to verify the validity of the prediction model, the carbon emission data from 2012 to 2020 are predicted, and the error between the predicted value and the actual value is analyzed, as shown in Table 8 and Figure 5.
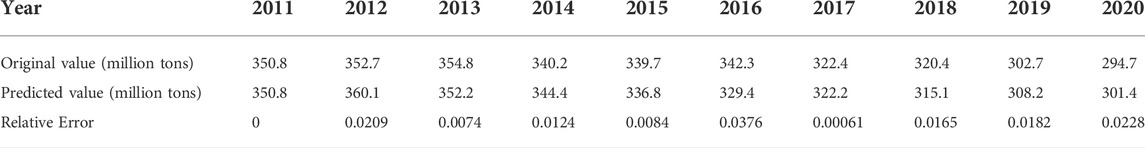
TABLE 8. Total agricultural carbon emissions and their relative errors 2011–2020.
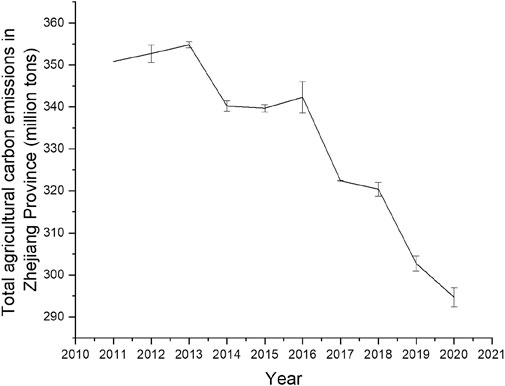
FIGURE 5. Total agricultural carbon emissions and their relative errors 2011–2020.
It can be seen from Table 8 and Figure 5 that the relative error between the actual value and predicted value in 2016 is the largest, which is 0.0376. However, this data is a small error value, so we can judge the prediction model is reasonable and adequate.
This paper analyzes the agricultural carbon emission efficiency and influencing factors in Zhejiang Province by measuring agricultural carbon emissions and using the DEA-Malmquist model, LMDI index decomposition model, and gray prediction GM (1, 1) model. It is found that the relevant measures in Zhejiang Province as a pilot construction of modern ecological recycling agriculture development have been effective, and the agricultural carbon emissions have been reduced year by year. The agricultural carbon emission efficiency trend in Zhejiang Province is increasing, and its improvement mainly comes from TECH. Further decomposition of EFF shows that the role of PTE is more evident than that of SE, and the difference in agricultural carbon emission efficiency among regions in Zhejiang Province is also apparent. The study on the relationship between agricultural carbon emission efficiency and the total amount of each city found that: Wenzhou is a high emission low-efficiency city; Jinhua, Quzhou, Shaoxing, and Lishui are low emission low-efficiency cities; Taizhou, Ningbo, and Zhoushan are high emission high-efficiency cities; Hangzhou, Jiaxing, and Huzhou are low emission high-efficiency cities. Among the influencing factors of agricultural carbon emission efficiency, agricultural carbon emission intensity and labor force scale have a restraining effect on the growth of agricultural carbon emission efficiency. Agricultural, industrial structure, economic development, and urbanization levels can promote the efficiency of agricultural carbon emissions. By predicting agricultural carbon emissions in Zhejiang Province and each city, it is known that Zhejiang cities’ overall agricultural carbon emissions continue to decline. However, the carbon emissions in Zhoushan City are on the rise, and corresponding carbon emission reduction measures need to be formulated according to the characteristics of Zhoushan City.
Despite some achievements, this study still has some limitations. In terms of research data, considering the availability of data, carbon emission sources such as animal husbandry and crop straw burning are not considered when calculating agricultural carbon emissions of Zhejiang cities. In terms of research content, due to the geographical characteristics of agricultural carbon emissions, administrative division as the research object cannot fully reflect the regional regularity of agricultural carbon emissions between cities. In future studies, data available from more dimensions will be considered, and geographical features will be used as the basis for dividing research objects to improve the accuracy and pertinence of the research.
Based on the above conclusions, this paper puts forward the following suggestions:
Focus on the key areas of agricultural emission reduction, and develop a bureau-wide agricultural emission reduction and efficiency program. Different urban areas have different responsibilities for agricultural production and should respect the geographical differentiation of agricultural carbon emission efficiency. For example, cities with high carbon emissions in Zhoushan, Taizhou, and Ningbo can accelerate the research and development of advanced agricultural machinery and equipment and develop smart agriculture. Cities in low emission and low-efficiency areas such as Jinhua, Quzhou, Lishui, and Shaoxing can develop high-quality agriculture. The government actively promoted new technologies integrating organic fertilizer and water fertilizer, improved the recycling and disposal mechanism of waste fertilizer and drug packaging and agricultural film, and reduced chemical fertilizer and agricultural film use. Further, promote its transformation into a high-efficiency zone. In addition, cities with a large share of agriculture involve many agricultural materials and energy use, which will inevitably produce higher carbon emissions. In contrast, the carbon emissions of vital non-agricultural areas such as Lishui and Quzhou are already low, so high-emission and low-efficiency zones are relatively ideal. Each region should consider the level of agricultural development and resource endowment. Learn from the program measures of progressive cities according to their positioning and development characteristics. Establish regional cooperation mechanisms and actively absorb the experience of agricultural industrialization and scale development in advanced regions through industrial docking, project cooperation, and technology exchange to promote their own agricultural green and high-quality development. For example, high emissions in low-efficiency cities can learn from the experience of high emissions in high-efficiency sample cities. Such as Ningbo and Taizhou, in developing low-carbon agriculture, strengthening the interaction and exchange of talents and technologies, and combining the current situation of their agricultural development to ensure rapid economic development while developing low-carbon agriculture.
Focus on the key factors influencing the efficiency of agricultural carbon emissions. Agricultural carbon emission efficiency is affected by several factors such as agricultural carbon emission intensity, industrial structure, economic development level, urbanization level, and labor force scale. Therefore, Zhejiang Province needs to deepen the structural reform on the supply side of agriculture. Accelerate the process of agricultural modernization while ensuring food security. Implementing the return of farmland to forest and enhancing the function of a forestry carbon sink; adjusting the planting ratio of food crops, economic crops, and fodder crops according to the actual situation of each region, and optimizing the structure of the planting industry; implementing the model of combining planting and breeding, and reasonably developing industries such as fishery and animal husbandry; making full use of the valuable resources in rural areas, carrying out the deep integration of agriculture, culture and tourism, accelerating the development of agricultural specialty industries, improving the quality of agricultural supply, and thus realizing the low-carbon development of agriculture. Moreover, it is necessary to strengthen local financial capacity building and solidify the economic basis for effectively solving agricultural carbon emissions. Also, the government needs to improve the supervision and management of the actual use of local government financial funds. Effectively guarantee the efficiency of the actual use of monetary funds. Increase the investment in increasing financial support for agriculture, and promote the prosperity of the rural economy. Implement good food production support policies and food security, strengthen quality construction and arable land protection, establish special trading channels for food, and promote the sustainable and rapid development of the agricultural economy. Also, the government needs to improve the efficiency of the use of surplus agricultural land in the process of urbanization and vigorously develop low-carbon agriculture. Such financial subsidies can guide farmers to reduce the consumption of high-energy-consuming agricultural production resources and improve the production efficiency of existing agriculture. To effectively distinguish between subsistence carbon emissions and non-subsistence carbon emissions in rural areas in the process of urbanization, gradually reduce subsistence carbon emissions in rural areas without affecting the production and livelihood of farmers. Control non-subsistence carbon emissions to a minimum to create conditions for solving the problem of agricultural carbon emissions.
Increase agricultural science and technology investment, and strengthen agricultural technology innovation. From the analysis of this paper, it can be seen that TECH has a great driving role in the efficiency of agricultural carbon emission in Zhejiang Province, and the progress of technology is quite conducive to improving the efficiency of agricultural production and the efficiency of agricultural carbon emission. Hence, Zhejiang Province should increase the investment in agricultural technology innovation, actively guide agricultural technology innovation, attach great importance to the role of financial policies, strengthen the actual effectiveness of agricultural subsidy policies, attach importance to the research and development of technologies that have an important supporting role in building modern agriculture, do a good job in the construction of agricultural research infrastructure, the research and development and application of new technologies and the purchase of related equipment and other security work, and support the development of leading agricultural enterprises, agricultural industry associations and farmers’ professional cooperatives and other social forces in agricultural science and technology innovation (Zhang et al., 2012); Increase investment in agricultural science and technology promotion, raise farmers’ awareness of low-carbon production, make low-carbon production and low-carbon living a consensus among farmers, guide farmers to consciously and actively adopt advanced agricultural science and technology, use chemical fertilizers, pesticides and agricultural films scientifically and reasonably, reduce the use of high-energy and low-efficiency agricultural machinery in the agricultural production process, and make every effort to reduce carbon emissions in the agricultural production process; Invest more in the construction of agricultural science and technology teams, effectively strengthen the training of high-level agricultural science and technology managers and the introduction of high-level, highly educated agricultural science and technology personnel, establish a sound mechanism for the training and introduction of agricultural personnel, organize training for agricultural instructors, responsible agricultural technicians and social agricultural support extension personnel in a planned and systematic manner, strengthen the construction of grass-roots agricultural extension teams, and create conditions for the development of low-carbon agriculture.
Publicly available datasets were analyzed in this study. This data can be found here: http://tjj.zj.gov.cn/col/col1525563/index.html.
All authors contributed to the study conception and design. Conceptualization, JL and QL; methodology, JL and QL; software, SL and JD; validation, JL and SL; formal analysis, QL and SL; investigation, SL and QL; resources, QL; data curation, SL; writing—original draft preparation, JL; writing—review and editing, SL and QL; supervision, JD; project administration, JL, QL. All authors read and approved the final manuscript.
This work is supported by the National Social Science Fund of China (Grant numbers 20CTJ011) and the National Statistical Science Research Project of China (Grant numbers 2022LY067).
The authors declare that the research was conducted in the absence of any commercial or financial relationships that could be construed as a potential conflict of interest.
All claims expressed in this article are solely those of the authors and do not necessarily represent those of their affiliated organizations, or those of the publisher, the editors and the reviewers. Any product that may be evaluated in this article, or claim that may be made by its manufacturer, is not guaranteed or endorsed by the publisher.
Berthoud, A., Maupu, P., Huet, C., and Poupart, A. (2011). Assessing freshwater ecotoxicity of agricultural products in life cycle assessment (lca): A case study of wheat using French agricultural practices databases and usetox model. Int. J. Life Cycle Assess. 16 (8), 841–847. doi:10.1007/s11367-011-0321-7
Cheng, Y., Qiao, G. M., Mei, S. Y., and Ning, A. F. (2022). Spatial-temporal differences of carbon emission efficiency in zhejiang province based on sbm-dea model. Resour. Dev. Mark. 38 (03), 272–279. doi:10.3969/j.issn.1005-81412022.03.003
Davis, S. J., and Caldeira, K. (2010). Consumption-based accounting of co2 emissions. Proc. Natl. Acad. Sci. U. S. A. 107 (12), 5687–5692. doi:10.1073/pnas.0906974107
Fang, M., He, Y. X., and Yu, X. Y. (2022). Agricultural carbon emissions: Spatial pattern, decoupling effect and driving factors——taking zhejiang province as an example. Resour. Dev. Mark. 1-12.
Gao, F. (2015). Evolution trend and influencing mechanism of regional total factor productivity in Chinese agriculture—an empirical analysis based on inter provincial panel data. J. Quantitative Tech. Econ. 11 (05), 3–19. doi:10.13653/j.cnki.jqte.2015.05.001
Goglio, P., Smith, W. N., Grant, B. B., Desjardins, R. L., Gao, X., Hanis, K., et al. (2017). A comparison of methods to quantify greenhouse gas emissions of cropping systems in LCA. J. Clean. Prod. 172 (3), 4010–4017. doi:10.1016/j.jclepro.2017.03.133
He, X. L., Chen, X. P., and Pang, J. X. (2018). Analysis on the status and inflluencing factors of agricultural carbon emissions in LanZhou based on LMDI. J. China Agric. Univ. 23 (07), 150–158. doi:10.11841/j.issn.1007-4333.2018.07.17
Hu, W. L., Zhang, J. X., and Wang, H. L. (2020). Characteristics and influencing factors of agricultural carbon emission in China. Statistics Decis. 36 (05), 56–62. doi:10.13546/j.cnki.tjyjc.2020.05.0
Huang, Z., and Mi, S. (2011). Research on agricultural carbon footprint—a case study of zhejiang province. Issues Agric. Econ. 32 (11), 40–47. doi:10.13246/j.cnki.iae.2011.11.007
Jane, M. F., Alan, J., Sharon, L., and Donald, C. (2007). Agricultural opportunities to mitigate greenhouse gas emissions. Environ. Pollut. 150 (1), 107–124. doi:10.1016/j.envpol.2007.06.030
Li, B., Zhang, J. B., and Li, H. P. (2011). Research on spatial-temporal characteristics and affecting factors decomposition of agricultural carbon emission in China. China Popul. Resour. Environ. 21 (08), 80–86. doi:10.3969/j.issn.1002-2104.2011.08.013
Li, W. (2017). Effect analysis of agricultural industrialization on agricultural carbon emission performance—a case sdslbtudy of hebei province. World Agric. (06), 53–59. doi:10.13856/j.cn11s.2017.06.009
Li, X., He, X., Luo, X., Cui, X., and Wang, M. (2020). Exploring the characteristics and drivers of indirect energy consumption of urban and rural households from a sectoral perspective. Greenh. Gas. Sci. Technol. 10 (5), 907–924. doi:10.1002/ghg.2010
Lin, B., Xu, M., and Wang, X. X. (2022). Mitigation of greenhouse gas emissions in China’s agricultural sector: Current status and future perspectives Chin. J. Eco-Agriculture 30 (4), 500–515. doi:10.12357/cjea.20210843
Liu, L., Cheng, S. F., Shieh, P. C., Lee, J. C., Chen, J. J., et al. (2014). The methanol extract of Euonymus laxiflorus, Rubia lanceolata and Gardenia jasminoides inhibits xanthine oxidase and reduce serum uric acid level in rats. Food Chem. Toxicol. 21 (04), 179–184. doi:10.1016/j.fct.2014.05.004
Liu, Q. (2015). Regional differences in agricultural carbon emission efficiency in China—an empirical analysis based on malmquist luenberger index. Jiangsu Agric. Sci. 43 (09), 497–501. doi:10.15889/jissn.1002-1302.2015.09.155
Liu, S. F., Dang, Y. G., Fang, Y. G., Fang, Z. G., Xie, N. M., Zhang, K., et al. (2012). Grey system theory and its application. 5th Edn. New York, USA. Science Press.
Liu, Y., and Liu, H. B. (2022). Characteristics, influence factors, and prediction of agricultural carbon emissions in shandong province. Chin. J. Eco-Agriculture 30 (4), 558–569. doi:10.12357/cjea.20210582
Luo, L. (2015). The research of urbanization efficiency in jiangxi province—based on DEA-malmquist index. Jiangxi Univ. Finance Econ. China.
Ma, D. L., Xiao, Y. P., Zhang, F. T., Zhao, N., Xiao, Y. D., and Chuai, X. W. (2022a). Spatiotemporal characteristics and influencing factors of agricultural low-carbon economic efficiency in China. Front. Environ. Sci. 10, 980896. doi:10.3389/fenvs.2022.980896
Ma, D. L., Xiong, H. T., Zhang, F. T., Gao, L., Zhao, N., Yang, G. M., et al. (2022b). China’s industrial green total-factor energy efficiency and its influencing factors: A spatial econometric analysis. Environ. Sci. Pollut. Res. 29, 18559–18577. doi:10.1007/s11356-021-17040-1
Ma, Y., and Shao, C. X. (2022). Analysis of influencing factors and decoupling effects on energy consumption carbon emissions in beijing, shanghai and tianjin based on LMDI. J. Gansu Sci. 34 (1), 124–132. doi:10.16468/j.cnki.issn1004-0366.2022.01.019
Mattila, T. J., Pakarnen, S., and Sokka, L. (2010). Quantifying the total environmental impacts of an industrial symbiosis - a comparison of process, hybrid and input-output life cycle assessment. Environ. Sci. Technol. 44 (11), 4309–4314. doi:10.1021/es902673m
Pehnt, M., Oeser, M., and Swider, D. J. (2008). Consequential environmental system Analysis of expected offshore wind electricity production in Germany. Energy 33 (5), 747–759. doi:10.1016/j.energy.2008.01.007
Shang, J., Ji, X. Q., Shi, R., and Zhu, M. R. (2022). Structure and driving factors of spatial correlation network of agricultural carbon emission efficiency in China. Chin. J. Eco-Agriculture 30 (4), 543–557. doi:10.12357/cjea.20210607
Su, B., and Ang, B. W. (2014). Input–output analysis of Co2 emissions embodied in trade: A multi-region model for China. Appl. Energy 114, 377–384. doi:10.1016/j.apenergy.2013.09.036
Sun, Y. W., Li, J. L., Li, W. F., and Ma, R. F. (2018). Estimating the carbon emissions and influencing factors of island city: A case study in zhoushan islands, zhejiang province. Geogr. Res. 37 (05), 1023–1033. doi:10.11821/dlyj201805013
Tian, C. S., and Chen, Y. (2021). China's provincial agricultural carbon emissions measurement and low carbonization level evaluation: Based on the application of derivative indicators and TOPSIS. J. Nat. Resour. 36 (2), 395–410. doi:10.31497/zrzyxb.20210210
Tian, Y., and Wang, M. C. (2020). Research on spatial and temporal difference of agricultural carbon emission efficiency and its influencing factors in Hubei province. Sci. Agric. Sin. 53 (24), 5063–5072. doi:10.3864/j.issn.0578-1752.2020.24.009
Tian, Y., and Zhang, J. (2017). Agricultural carbon emission, low carbon agricultural productivity and their coordinated relation in China. J. China Agric. Univ. (05), 208–218. doi:10.11841/j.issn.1007-4333.2017.05.024
Tubiello, F. N., Salvatore, M., Rossi, S., Ferrara, A., Fitton, N., and Smith, P. (2013). The faostat database of greenhouse gas emissions from agriculture. Environ. Res. Lett. 8 (1), 015009. doi:10.1088/1748-9326/8/1/015009
Turconi, R., Tonini, D., Nielsen, C., Simonsen, C. G., and Astrup, T. (2014). Environmental impacts of future low-carbon electricity systems: Detailed life cycle assessment of a Danish case study. Appl. Energy 132, 66–73. doi:10.1016/japenergy.2014.06.078
Wang, Y. L., Xu, J., and Shan, Y. J. (2016). Temporal and spatial characteristics of carbon emissions from major agricultural inputs in zhejiang province. J. Zhejiang Agric. Sci. (03), 311–313. doi:10.16178/jissn.0528-9017.20160301
Wang, Y. N., Zhang, Q. L., and Chen, W. (2022). Study on provincial agricultural carbon emission and emission reduction potential based on carbon sink function: Taking China’s three main grain cropsas an example. Res. Econ. Manag. (05), 58–75. doi:10.19631/jcnki.css.2022.005.005
West, T. O., and Marland, G. (2002). Net carbon flux from agricultural ecosystems: Methodology for full carbon cycle analyses. Environ. Pollut. 116 (3), 439–444. doi:10.1016/s0269-7491(01)00221-4
Wiedmann, T., Minx, J. C., Wood, R., Peters, G. P., Lenzen, M., Owen, A., et al. (2009). Input–output analysis and carbon footprinting: An overview of applications. Econ. Syst. Res. 21 (3), 187–216. doi:10.1080/09535310903541298
Wu, H. Y., Huang, H. J., He, Y., and Chen, W. K. (2021). Measurement, spatial spillover and influencing factors of agricultural carbon emissions efficiency in China. Chin. J. Eco-Agriculture 29 (10), 1762–1773. doi:10.13930/j.cnki.cjea.210204
Wu, X. R., Zhang, J. B., Tian, Y., and Li, P. (2014). Provincial agricultural carbon emissions in China: Calculation, performance change and influencing factors. Resour. Sci. 36 (01), 129–138.
Yang, G., Zhang, F., Zhang, F., Ma, D., Yang, Q., Chen, Y., et al. (2021). Spatiotemporal changes in efficiency and influencing factors of China's industrial carbon emissions. Environ. Sci. Pollut. Res. 28, 36288–36302. doi:10.1007/s11356-021-13003-8
Zhang, T. X., and Li, Y. (2022). Study on agricultural carbon emission and peak carbon emission in typical agriculture townships: Taking dongan county of hunan province as an example. J. Shaoyang Univ. Sci. Ed. 19 (01), 89–96. doi:10.3969/j.issn.1672-7010.2022.01.013
Zhang, X., Liao, K., and Zhou, X. (2022a). Analysis of regional differences and dynamic mechanisms of agricultural carbon emission efficiency in China's seven agricultural regions. Environ. Sci. Pollut. Res. 29 (25), 38258–38284. doi:10.1007/s11356-021-16661-w
Zhang, X., Zhou, X., and Liao, K. (2022b). Regional differences and dynamic evolution of China’s agricultural carbon emission efficiency. Int. J. Environ. Sci. Technol. doi:10.1007/s13762-022-04196-7
Keywords: agricultural carbon emissions, carbon emission efficiency, influencing factors, gray prediction, DEA-malmquist, LMDI
Citation: Li J, Li S, Liu Q and Ding J (2022) Agricultural carbon emission efficiency evaluation and influencing factors in Zhejiang province, China. Front. Environ. Sci. 10:1005251. doi: 10.3389/fenvs.2022.1005251
Received: 28 July 2022; Accepted: 24 October 2022;
Published: 04 November 2022.
Edited by:
José M. Martínez-Paz, University of Murcia, SpainReviewed by:
Fengtai Zhang, Chongqing University of Technology, ChinaCopyright © 2022 Li, Li, Liu and Ding. This is an open-access article distributed under the terms of the Creative Commons Attribution License (CC BY). The use, distribution or reproduction in other forums is permitted, provided the original author(s) and the copyright owner(s) are credited and that the original publication in this journal is cited, in accordance with accepted academic practice. No use, distribution or reproduction is permitted which does not comply with these terms.
*Correspondence: Jingjie Li, bHh5bGpqQHRqY3UuZWR1LmNu
Disclaimer: All claims expressed in this article are solely those of the authors and do not necessarily represent those of their affiliated organizations, or those of the publisher, the editors and the reviewers. Any product that may be evaluated in this article or claim that may be made by its manufacturer is not guaranteed or endorsed by the publisher.
Research integrity at Frontiers
Learn more about the work of our research integrity team to safeguard the quality of each article we publish.