 Yuming Qin1
 Ye Duan
95% of researchers rate our articles as excellent or good
Learn more about the work of our research integrity team to safeguard the quality of each article we publish.
Find out more
ORIGINAL RESEARCH article
Front. Environ. Sci. , 27 September 2022
Sec. Environmental Informatics and Remote Sensing
Volume 10 - 2022 | https://doi.org/10.3389/fenvs.2022.1004343
This article is part of the Research Topic Meta-Scenario Computation for Social-Geographical Sustainability View all 60 articles
The spatial auto-correlation analysis approach is used to examine the agglomeration features and geographical correlation of industrial agglomeration and pollutant discharge using 91 prefecture-level cities in the Yellow River Basin from 2005 to 2020 as the research target. The Yellow River Basin and the upper, middle, and lower reaches were investigated for the effects of industrial agglomeration on industrial pollution emissions. The Dubin model of the spatial panel is used to investigate the drivers of industrial pollution from both indirect effects and direct effects. The findings indicated that ① the spatial pattern of industrial pollution agglomeration and industrial agglomeration in the Yellow River Basin has spatial convergence; ② the global clustering characteristics of industrial pollution in the Yellow River Basin are apparent. The global correlations of the three pollutants are industrial wastewater > industrial smoke and dust > industrial SO2; there is a spatial association between industrial agglomeration and pollution agglomeration, and there are differences in the spatial interconnection between industrial agglomeration and the accumulation of different pollutants; ③ from the overall point of view of the Yellow River Basin, industrial agglomeration will reduce the pollution levels of industrial wastewater, industrial SO2, and industrial smoke and dust. From the perspective of different regions, industrial agglomeration in the upper, middle, and lower reaches is conducive to the decline of industrial pollution, and the role is in the middle, downstream, and upstream in order from large to small; and ④ the Yellow River Basin’s industrial pollution is primarily caused by population agglomeration, industrial structure, environmental regulation, opening to the outside world, and economic development. Their effects on industrial wastewater, industrial SO2, industrial smoke, and dust pollution vary.
Since the reform and opening up, China’s industrial development has reached a stage of rapid development. It has effectively facilitated the rapid economic growth of the country. However, fostering economic growth, the long-term extended industrial development model has also produced a significant amount of industrial pollutants, causing serious damage to the ecological environment (Ji and Zhou, 2020). Under severe pressure, this industrial development model obviously does not conform to the ecological development concept of “lucid waters and lush mountains are invaluable assets” in the context of the new era (Lu and Sun, 2019). Some existing studies on the link between industrial pollution and health status show that industrial pollution will not only produce bronchitis and kidney disease, potentially jeopardizing the occupants’ physical and mental well-being (Rahman et al., 2021; You, 2022), but also hinder economic augmentation and social steadiness (Yan and Cao, 2020). As a result, in an effort to address the serious issue of industrial pollution, the Chinese government has put in place a number of strict policies to limit environmental pollution (CPGPRC, 2013; Xinhua, 2015). The Yellow River Basin (YRB) is a crucial ecological protective screen and economic zone in China, and it is also a crucial location to win the war against poverty (Lu et al., 2021). It is a highly vital region for China’s economic, social, and ecological development (Xi, 2019). Industrial agglomeration effectively promotes the YRB’s flourishing social and economic environment and also leads to pollution agglomeration (Yang et al., 2020). In order to establish a scientific foundation for industrial pollution control in the YRB, it is vital to investigate the spatial correlation between industrial agglomeration and pollution discharge in the YRB and its affecting elements.
The YRB stretches across the three strategic regions of China’s east, west, and middle (Song and Zhang, 2020). It is an essential ecological protection district in China and a crucial spatial carrier for China’s economic and social progress (Lu et al., 2021). In October 2021, General Secretary Xi Jinping presided over the “symposium on in-depth promotion of ecological protection and high-quality development in the Yellow River Basin” in Jinan and delivered a great speech (Xinhua, 2021), pointing out that environmental preservation and superior development are neither separate from each other, nor are they confrontational and conflicting. Still, they are inherently unified and mutually reinforcing (Xinhua, 2021). However, the ecology of the YRB is vulnerable, the quality of development needs to be improved, and it faces serious environmental pollution problems (Jin, 2019). At present, the research on environmental pollution in the YRB chiefly focuses on water pollution, air pollution, and soil pollution. Bai believes that the distribution of water pollutant emissions is consistent with the pattern of economic development. The stepped distribution pattern is particularly prominent in the upstream, midstream, and downstream regions, and the primary water pollutant emissions show a pronounced spatial agglomeration influence. The characteristics of pollution agglomeration in the lower and middle reaches of the basin are particularly obvious (Bai et al., 2020). Teng described the spatial evolution pattern of two types of typical air pollutants, industrial SO2 and PM2.5 in the YRB, and realized that the air pollution in the YRB has significant agglomeration and correlation characteristics, showing a gradient of decreasing agglomeration pattern from southeast to northwest. Compared with SO2 pollution, PM2.5 pollution has a broader distribution and stronger spatial correlation (Teng et al., 2021). Liu believes that the quality of the soil environment in the YRB is generally good, but the soil environment in some areas is not optimistic. It is suggested that in view of the fact that the soil pollution risk prevention and control system in the YRB is not perfect and the management foundation is weak, which comprehensively improve the ability of soil environmental supervision and implement soil pollution risk zoning control (Liu et al., 2021). From the 1990s to the present, numerous studies have supported the hypothesis that the “Kuznets curve” shows an inverted “U" link between environmental quality and economic development (Liang et al., 2019; Du and Xie, 2020). With the rapid economic growth, environmental pollution has gradually increased, and industrial pollution has become the focus of domestic and foreign scholars (Grossman and Kreuger, 1995). Numerous research projects have been conducted on the spatio-temporal pattern of industrial pollution (Wu et al., 2020), influencing factors (Li et al., 2019), industrial pollution and economic growth (Zhou et al., 2020), industrial pollution and environmental regulation (Jia and Zhao, 2012), industrial pollution and industrial agglomeration (Yang, 2018). The research methods include geographically weighted regression (Feng et al., 2020), spatial econometric models (Hu et al., 2016), spatial auto-correlation (Li et al., 2019), and barycentric shift curves (Zhao et al., 2014), the STIRPAT model (Liu et al., 2015), and the Log-Mean Divisia Index (LMDI) diesel decomposition model (Geng et al., 2014). At present, there are few studies on industrial pollution in the YRB. Li found that industrial pollution presents a “high in the east and low in the west” spatial distribution pattern, and from west to east, the basin is divided into highly low-value areas, low-value areas, high-value areas, and extremely high-value areas of pollution emissions (Li, 2021). Previous studies have fully explained the spatial and temporal distribution and contributing factors of various pollutants in the YRB (Ding et al., 2022); however, most of them have only analyzed the pollution problem alone, and there are fewer studies consider industrial agglomeration and pollution emissions.
At present, there has not been much research done on the connection between industrial clusters and pollution emissions, and the academic community has not yet formed a consensus on the link between the two. The following are three representative views: first, industrial encroachment increases local pollutant emissions (Chen C. et al., 2020); second, industrial agglomeration reduces regional pollution emissions (Fang et al., 2020); third, the connection between industrial clusters and emissions of industrial pollution is uncertain (He et al., 2014; Shen and Peng, 2021). In addition, prior research focused on the relationship between industrial agglomeration and individual pollutants (Li B. G. et al., 2021; Li and Han, 2022), and a few scholars from the whole country (Hu et al., 2018), urban agglomerations (Jia et al., 2020), and other administrative divisions conducted a comprehensive study of the geographical association between industrial clusters and different pollutants, but there are still gaps in the literature for the study of the YRB. So, for the YRB, where industrialization is currently accelerating, is there spatial convergence between industrial agglomeration and pollution agglomeration? Whether the two have a spatial correlation at the municipal scale? What are the different influences of industrial agglomeration on the discharge of different types of industrial pollutants? The study of the spatial relationship between industrial agglomeration and industrial pollution emissions in the YRB is helpful to clarify the spatial link between industrial agglomeration and pollution emissions here (Wu et al., 2021). It is really important for the logical formulation of regional emission reduction measures, the reduction of industrial pollution emissions, and the promotion of green and excellent development in the YRB (Ma and Xu, 2020).
In addition, considering that the YRB spans a large area, the degree of socioeconomic development, as well as the biological and topographical factors, vary by region, it is yet unclear how industrial agglomeration would affect the levels of industrial pollution in those areas. Divide the YRB into parts and study the correlation between industrial agglomeration and industrial pollution in the middle, lower, and upper reaches of the YRB, so as to fully understand whether the current YRB environmental management policy is reasonable. Policies should be enacted according to local circumstances (Wang et al., 2022), and accurate identification of the economic and social causes of industrial pollution in the YRB is the premise for rationally formulating and effectively implementing pollution control policies.
The novelty of this study is primarily seen in the following: first, under the YRB’s setting of environmental protection and high-quality advancement (Xinhua, 2021), there has been a lot of interest in the studies on environmental pollution in the YRB. At present, most of the existing studies only analyze pollution problems alone, while there are still few studies considering industrial agglomeration and pollution agglomeration. This article conducts a comprehensive study on the spatial relationship between industrial agglomeration and various pollutants in the YRB, which is not available in previous studies. Second, considering that the YRB spans a large area, we analyze the link between industrial agglomeration and industrial wastewater, industrial SO2, and industrial smoke and dust pollution in the upper, lower, and middle reaches of the YRB. Further regional heterogeneity analysis is helpful for the government to take into account the variations in the key elements affecting industrial pollution in various regions when formulating and implementing pollution control measures and implementing policies based on regional circumstances.
The main goal of this research is: to use the YRB as the study subject from 2005 to 2020, using the spatial auto-correlation analysis method to explore the agglomeration features and spatial correlation of industrial agglomeration and pollution emissions, and using the space panel Dubin model to analyze the contributing factors of industrial pollution from the two aspects of direct influence and indirect effect, and how industrial agglomeration affects the discharge of industrial pollutants at different scales in the YRB as a whole and the upper, lower, and middle reaches are, respectively, explored. It offers the theoretical underpinnings and a decision-making guide for the coordinated industrial growth of the YRB, as well as cooperative pollution prevention and control.
The frame of the rest of this article is as follows: part two is the study method and data source; the third and fourth parts are the results of the empirical study, and the third part is the space of agglomeration analysis and spatial correlation analysis of industrial agglomeration and pollution by three industrial pollutants in the YRB; the fourth part is the impact of industrial agglomeration on industrial pollution discharge at different scales in the YRB as an integral and in the upper, lower, and middle reaches; and in the fifth part, the article ends with conclusions and suggestions.
The YRB is a key area for China’s national land ecological security. It is not only the core area of the sand control belt in northern China, the ecological barrier of the Qinghai-Tibet Plateau, and the “two screens and three belts” ecological barrier pattern of the Loess Plateau, but also the birthplace of important rivers such as the Yangtze River, the Yellow River, and the Lancang River, and an important supply area for China’s freshwater resources (Jin et al., 2020). The YRB is located at 36° 45′ 14.08″ N and 117° 01′ 32.72″ E. From east to west, it is about 1900 km long, and from north to south, it is 1,100 km wide. On the premise of maintaining the integrity of provincial administrative divisions and the availability of data, this article sets the scope of the study object to be eight provinces (autonomous regions): Qinghai, Gansu, Ningxia, Inner Mongolia, Shaanxi, Shanxi, Henan, and Shandong (Li Z. J. et al., 2021). Further considering the availability of data, this article finally selects 91 prefecture-level units as the research objects and divides the study area into three major areas: the upper, lower, and middle reaches. At present, there are various ways to divide the YRB. According to the “Flood Control Plan for the Yellow River Basin” approved by the State Council in 2008 (CPGPRC, 2008), the dividing points between the upper and middle reaches of the YRB are Hekou Town, Tuoke Country, Inner Mongolia Autonomous Region; the dividing point between the lower and middle reaches is Taohuayu Town, Xingyang City, Henan Province. The Qinghai-Tibet Plateau, Inner Mongolia Plateau, Loess Plateau, and Huaihai Plain are the four geomorphic units that make up the YRB’s landscape, which gradually declines from west to east (Ma and Xu, 2020). Since the YRB is expressed as a plane rather than a line in geographical space, and considering historical, cultural, and geographical factors and the feasibility of research, the upper, lower, and middle reaches of the YRB are divided as follows: The upstream area includes 36 cities including Lanzhou, Baiyin, Zhongwei, and Hohhot; the midstream region includes 29 cities including Taiyuan, Luliang, Xi’an, Yan’an, and Zhengzhou; and the downstream region includes 26 cities including Kaifeng, Xinxiang, Jinan, Zibo, etc. (Figure 1). It is worth noting that these three sub-basins are different in terms of economic space and ecological resources. The upstream water resources are sufficient, the ecological environment is good, the population is small, and the level of economic and social development is relatively backward; the middle reaches are rich in energy resources, the ecological environment is relatively fragile, and soil erosion is more serious; the lower reaches have fertile land, developed agriculture, and a high level of social and economic development, but development is greatly restricted by the lack of water resources (Chen Y. et al., 2020).
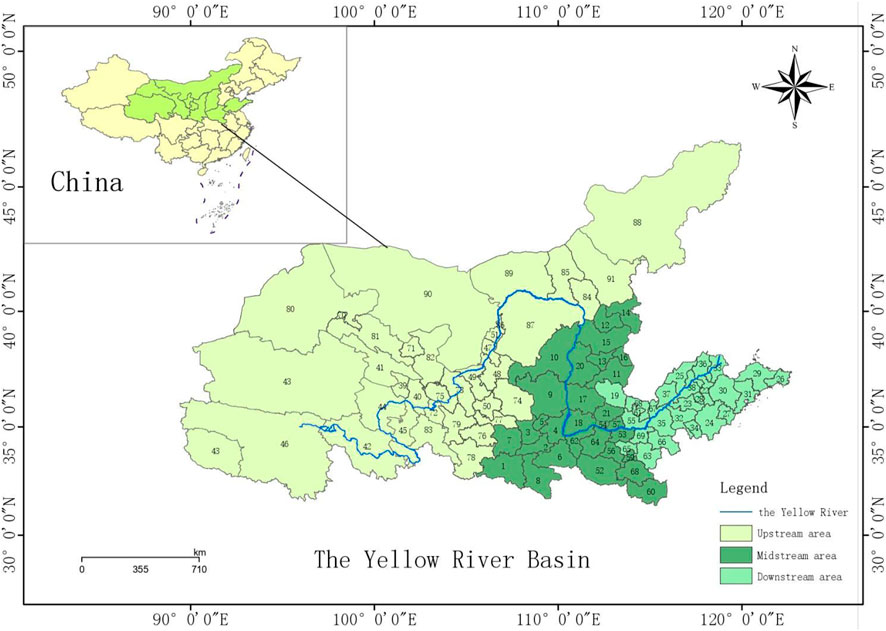
FIGURE 1. Location map of the study area.
The three major pollutant discharge data, industrial data, and data on the population, land area, GDP, the comprehensive utilization rate of industrial solid waste, and actual foreign investment in each city and state used in this article are derived from the 2005–2021 “China Urban Statistical Yearbook” (NBS, 2005-2021a), the “China Regional Economic Statistical Yearbook” (NBS, 2005-2021b), and the statistical yearbooks and statistical bulletins of relevant provinces (autonomous regions, municipalities) and prefecture-level cities.
Herfindahl index, Gini coefficient, location entropy, etc., are usually used to characterize the degree of agglomeration, but these indicators do not effectively consider spatial bias, while the geographical concentration index is considered to be an effective tool to describe industrial agglomeration and pollution agglomeration. Therefore, the geographical concentration index is used to calculate industrial agglomeration and pollution agglomeration separately:
In Eq. 1, recognizing that the manner in which interactions occur may vary between industrial agglomeration and pollutants in different physical forms, industrial wastewater, industrial SO2, and industrial smoke and dust are used to represent three physical forms of industrial pollutants;
The geographical dependency of industrial agglomeration and pollution agglomeration was examined using the univariate global Moran’s I in 91 prefecture-level cities in the YRB (Chen, 2009). The univariate Moran’s I is between -1 and 1, and the significance value is tested with a p value.
The relationship between industrial and pollution agglomerations in space in 91 prefecture-level cities in the YRB was analyzed using bivariate global Moran’s I. The bivariate global Moran’s I is between -1 and 1, and the p value is used to test the significance:
In Eq. 2,
The formation of the industrial pollution agglomeration pattern between prefecture-level cities in the YRB has a strong spatial interaction effect. If the spatial correlation between its contributing factors is ignored, the model estimation result will have a large error compared to the actual situation. The spatial lag model, the spatial error model, and the spatial Dubin model are common spatial econometric models, and the differences in the models are mainly due to the interaction terms of the spatial matrix and variables. Among the three models, the spatial Dubin model is the most standard because it not only fully accounts for the spatial correlation issues brought on by the explanatory and explained variables as well as their interactions but also has the ability to capture the spatial spillover effects of various variables. Therefore, for the sake of solving the problems of spatial dependence of spatial data, the spatial Dubin model is used in this work to analyze the data by regression, and its general formula is as follows:
In Eq. 3, i and j both represent urban individuals; t represents the year;
ArcGIS 10.8 was used to visualize the industrial agglomeration of 91 prefecture-level cities in the YRB in 2005, 2010, 2015, and 2020, respectively, (Figure 2). Using the natural fracture method, in this study, the value of an urban industrial cluster is divided into four categories, which are defined as an extremely low-value area, a low-value area, a high-value area, and an extremely high-value area, from low to high.
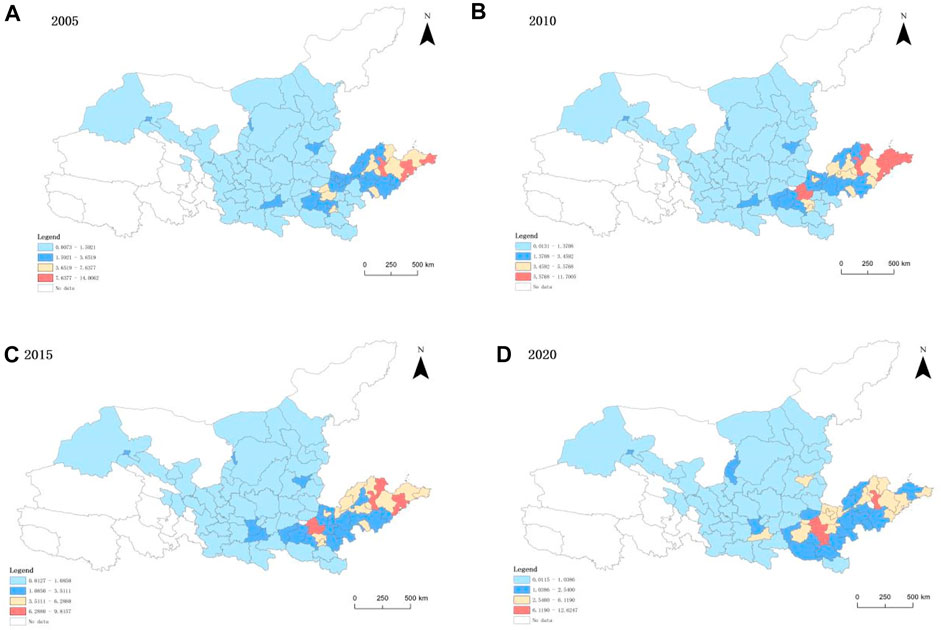
FIGURE 2. Spatial pattern of industrial agglomeration in the Yellow River Basin in 2005, 2010, 2015, 2020.
From the perspective of changing trends, the agglomeration of industrial level in the lower reaches of the YRB showed a slow downward trend from 2005 to 2020, the middle reaches expanded annually, and the upper reaches grew steadily. The high-value regions of industrial agglomeration in the YRB are chiefly concentrated in Qingdao, Zibo, and Zaozhuang in the downstream area, followed by Jinan and Weihai, etc.; the high-value regions of industrial agglomeration are chiefly distributed in Taiyuan and Zhengzhou in the middle reaches; the low-value regions of industrial agglomeration are chiefly distributed in Baiyin and Yinchuan in the upper reaches of the YRB. It is evident that the spatial pattern of industrial agglomeration in the YRB shows non-equilibrium because there are striking differences in growth policies, infrastructure, location conditions, and industrial foundations between the YRB’s high-value industrial agglomeration areas and low-value industrial agglomeration areas, causing elements such as population, funds, and technology to continuously flow from the low-value areas of industrial agglomeration to the high-value areas of industrial agglomeration (Pierson, 2000).
ArcGIS 10.8 was used to spatially visualize the three major industrial pollutants (industrial wastewater, industrial SO2, and industrial smoke and dust) and pollution agglomeration in 91 prefecture-level cities in the YRB in 2005, 2010, 2015, and 2020, respectively. As shown in the figure: there is spatial convergence in the spatial pattern of pollution agglomeration and industrial agglomeration . The areas with extremely high pollution concentrations are chiefly concentrated in Zibo and Zaozhuang in the downstream areas, and the pollution agglomeration high-value regions are around the extremely high pollution accumulation areas. Baiyin, Yinchuan, and Haidong in the upper reaches of the YRB have formed contiguous low-value areas of pollution agglomeration. The spatial distribution patterns of pollution agglomeration of the three major industrial pollutants have strong similarities with slight differences, as follows:
According to the geographical distribution pattern, the industrial wastewater pollution agglomeration level in the YRB is typically high in the lower and middle reaches and low in the upper reaches (Figure 3). The extremely high-value regions are chiefly concentrated in Kaifeng, Zibo, and Zaozhuang in the downstream area, and the high-value areas are chiefly distributed in Xi’an and Taiyuan in the midstream area; the low-value areas and extremely low-value areas where industrial wastewater pollution is concentrated are chiefly distributed in Baotou City, Baiyin City, and Haidong City in the upstream region.
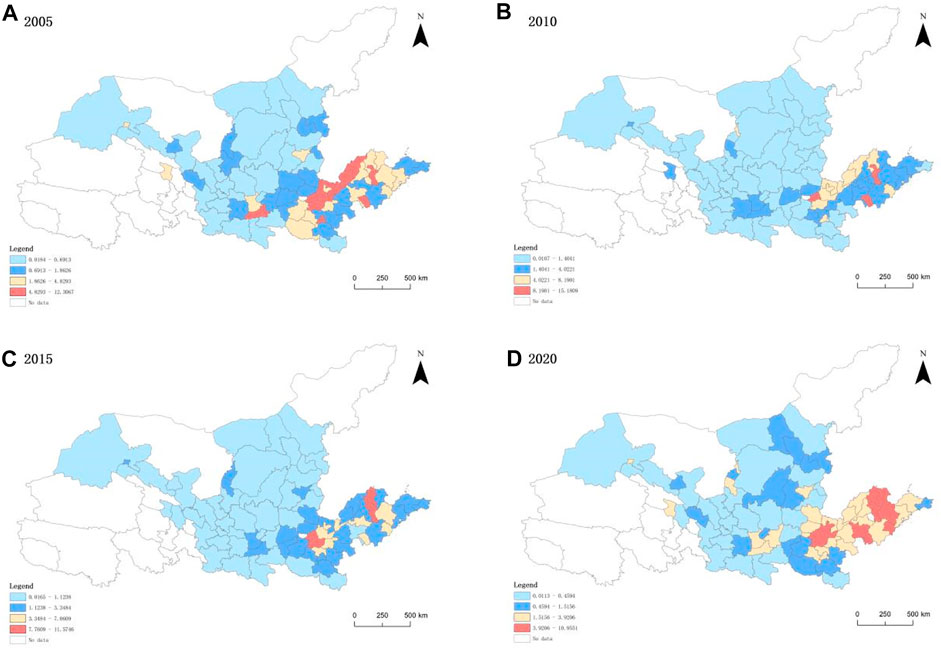
FIGURE 3. Spatial pattern of industrial wastewater discharge agglomeration in the Yellow River Basin in 2005, 2010, 2015, 2020.
The level of industrial SO2 pollution agglomeration in the YRB generally shows a spatial distribution pattern of low agglomeration levels in addition to the high levels of individual cities in the lower and middle reaches of the YRB (Figure 4). The majority of high-value locations are found in Rizhao, Zibo, and Luliang in the lower and middle reaches; the majority of the highly low-value zones with industrial SO2 pollution are dispersed in Ordos, Baiyin, and Tianshui in the upstream areas; low-value areas are chiefly concentrated and distributed in Lanzhou, Haidong, and Yinchuan.
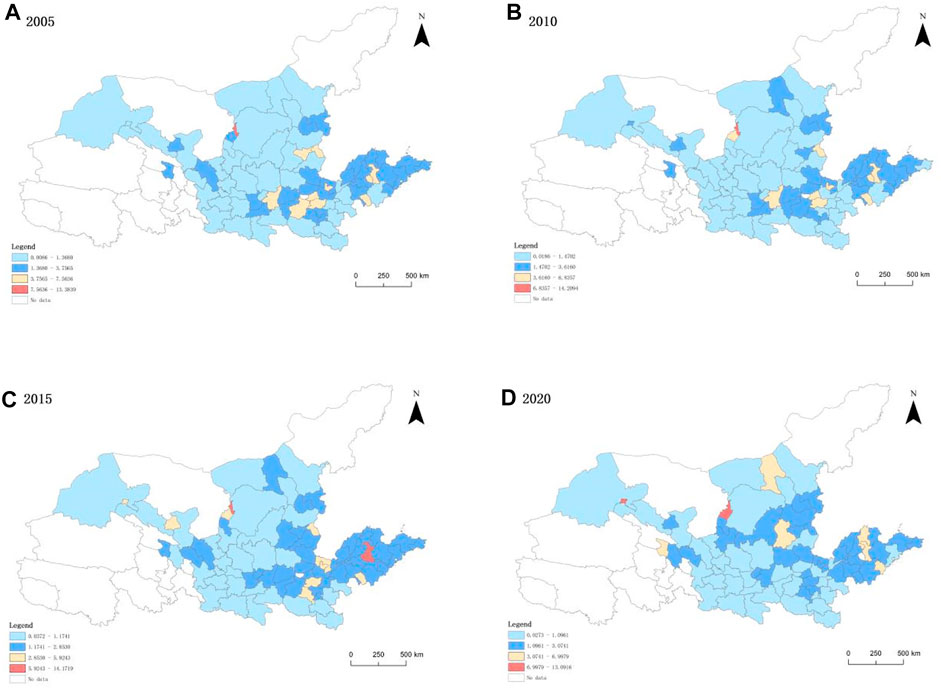
FIGURE 4. Spatial pattern of industrial SO2 emission agglomeration in the Yellow River Basin in 2005, 2010, 2015, 2020.
According to the spatial distribution pattern, the level of industrial smoke and dust pollution accumulation in the YRB is typically higher in the downstream area and lower in the upper and middle reaches (Figure 5). The extremely high-value regions are chiefly distributed in Rizhao City, Zibo City, and Binzhou City in the downstream area, and also in Shizuishan, Xining, and Jiayuguan in the upstream area; the high-value regions are chiefly located in Taiyuan, Zhengzhou, and Jinan in the lower and middle reaches; the extremely low-value areas and low-value areas of industrial smoke and dust pollution are chiefly dispersed in Lanzhou City, Baiyin City, and Haidong City in the upstream area.
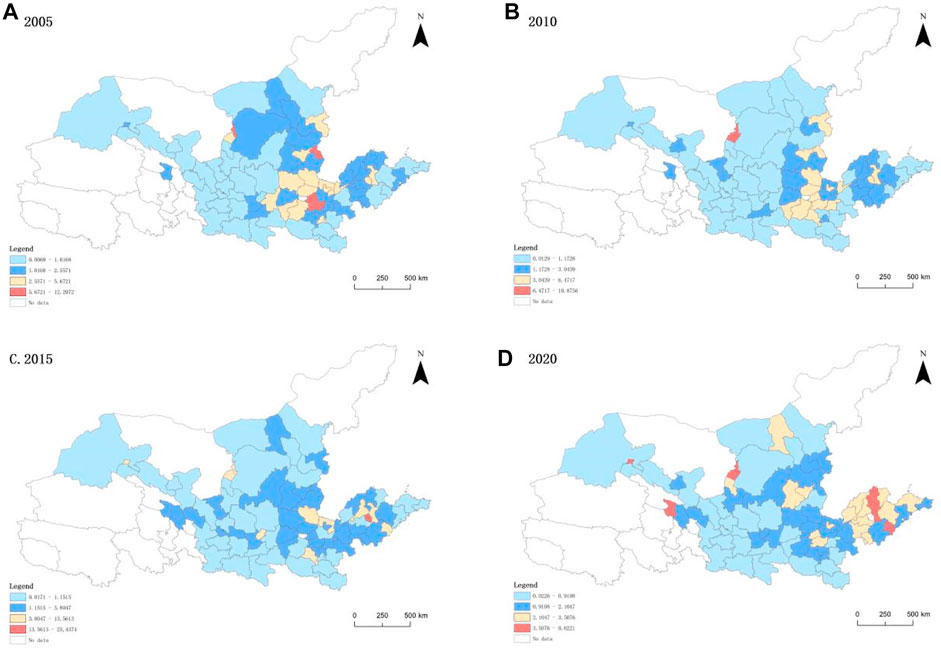
FIGURE 5. Spatial pattern of industrial smoke and dust emission concentration in the Yellow River Basin in 2005, 2010, 2015, 2020.
Geoda 1.18.0 was used to calculate the univariate global Moran’s I and its significance for industrial agglomeration and pollution agglomeration in the YRB from 2005 to 2020 (Table 1). The results show that the univariate global Moran’s I of industrial agglomeration and the three major industrial pollutants’ agglomeration are all positive and pass the significance test. It can be proved that the spatial distribution of industrial agglomeration and pollution agglomeration in the YRB has a positive spatial correlation, and the phenomenon of spatial agglomeration is evident, but there are differences in the spatial dependence of different pollutants. It can be proved that the pollution of the three major industrial pollutants in the cities in the research area is not merely affected by their emissions but also by the cities nearby. Industrial wastewater agglomeration’s fluctuations of Moran’s I from 2005 to 2020 revealed a changing rising tendency, and the changes of Moran’s I of industrial agglomeration, industrial SO2 agglomeration, and industrial smoke and dust agglomeration showed a fluctuating downward tendency. The spatial correlation with pollution agglomeration is still strong.
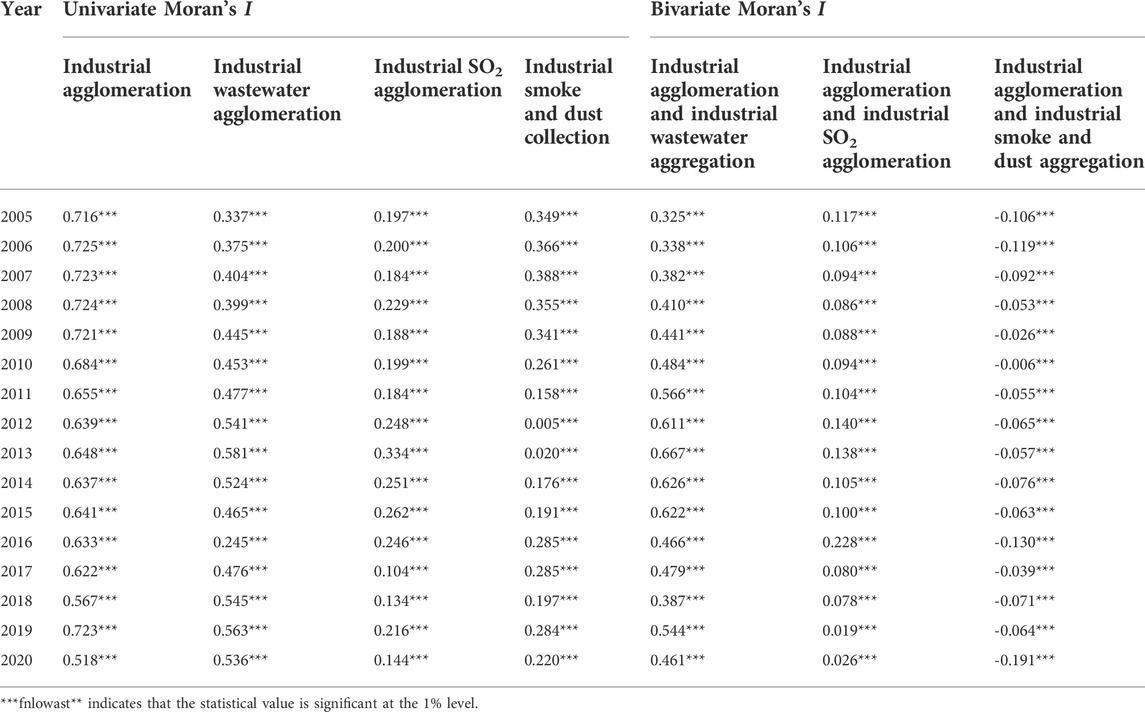
TABLE 1. Moran’s I statistics on industrial agglomeration and pollution agglomeration in the Yellow River Basin in 2005–2020.
The bivariate global Moran’s I of industrial agglomeration and agglomeration of three major industrial pollutants in the YRB from 2005 to 2020 were calculated and their significance. The findings demonstrated that the industrial agglomeration and pollution agglomeration interact spatially. The three bivariate global Moran’s I all passed the significance test, in which the results of industrial agglomeration and industrial smoke and dust pollution agglomeration were negative values, and the other two were positive values, which can be obtained, that there is spatial relativity between industrial agglomeration and pollution agglomeration, and there are discrepancies in the spatial interaction influences of industrial agglomeration and different pollutant agglomerations. According to the index value, consequently, industrial wastewater has the largest spatial association with industrial agglomeration, followed by industrial SO2, and industrial smoke and dust has the lowest correlation.
Considering the quantifiability, representativeness, and availability of indicators, industrial pollution is used as the elucidated variable, industrial agglomeration is used as the explanatory variable, and population agglomeration, industrial structure, opening to the outside world, economic development, and environmental regulation are used as control variables. The connection between industrial agglomeration and pollution from industry is investigated by constructing an econometric model. The specific indicators are shown in Table 2.
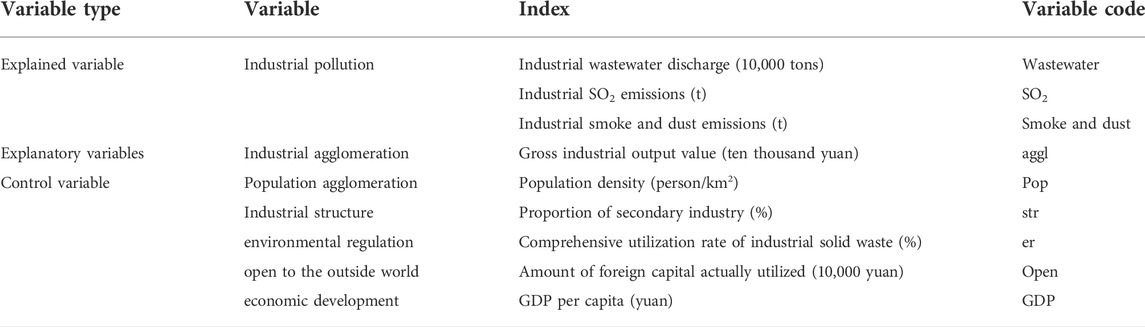
TABLE 2. Definition and explanation of variables.
① Population agglomeration: the expansion of the density of the population can bring about an increase in consumption needs, thereby increasing the consumption of resources such as energy (Sheng and Tang, 2020; Yuan et al., 2020), and the higher the density of the population, the larger the production scale, and the more serious the environmental pollution (Xiao et al., 2021). This article expresses the population agglomeration based on the total population of the region at the years’end rather than the administrative area of the region. ② Industrial structure: modernizing the industrial infrastructure can stop the spread of industrial pollution (Ma and Cao, 2021). The production value of the secondary industry is used in this work as a proportion of GDP to characterize the industrial structure. ③ Environmental control: it is generally accepted that environmental regulation plays a vital part in reducing air pollution (Hao et al., 2018; Zhang et al., 2020), and this study describes environmental regulation using the industrial solid waste’s total use rate. ④ Open to the outside world: foreign direct investment can play a technological spillover effect, thereby improving the environmental pollution in the region where it is located; at the same time, it may also increase air pollution in less developed regions (Huang and Zhou, 2019). This article expresses the dependence on foreign capital in terms of the actual amount of foreign capital utilized each year. ⑤ The level of economic development: the environmental Kuznets curve theory deems that the degree of economic progress and pollution are closely correlated, and generally have an inverted “U" shape relationship (Grossman and Kreuger, 1995). In this study, the GDP per capita is a measure of economic growth (Dai and Lin, 2021). ⑥ Industrial agglomeration: pollution agglomeration is a derivative of industrial agglomeration . The pollution effect of industrial agglomeration encourages pollution agglomeration and results in a rise in pollution emissions; on the other side, the self-purification effect of industrial agglomeration brings out the reduction in pollution emissions and inhibits pollution agglomeration (Jia et al., 2020). This study uses the geographical concentration of the industrial added value to represent industrial agglomeration.
This study first performs the appropriate tests on the model and indicators to assure the reliability of the regression results: to ensure data stationarity and weaken the influence of the collinearity and heteroscedasticity of the series on the estimated results, take the logarithm of some indicators of the model; use the Hausman test to measure the feasibility of the random effect model. If the chi-square p value of the model is less than 0.1, it means the fixed effect should be chosen as the model’s estimate approach; otherwise, the random effect should be selected as the estimation method.
Before performing the spatial econometric estimation, and after successfully passing the Lagrangian multiplier (LM), the robust Lagrangian multiplier (Robust LM), the likelihood ratio (LR), and the Hausman test, this article finally chooses the city and time to be double fixed; the effect SPDM was used for regression estimation.
LeSage et al. believed that using the sum
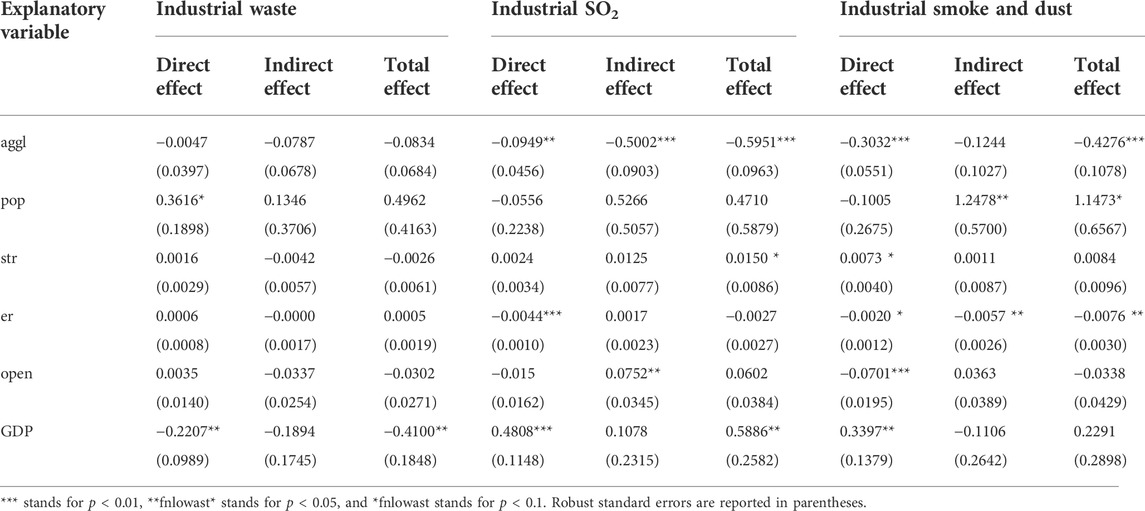
TABLE 3. Regression results of the impact of industrial agglomeration on industrial pollution in the Yellow River Basin.
Negative is the agglomeration of the industrial regression coefficient with respect to industrial wastewater discharge; however, it does not pass the significance test, proving that industrial agglomeration reduces the intensity of wastewater discharge to a certain extent, but the effect is not significant. This may be due to the higher demands of residents for local environmental quality, which forces the government to adopt stricter environmental regulations, increase investment in pollution prevention and control, and curb pollution accumulation. Population concentration and industrial wastewater pollution have a 0.3616 correlation coefficient, which is positive and has passed the significance test. That is, the increase in population size significantly exacerbates local industrial wastewater pollution, and the rising levels of population agglomeration often mean an increase in the scale of production, which can cause the intensity of industrial wastewater outflow to increase. The regression coefficients of industrial structure, environmental regulation, and opening to the outside world on industrial wastewater discharge are positive, yet none of them have been shown to be significant. It may be that the degree of openness and supervision is not strong enough, so their effect on the intensity of discharge is not significant. The influence coefficient of economic development on industrial wastewater is −0.2207, and it has passed the significance test at the level of 5%, illustrating that economic growth is helpful in reducing the intensity of wastewater discharge.
The four factors of industrial agglomeration, environmental control, economic growth level, and opening up to the outside world, are important reasons affecting urban industrial SO2 pollution. From the perspective of direct effects, industrial SO2 pollution is negatively correlated with industrial agglomeration and environmental control; that is, the increase in industrial agglomeration and environmental management and control has significantly reduced local industrial SO2 pollution, playing a restraining role. The main reason is that most cities in the YRB are dominated by industrial development at the present stage, and China emphasizes green growth as the orientation and has issued a number of policies (Xinhua, 2021), thereby restraining industrial SO2 emissions. From the perspective of indirect effects, the greater a city’s level of industrial agglomeration , the more it will inhibit the industrial SO2 pollution of surrounding municipalities, while the direction of the city’s opening to the outside world is just the opposite. Positive spillover effects from growth in the urban industrial agglomeration may benefit the nearby cities, while the expansion of the openness of the city to the outside world will promote an increase in the production volume, resulting in an increase in pollution emissions and spreading to the surrounding towns. In addition, population concentration and industrial organization do not significantly affect industrial SO2 pollution.
A total of six factors, including industrial agglomeration, population agglomeration, industrial structure, environmental control, opening to the outside world, and economic development, have an important impact on urban industrial smoke and dust pollution. The impact coefficients of industrial agglomeration, environmental control, and exposure to the outside world on regional industrial smoke and dust pollution are, in terms of direct consequences, −0.3032, −0.002, and −0.0701, respectively. This shows that industrial agglomeration, environmental control, and opening up have a significant inhibitory effect on local industrial smoke and dust pollution and can be used as a key factor in controlling industrial smoke and dust pollution in the YRB. Next, the degree of industrial structure and economic growth has increased, which has intensified the industrial smoke and dust pollution in the area. As a result, the proportion of the secondary industry has increased, and the purpose of enterprises engaged in economic activities is to make profits, and in the process of profitability, some enterprises may cause environmental pollution. The effective coefficient of environmental regulation on industrial smoke and dust pollution in surrounding areas is −0.0057 when looking at indirect effects, and it has passed the significance test at a level of 5%; it demonstrates how the region’s tight environmental regulations not only limit local pollution but also slow down the spread of industrial smoke and dust pollution to nearby cities. Environmental laws, both statutory and informal, directly control how industrial firms discharge pollutants, and this regulatory constraint sends a signal of emission reduction to neighboring areas through the demonstration warning effect, and there is no nearby transfer of pollution under environmental regulations (Shen et al., 2017); similarly, due to the increase of the municipal population, the pollution emissions of the city will increase. For industrial smoke and dust, a pollutant with spatial mobility, the degree of industrial smoke and dust pollution in the surrounding neighboring cities will increase as a result of the city’s pollution level having an effect on the pollution levels of its bordering cities.
The YRB is further divided into three sections in this article: upstream, midstream, and downstream which investigate the influences of industrial agglomeration on industrial pollution in various regions and conduct regression analysis on the link between industrial agglomeration and three major industrial pollutants (Table 4).
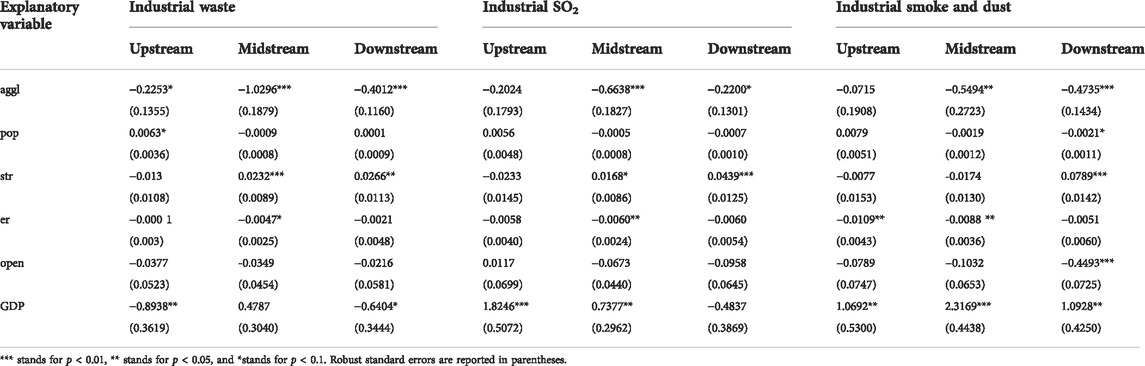
TABLE 4. Regression results of the impact of industrial agglomeration on industrial pollution in the upper, middle, and lower reaches of the Yellow River Basin.
The regression results demonstrate that, at the scale of the YRB, the regression coefficients of industrial agglomeration on three major industrial pollutant emissions are all negative, indicating that, from a broad perspective, an increase in industrial agglomeration will result in a reduction in the level of industrial pollution. The magnitude of the coefficient shows that industrial agglomeration has a more obvious effect on industrial SO2 emission reduction. From a regional perspective, industrial agglomeration has a significantly detrimental impact on the amount of three major industrial pollutants that is emitted in the middle, lower, and upper reaches, and the regression coefficients from large to small are in the middle, downstream, and upstream, indicating that industrial agglomeration of all the three regions will be beneficial to the reduction of industrial pollution; and the regional differences are more obvious, and the effect on the reduction of industrial pollution in the lower and middle reaches is more obvious than that in the upstream. Possible causes are as follows: recently, the lower and middle reaches of the YRB began to develop earlier than the upstream areas, and with the improvement of industrial agglomeration, the features of high added value, low energy consumption, and low pollution of industries in the region are particularly prominent; the level of environmental protection technology in the lower and middle reaches is relatively high, and industrial agglomeration is helpful for centralized pollution control and disposal, so industrial agglomeration brings positive externalities that benefit the environment within the region. Due to geographical and historical reasons, the upstream region’s industrial development is comparatively slow, and the overall technical level of the industry is relatively low. The upstream region’s production efficiency has increased as a result of the technological diffusion effect, and as the industrial agglomeration occurs, pollution emissions become less intense, although there are still gaps as compared to the region’s lower and middle reaches.
Second, the regression results demonstrate that the industrial structure in the lower and middle reaches significantly aggravates industrial pollution. In the context of industrialization promoting urban development, an important factor causing pollution agglomeration is the rise in the share of secondary industry in the national economic structure. The YRB’s high, lower, and middle reaches all have negative environmental control coefficients that are affected differently by industrial pollution, and the reason is that the regional environmental management and control efforts are different, which indicates that the upper, lower, and middle reaches of the YRB should continue to strengthen the control of industrial pollution; the local industrial smoke and dust pollution is significantly hampered by the opening of the downstream areas to the outside world. Foreign capital has introduced a higher degree of technology, and as technology spreads, the production process will be improved to some extent, lowering the overall amount of pollutant emissions, the less pronounced pollution in the upstream and midstream areas may be due to the low level of openness to the outside world and the difficulty of obtaining trade opportunities. From the significant values in the data obtained from economic development, economic growth has a similar impact on industrial pollution in the middle, lower, and upper reaches as it has on the entire YRB.
This research uses the spatial auto-correlation analysis approach to thoroughly examine the distribution characteristics and geographical correlation of industrial agglomeration and pollution from the YRB’s industrial statistics from 2005 to 2020, and on this basis, utilizing the spatial econometric model to explore the critical variables influencing industrial pollution in the YRB, the principal findings are as follows:
1) The YRB’s industrial pollution agglomeration and agglomeration of industrial spatial patterns are spatially converging. The high-value areas of pollution agglomeration and industrial agglomeration are chiefly concentrated in Zibo, Zaozhuang, Zhengzhou, and Taiyuan in the lower and middle reaches. The agglomerated low-value regions are chiefly concentrated in Baiyin City, Yinchuan City, and Haidong City in the upper reaches.
2) Moran’s I of industrial agglomeration, industrial wastewater, industrial SO2, and industrial smoke and dust are all obviously positive, manifesting that the global clustering characteristics of industrial pollution in the YRB are obvious, and the global correlations of the three pollutants are industrial wastewater > industrial smoke and dust > industrial SO2. The spatial correlation intensity varied and altered over the study period, exhibiting a trend toward a gradual waning.
3) There is a spatial association between agglomeration of industrial and pollution agglomeration, on the basis of the bivariate global spatial auto-correlation test. Additionally, there are variations in the spatial interaction impacts of various pollution agglomerations and agglomeration of industrial. From the correlation index value, it can draw a conclusion that the largest spatial association exists between industrial wastewater and agglomerations of industries, followed by industrial SO2, and industrial smoke and dust is the lowest.
4) Industrial agglomeration, population agglomeration, industrial structure, environmental control, opening to the outside world, and economic development are the primary determinants of industrial pollution in the YRB, and there are differences in their impact on three major industrial pollutants. In terms of immediate effects, the population growth exacerbates local industrial wastewater pollution, while economic development is beneficial to reduce the intensity of wastewater discharge. Additionally, the degree of industrial agglomeration can be increased, and environmental regulation can lower local industrial SO2 emissions, and the development of the economic level will aggravate the local industrial SO2 pollution. Industrial agglomeration, environmental regulation, and opening to the outside world have a significant inhibitory effect on local industrial smoke and dust pollution, and the improvement of industrial structure and economic development level has exacerbated the industrial smoke and dust pollution in the region.
5) Industrial agglomeration, population agglomeration, environmental management and control, and opening to the outside world can affect industrial pollution in adjacent areas through indirect effects, and there are differences in their impact on three major industrial pollutants in adjacent cities. Industrial SO2 pollution in neighboring cities was more severely restricted and the more agglomeration of industrial there was. However, the higher the degree of opening up of the city, the more it will promote industrial SO2 pollution in surrounding cities. In addition, the contributing factors of industrial smoke and dust pollution are more complex and diverse, the enhancement of environmental control has a very obvious inhibitory effect on industrial smoke and dust pollution in surrounding cities, and one of the primary causes of industrial smoke and dust pollution is the growth of the population.
6) Industrial agglomeration will lower the pollution levels of three major industrial pollutants from a broad perspective of the YRB. From the standpoint of different regions, industrial agglomeration in the middle, lower, and upper reaches is beneficial to the reduction of industrial pollution, and the impact is in the middle, lower, and upper reaches in descending order. In addition, due to differences in industrial structure, opening to the outside world, environmental control, and economic development levels in the middle, lower, and upper reaches, the pollution levels of industrial wastewater, industrial SO2, and industrial smoke and dust differ between regions.
1) The YRB’s ecological environment quality, sustainable economic and social growth, and influence on the nation as a whole are crucial, and it is also a key area for comprehensive environmental pollution control, and there is a problem of unbalanced regional development (Xinhua, 2021). Although the natural resource endowments and economic development conditions are different in each region of the YRB, the YRB may achieve high-quality development by sticking to the environmental bottom line of economic growth and encouraging the green transformation of industry.
2) Industrial agglomeration and pollution agglomeration are spatially interconnected, indicating that pollution agglomeration in the YRB is both an environmental issue and a development issue. The YRB frequently struggles with the conflict between coordinating industrial expansion and environmental prevention. Industrial agglomeration, pollution agglomeration, and the surrounding areas are closely related as a result of the spatial effects of these phenomena. Therefore, when formulating industrial development policies and environmental governance policies, to eliminate local “policy islands,” a joint cross-provincial and cross-regional prevention and control system should be implemented through government power, enterprise power, market power, and social power to jointly promote green industrial transformation and improve quality and efficiency (Zhou et al., 2022).
3) The YRB must fundamentally restructure its economic development model and adhere to the idea of green development in order to effectively control industrial pollution and organize the promotion of the development of an ecological society. which improve the degree of agglomeration of industries, lower the production costs for businesses, and accelerate the flow of factors and technology spillovers. Furthermore, implement stricter pollution control policies and put in place an environmentally friendly development path that is innately compatible with the objectives and methods of ecological and environmental protection governance.
4) To control industrial pollution in the YRB, we must continue to take the road of industrial agglomeration development. At the same time, coordination of the overall situation is required, and efforts should be made to implement actions in accordance with regional conditions. Given the regional variations in industrial pollution output, actions should be performed in accordance with local circumstances, and the management and control of high industrial pollution discharge areas should be strengthened. A combined preventive and control mechanism for industrial pollution emissions must first be established, along with ongoing efforts to promote regional exchanges and collaboration. ① It should be considered the primary location for industrial pollution control in the entire YRB for areas with a relatively established economy and substantial pollution in the lower parts of the basin, and the policy strength and capital arrangement should be arranged. ② The natural setting in the middle reaches of the YRB has been impacted by the industrial firms’ fast expansion, where industrial pollution is gradually transported. Environmental concerns should be given more attention, inspection and oversight should be increased, the economic structure should be transformed and upgraded, and green growth should be pursued. ③ For the YRB’s upper reaches, where the degree of industrial pollution is low when shifting sectors, it is important to avoid the phenomenon of pollution transfer and fully follow the developmental principle that “clear streams and green mountains are priceless assets."
Based on the research purpose of how to develop industrial agglomeration while ensuring environmental quality, this article analyzes the spatial correlation between industrial agglomeration and industrial pollution in the YRB, studies the impact of industrial agglomeration on environmental pollution, and provides support for ecological protection and high-quality development in the YRB. Since the upper YRB involves many ethnic autonomous regions, some of its data have not been made public. The authors tried their best to supplement it through various methods during the research process, but there are still some missing data to a certain extent. At the same time, due to data limitations, six indicators were selected as the factors affecting industrial pollution in the YRB, and there are still some omissions of variables, which need to be further explored.The datasets presented in this study can be found in online repositories. The names of the repository/repositories and accession number(s) can be found in the article/Supplementary Material.
Several authors made the most widely varied contributions. In particular, YQ had original ideas for this study and conceived and designed the methodology. The manuscript was written, processed, and analyzed by YQ and revised and reviewed by YD, HaZ, HMZ, DL, and ZH, and YD provided financial support. All authors read and agree to the published version of the manuscript.
This research was funded by the Social Science Foundation of Liaoning Province (L19CJY006).
The authors of this article thank the School of Geography of Liaoning Normal University for assistance in developing this research.
The authors declare that the research was conducted in the absence of any commercial or financial relationships that could be construed as a potential conflict of interest.
All claims expressed in this article are solely those of the authors and do not necessarily represent those of their affiliated organizations, or those of the publisher, the editors, and the reviewers. Any product that may be evaluated in this article, or claim that may be made by its manufacturer, is not guaranteed or endorsed by the publisher.
The Supplementary Material for this article can be found online at: https://www.frontiersin.org/articles/10.3389/fenvs.2022.1004343/full#supplementary-material
Bai, L., Sun, Y. Y., Zhao, X. T., Qiao, Q., Li, X. Y., and Zhou, X. Y. (2020). Analysis of water pollution discharge characteristics and pollution agglomeration patterns in the Yellow River Basin. Environ. Sci. Res. 33 (12), 2683–2694. doi:10.13198/j.issn.1001-6929.2020.10.23
Chen, C., Sun, Y., Lan, Q., and Jiang, F. (2020a). Impacts of industrial agglomeration on pollution and ecological efficiency-A spatial econometric analysis based on a big panel data set of China’s 259 cities. J. Clean. Prod. 258, 120721. doi:10.1016/j.jclepro.2020.120721
Chen, Y. G. (2009). Development of spatial autocorrelation theory and method improvement based on moran statistics. Geogr. Res. 28 (06), 1449–1463. doi:10.11821/yj2009060002
Chen, Y., Zhu, M. K., Lu, J. L., Zhou, Q., and Ma, W. B. (2020b). Evaluation of ecological city and analysis of obstacle factors under the background of high-quality development: Taking cities in the Yellow River Basin as examples. Ecol. Indic. 118, 106771. doi:10.1016/j.ecolind.2020.106771
CPGPRC (2013). A circular on “action plan on prevention and control of air pollution” issued by the state Council in China. Available At: http://www.gov.cn/zwgk/2013-09/12/content_2486773.htm (accessed on July 21, 2022).
CPGPRC (2008). The central committee of the communist party of China and the state Council issued the "flood control plan for the Yellow River basin. Available At: http://www.gov.cn/zwgk/2008-07/28/content_1057822.htm (accessed on July 21, 2022).
Dai, P., and Lin, Y. (2021). Should there Be industrial agglomeration in sustainable cities? A perspective based on haze pollution. Sustainability 13 (12), 6609. doi:10.3390/su13126609
Ding, J. S., Deng, Y. Y., and Ma, L. (2022). Spatio-temporal characteristics of haze pollution in the Yellow River Basin and its influencing factors. Statistics decision-making 38 (06), 60–64. doi:10.13546/j.cnki.tjyjc.2022.06.012
Du, X. Y., and Xie, Z. X. (2020). Occurrence of turning point on environmental Kuznets curve in the process of (de)industrialization. Struct. Change Econ. Dyn. 53, 359–369. doi:10.1016/j.strueco.2019.06.003
Fang, J., Tang, X., Xie, R., and Han, F. (2020). The effect of manufacturing agglomerations on smog pollution. Struct. Change Econ. Dyn. 54, 92–101. doi:10.1016/j.strueco.2020.04.003
Feng, D., Wang, Y., Zheng, L., Li, J. Y., and Xie, S. X. (2020). Can industrial agglomeration promote pollution agglomeration? Evidence from China. J. Clean. Prod. 246 (C), 118960. doi:10.1016/j.jclepro.2019.118960
Geng, Y., Wang, M., Sarkis, J., Xue, B., Zhang, L., Fujita, T., et al. (2014). Spatial-temporal patterns and driving factors for industrial wastewater emission in China. J. Clean. Prod. 76, 116–124. doi:10.1016/j.jclepro.2014.04.047
Grossman, G., and Kreuger, A. (1995). Economic growth and the environment. Q. J. Econ. 110 (2), 353–377. doi:10.2307/2118443
Hao, Y., Deng, Y., Lu, Z. N., and Chen, H. (2018). Is environmental regulation effective in China? Evidence from city-level panel data. J. Clean. Prod. 188, 966–976. doi:10.1016/j.jclepro.2018.04.003
He, C., Huang, Z., and Ye, X. (2014). Spatial heterogeneity of economic development and industrial pollution in urban China. Stoch. Environ. Res. Risk Assess. 28 (4), 767–781. doi:10.1007/s00477-013-0736-8
Hu, Z. Q., Miao, J. M., and Miao, C. H. (2016). Agglomeration characteristics and influencing factors of industrial pollution at the prefecture-level in China. Geogr. Res. 35 (08), 1470–1482. doi:10.11821/dlyj201608006
Hu, Z. Q., Miao, J. M., and Miao, C. H. (2018). Spatial characteristics and measurement and inspection of industrial agglomeration and pollution emissions in China's prefectures and cities. Geogr. Sci. 38 (02), 168–176. doi:10.13249/j.cnki.sgs.02.002
Huang, R. Y., and Zhou, Q. J. (2019). Will FDI lead to environmental pollution in the host country? Empirical evidence from the Yangtze River economic belt. Contemp. Financial Res. 5, 41–53.
Ji, D. J., and Zhou, P. (2020). Marginal abatement cost, air pollution and economic growth: Evidence from Chinese cities. Energy Econ. 86, 104658. doi:10.1016/j.eneco.2019.104658
Jia, R. Y., and Zhao, D. T. (2012). Performance evaluation model of industrial pollution control: An empirical study based on the perspective of environmental regulation. Syst. Eng. 30 (06), 1–9.
Jia, Z., Qing, W. L., Wang, Y. J., Li, E. L., and Chen, X. P. (2020). The pattern of industrial pollution agglomeration and its spatial effects in Lanzhou-Xining urban agglomeration. Econ. Geogr. 40 (01), 68–75+84. doi:10.15957/j.cnki.jjdl.2020.01.008
Jin, F. J. (2019). Coordinated promotion strategies for ecological protection and high-quality development in the Yellow River Basin. Reform 11, 33–39.
Jin, F. J., Ma, L., and Xu, D. (2020). Environmental stress and optimized path of industrial development in the Yellow River Basin. Resour. Sci. 42 (1), 127–136. doi:10.18402/resci.2020.01.13
Li, B. G., Hu, Z. Q., Miao, C. H., Zhang, B. F., and Kang, W. (2021a). Spatial differentiation characteristics and influencing factors of industrial ecological efficiency in the Yellow River Basin. Geogr. study 40 (08), 2156–2169. doi:10.11821/dlyj020200516
Li, H., and Han, Y. (2022). Analysis of spatio-temporal evolution characteristics and influencing factors of PM (2.5) in the Yellow River basin. World Geogr. Res. 31 (01), 130–141. doi:10.3969/j.issn.1004-9479.2022.01.2020212
Li, H., Zhao, X. Y., Wang, W. J., and Xue, B. (2019). Spatial-temporal differentiation and influencing factors of urban industrial pollution in China based on multi-scale. Geogr. Res. 38 (08), 1993–2007. doi:10.11821/dlyj020180480
Li, S. (2021). Study on the Spatio-temporal pattern and influencing factors of industrial pollution in the Yellow River Basin. China (Gansu Province): Lanzhou University. [master's thesis]. doi:10.27204/d.cnki.glzhu.2021.002401
Li, Z. J., Hu, M. J., Zhang, A. P., and Nian, X. (2021b). The impact of industrial eco-efficiency on pollution of PM (2.5) and its spillover effect. J. Nat. Resour. 36 (03), 737–751. doi:10.31497/zrzyxb.20210315
Liang, L. W., Wang, Z. B., and Li, J. X. (2019). The effect of urbanization on environmental pollution in rapidly developing urban agglomerations. J. Clean. Prod. 237, 117649–126526. doi:10.1016/j.jclepro.2019.117649
Liu, R. P., Wei, N., Song, Z. X., and Wang, X. H. (2021). Strategic study on soil pollution control in the Yellow River Basin. Environ. Sci. Manag. 46 (09), 45–49. doi:10.3969/j.issn.1673-1212.2021.09.012
Liu, Y. S., Zhou, Y., and Wu, W. X. (2015). Assessing the impact of population, income and technology on energy consumption and industrial pollutant emissions in China. Appl. Energy 155, 904–917. doi:10.1016/j.apenergy.2015.06.051
Lu, C. P., Hou, M. C., Liu, Z. L., Li, H. Z., and Lu, C. Y. (2021). Variation characteristic of NDVI and its response to climate change in the middle and upper reaches of Yellow River basin, China. IEEE J. Sel. Top. Appl. Earth Obs. Remote Sens. 14, 8484–8496. doi:10.1109/JSTARS.2021.3105897
Lu, D. D., and Sun, D. Q. (2019). Comprehensive management and sustainable development of the Yellow River basin. Acta Geogr. Sin. 74 (12), 2431–2436. doi:10.11821/dlxb201912001
Ma, H. T., and Xu, Y. Y. (2020). Differentiation between high-quality development assessment and spatial pattern of urban agglomerations in the Yellow River Basin. Econ. Geogr. 40 (04), 11–18. doi:10.15957/j.cnki.jjdl.2020.04.002
Ma, T., and Cao, X. X. (2021). The effect of the industrial structure and haze pollution: Spatial evidence for China. Environ. Sci. Pollut. Res. 29 (16), 23578–23594. doi:10.1007/s11356-021-17477-4
Pierson, P. (2000). Increasing returns, path dependence, and the study of politics. Am. Polit. Sci. Rev. 94 (2), 251–267. doi:10.2307/2586011
Rahman, M. M., Alam, K., and Velayutham, E. (2021). Is industrial pollution detrimental to public health? Evidence from the world’s most industrialized countries. BMC Public Health 21, 1175. doi:10.1186/s12889-021-11217-6
Shen, K. R., King, K., and Fang, X. (2017). Does environmental regulation cause pollution to transfer nearby? Econ. Res. 52 (05), 44–59.
Shen, N., and Peng, H. (2021). Can industrial agglomeration achieve the emission-reduction effect? Socio-Economic Plan. Sci. 75, 100867–110121. doi:10.1016/j.seps.2020.100867
Sheng, J. C., and Tang, W. Z. (2020). Spatio-temporal variation patterns of water pollution drivers: The case of China's south-north water transfer project. Sci. Total Environ. 761, 143190–149697. doi:10.1016/j.scitotenv.2020.143190
Song, H. Q., and Zhang, M. (2020). “Investigation of regional gap in the Yellow River Basin and analysis of high-quality development strategies,” in 2020 International Conference on Urban Engineering and Management Science (ICUEMS), Zhuhai, China, 24-26 April 2020 (IEEE), 105–111. doi:10.1109/ICUEMS50872.2020.00033
Teng, T. W., Chen, D. H., and Hu, L. L. (2021). Spatial pattern evolution and influencing factors of air pollution in the Yellow River Basin. Geogr. Sci. 41 (10), 1852–1861. doi:10.13249/j.cnki.sgs.2021.10.017
Wang, Y. Z., Duan, X. J., Wang, L. Q., and Zou, H. (2022). Spatial-temporal patterns and driving factors of industrial pollution and structures in the Yangtze River Economic Belt. Chemosphere 303, 134996–136535. doi:10.1016/j.chemosphere.2022.134996
Wu, J. W., Chen, W., Geng, P., and Yang, L. Q. (2020). Study on the evolution of industrial pollution and its driving factors under the background of economic transformation: A case study of Yangtze River delta region. Resour. Environ. Yangtze River Basin 29 (03), 535–546. doi:10.11870/cjlyzyyhj202003001
Wu, J. X., Xu, H., and Tang, K. (2021). Industrial agglomeration, CO2 emissions, and regional development programs: A decomposition analysis based on 286 Chinese cities. Energy 225, 120239–125442. doi:10.1016/j.energy.2021.120239
Xi, J. P. (2019). Speech at a symposium on ecological protection and quality development in the Yellow River Basin. Qiushi 20, 1–5.
Xiao, Z. Y., Li, H. H., and Sun, L. (2021). Does population and industrial agglomeration exacerbate China’s pollution? J. Environ. Plan. Manag. 9, 711033. doi:10.1080/09640568.2021.1978059
Xinhua, H. (2015). The state Council issued the "water pollution prevention and control action plan. Available At: http://www.gov.cn/xinwen/2015-04/16/content_2847709.htm (Accessed on July 21, 2022).
Xinhua, H. (2021). Xi Jinping presided over a symposium on the in-depth promotion of ecological protection and high-quality development of the Yellow River Basin. Available At: http://www.gov.cn/xinwen/2021-10/22/content_5644385.htm#1 (accessed on July 21, 2022).
Yan, S., and Cao, Y. M. (2020). The impact of environmental pollution on China's economic growth: Based on the perspective of environmental pollution control expenditure. Environ. Sci. Manag. 45 (03), 15–20+83. doi:10.3969/j.issn.1673-1212.2020.03.004
Yang, M. (2018). An empirical study on the impact of industrial agglomeration on industrial pollution emissions—based on the comparison of manufacturing agglomeration and service industry agglomeration. Qiushi 2, 59–74+111. doi:10.3969/j.issn.1007-8487.2018.02.006
Yang, Y. C., Mu, Y. J., and Zhang, W. (2020). Basic conditions and core strategies of high-quality development in the Yellow River Basin. Resour. Sci. 42 (3), 409–423. doi:10.18402/resci.2020.03.01
You, J. H. (2022). Research on the impact of industrial pollution on residents' health. China (Hebei Province): The Hebei University of Geosciences. [master's thesis].
Yuan, H. X., Feng, Y. D., Lee, C. C., and Cen, Y. (2020). How does manufacturing agglomeration affect green economic efficiency? Energy Econ. 92, 104944. doi:10.1016/j.eneco.2020.104944
Zhang, Z., Zhang, G., Song, S., and Su, B. (2020). Spatial heterogeneity influences of environmental control and informal regulation on air pollutant emissions in China. Int. J. Environ. Res. Public Health 17, 4857. doi:10.3390/ijerph17134857
Zhao, H. X., Jiang, X. W., and Cui, J. X. (2014). [Shifting path of industrial pollution gravity centers and its driving mechanism in Pan-Yangtze River Delta]. Environ. Sci. 35 (11), 4387–4394. doi:10.13227/j.hjkx.2014.11.048
Zhou, D., Zhong, Z. X., Chen, L. B., Gao, W. X., and Wang, M. Z. (2022). Can the joint regional air pollution control policy achieve a win-win outcome for the environment and economy? Evidence from China. Econ. Analysis Policy 74, 0313–0333. doi:10.1016/j.eap.2022.01.011
Zhou, Z. Z., Liu, Q. B., and Wang, Y. Y. (2020). Environmental Kuznets curve test on the relationship between economic growth and industrial environmental pollution—panel econometric model based on provinces in the Yangtze River economic belt. J. Nanjing Univ. Technol. Soc. Sci. Ed. 19 (02), 64–72+112. doi:10.3969/j.issn.1671-7287.2020.02.008
Keywords: industrial agglomeration, industrial pollution, spatial correlation, the Yellow River Basin, regional heterogeneity, spatial Dubin model
Citation: Qin Y, Zhang H, Zhao H, Li D, Duan Y and Han Z (2022) Research on the spatial correlation and drivers of industrial agglomeration and pollution discharge in the Yellow River Basin. Front. Environ. Sci. 10:1004343. doi: 10.3389/fenvs.2022.1004343
Received: 27 July 2022; Accepted: 30 August 2022;
Published: 27 September 2022.
Edited by:
Bing Xue, Institute of Applied Ecology (CAS), ChinaReviewed by:
Qiang Yu, Beijing Forestry University, ChinaCopyright © 2022 Qin, Zhang, Zhao, Li, Duan and Han. This is an open-access article distributed under the terms of the Creative Commons Attribution License (CC BY). The use, distribution or reproduction in other forums is permitted, provided the original author(s) and the copyright owner(s) are credited and that the original publication in this journal is cited, in accordance with accepted academic practice. No use, distribution or reproduction is permitted which does not comply with these terms.
*Correspondence: Ye Duan, ZHlkbEBsbm51LmVkdS5jbg==
Disclaimer: All claims expressed in this article are solely those of the authors and do not necessarily represent those of their affiliated organizations, or those of the publisher, the editors and the reviewers. Any product that may be evaluated in this article or claim that may be made by its manufacturer is not guaranteed or endorsed by the publisher.
Research integrity at Frontiers
Learn more about the work of our research integrity team to safeguard the quality of each article we publish.