 Panyan Ge
 Shuxian Fan1*
94% of researchers rate our articles as excellent or good
Learn more about the work of our research integrity team to safeguard the quality of each article we publish.
Find out more
ORIGINAL RESEARCH article
Front. Environ. Sci., 06 September 2022
Sec. Atmosphere and Climate
Volume 10 - 2022 | https://doi.org/10.3389/fenvs.2022.1003669
This article is part of the Research TopicAir Pollution Remote Sensing and the Subsequent Interactions with Ecology on Regional Scales - Volume IIView all 10 articles
To investigate the relationships among the chemical compositions of fog droplets, atmospheric pollutants, and the fog microphysical characteristics, four fog cases were sampled in a comprehensive field experiment conducted at the Donghai site in an agricultural city, China, in the winter of 2020. The pH, electrical conductivity (EC), total ion concentration (TIC), and chemical compositions of the fog water were all size-dependent. High concentrations of non-sea-salt calcium (nssCa2+) and NH4+ led to the alkaline pH of 6.13–7.32. The TIC of fog water was relatively high, especially in small droplets of diameter within 4–16 μm (463527.9 μeq/L). The relatively high NO2− concentration was also found in the fog water, dominated by the non-homogeneous chemical reaction between NO2 and fog droplets. An interesting finding is that the TIC of fog water measured on December 12 was much higher than that measured on December 11. Compared to the first fog, the stronger thermal inversion and local emissions led to the higher concentration of atmospheric particles in the second fog. Generally, the relatively high concentration of atmospheric particles resulted in a large number of small-sized droplets, which had fast liquid-phase oxidation reaction rates and high gas-liquid conversion efficiencies, leading to a higher TIC in the fog water during the second fog.
• The pH, electrical conductivity, and ion concentration of fog water were all size-dependent.
• The non-homogeneous chemical reaction of NO2 dominated the high NO2− concentration in the fog water.
• The level of ion concentration in the fog water depends on the physicochemical processes of the droplets.
Fog is the visible aggregation of many water droplets and ice crystals suspended in the atmosphere close to the ground (Niu et al., 2010a). Essentially, fog is formed by activating aerosol particles under supersaturation conditions (Hoag et al., 1999). Aerosol-fog interactions change the size-dependent chemical composition of fog droplets. This is mainly determined by the liquid phase reaction rate and the fog scavenging effect (Reilly et al., 2001; Moore et al., 2002). Fog droplets can effectively trap pollutants near the surface, enhancing the formation of the secondary aerosols through liquid-phase oxidation reactions, which in turn increase the aerosol concentration (Pandis and Seinfeld., 1989). The acidity and catalyst content in fog droplets affect the liquid phase reaction rates of different ionic components (Reilly et al., 2001). The concentration of ion components determines the pH of droplets. The difference in the concentration of ion components in different droplet sizes causes size-dependent pH; for instance, the small droplets are generally more acidic (Collett et al., 1999). The size-dependent pH in turn affects the oxidation processes, thereby the chemical compositions in the fog droplets (Gurciullo and Pandis, 1997). Additionally, fog can reduce the ambient aerosol concentration by removing part of the aerosol particles through scavenging and settling effects (van Pinxteren et al., 2016; Li et al., 2017a; Izhar et al., 2020). The scavenging efficiency depends on the droplet size, contributing to the size-dependent chemical composition in fog droplets.
Theoretically, a decrease in aerosol loading could increase the ambient supersaturation when ignoring the changes in the source term of supersaturation. In this way, the activation rate of cloud condensation nuclei (CCN) increases, thereby changing the chemical and microphysical characteristics of fog (Guo et al., 2015). Many fog field experiments have shown that fog chemical characteristics depend on the physical and chemical properties of CCN, fog microphysical processes, and non-homogeneous chemical reactions on the droplet surface (Munger et al., 1983; Hoag et al., 1999; Moore et al., 2004; Guo et al., 2012). Water-soluble ions from CCN and surrounding gases enter the droplets through chemical reactions, participating in dissolution, diffusion, dilution, and secondary reactions. Small droplets correspond to a large total surface area and a strong ability to absorb pollutants, resulting in a high concentration of water-soluble ions (Li et al., 2017a; Hu et al., 2019). Therefore, the chemical characteristics of fog water are closely related to droplet size. Thereto, the comprehensive fog field experiments on its physicochemical characteristics are urgently needed to investigate the relationship among the fog chemical and microphysical characteristics, and atmospheric pollutants.
In recent years, fog chemical characteristics have been focused on in China. Radiation fog mainly occurs in inland areas; the main anion in the fog water is SO42-, and the cation is mostly Ca2+ and NH4+ (Lu et al., 2010; Zhang et al., 2021). Sea fog is mostly advective fog, with Na+ and Cl− as the main ionic components (Yue et al., 2014). Hu et al. (2019) and Zhang et al. (2021) showed that secondary water-soluble ions (NH4+, NO3−, and SO42-) were enriched in small droplets, and the concentration of ions showed a U-shaped profile with droplet size. Zhu et al. (2018) found that NH4+ concentration was higher in small droplets, whereas SO42- and NO3− concentrations were higher in large droplets at Mount Tai, China; Ca2+ and Mg2+ concentrations decreased with decreasing droplet particle size. Hu et al. (2019) reported the fog water was severe acidification in the winter of 2016 at Mount Lu, and the acidification transformed from sulfuric acid to mixed sulfuric and nitric acid, which was different from that observed at Mount Lu in 1998 (Zhang and Qin, 1998). Thus, fog water size-dependent characteristics varied with sampling locations and times.
Jiangsu Province is one of the most polluted areas in China. Extensive field fog experiments have been conducted in Jiangsu Province and surrounding areas (Li et al., 2011; Li et al., 2017b; Xu et al., 2018; Zhu et al., 2018; Zhang et al., 2021), but mainly focused on the industrial and commercial cities. To fill up the research in agricultural regions, we conducted a 2-month field fog experiment in the winter of 2020 at the Donghai County Meteorological Bureau observation site in Jiangsu Province. Chemical characteristics of the size-dependent fog water are focused on in this study. The remainder of this paper is organized as follows. Section 2 introduces the data and methods. Section 3 presents the chemical characteristics of size-dependent fog water. Section 4 shows the significant TIC difference between two persistent fog cases. Finally, concluding remarks are presented in Section 5.
Donghai County belongs to Lianyungang City, located in the northeastern part of Jiangsu Province. It is approximately 90 km from the Yellow Sea and belongs to the plains and mountains at the southeast edge of the North China Plain. The resident population of Donghai County is approximately 1.18 million, who are mainly employed in agriculture. The study site is located in the observation field of the Donghai County Meteorological Bureau (34.32° N, 118.42° E, altitude 30 m), which is surrounded by farmland, lakes, and industrial manufacturing bases, as shown in Figure 1.
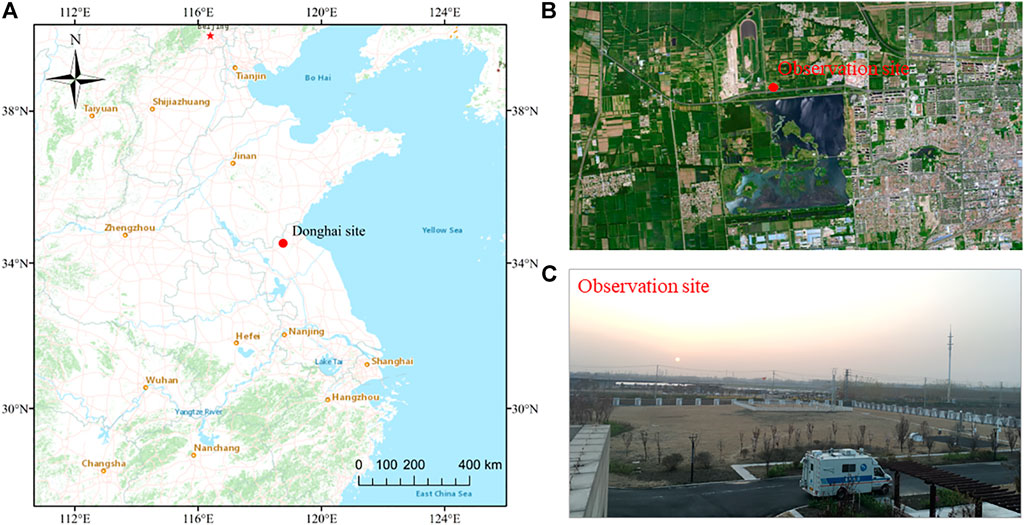
FIGURE 1. (A) Geographical location of the Donghai site in Jiangsu Province, China, (B) surrounding of the observation site, and (C) photo of the observation site.
We used a three-stage Caltech Active Strand Cloudwater Collector 1 (CASCC1) to collect fog water within three diameter ranges. The first stage (S1) collected large fog droplets of diameter larger than 22 μm; the second stage (S2) was for medium droplets of diameter within 16–22 μm; the third stage (S3) was for the small droplets of diameter within 4–16 μm. The collection efficiency for these cut-off diameters was 50% (Demoz et al., 1996; Spiegel et al., 2012). See Zhang et al. (2021) for its collection principle. Before sampling, we repeatedly soaked and cleaned the CASCC1 using the ultrapure water with a resistivity of 18.2 MΩ/cm. The CASCC1 was also cleaned after collecting fog water at each fog event to avoid the effects of residual fog water. When the visibility dropped below 1 km, the CASCC1 was turned on. The collection bottle was replaced when the volume of the collecting fog water was greater than 10 ml. During this experiment, 4 fog cases were observed, and 21 fog water samples were collected, including 10 S1samples, 6 S2 samples, and 5 S3samples.
During this experiment, fog microphysical characteristics were also measured using a Fog Monitor model 120 (FM-120, DMT). FM120 counts and sizes droplets with diameters ranging from 2 to 50 μm divided into 30 bins, with a sampling frequency of 1 Hz. A self-developed Unmanned Aerial Vehicleupper (UAV) was used to obtain the vertical profiles of the ambient temperature (T), relative humidity (RH), wind speed (WS), and wind direction (WD). The T, RH, WS, WD, and atmospheric pollution concentrations were observed at the ground-based observation site.
The pH and EC of the fog water were measured using a pH meter (Metrohm 827) and a conductivity meter (DDS-11A). In the laboratory, the fog water samples were ultrasonically shaken for 1 h, then filtered through a 0.22-μm aqueous filter head. Water-soluble ion concentrations were determined using a chromatograph (Metrohm 850 Professional IC), which included Na+, NH4+, K+, Mg2+, Ca2+, Cl−, NO2−, NO3−, and SO42-. The MetrosepC6-150/4.0 and MetrosepC4Guard/4.0 were used for cation separation and protection column models, respectively; the MetrosepASupp16-250/4.0 and MetrosepASupp16Guard/4.0 were used for anion separation and protection column models, respectively. We eluted the cations at 0.9 ml/min with 4 mmol/L HNO3 and the anions at 0.8 ml/min with 7.5 mmol/L Na2CO3 and 0.75 mmol/L NaOH. The volume of the quantitative loop for anions and cations was 100 μL. The column temperature was maintained at 45°C. Ultrapure water was used to dilute the solution.
The minimum detection limits (MDLs) of Na+, NH4+, K+, Mg2+, Ca2+, Cl−, NO2−, NO3−, and SO42- were 0.0340, 0.0354, 0.0502, 0.0155, 0.0436, 0.0208, 0.2014, 0.0456, and 0.0270 mg/L, respectively; the lower limits of determination were 0.1361, 0.1417, 0.2008, 0.0622, 0.1743, 0.0830, 0.8057, 0.1824, and 0.1078 mg/L, respectively. The relative standard deviations (RSDs) were 0.23%–3.18%, and the corresponding recoveries were 80.5%–113.4%.
The pH and EC are the basic chemical characteristics of fog water, reflecting the acid–base balance and total ionic content. Table 1 compares the pH, EC, and main ion concentrations of fog water measured in this study with those reported in other studies. The pH range of three-stage fog water was 6.13–7.32, with an average value of 6.93, which is alkaline according to the definition of acid rain (pH > 5.6). Compared with the sea fog, the fog water in Donghai site had a higher pH and lower EC. In urban and suburban areas, the higher pH of fog water was mainly associated with relatively less SO42- and NO3− and more NH4+ and Ca2+.
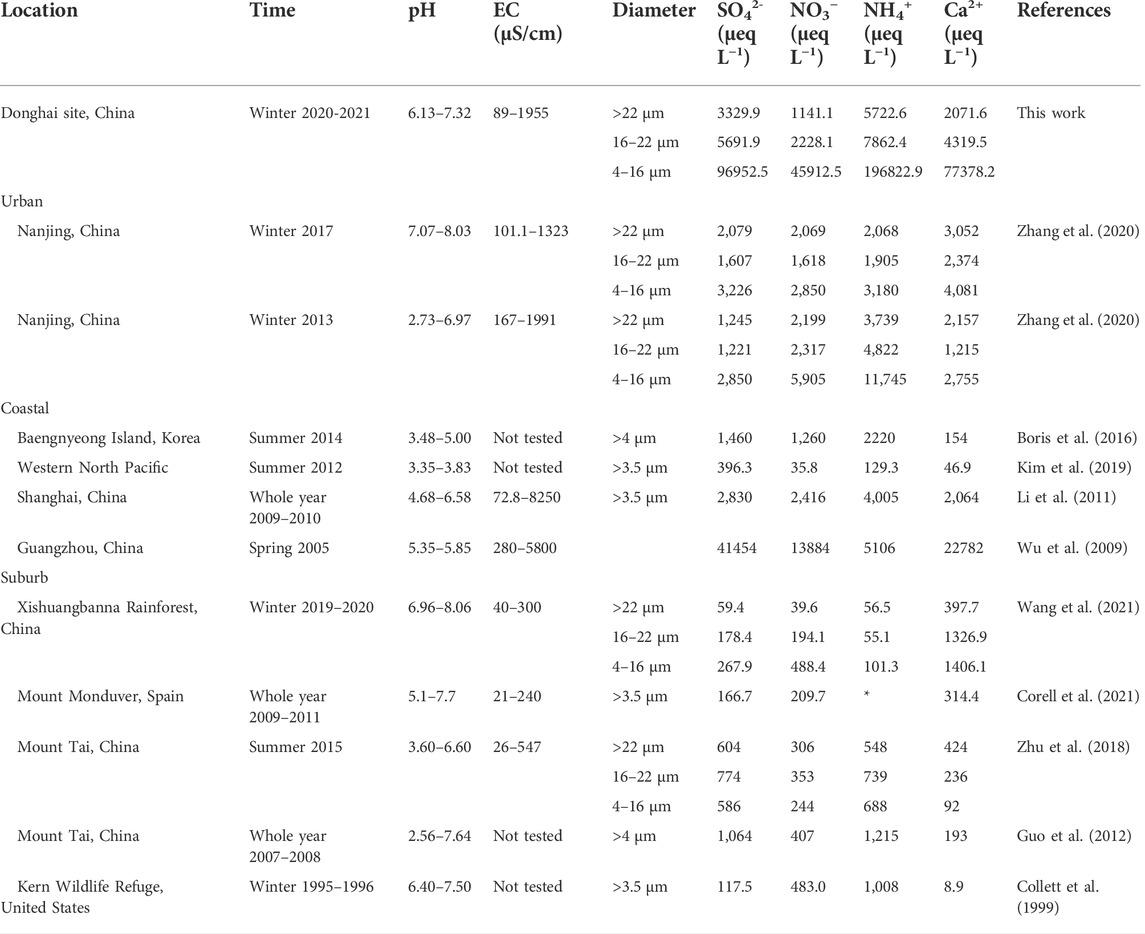
TABLE 1. Comparison of pH, electrical conductivity (EC), and main ion concentrations of fog water measured in different regions.
Figure 2 shows the pH, the assumed pH value without neutralization reaction (pAi), EC, and TIC of the three-stage fog water in Donghai site. The pH values were generally in the order of small, medium, and large droplets, indicating that small droplets were more acidic. The pAi value is the assumed pH value when no neutralization reaction occurs between sulfuric acid and nitrogen-containing acid in atmospheric liquid water (Hara et al., 1994). The volume-weighted mean (VWM) pH values of the three-stage fog water were 7.08, 6.97, and 6.50 for large, medium, and small droplets, respectively, whereas the VWM pAi values were 3.06, 2.70, and 1.33, respectively. Thus, the input acidity was much higher than the true acidity, indicating that the neutralizing ions in the fog water had a neutralizing effect on the acidity of the fog water. The EC tended to be proportional to the TIC. The EC and TIC were generally in the order of large, medium, and small droplets. The EC of the three-stage fog water in Donghai site ranged from 89 to 1955 μS/cm, similar to that of urban areas and higher than that of suburban areas. The EC of fog water in coastal regions is relatively high, but the ionic components in sea fog are mostly Na+ and Cl−; therefore, the EC does not visually reflect the regional pollution situation.
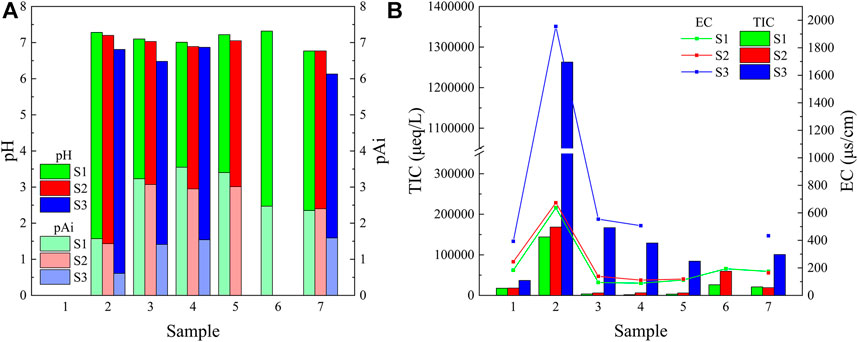
FIGURE 2. The values of (A) pH, pAi, (B) electrical conductivity (EC), and total ion concentration (TIC) in the three-stage fog water measured in Donghai site. The S1, S2, and S3 represent the sample for the large droplets of diameter larger than 22 μm, medium droplets of diameter within 16–22 μm, and small droplets of diameter within 4–16 μm, respectively.
We analyzed the ratios of acidic and basic substances in the fog water using the acidification potential (AP) and neutralization potential (NP) (Tsuruta., 1989). The slopes of the NP vs. AP linear regression for large, medium, and small droplets were 1.822, 1.425, and 2.018, respectively, indicating that non-sea-salt calcium (nssCa2+) and NH4+ played an important role in the fog water neutralization reaction, as shown in Figure 3. The order of pH values of the three-stage fog water was large > medium > small droplets, which is inconsistent with the slope. The reason was that the average equivalent concentration ratios of anions and cations in the three-stage fog water were 97.8%, 91.3%, and 77.1% for large, medium, and small droplets, respectively, indicating the possible contribution of organic acids and carbonic acid to the small droplet of fog water (Millet et al., 1996).
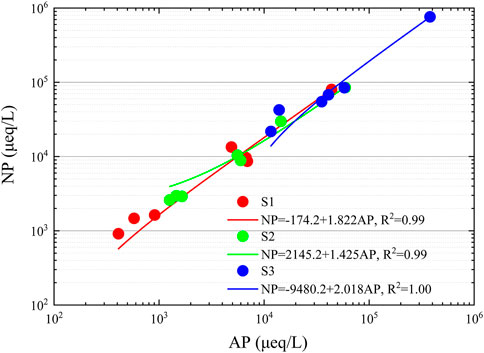
FIGURE 3. Relationship between the acidification potential (AP) and neutralization potential (NP) of three-stage fog water in Donghai site. The S1, S2, and S3 represent the sample for the large droplets of diameter larger than 22 μm, medium droplets of diameter within 16–22 μm, and small droplets of diameter within 4–16 μm, respectively.
Figure 4A shows water-soluble ion concentrations of the three-stage fog water in Donghai site. There were relatively high concentrations of water-soluble ions in the three-stage fog water. The VWM TIC for large, medium, and small droplets were 14935.8, 24294.7, and 463527.9 μeq/L, respectively, which were much higher than those in other regions, such as Nanjing in 2017 (Zhang et al., 2021), Mount Lu in 2016 (Hu et al., 2019), and Zhanjiang in 2011 (Yue et al., 2014). The VWM water-soluble ion concentrations were the largest in small droplets, indicating that small droplets were the most enriched ionic components. Water-soluble ions were transferred to the aqueous phase mainly through the activation of CCN during droplet formation (Li et al., 2017b). Concentrations of SO42-, NO3−, and NH4+ were enriched in small droplets. As a gaseous precursor of SO42-, SO2 undergoes non-homogeneous oxidation on the droplets surface and is absorbed by the droplet in the aqueous phase for the aqueous-phase oxidation reaction. The photochemical reaction of NOx produces gaseous nitric acid, which is effectively absorbed by droplets. NH3 is easily combined with H2SO4 and HNO3 in atmospheric pollutants to form NH4SO4 and NH4NO3, which are important components of fine aerosol particles in the atmosphere. Combined with HCl, NH3 can generate NH4Cl as fine aerosol particles emitted into the atmosphere from coal combustion. Secondary ions such as SO42- are generated in higher concentrations in small droplets (Brewer et al., 1983). Small droplets correspond to a larger surface area per unit volume, which increases the diffusion rate of soluble gases and ions. Therefore, the size-dependent characteristics of fog water chemical components could be determined by a series of dynamic and complex interactions, including the CCN activation, droplets condensation, non-homogeneous chemical reactions between droplets and gas, and homogeneous chemical reactions occurring within the droplets.
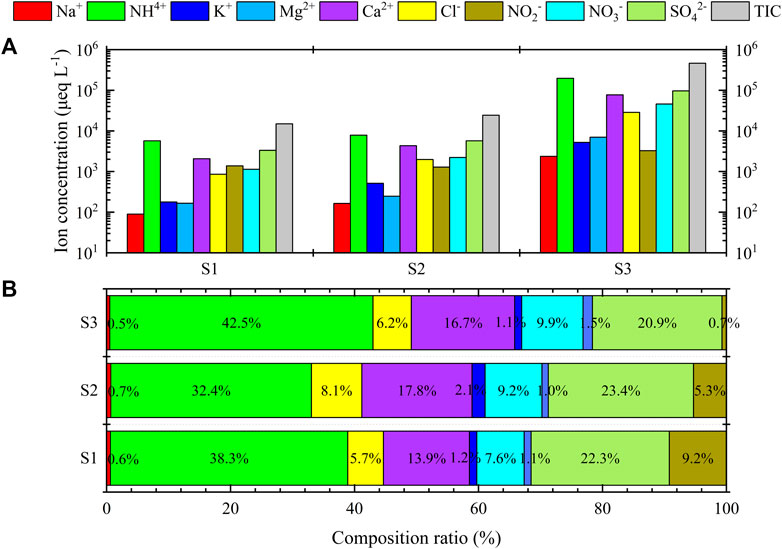
FIGURE 4. (A) Water soluble ion concentration and (B) the ratio of each component in three-stage fog water in Donghai site. TIC is total ion concentration. The S1, S2, and S3 represent the sample for the large droplets of diameter larger than 22 μm, medium droplets of diameter within 16–22 μm, and small droplets of diameter within 4–16 μm, respectively.
Figure 4B shows the ratio of ion concentration in the three-stage fog water in Donghai site. The main ions were SO42-, NO3−, NH4+, and Ca2+; they accounted for 82.1%, 82.8%, and 90.0% in the large, medium, and small droplets, respectively. NH4+ was the most concentrated cation and water-soluble ion in the three-stage fog water, with a higher concentration than that of SO42- and NO3−. Thus, it was sufficient to neutralize most acidic substances. SO42- was the major anion originating from the scavenging effect of droplets on aerosol particles. A large amount of SO2 was present in the air, absorbed, dissolved, and oxidized by the droplets (Collett et al., 2002). Different from previous studies (Li et al., 2017a; Zhu et al., 2018; Zhang et al., 2021), the proportion of NO2− concentration was more significant in Donghai site, following the order of large > medium > small droplets. In the absence of data, it is assumed that the nitrite observed in water droplets is entirely from gaseous HONO, which is the same limit suggested by Cape et al. (1992) in their study. There are three sources of atmospheric HONO, which are direct emissions (Su et al., 2011; Oswald et al., 2013), homogeneous reactions (Li et al., 2008; Li et al., 2014), and non-homogeneous reactions (Ammann et al., 1998; Liu and Abbatt, 2021). However, the homogeneous reaction is not important in generating atmospheric HONO, and the non-homogeneous reaction is its main source (Kleffmann et al., 2005). HONO is extremely unstable at relatively high ambient temperature; thus, it accumulates mainly at night and reaches its maximum before sunrise (Moore et al., 2004). During the daytime, the main source of the low HONO concentration is the gas-phase homogeneous reaction between OH radicals and NO. The reaction between NO2 and water vapor to form HONO and HNO3 (Chughtai et al., 1990) is responsible for the higher NO2− concentrations in fog water at night. Since HONO is a weak acid, its solubility increases with increasing pH (Seinfeld and Pandis, 1998). Thus, the order of the solubility of HONO in three-stage fog water follows large > medium > small droplets, leading to the proportion of NO2− in the fog water being maximum in the large droplets, followed by medium droplets and minimum in the small droplets. During this experiment, fog mainly occurred at night, and most fog samples were collected at night. After collection, we cryopreserved the fog water samples. Thus, the measurements should be reliable.
As shown in Figure 2, two persistent fog cases occurred on 11th and 12th December , 2020. The TIC of the three-stage fog water differed by 1–2 orders of magnitude, which has rarely been reported in previous studies. The reasons are discussed in the following.
Figure 5 shows the vertical profiles of T, RH, and WS detected by the UAV with weather element probes (See Section 4.3 for the division of fog phases). The first fog appeared as a double-layer thermal inversion structure. The height of the near-surface thermal inversion layer was about 150m, and the other existed at 600 to 800 m. The height of the fog top was determined to be between 600 and 700 m based on the RH>90% (Wang et al., 2019a). The stable inverse temperature promoted the formation and maintenance of fog. In the mature phase, turbulence developed near the fog top due to the decrease in the strength of inverse temperature. The effect of turbulence on fog has two aspects. The weak turbulence expands the fog and cooling layers, promoting fog development; however, strong turbulence enhances the mixing of fog and dry air, leading to fog dissipation or raising the fog layer to form low clouds (Rodhe, 1962; Barker, 1977; Jia et al., 2018). After sunrise, the strong turbulence and evaporation caused the fog dissipation.
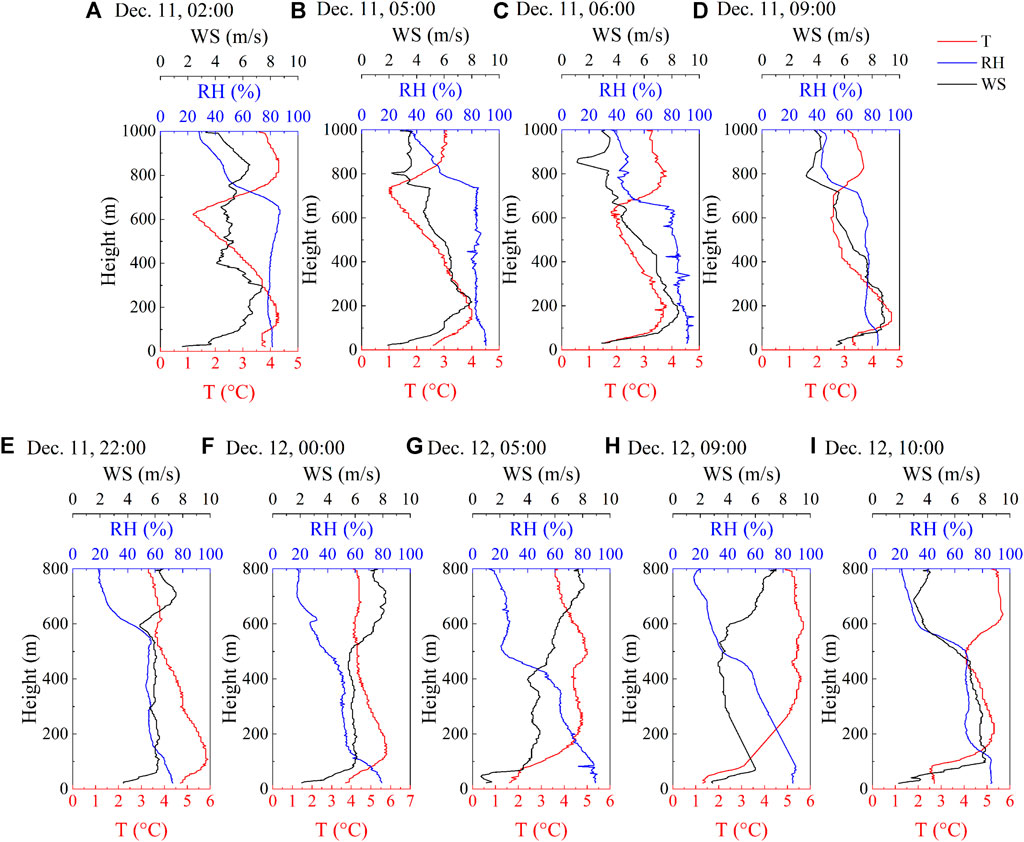
FIGURE 5. Vertical profiles of ambient temperature (T), relative humidity (RH), and wind speed (WS) during different phases of two persistent fog cases. [(A). pre-formation, (B). formation, (C). mature, and (D). dissipation phase of the first fog; (E). pre-formation, (F). formation, (G). development, (H). mature, and (I). dissipation phase of the second fog].
The second fog had a lower fog top height than the first fog. However, the height of the thermal inversion layer was higher, reaching 280 m and lasting 6 h during the development phase and up to 400 m during the mature phase. Strong gradient wind was an important factor driving the rapid dissipation of fog. During the dissipation phase, the WS within the fog layer rapidly increased with increasing height, the solar shortwave radiation enhanced, and the thermal inversion weakened. A strong, single-layer thermal inversion structure is conducive to fog development, and a multi-layer weak thermal inversion structure tends to dissipate fog (Li et al., 2017b; Wang et al., 2019a). In the two fog cases, the double-layer thermal inversion structure was found in the first fog, and the near-surface thermal inversion was found in the second fog, especially in the mature phase. After the end of the first fog, the inverse thermal effect during the daytime led to the inability of atmospheric pollutants to diffuse, and the strong near-surface thermal inversion of the second fog led to pollutants enrichment.
As shown in Figure 6, NH4+ was the most abundant water-soluble ion in the fog water for two persistent fog cases. The local source of such a high proportion of NH4+ concentration was the soil treatments at the observation site, leading to a large amount of ammonia produced by amino fertilizer, which dissolved in water and ionized to form ammonium ions, and ammonium salt input from surrounding agricultural activities (Collett et al., 1999). The second most abundant cation in the fog water was Ca2+, which increased by 13.3% in the large droplets. It proved that Ca2+ existed as a crustal element in coarse particles, and a large amount of sand and dust generated from manufacturing sites around the observation site may be the main reason for the higher Ca2+ concentration (Nieberding et al., 2018).
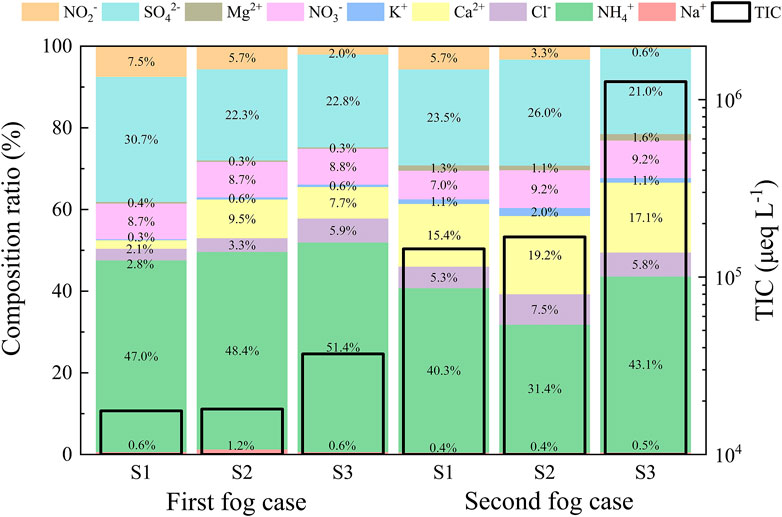
FIGURE 6. Total ion concentration (TIC) and the ratio of water-soluble ions in three-stage fog water for two persistent fog cases. The S1, S2, and S3 represent the sample for the large droplets of diameter larger than 22 μm, medium droplets of diameter within 16–22 μm, and small droplets of diameter within 4–16 μm, respectively.
The anions that substantially contributed to the components of the fog water for both fog cases were SO42- and NO3−, which were mainly sourced from secondary transformations of SO2 and NOx from anthropogenic emissions. Previous studies (Li et al., 2017a; Zhu et al., 2018; Zhang et al., 2021) have not reported such high concentration (and ratios) of NO2−. The direct emissions of HONO mainly originate from combustion processes (Harrison and Kitto, 1994). Exhaust gases from fuel combustion generate HONO during cooling; however, the amount of HONO is relatively small released in this way. The immediate release of HONO is more pronounced in areas with heavy traffic and pollution. The 2-day air quality index of the two fog cases indicated severe pollution, and the HONO directly released by straw and waste incineration on that day could not be ignored. The metabolic action of the many microorganisms in the fertilizer, which was applied to remediate the soil, produced high amounts of HONO at the observation site soil. It was also an important cause of the high NO2− concentrations in fog water (Su et al., 2011; Oswald et al., 2013). According to Section 3.2, the contribution of the homogeneous reaction of NO2 to HONO was relatively low at night. The non-homogeneous reaction of NO2 on the aerosol surface contributed to more than 70% of the atmospheric HONO concentration (Zhang et al., 2020). As fog droplets are the product of condensation and activation of water vapor on aerosol particles, the HONO generated from the non-homogeneous chemical reaction between NO2 and droplets is the main source of NO2− in droplets. Because of the high concentration of NO2 generated by incineration, the N and LWC of droplets in the second fog were lower than those in the first fog (Section 4.4), which indicated that the reaction degree between the droplets and NO2 in the second fog was lower than in the first fog. Therefore, compared to the second fog, there was a higher proportion of NO2− in the first fog.
Figure 7 shows the time series of the pollutant gases (SO2 and NO2) concentrations in the atmosphere and the water solute ions (SO42-, NO3−, and NO2−) concentrations in the fog water during the two fog cases. The concentration of NO2− was the highest in the large droplets and lowest in the small droplets, owing to the non-homogeneous chemical reaction of NO2 on the surface of the droplets. The concentrations of SO42- and NO3− were highest in small droplets and lowest in large droplets, owing to the larger total surface area of small droplets and high efficient gas-liquid transport. We observed a deviation between the pollutant gas concentrations and ion concentrations. The SO2 concentration in the atmospheric phase was much lower than NO2, while the SO42- concentration in the fog water was higher than the NO3− and NO2− concentrations. There is a connection between the pollutant gas in the atmospheric phase, the chemical components in the aerosol phase, and the chemical components in the fog-water phase. The concentrations of SO42- and NO3− in the aerosol phase depend mainly on the concentrations of SO2 and NO2 in the atmospheric phase, partly from the gas-particle transformation of pollutant gases in the atmosphere (secondary transformation) (Huang et al., 2014). In addition to the aerosol chemical components, the chemical components in the fog water depend on the fog scavenging effect (fog microphysical processes) and the liquid phase oxidation reactions in the fog water. Fog scavenging effect is the transfer of gases and atmospheric particles into the liquid phase of fog droplets (Collett et al., 2001). Fog scavenging efficiency varies between different chemical species, with fog having the highest scavenging efficiency for NO3−, and a slightly lower scavenging efficiency for SO42- (Gilardoni et al., 2014). However, a significant fraction of SO42- and NO3− in fog water originates from liquid phase oxidation, which generates sulfate faster than in the gas phase. Fog water samples were mainly collected at night, and NO2 was not fully oxidized to NO3− at night. Therefore, the concentration of NO2− should be considered together with NO3−. Collett et al. (1999) found that excessive differences in the pH of droplets in different particle size segments led to significant differences in the sulfur oxidation rates within the droplets. Smaller droplets with lower pH had faster oxidation rates and higher sulfate yields.
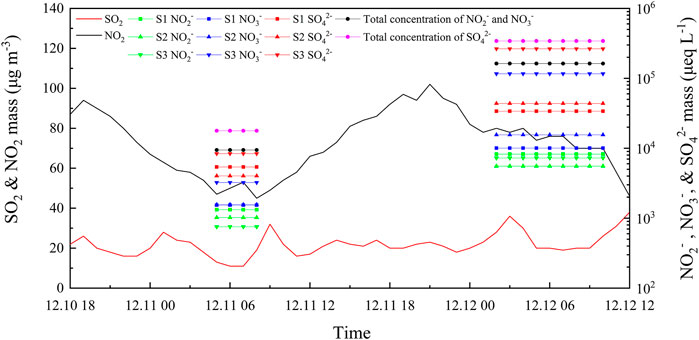
FIGURE 7. Time series of mass concentration of SO2 and NO2 in the atmosphere and SO42-, NO3−, and NO2− in fog water during the two persistent fog cases. The S1, S2, and S3 represent the sample for the large droplets of diameter larger than 22 μm, medium droplets of diameter within 16–22 μm, and small droplets of diameter within 4–16 μm, respectively.
Figures 8A,B show the time series of the meteorological conditions during the two fog cases. We divided the first fog case into four phases based on visibility, T, WS, and WD variations: (I) Pre-formation phase: from 2:00 to 3:15 on December 11, visibility fluctuated down to approximately 1,000 m, WS remained at 1.2 m/s, T did not substantially drop, and RH remained at about 94%. (II) Formation phase: from 3:15 to 5:15, T generally dropped, RH gradually increased, water vapor in the air reached a state of supersaturation, suspended in the air part of the aerosol particles as CCN were activated to form fog droplets, and fog gradually formed. Lower WS ensured the maintenance and development of fog. (III) Mature phase: from 5:15 to 7:20, visibility dropped to below 50 m in 15 min, developing into a strong, dense fog, and fog had the characteristics of explosive growth (Niu et al., 2010a). T remained at -1°C, RH was high, and WS decreased to 0 m/s. (IV) Dissipation phase: from 7:20 to 8:00, solar radiation enhanced after sunrise, surface T gradually rebounded, WS remarkably increased, and visibility rose to more than 1,000 m. After the first fog formed, the T dropped rapidly causing the fog to develop rapidly into a strong dense fog. But the second fog was accompanied by a slow drop in T and a gradual increase in RH, and the fog gradually developed into a strong dense fog. Similarly, we divided the second fog case into five phases: (V) Pre-formation phase: from 18:30 to 23:45 on December 11; (VI) Formation phase: from 23:45 on December 11 to 1:00 on December 12; (VII) Development phase: from 1:00 to 7:30 on December 12; (VIII) Mature phase: from 7:30 to 9:50; (IX) Dissipation phase: from 9:50 to 10:30.
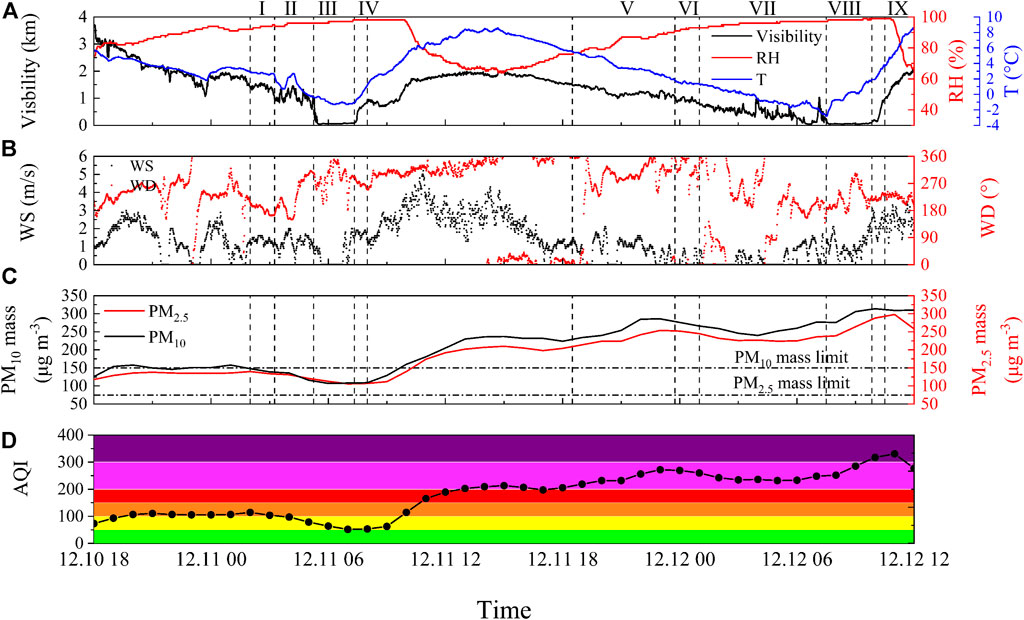
FIGURE 8. Time series of (a) visibility, relative humidity (RH), ambient temperature (T), (b) wind speed (WS) and wind direction (WD), (c) mass concentrations of particles with diameter less than 2.5 and 10 μm (PM2.5 and PM10), and (d) air quality index (AQI). I, II, III, and IV correspond to the pre-formation, formation, mature, and dissipation phase of the first fog case, respectively. V, VI, VIII, VIII, and IX correspond to the pre-formation, formation, development, mature, and dissipation phase of the second fog case, respectively.
Figures 8C,D show the time series of the particulate matter (PM) concentration, and AQI over time for the two fog cases. Before the two fog cases occurred, the accumulated aerosol particles in the atmosphere provided enough CCN for water vapor condensation, which activated into fog droplets. After the fog formation, the atmospheric PM concentration gradually decreased due to the reduction of nighttime emissions and the scavenging effect of fog. However, the atmospheric PM concentration increased slowly during the late phase of the second fog development. This was due to an increase in short-term wind speed, which slowed down the rate of fog droplet formation. Because of the increase in anthropogenic emissions after sunrise, PM concentrations continued to rise during the mature phase. As well as, the higher PM concentration reduced the ambient supersaturation, and aerosol particles suspended in the atmosphere could not be consumed. After the two fog cases dissipated, the fog droplets re-released aerosol particles after evaporation, and the PM concentration rebounded rapidly. At Mount Tai (Li et al., 2017a), researchers observed a strong positive correlation between the concentration of PM2.5 as CCN and TIC, with a high concentration of PM2.5 usually leading to a high TIC. The mean PM2.5 concentrations during the two fog cases in Lianyungang city were 118 and 242 μg/m3. The mean PM10 concentrations were 119 and 270 μg/m3, respectively, which may be related to the large number of secondary aerosol particles re-released by droplets and transported air at the end of the first fog, local emissions, and the boundary layer structure of the fog (Huang et al., 2014). The atmospheric PM concentrations during the second fog severely exceeded the particle concentration limits of the Chinese ambient air quality standards. However, the atmospheric pollution gases did not exceed the limit. This proves that the high concentration of aerosol particles can still cause severe fog pollution when the concentration of atmospheric pollution gases is not high, mainly due to the liquid phase oxidation reaction and fog scavenging effect. AQI is based on the percentage of various components in the atmosphere and is reduced to a single value to characterize short-term air quality conditions and trends. China’s air quality standards come from the Ambient Air Quality Standards (GB3095-2012) issued by the State Ministry of Environmental Protection. The 3-day AQI of Lianyungang City was 142, 206, and 254, corresponding to light, heavy, and heavy pollution. We collected fog water samples mainly in the early morning, which was more representative of the pollution level of the previous day. The haze worsened on December 11, and a strong thermal inversion effect led to the accumulation of pollutants near the surface. Therefore, the fog water collected in the second fog absorbed more pollutants than in the first fog.
Changes in the atmospheric aerosol concentration affect the ambient supersaturation, which affects the activation rate of CCN, leading to changes in the number of activated droplets. The liquid water content (LWC) reflects the degree of droplet dilution, and the dilution effect of fog water can further affect the chemical composition of the droplet. The LWC of the droplets is higher, and the ion concentration in the fog water is lower when the particle size of droplets is larger, or the number of large droplets is higher. Thus, there is an interaction between atmospheric aerosols and fog microphysical quantities, affecting the fog chemical characteristics. The changes in the microphysical quantities of droplets during two fog cases are discussed in Section 4.4.
Figure 9A shows the time series of the number concentration (N) of three-stage fog droplets during the two fog cases. During the formation phase of the first fog, the RH gradually increased, and the ambient water vapor could reach supersaturation. Owing to the poor reliability of the RH measurements at near-saturation conditions, the RH in Figure 8A was less than 100%. Thereto, CCN could activate into fog droplets, leading to an increase in N, especially for the small droplets. It should be noted that the interstitial aerosols could contribute significantly to N (Shen et al., 2018; Mazoyer et al., 2019; Wainwright et al., 2021), because of the generally low supersaturation in fogs and relatively high aerosol loading in this region. After 5:15 a.m. (beginning of the mature phase), the continuous activation (Devenish et al., 2012) and condensation processes caused a significant fog droplets number concentration at each stage. Later, the increase of WS could enhance the strength of collision-coalescence, sedimentation, and horizontal transport, thereby decreasing fog droplets number concentration. In addition, the influence of solar radiation led to droplet evaporation. In the development phase of the second fog, owing to the continuous decrease in T and increase in RH, the water vapor in the air reached saturation or even supersaturation. CCN activated to form droplets, leading to an increase in the number concentration of small droplets. In the mature phase, owing to the influence of human activities, the increasing aerosol loading consumed water vapor through hygroscopic growth, leading to weakening of the activation process (Guo et al., 2015; Wang et al., 2019b). As well as the enhancement in solar shortwave radiation accompanied this phase, the increase in temperature increased the strength of evaporation and deactivation processes (Niu et al., 2010a). Therefore, the N of droplets in the second fog was lower than in the first fog.
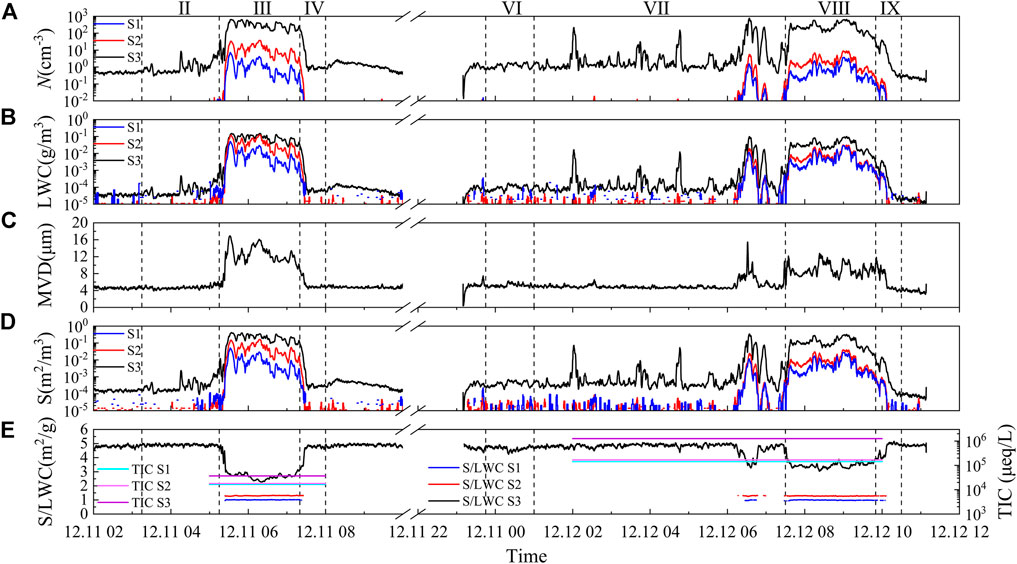
FIGURE 9. Time series of fog droplet (A) number concentration (N), (B) liquid-water content (LWC), (C) mean-volume diameter (MVD), (D) total surface area (S), and (E) ration of S to LWC (S/LWC) and total ion concentration (TIC) during the two persistent fog cases. The S1, S2, and S3 represent the sample for the large droplets of diameter larger than 22 μm, medium droplets of diameter within 16–22 μm, and small droplets of diameter within 4–16 μm, respectively. II, III, and IV correspond to the formation, mature, and dissipation phase of the first fog, respectively. VI VII, VIII, and IX correspond to the formation, development, mature, and dissipation phase of the second fog, respectively.
The transfer of gases or fine particles to droplets is a multistep process in which the larger the area of the gas–liquid interface, the stronger the pollutant absorption ability of the droplets (Niu et al., 2010a). The surface area of the droplet (S) reflects the absorption capacity of the droplet, whereas the LWC reflects the dilution capacity of the droplet. An increase in droplet’s LWC often accompanies an increase in S; therefore, both do not accurately reflect potential droplet scavenging efficiency. Lu et al. (2010) showed that S/LWC can reflect the combined droplet scavenging ability and dilution effect and that the TIC of fog water tends to be positively correlated with S/LWC. When S/LWC is large, the droplets have a strong scavenging capacity per unit LWC. As shown in Figures 9A,B,D, medium and large droplets differed more from small droplets in the order of magnitude of N during both fog cases. However, they narrowed the order of magnitude gap in LWC and S. The N and size of the droplets affect the S and LWC of droplets per unit volume. Between individual droplets, medium and large droplets have larger S and LWC. Compared between the two fog cases, the three-stage droplet LWC in the first fog is higher. On the one hand, the droplet N in the first fog is higher than in the second fog. On the other hand, due to the higher height of the first fog, the upper fog droplets collided with more droplets in gravity settlement, thus forming larger droplets, increasing the LWC of near-surface fog (as shown in Figure 9C) (Niu et al., 2010b). Figure 9D shows the variation in S/LWC and TIC with time for large, medium, and small droplets. The second fog had a longer fog water collection time and was collected in the development phase when the fog water S/LWC values were higher. The values were still higher in the mature phase than in the mature phase of the first fog. This proves that fog droplets of the second fog had a stronger potential scavenging capacity, and the TIC of fog water collected by the second fog was higher.
In the winter of 2020, we conducted a comprehensive fog experiment in Donghai site, an agricultural city in China. Based on these data, we summarized the chemical characteristics of three-stage fog water. Additionally, an interesting finding is that there was a significant difference in TIC observed in two persistent fog cases, which could be related to the effects of the atmospheric boundary layer structure, local impacts, aerosol-fog interactions, and fog scavenging effects. The conclusions are as follows:
The pH of the three-stage fog water was between 6.13 and 7.32, and the EC values ranged from 89 to 1955 μS/cm. Compared to the medium and large fog droplets, the small droplets of diameter within 4–16 μm had the lowest pH values and the highest EC and TIC. Non-sea-salt calcium (nssCa2+) and NH4+ played a critical role in the neutralization reaction of fog water. The ion concentration level of the three-stage fog water was relatively high, with the VWM TIC of small droplets reaching 463527.9 μeq/L. In the fog water, the main ions were SO42-, NO3−, NH4+, and Ca2+, which were all enriched in small droplets. It should be noted that a high concentration of NO2− was observed in fog water, especially in large droplets of diameter greater than 22 μm. The major reason could be that the non-homogeneous chemical reaction between NO2 and fog droplets generated HONO, which was dissolved in fog droplets with a variation in pH. The HONO produced by the combustion process and the metabolic action of microorganisms in the soil were also responsible for the high NO2− concentration.
The TIC difference in fog water measured on two fog cases on December 11 and 12, 2020, reached 1–2 orders of magnitude, which was rarely reported in previous studies. After the end of the first fog, fog droplets re-release secondary aerosol particles, increasing the aerosol loading. Additionally, the local emissions and the strong thermal inversion near the surface caused the enrichment of atmospheric pollutants. However, the atmospheric SO2, NO2 concentrations deviated from the concentrations of SO42-, NO3−, NO2− in the fog water. This proved that the ion concentration of aerosol particles as CCN did not contribute much to the ion concentration of fog droplets. The contribution was more to the liquid-phase oxidation reaction and scavenging effect of fog droplets. The high concentration of atmospheric PM in the second fog impacted the microphysical quantities of the fog, resulting in the smaller particle sizes of droplets during the second fog. Smaller droplets had a larger total surface area and faster liquid phase oxidation rate. The S/LWC parameter reflects the scavenging ability and dilution effect of fog droplets in an integrated manner, which tends to be positively correlated with TIC. The S/LWC values of the fog water during the second fog were higher than those of the fog water during the first fog during the fog water collection of both fog cases, indicating that the fog water of the second fog was more efficient in scavenging atmospheric pollutants.
In China, most of the urban fog experiments have been conducted in industrial and commercial cities, i.e., Beijing (Jia et al., 2018; Liu et al., 2019; Wu et al., 2022), Shanghai (Li et al., 2011; Xu et al., 2018), Nanjing (Lu et al., 2010; Niu et al., 2010a; Zhang et al., 2021); however, it is scarce in the agricultural city. This study helps fill the gap and shows the fog chemical characteristics in an agricultural city in China. However, due to the limitation of experiment conditions, the measurements of aerosol chemical composition, CCN number concentration, and turbulence were missing, which are supposed to supply in further fog experiments and analyzed their impacts on fogs in further studies.
The raw data supporting the conclusions of this article will be made available by the authors, without undue reservation.
PG: Formal analysis, observation and chemical analysis, data curation, drawing analysis, Writing—original draft. SF: Writing—review and editing, supervision, project administration. YW: Observation, writing—review andediting. SZ: Formal analysis, observation and chemical analysis. HW: Formal analysis, observation and chemical analysis. NS: Formal analysis, observation and chemical analysis. FZ: Formal analysis, observation and chemical analysis.
This work was supported by National Natural Science Foundation of China (42075066, 42075063); the National Key Research and Development Program of China (2018YFC1507905); the Innovative Project of Postgraduates in Jiangsu Province (KYCX21_0970). We sincerely thank the Donghai County Meteorological Bureau for providing the relevant data and for their support and assistance during the observation period.
The authors declare that the research was conducted in the absence of any commercial or financial relationships that could be construed as a potential conflict of interest.
All claims expressed in this article are solely those of the authors and do not necessarily represent those of their affiliated organizations, or those of the publisher, the editors and the reviewers. Any product that may be evaluated in this article, or claim that may be made by its manufacturer, is not guaranteed or endorsed by the publisher.
abrRH, relative humidity; abrAQI, air quality index; abrMDLs, minimum detection limits; RSDs, relative standard deviations; AP, acidification potential; CASCC1, Caltech Active Strand Cloudwater Collector;CCN, cloud condensation nodule; EC, electrical conductivity; LWC, liquid-water content; MVD, mean-volume diameter; N, number concentration; NP, neutralization potential; nssCa2+, non-sea-salt calcium; PM, particulate matter; S, surface area; TIC, total ion concentration; T, temperature; VWM, volume-weighted mean; WS, wind speed;WD, wind direction.
Ammann, M., Kalberer, M., Jost, D. T., Tobler, L., Rössler, E., Piguet, D., et al. (1998). Heterogeneous production of nitrous acid on soot in polluted air masses. Nature 395, 157–160. doi:10.1038/25965
Barker, E. H. (1977). A maritime boundary-layer model for the prediction of fog. Bound. Layer. Meteorol. 11, 267–294. doi:10.1007/bf02186082
Boris, A. J., Lee, T., Park, T., Choi, J., Seo, S. J., and Collett, J. L. (2016). Fog composition at Baengnyeong Island in the eastern Yellow Sea: detecting markers of aqueous atmospheric oxidations. Atmos. Chem. Phys. 16 (2), 437–453. doi:10.5194/acp-16-437-2016
Brewer, R. L., Gordon, R. J., Shepard, L. S., and Ellis, E. C. (1983). Chemistry of mist and fog from the los angeles urban area. Atmos. Environ. X. 17, 2267–2270. doi:10.1016/0004-6981(83)90224-x
Cape, J. N., Hargreaves, K. J., Storeton, W. R., Fowler, D., Colville, R. N., Choularton, T. W., et al. (1992). Nitrite in orographic cloud as an indicator of nitrous acid in rural air. Atmos. Environ. Part A. General Top. 26A (13), 2301–2307. doi:10.1016/0960-1686(92)90361-n
Chughtai, A. R., Welch, W., Akhter, M. S., and Smith, D. M. (1990). A spectroscopic study of gaseous products of soot - oxides of nitrogen/water reactions. Appl. Spectrosc. 44, 294–298. doi:10.1366/0003702904085598
Collett, J. L., Hoag, K. J., Sherman, D. E., Bator, A., and Richards, L. W. (1999). Spatial and temporal variations in San Joaquin Valley fog chemistry. Atmos. Environ. X. 33, 129–140. doi:10.1016/s1352-2310(98)00136-8
Collett, J. L., Sherman, D. E., Moore, K. F., Hannigan, M., and Lee, T. (2001). Aerosol particle processing and removal by fogs: Observations in chemically heterogeneous central California radiation fogs. Water air soil poll. Focus 1, 303–312. doi:10.1023/A:1013175709931
Collett, J. L., Bator, A., Sherman, D. E., Moore, K. F., Hoag, K. J., Demoz, B. B., et al. (2002). The chemical composition of fogs and intercepted clouds in the United States. Atmos. Res. 64, 29–40. doi:10.1016/s0169-8095(02)00077-7
Corell, D., Estrela, M. J., and Valiente, J. A. (2021). Chemical characterization in coastal fog and rain at Mount Monduver fog - collection station, Mediterranean Iberian Peninsula. Atmos. Res. 258, 105636. doi:10.1016/j.atmosres.2021.105636
Demoz, B. B., Collett, J. L., and Daube, B. C. (1996). On the Caltech active strand cloudwater collectors. Atmos. Res. 41, 47–62. doi:10.1016/0169-8095(95)00044-5
Devenish, B. J., Baetello, P., Brenguier, J. L., Collins, L. R., Grabowski, W. W., Ijzermans, R. H. A., et al. (2012). Droplet growth in warm turbulent clouds. Quart. J. Roy. Meteor Soc. 138 (667), 1401–1429. doi:10.1002/qj.1897
Gilardoni, S., Massoli, P., Giulianelli, L., Rinaldi, M., Paglione, M., Pollini, F., et al. (2014). Fog scavenging of organic and inorganic aerosol in the Po Valley. Atmos. Chem. Phys. 14, 6967–6981. doi:10.5194/acp-14-6967-2014
Guo, J., Wang, Y., Shen, X. H., Wang, Z., Lee, T., Wang, X. F., et al. (2012). Characterization of cloud water chemistry at Mount Tai, China: Seasonal variation, anthropogenic impact, and cloud processing. Atmos. Environ. X. 60, 467–476. doi:10.1016/j.atmosenv.2012.07.016
Guo, L. J., Guo, X. L., Fang, C. G., and Zhu, S. C. (2015). Observation analysis on characteristics of formation, evolution and transition of a long - lasting severe fog and haze episode in North China. Sci. China Earth Sci. 58 (03), 329–344. doi:10.1007/s11430-014-4924-2
Gurciullo, C. S., and Pandis, S. N. (1997). Effect of composition variations in cloud droplet populations on aqueous-phase chemistry. J. Geophys. Res. 102, 9375–9385. doi:10.1029/96jd03651
Hara, H., Kitamura, M., Mori, A., Noguchi, I., Ohizumi, T., Seto, S., et al. (1994). Precipitation chemistry in Japan 1989 - 1993. Water Air Soil Pollut. 85, 2307–2312. doi:10.1007/bf01186178
Harrison, R. M., and Kitto, A. (1994). Evidence for a surface source of atmospheric nitrous acid. Atmos. Environ. X. 28, 1089–1094. doi:10.1016/1352-2310(94)90286-0
Hoag, K. J., Collett, J. L., and Pandis, S. N. (1999). The influence of drop size-dependent fog chemistry on aerosol processing by San Joaquin Valley fogsfluence of drop size - dependent fog chemistry on aerosol processing by San Joaquin Valley fogs. Atmos. Environ. X. 33, 4817–4832. doi:10.1016/s1352-2310(99)00268-x
Hu, C. Y., Fan, S. X., Wang, X. L., Zhang, H. W., and Zhu, D. D. (2019). Chemical characteristics of the three - stage fog water in the winter of 2016 in Lushan. Acta Meteor Sin. 77 (4), 745–757. (in Chinese). doi:10.11676/qxxb2019.034
Huang, R. J., Zhang, Y. L., Bozzetti, C., Ho, K. F., Cao, J. J., Han, Y. M., et al. (2014). High secondary aerosol contribution to particulate pollution during haze events in China. Nature 514, 218–222. doi:10.1038/nature13774
Izhar, S., Gupta, T., and Panday, A. K. (2020). Scavenging efficiency of water soluble inorganic and organic aerosols by fog droplets in the Indo Gangetic Plain. Atmos. Res. 235, 104767. doi:10.1016/j.atmosres.2019.104767
Jia, X. C., Quan, J. N., Zheng, Z. Y., Liu, X. G., Liu, Q., He, H., et al. (2018). Impacts of anthropogenic aerosols on fog in North China Plain. J. Geophys. Res. Atmos. 124, 252–265. doi:10.1029/2018jd029437
Kim, H. Y., Lee, T., Park, T., Park, G., Collett, J. L., Park, K., et al. (2019). Ship - borne observations of sea fog and rain chemistry over the North and South Pacific Ocean. J. Atmos. Chem. 76 (4), 315–326. doi:10.1007/s10874-020-09403-8
Kleffmann, J., Gavriloaiei, T., Hofzumahaus, A., Holland, F., Koppmann, R., Rupp, L., et al. (2005). Daytime formation of nitrous acid: A major source of OH radicals in a forest. Geophys. Res. Lett. 32 (5), L05818. doi:10.1029/2005gl022524
Li, S. P., Matthews, J., and Sinha, A. (2008). Atmospheric hydroxyl radical production from electronically excited NO2 and H2O. Science 319 (5870), 1657–1660. doi:10.1126/science.1151443
Li, P. F., Li, X., Yang, C. Y., Wang, X. J., Chen, J. M., and Collett, J. L. (2011). Fog water chemistry in Shanghai. Atmos. Environ. X. 45, 4034–4041. doi:10.1016/j.atmosenv.2011.04.036
Li, X., Rohrer, F., Hofzumahaus, A., Brauers, T., Haeseler, R., Bohn, B., et al. (2014). Missing gas-phase source of HONO inferred from zeppelin measurements in the troposphere. Science 344 (6181), 292–296. doi:10.1126/science.1248999
Li, J. R., Wang, X. F., Chen, J. M., Zhu, C., Li, W. J., Li, C. B., et al. (2017a). Chemical composition and droplet size distribution of cloud at the summit of Mount Tai, China. Atmos. Chem. Phys. 17, 9885–9896. doi:10.5194/acp-17-9885-2017
Li, Z. Q., Guo, J. P., Ding, A. J., Liao, H., Liu, J. J., Sun, Y. L., et al. (2017b). Aerosol and boundary - layer interactions and impact on air quality. Natl. Sci. Rev. 4 (06), 810–833. doi:10.1093/nsr/nwx117
Liu, C., Hua, C., Zhang, H. D., Zhang, B. H., Wang, G., Zhu, W. H., et al. (2019). A severe fog-haze episode in Beijing-Tianjin-Hebei region: Characteristics, sources and impacts of boundary layer structure. Atmos. Pollut. Res. 10, 1190–1202. doi:10.1016/j.apr.2019.02.002
Liu, T. Y., and Abbatt, J. P. D. (2021). Oxidation of sulfur dioxide by nitrogen dioxide accelerated at the interface of deliquesced aerosol particles. Nat. Chem. 13 (12), 1173–1177. doi:10.1038/s41557-021-00777-0
Lu, C. S., Niu, S. J., Tang, L. L., Lv, J. J., Zhao, L. J., and Zhu, B. (2010). Chemical composition of fog water in Nanjing area of China and its related fog microphysics. Atmos. Res. 97, 47–69. doi:10.1016/j.atmosres.2010.03.007
Mazoyer, M., Burnet, F., Denjean, C., Roberts, G. C., Haeffelin, M., Dupont, J. C., et al. (2019). Experimental study of the aerosol impact on fog microphysics. Atmos. Chem. Phys. 19, 4323–4344. doi:10.5194/acp-19-4323-2019
Millet, M., Sansui, A., and Wortham, H. (1996). Chemical composition of fogwater in an urban area: Strasbourg (France). Environ. Pollut. 94, 345–354. doi:10.1016/s0269-7491(96)00064-4
Moore, K. F., Sherman, D. E., Reilly, J. E., and Collett, J. L. (2002). Development of a multi-stage cloud water collector Part 1: Design and field performance evaluation. Atmos. Environ. X. 36, 31–44. doi:10.1016/s1352-2310(01)00476-9
Moore, K. F., Sherman, D. E., Reilly, J. E., and Collett, J. L. (2004). Drop size-dependent chemical composition in clouds and fogs. Part I. Observations. Atmos. Environ. X. 38, 1389–1402. doi:10.1016/j.atmosenv.2003.12.013
Munger, J. W., Waldman, D. J., Hoffman, M. R., and Hoffmann, M. R. (1983). Fog water chemistry in an urban atmosphere. J. Geophys. Res. 88, 5109–5121. doi:10.1029/jc088ic09p05109
Nieberding, F., Breuer, B., Braeckevelt, E., Klemm, O., Song, Q. H., and Zhang, Y. P. (2018). Fog water chemical composition on ailaoshan mountain, yunnan Province, SW China. Aerosol Air Qual. Res. 18, 37–48. doi:10.4209/aaqr.2017.01.0060
Niu, S. J., Lu, C. S., Liu, Y. G., Zhao, L. J., Lv, J. J., and Yang, J. (2010a). Analysis of the microphysical structure of heavy fog using a droplet spectrometer: A case study. Adv. Atmos. Sci. 27, 1259–1275. doi:10.1007/s00376-010-8192-6
Niu, S. J., Lu, C. S., Yu, H. Y., Zhao, L. J., and Lv, J. J. (2010b). Fog research in China: an overview. Adv. Atmos. Sci. 27 (3), 639–662. doi:10.1007/s00376-009-8174-8
Oswald, R., Behrendt, T., Ermel, M., Wu, D., Su, H., Cheng, Y., et al. (2013). HONO emissions from soil bacteria as a major source of atmospheric reactive nitrogen. Science 341, 1233–1235. doi:10.1126/science.1242266
Pandis, S. N., and Seinfeld, J. H. (1989). Mathematical modeling of acid deposition due to radiation fog. J. Geophys. Res. 94, 12911–12923. doi:10.1029/jd094id10p12911
Reilly, J. E., Rattigan, O. V., Moore, K. F., Judd, C., Sherman, D. E., Dutkiewicz, V. A., et al. (2001). Drop size-dependent S(IV) oxidation in chemically heterogeneous radiation fogs. Atmos. Environ. X. 35, 5717–5728. doi:10.1016/s1352-2310(01)00373-9
Rodhe, B. (1962). The effect of turbulence on fog formation. Tellus 14, 49–86. doi:10.1111/j.2153-3490.1962.tb00119.x
Seinfeld, J. H., and Pandis, S. N. (1998). Atmospheric chemistry and physics: From air pollution to climate change. New York, NY: Wiley-Interscience.
Shen, C. Y., Zhao, C. S., Ma, N., Tao, J. C., Zhao, G., Yu, Y., et al. (2018). Method to estimate water vapor supersaturation in the ambient activation process using aerosol and droplet measurement data. J. Geophys. Res. Atmos. 123, 10606–10619. doi:10.1029/2018jd028315
Spiegel, J. K., Zieger, P., Bukowiecki, N., Hammer, E., Weingartner, E., and Eugster, W. (2012). Evaluating the capabilities and uncertainties of droplet measurements for the fog droplet spectrometer (FM-100). Atmos. Meas. Tech. 5, 2237–2260. doi:10.5194/amt-5-2237-2012
Su, H., Cheng, Y., Oswald, R., Behrendt, T., Trebs, I., Meixner, F. X., et al. (2011). Soil nitrite as a source of atmospheric HONO and OH radicals. Science 333, 1616–1618. doi:10.1126/science.1207687
van Pinxteren, D., Fomba, K. W., Mertes, S., Müller, K., Spindler, G., Schneider, J., et al. (2016). Cloud water composition during HCCT-2010: Scavenging efficiencies, solute concentrations, and droplet size dependence of inorganic ions and dissolved organic carbon. Atmos. Chem. Phys. 16, 3185–3205. doi:10.5194/acp-16-3185-2016
Wainwright, C., Chang, R. Y. W., and Richter, D. (2021). Aerosol activation in radiation fog at the atmospheric radiation program Southern Great Plains site. JGR. Atmos. 126, e2021JD035358. doi:10.1029/2021jd035358
Wang, T. J., Gao, T. C., Zhang, H. S., Ge, M. F., Lei, H. C., Zhang, P. C., et al. (2019a). Review of Chinese atmospheric science research over the past 70 years: Atmospheric physics and atmospheric environment. Sci. China Earth Sci. 62 (12), 1903–1945. doi:10.1007/s11430-019-9536-1
Wang, Y., Niu, S. J., Lv, J. J., Lu, C. S., Xu, X. Q., Wang, Y. Y., et al. (2019b). A new method for distinguishing unactivated particles in cloud condensation nuclei measurements: Implications for aerosol indirect effect evaluation. Geophys. Res. Lett. 46, 14185–14194. doi:10.1029/2019gl085379
Wang, Y., Niu, S. J., Lu, C. S., Lv, J. J., Zhang, J., Zhang, H. W., et al. (2021). Observational study of the physical and chemical characteristics of the winter radiation fog in the tropical rainforest in Xishuangbanna, China. Sci. China Earth Sci. 64 (11), 1982–1995. doi:10.1007/s11430-020-9766-4
Wu, D., Li, F., Deng, X. J., Bi, X. Y., Wang, X. H., and Huang, X. Y. (2009). Study on the chemical characteristics of polluting fog in Guangzhou area in spring. J. Trop. Meteor 15 (1), 68–72. doi:10.3969/j.issn.1006-8775.2009.01.011
Wu, S., Tao, J. C., Ma, N., Kuang, Y., Zhang, Y. Y., He, Y., et al. (2022). Particle number size distribution of PM1 and PM10 in fogs and implications on fog droplet evolutions. Atmos. Environ. X. 277, 119086. doi:10.1016/j.atmosenv.2022.119086
Xu, X. M., Chen, J. M., Zhu, C., Li, J. R., Sui, X., Liu, L., et al. (2018). Fog composition along the Yangtze River basin: Detecting emission sources of pollutants in fog water. J. Environ. Sci. 71, 2–12. doi:10.1016/j.jes.2017.09.018
Yue, Y. Y., Niu, S. J., Zhao, L. J., and Xu, F. (2014). The influences of macro- and microphysical characteristics of sea-fog on fog-water chemical composition. Adv. Atmos. Sci. 31, 624–636. doi:10.1007/s00376-013-3059-2
Zhang, W. Q., Tong, S. R., Jia, C. H., Wang, L. L., Liu, B. X., Tang, G. Q., et al. (2020). Different HONO sources for three layers at the urban area of beijing. Environ. Sci. Technol. 54, 12870–12880. doi:10.1021/acs.est.0c02146
Zhang, S. R., Fan, S. X., Wang, Y., Ge, P. Y., Hu, C. Y., Zhu, D. D., et al. (2021). Chemical characteristics of size - resolved fog water at an urban site in Nanjing and the summit of Mt. Lu, East China. Atmos. Environ. X. 263, 118667. doi:10.1016/j.atmosenv.2021.118667
Zhang, Y. H., and Qin, Y. (1998). The chemical characteristics of springtime precipitation in Lushan Mountains, East China. J. Appl. Meteor. 37, 1143–1152. doi:10.1175/1520-0450(1998)037<1143:tccosp>2.0.co;2
Keywords: fog chemical compositions, size-dependent characteristics, atmospheric environment, aerosol-fog interactions, agricultural city
Citation: Ge P, Fan S, Wang Y, Zhang S, Wu H, Shao N and Zu F (2022) Chemical characteristics of three-stage fog water in an agricultural city in China. Front. Environ. Sci. 10:1003669. doi: 10.3389/fenvs.2022.1003669
Received: 26 July 2022; Accepted: 15 August 2022;
Published: 06 September 2022.
Edited by:
Xinyao Xie, Institute of Mountain Hazards and Environment (CAS), ChinaReviewed by:
Yue Zhou, Wuhan Institute of Heavy Rain, ChinaCopyright © 2022 Ge, Fan, Wang, Zhang, Wu, Shao and Zu. This is an open-access article distributed under the terms of the Creative Commons Attribution License (CC BY). The use, distribution or reproduction in other forums is permitted, provided the original author(s) and the copyright owner(s) are credited and that the original publication in this journal is cited, in accordance with accepted academic practice. No use, distribution or reproduction is permitted which does not comply with these terms.
*Correspondence: Shuxian Fan, c2h1eGlhbmZAbnVpc3QuZWR1LmNu; Yuan Wang, d2FuZ195dWFuQGx6dS5lZHUuY24=
Disclaimer: All claims expressed in this article are solely those of the authors and do not necessarily represent those of their affiliated organizations, or those of the publisher, the editors and the reviewers. Any product that may be evaluated in this article or claim that may be made by its manufacturer is not guaranteed or endorsed by the publisher.
Research integrity at Frontiers
Learn more about the work of our research integrity team to safeguard the quality of each article we publish.