 Yan Zhang
 Lei Zou
 Ping Li1,3*
 Ming Dou
94% of researchers rate our articles as excellent or good
Learn more about the work of our research integrity team to safeguard the quality of each article we publish.
Find out more
ORIGINAL RESEARCH article
Front. Environ. Sci. , 23 September 2022
Sec. Toxicology, Pollution and the Environment
Volume 10 - 2022 | https://doi.org/10.3389/fenvs.2022.1003421
Various pollutants are collected into rivers through runoff when rainstorms occur, which can harm the aquatic ecological environment, therefore, strengthening the analysis of river pollution sources before and after rainstorms can reduce the impact of rainstorm runoff periods in regard to the risk from river water pollutants. In this study, the water pollutant differential characteristics and pollution source identification in the Henan section in the Huaihe River Basin were explored before and after the extreme rainfall event, and the monitoring data for nine water quality indicators in the monitoring sections were selected. The changing and differential characteristics and processes of the water quality indicators in the Huaihe River Basin before and after the rainstorm were analyzed by using statistical analytical methods and the comprehensive water quality identification index (IWq), and the absolute contribution rates of pollution sources were calculated by the absolute principal components-multiple linear regression model (APCS-MLR). The results showed that the values of pH, DO (Dissolved oxygen) and EC (Electrical conductance) after the rainstorm were lower than those before the rainstorm, while the turbidity, CODMn (Permanganate index), NH3−N (Ammonia nitrogen), TP (Total phosphorus) and TN (Total nitrogen) increased after the rainstorm. The correlations between pH and DO and other water quality indicators increased after the rainstorm, while the correlations between WT (Water temperature), turbidity, CODMn, NH3−N, TP and TN decreased significantly after the rainstorm. The water pollution of each monitoring section increased after the rainstorm; for example, the water quality conditions at Zhoukou Kangdian (ZKKD), Xihua Zhifang (XHZF) and Suixian Banqiao (SXBQ) increased by 42.11, 36.84 and 25.73% to Class V of the environmental quality standards for surface water in China, respectively. The absolute contribution rates of the PC1 to CODMn and TP were 33.86 and 41.11% before the rainstorm, respectively. The absolute contribution rates of the PC2 to DO and TN were 50.77 and 60.26% after the rainstorm, respectively.
In recent years, extreme weather such as rainstorms, high temperatures and droughts, have gradually attracted people’s attention with the continuous warming of the global climate (Zhai et al., 2018; Che et al., 2019). Relevant studies have shown that the frequency and intensity of extreme precipitation events around the world are gradually increasing (Ali and Mishra, 2018; Dookie et al., 2019; Liang et al., 2020; Gan et al., 2021; Wang et al., 2021; Xu and Zhang, 2021). Extreme precipitation not only affects the development of economic and social stability but also endangers the regional ecological environment, such as rainstorms in Beijing on 21 July 2012; Wuhan on 23 July 2015; Henan on 20 July 2021; and New York on 1 September 2021.
Domestic garbage, agricultural non-point source pollutants, livestock and poultry breeding pollutants are collected into rivers through the runoff when rainstorms occur, which affects the river water ecological environment. Rainstorm runoff is one of the main factors affecting the deterioration of river water quality, and pollutants are carried and released from point and non-point sources to the water bodies of the rivers (Ma et al., 2015). Rainstorm events could drive the export of organic carbon and inorganic nutrients, and a number of studies have examined the complex linkage between rainstorms and nutrients (Yoon and Raymond, 2012; Parr et al., 2015; Fasching et al., 2016; Lee et al., 2019). Recent studies have shown that the water quality of the Dongjiang River has been affected by extreme rainstorm events for the last 38 years (Che et al., 2019). Rainstorm events could flush large amounts of terrestrial organic-rich material into lakes that are used for drinking water (Zhou et al., 2020), and the infiltration process of rainfall-runoff with different intensities and its impact on thermal stratification and water quality of the Jinpen Reservoir in Xi’an were explored (Hua et al., 2021; Huang et al., 2021). The comprehensive influence of different planting patterns on the water quality and rate of pollutant contribution by irrigation ditches in the rainy season in the western Erhai Basin were revealed (Xie et al., 2020), and the impacts of rainstorms on water quality upstream of the North Canal were systematically analyzed (Xin et al., 2021). The above studies mainly analyzed the changing characteristics of the water quality in rivers or reservoirs caused by rainstorms, while the comparative analysis of the contribution rates of water pollution sources before and after rainstorms was relatively limited.
At present, the methods of river water quality assessment mainly include the single factor index assessment method (Liu et al., 2019a), water quality index method (Tang and Wang 2019; Ustaoğlu et al., 2020; Aydin et al., 2021; Ustaoğlu et al., 2021), fuzzy mathematics assessment method (Li et al., 2016), artificial neural network method (Cha et al., 2018), and comprehensive water quality identification index (Liu et al., 2021). The comprehensive water quality identification index method (IWq) is the index evaluation method of the new evaluation method, which is characterized by both quantitative analysis of water quality and qualitative description of whether the comprehensive water quality reaches the standard, such as the variation characteristics of water quality in the Qingshui River, Ningxia section of the Yellow River and the middle and lower reaches of the Hanjiang River were evaluated (Ma et al., 2020; Ning and Li, 2020). The discharge inventory method, watershed model method and statistical method are commonly used to analyze river water pollution sources; for example, the main pollution sources and spatial differences in Niulanjiang River were identified by hierarchical cluster analysis and self-organizing feature mapping (Li et al., 2013), and the sources of nitrogen pollutants in the Muli River Basin in the Guangdong-Hong Kong-Macao Greater Bay Area were identified by ammonium isotope tracer technology and multiple linear mixing models (Qi et al., 2020), and the temporal and spatial differentiation characteristics and pollution sources of water quality in the Heihe River Basin, Huangshui River Basin, Wushui River Basin, and Ebinur Lake Basin in Xinjiang, offshore central Turkey, low-lying areas in northern Germany and Pazarsuyu Stream in Turkey were analyzed (Kowalkowski, et al., 2006; Lam et al., 2012; Qiu et al., 2017; Ren et al., 2017; Zhu et al., 2018; Wang et al., 2019a; Ustaoğlu and Tepe 2019).
In recent years, the APCS-MLR method has been widely used in the analysis of water pollution sources in surface water, groundwater and sediment; however, there have been few studies on the analysis of river water pollution sources before and after rainstorms, and the contribution rates of water pollution sources before and after a rainstorm were calculated and compared in this study. For example, the sources and main contributions of the surface water pollutants were quantitatively analyzed in the Tuohe River Basin, Caohai and Waihai in Dianchi Lake, upstream of the Yangtze River, three major rivers in South Florida, the Min River Basin and the coastal water in Hong Kong (Gholizadeh et al., 2016; Liu et al., 2019b; Zhang et al., 2020b; Cheng et al., 2020; Du et al., 2020; Hou et al., 2021). The groundwater pollution sources were identified and analyzed in the Hunhe River alluvial fan, Limin Development Zone of Harbin City, Tongchuan City, the typical mixed land-use area in southwestern China (Meng et al., 2017; Meng et al., 2018; Zhang et al., 2020a; Li et al., 2021). The sources of heavy metals in the surface sediments of the Baoxiang River in Dianchi Lake were analyzed by the APCS-MLR (Shi et al., 2020), the sources of N and P pollution were identified, and the contributions of each potential pollution source were apportioned in lowland urban rivers located on the northern Hangzhou-Jiaxing-Huzhou Plain in northern Zhejiang Province (Shen et al., 2021).
The non-point source pollution caused by rainstorm is typical, but the impact of non-point source pollution caused by sudden rainstorm on the water quality differentiation characteristics and contributions of source pollution are not clear. Therefore, to explore the water quality differential characteristics and pollution source identification of rivers before and after rainstorms, the 7.20 Henan rainstorm in 2021 was utilized as an opportunity, and the changing characteristics, differences and processes of river water quality indices in the Huaihe River Basin before and after rainstorm were analyzed by using statistical analytical methods and a comprehensive water quality identification index, and the absolute contribution rates of pollution sources were calculated by using the APCS-MLR. The research results could provide a reference for the planning and evaluation of water resources and the control and treatment of water pollution under extreme weather in the Huaihe River Basin.
There was a large-scale rainstorm event in central and northern Henan Province of China from July 17 to July 22 in 2021, mainly involving Zhengzhou city, Kaifeng city, Zhoukou city, Xinxiang city, Luohe city, Pingdingshan city, Xuchang city, Hebi city, Anyang city, Jiaozuo city, etc (Shi et al., 2021; Zhang et al., 2021; Dorina et al., 2022). According to statistics, there were 43 meteorological stations with precipitation exceeding 400 mm, 154 meteorological stations exceeding 300 mm, 467 meteorological stations exceeding 200 mm, and 1 426 meteorological stations exceeding 100 mm in Henan Province from 8:00 on July 18 to 12:00 on 20 July 2021. The accumulated precipitation of 73 meteorological stations in Zhengzhou city exceeded 500 mm, and the maximum cumulative precipitation was 875 mm at the Baizhai meteorological station in Xinmi County from 18:00 on July 18 to 0:00 on 21 July 2021. The daily precipitation at the meteorological stations in Zhengzhou, Dengfeng, Xinmi, Xingyang, and Gongyi exceeded the extreme value from the meteorological records. The precipitation at Zhengzhou meteorological station reached 201.9 mm at 16:00-17:00 on July 20 (Figure 1), exceeding the extreme value of hourly precipitation on land in China (http://data.cma.cn).

FIGURE 1. The 7.20 precipitation hydrograph of Zhengzhou City, Henan Province.
The Huaihe River Basin in Henan Province mainly includes the Shayinghe River system and the Guohe River system (Figure 2). The Shayinghe River is the largest tributary in the Huaihe River Basin, which has a length of 418 km in Henan Province and a drainage area of 28 800 km2 and mainly includes the Shahe River, Yinghe River and Jialuhe River. The Guohe River, which is located on the northern bank of the mid-reach of the Huaihe River, is the second-largest tributary in the Huaihe River Basin, with a total main-stream length of 423 km and a drainage area of 15 900 km2. The Huijihe River is the largest tributary of the Guohe River. The Huaihe River Basin in Henan Province is an important source of water for navigation and agricultural irrigation and an important grain production base and central plains economic zone. In addition, the Huaihe River system is also the main drainage channel for the cities in Henan Province, which plays an important role in the occurrence of flood disasters (He et al., 2019; Luo and Zuo, 2019; Zhang Y. et al., 2020).
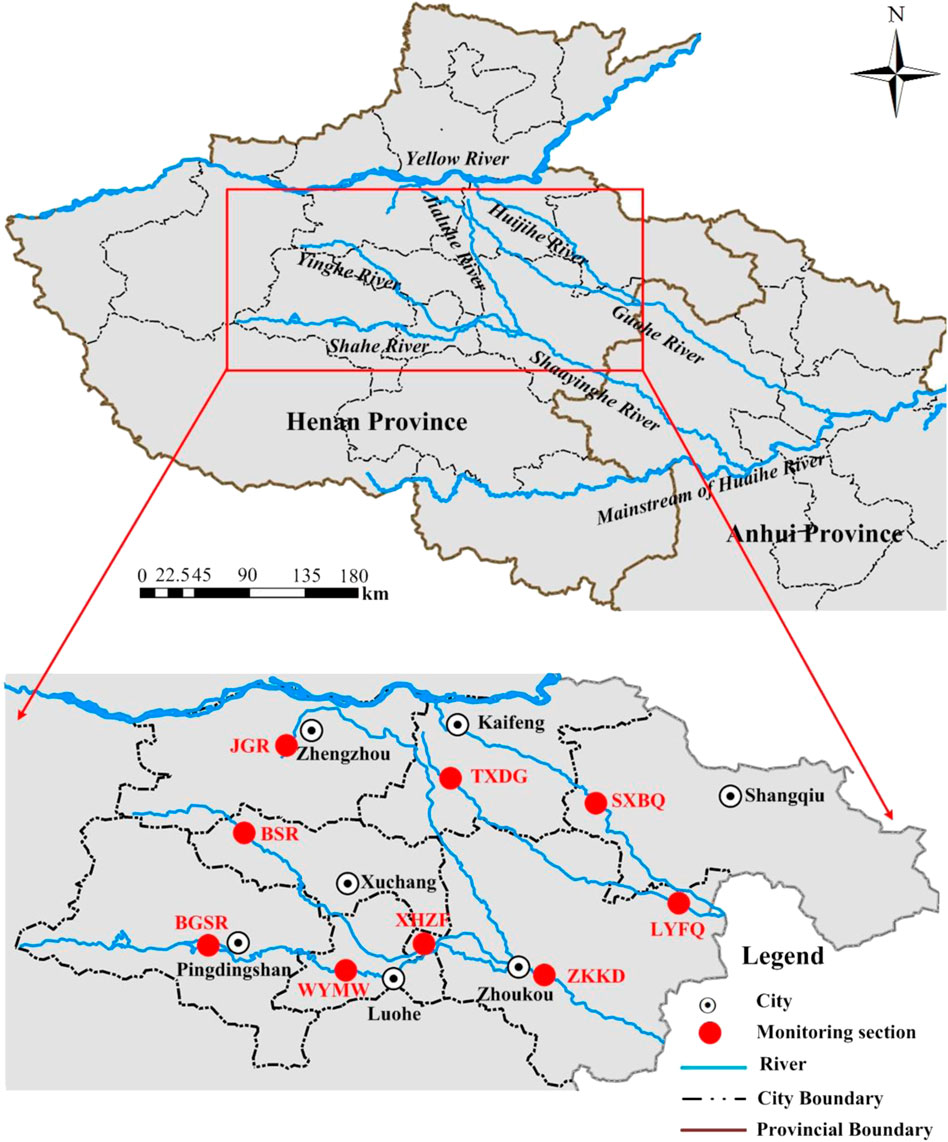
FIGURE 2. Water system map of the Huaihe River Basin in Henan Province and distribution of monitoring stations.
The data mainly came from the China National Environmental Monitoring Center (http://www.cnemc.cn) in this study, and the monitoring sections and water quality indicators were selected in the Huaihe River Basin in Henan Province before and after the rainstorm (Table 1; Figure 2). The data of water quality indicators were mainly collected from November 2020 to early July 2021 before the rainstorm, which were collected once a month. The monitoring dates of water quality indicators were from July 20 to August 7 in 2021 after the rainstorm, which reflected the changing process of the water quality condition after the rainstorm. The monitoring data of water quality indicators were analyzed by using the environmental quality standards for surface water (GB 3838-2002) (China’s State Environmental Protection Administration, 2002). In addition, the statistical analyzes and figures made of the monitoring data were used by the Excel 2016, IBM SPSS Statistics 19, and OriginPro 9.0.
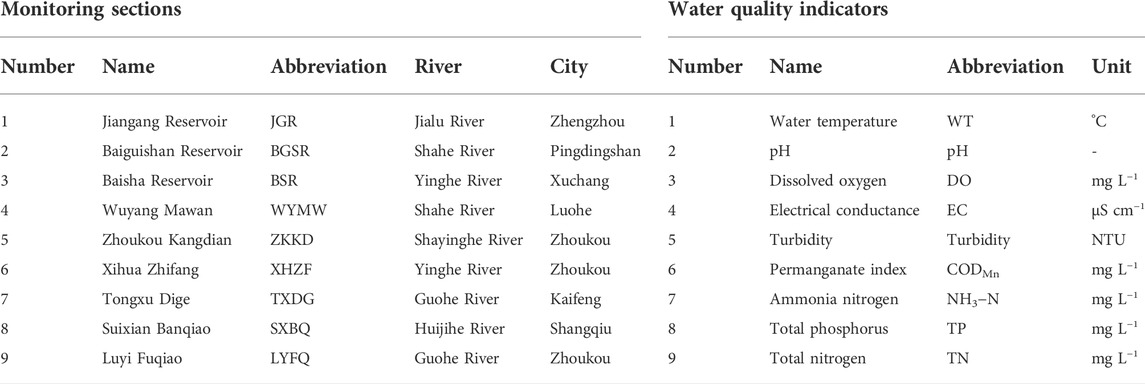
TABLE 1. Basic information of the monitoring sections and water quality indicators.
Spearman rank correlation coefficient method is a non-parametric index to measure the dependence of two variables, mainly using monotone equation to evaluate the correlation of two statistical variables. If there are no duplicate values in the two parameter index data, and when the two variables are completely monotonously correlated, the Spearman correlation rank coefficient is +1 or −1. The principle is to arrange the order of the sample values of the two parameters from small to large, and calculate the order of the sample values of each parameter instead of the actual data (Karthikeyan et al., 2017; Wang Y. L. et al., 2019).
where Xi and Yi are the data series values of the two parameters from small to large respectively; n is the number of data series; r is Spearman rank correlation coefficient.
The IWq can completely identify the water quality category and water quality situation and whether the target value of the water environmental function zone has been achieved. The water quality identification index method mainly includes three steps: calculation of the single-factor water quality identification index, calculation of the comprehensive water quality identification index and determination of the water quality category (Xu 2005; Zhang et al., 2017; Yang et al., 2020; Liu et al., 2021). Generally, the identification index consists of integer digits and 3 or 4 decimal places, and the structure is:
where X1. X2 is obtained by calculation, and X3 and X4 are obtained according to the comparison result. X1 is the overall comprehensive water quality category of the river; X2 is the position of the comprehensive water quality in the X1 water quality change interval, so as to realize the comparison of water quality in similar water; X3 is the number of individual indicators that are inferior to the target of the water environment function zone among the water quality indicators participating in the comprehensive water quality evaluation; X4 is the comparison result of the comprehensive water quality category and the water body functional area category, one or two significant figures depending on the pollution degree of the comprehensive water quality. In this study, the Huaihe River system is mostly used for fishery, industrial and agricultural purposes, and its water function zone targets are mainly Class III or IV.
where m is the number of individual water quality indicators participating in the comprehensive water quality evaluation; P1, P2, Pm are the single-factor water quality indexes of the first, second, and m water quality factors respectively, which are the integer and the first digit after the decimal point in the corresponding single-factor water quality identification index (X1. X2 in the single-factor water quality identification index).
Through the comprehensive water quality identification index X1. X2, the water quality category and pollution degree of water body can be judged: the water quality condition is Class I when 1.0 ≤ X1. X2 ≤ 2.0; the water quality condition is Class II when 2.0 < X1. X2 ≤ 3.0; the water quality condition is Class III when 3.0 < X1. X2 ≤ 4.0; the water quality condition is Class IV when 4.0 < X1. X2 ≤ 5.0; the water quality condition is Class V when 5.0 < X1. X2 ≤ 6.0; the water quality condition is inferior to Class V when 6.0 < X1. X2 ≤ 7.0, but not black and smelly; the water quality condition is inferior to Class V and black and smelly when X1. X2 > 7.0. According to the environmental quality standards for surface water (GB 3838-2002), Class I is mainly applicable to the source water and China national nature reserves; Class II is mainly applicable to the primary protected area of surface water sources for centralized drinking water, rare aquatic habitats, spawning grounds for fish and shrimp, feeding ground for larvae and juveniles, etc.; Class III is mainly applicable to the secondary protected area of surface water sources for centralized drinking water, wintering ground for fish and shrimp, migration routes, aquaculture area, and swimming area; Class IV is mainly applicable to the general industrial water area and recreational water area without direct contact with human body; and Class V is mainly applicable to the agricultural water area and general landscape requirements waters.
The APCS-MLR method is to obtain the absolute true score of the factors based on factor analysis after standardizing the original data, and then the contribution rates of common factors to the water indicators are calculated by multiple linear regression model, which is a reverse traceability method that is no need to construct component spectrum of pollution sources and the contribution rates of each pollution sources can be quantified (Zhou et al., 2007; Cheng et al., 2020).
First, the APCS-MLR should extract the principal components of water quality indicators and further serve as the basis for the discrimination and quantification of pollution sources (Meng et al., 2017; Du et al., 2020; Shi et al., 2020; Hou et al., 2021). The principal component score is calculated as follows:
where
The original contribution of principal components cannot be calculated directly because
Where i is the serial number of water quality indicator factor,
The equation of multiple linear regression takes the measured concentration (C) of the water quality indicator as the dependent variable and the APCS as the independent variable (Gholizadeh et al., 2016; Liu et al., 2019b; Zhang et al., 2020a; Zhang et al., 2020b; Cheng et al., 2020). The linear relationship between the measured concentration (Cj) of water pollutants and pollution sources (k) is as follows:
where
The contribution rates of pollution source (k) to the water pollutant (j) could be expressed by the following formula:
The contribution rates of the unidentified sources could be expressed by the following formula:
where
The statistical characteristics of the water quality indicators in the Henan section in the Huaihe River Basin before and after the rainstorm are shown in Table 2. The results showed that the minimum turbidity and CODMn values were 0.60 NTU and 1.22 mg L−1 at each monitoring section before the rainstorm, and the minimum values of pH, DO, EC and TN were 7.12, 0.64 mg L−1, 208.00 μS cm−1, and 0.05 mg L−1 after the rainstorm, respectively. The minimum values of NH3−N and TP were 0.03 mg L−1 and 0.01 mg L−1 before and after the rainstorm, respectively. The maximum variances of the WT and TN were 71.62 and 6.70 before the rainstorm, respectively, which indicated that the monitoring data of WT and TN had a greater degree of dispersion before the rainstorm. The maximum variances of pH, DO, EC, turbidity, CODMn, NH3−N and TP were 0.20, 11.83, 201 273.96, 34271.50, 9.93, 0.78 and 0.04 after the rainstorm, respectively, which indicated that the data of the water quality indicators had a greater degree of dispersion after the rainstorm.
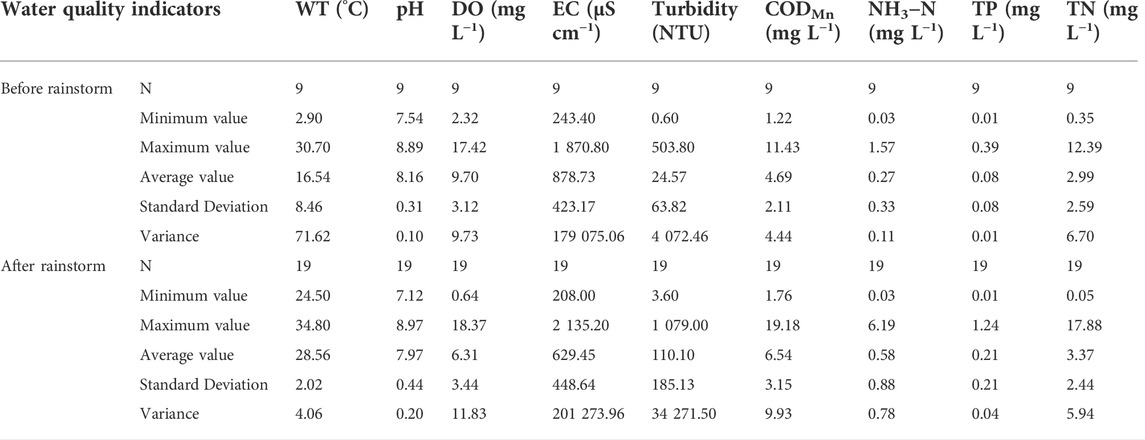
TABLE 2. Statistical description of water quality indicators before and after the rainstorm.
The pH, DO, and EC decreased after the rainstorm compared to before the rainstorm, and the average changing rates (ACRs) were −2.35%, −35.40% and −29.23%, respectively; which because the oxygen-consuming pollutants were carried into the rivers by the runoff after the rainstorm, and intensified the consumption of DO, therefore, the mass concentrations of DO showed an obvious decreasing trend after the rainstorm. The values of pH decreased by dilution and neutralization with increasing runoff (Figure 3).
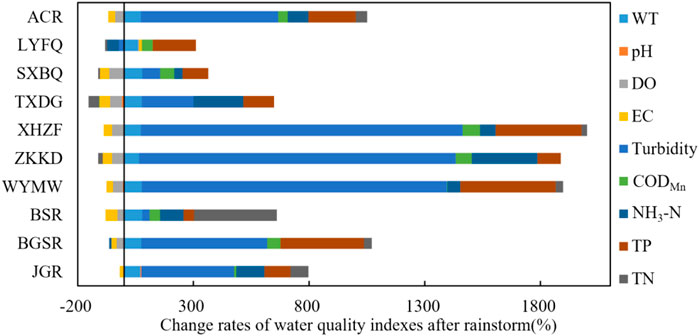
FIGURE 3. The changing rates of water quality indicators at each monitoring section before and after the rainstorm.
This study showed that the turbidity significantly increased after the rainstorm because of the large amount of particulate matter carried by rainstorm runoff, which could more intuitively reflect the specific situation of runoff flowing into the river after the rainstorm. A large amount of pollutants was carried into the river by rainstorm runoff, which increased the mass concentrations of CODMn, NH3−N, TP and TN, which was consistent with related research results (Li et al., 2015; Xin et al., 2021). The turbidity, CODMn, NH3−N, TP and TN increased after the rainstorm compared to before the rainstorm, and the average changing rates were 592.88, 41.01, 90.58, 203.97 and 49.35%, respectively (Figure 3).
In Figure 4, the WT showed a significant negative correlation with DO and TN before the rainstorm, with correlation coefficients of −0.52 and −0.35, respectively. There was a significant positive correlation between pH and DO before and after the rainstorm with correlation coefficients of 0.68 and 0.84, respectively, and the correlation increased after the rainstorm. The DO showed a smaller correlation with CODMn and TN before the rainstorm, but there was a significant negative correlation after the rainstorm with correlation coefficients of −0.37 and −0.32, respectively. There was a significant positive correlation between EC and CODMn before and after the rainstorm with correlation coefficients of 0.49 and 0.56, respectively, and the correlation increased after the rainstorm. The correlations between turbidity and NH3−N before and after the rainstorm were 0.62 and 0.63, respectively. The CODMn showed a significant positive correlation with NH3-N and TP before and after the rainstorm, and the correlation increased after the rainstorm. Before the rainstorm, NH3−N showed a significant positive correlation with TP and TN, but the correlation decreased after the rainstorm; TP and TN showed the significant positive correlation before the rainstorm, but the correlation decreased after the rainstorm.
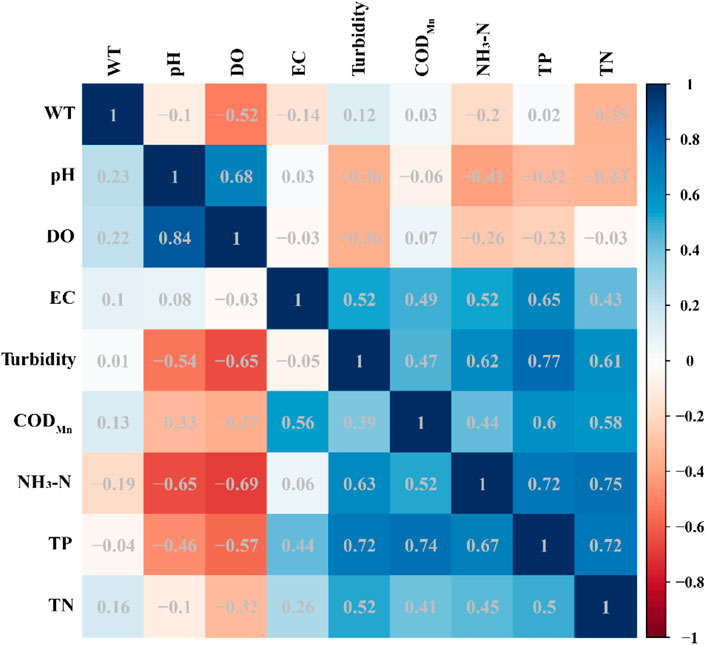
FIGURE 4. Correlation coefficients of water quality indicators in the Huaihe River Basin before and after the rainstorm. Note: the upper right corner is the correlation coefficients between the water quality indicators before the rainstorm, and the lower left corner is the correlation coefficients between the water quality indicators after the rainstorm.
On the whole, this study showed that the correlations of water quality indicators were affected by the rainstorm and the correlations between pH and DO and other water quality indices increased after the rainstorm, while the correlations between WT, turbidity, CODMn, NH3−N, TP and TN decreased significantly after the rainstorm, which indicated that the closeness between pH, DO and other water quality indicators was enhanced, while the closeness between other water quality indicators was weakened.
In summary, the correlations of water quality indicators were affected by the rainstorm to a certain extent in the Henan section in the Huaihe River Basin, indicating that a large number of pollutants were washed and eroded into the river water body through runoff when rainstorms occur, which had a greater impact on the river water quality indicators. Therefore, to make timely pollution control and prevention measures, the water quality indicators should be monitored for sudden rainstorms.
The water quality indicators of each monitoring section showed obvious fluctuations before and after the rainstorm; the pH, DO and EC decreased significantly after the rainstorm, and the turbidity, CODMn, NH3−N, TP and TN increased significantly after the rainstorm (Figure 5). The water quality indicators could be adjusted and restored through the water body’s own functions after the rainstorm. The time for each water quality indicator to reach the minimum or maximum value at each monitoring section was different after the rainstorm because of the influence of rainfall and runoff. For example, the turbidity reached its minimum value on July 24, July 20, July 21, July 21, July 22, July 25, July 25 and July 20 at JGR, BGSR, BSR, WYMW, ZKKD, XHZF, TXDG, SXBQ and LYFQ, respectively, which were 6.78, 5.99, 4.01, 1.08, 1.27, 1.40, 4.88, 0.85 and 4.54 NTU, respectively (Figure 5D). The mass concentrations of NH3−N reached their maximum values on July 24, July 23, July 21, July 21, July 23, July 20, July 23, July 22 and July 24 at JGR, BGSR, BSR, WYMW, ZKKD, XHZF, TXDG, SXBQ and LYFQ, respectively, which were 0.315 mg L−1, 0.032 mg L−1, 0.678 mg L−1, 1.050 mg L−1, 6.189 mg L−1, 1.500 mg L−1, 2.441 mg L−1, 1.960 mg L−1 and 0.110 mg L−1, respectively (Figure 5F).
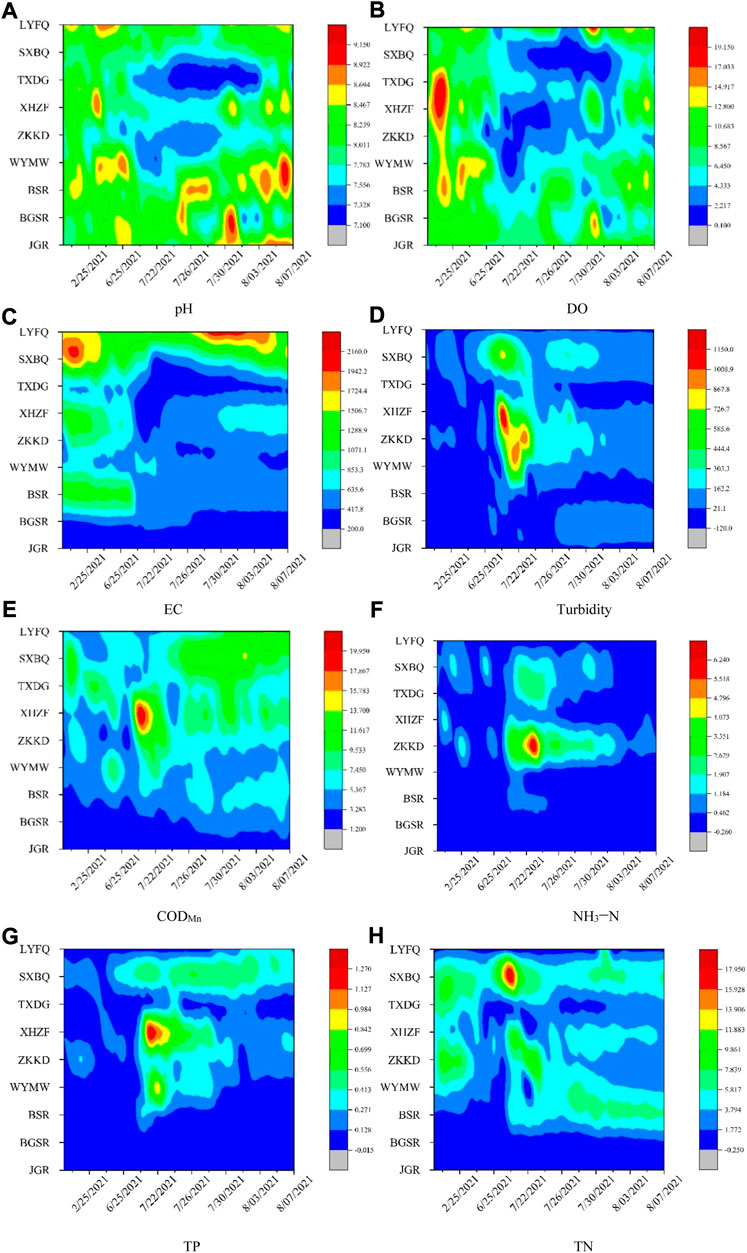
FIGURE 5. The change process of the pH (A), DO (B), EC (C), Turbidity (D), CODMn (E), NH3−N (F), TP (G), and TN (H) at different monitoring stations before and after the rainstorm. The heat maps show the trend of water quality indicators at each monitoring station before and after the rainstorm, which could intuitively see the time for each water quality indicator to reach the maximum or minimum value.
For pH, there was basically a decreasing trend at each monitoring section after the rainstorm, while there was a slight increasing trend at JGR and BSR. TXDG had the greatest difference before and after the rainstorm, with a decreasing range of 7.80% (Figure 6A). The mass concentration of DO after the rainstorm was basically lower than that before the rainstorm, and the reductions in the mass concentration of DO were more than 50% at XHZF, TXDG and SXBQ, which were significant differences before and after the rainstorm (Figure 6B). There were obvious differences at BSR and TXDG before and after the rainstorm, and the reduction rates reached 51.95 and 44.81%, respectively (Figure 6C). The turbidity at WYMW, ZKKD and XHZF increased by 1318.71, 1368.39 and 1392.06% after the rainstorm, respectively (Figure 6D). After the rainstorm, the mass concentrations of CODMn increased by 57.01, 68.90, 75.25 and 63.20% at BGSR, ZKKD, XHZF and SXBQ, respectively, with obvious differences (Figure 6E). The mass concentrations of NH3−N increased by 284.53 and 214.39% at ZKKD and TXDG, respectively, after the rainstorm, while the mass concentration of NH3−N decreased by 50.92% at LYFQ, respectively (Figure 6F). The mass concentrations of TP increased by more than 300% at BGSR, WYMW and XHZF after the rainstorm, while the mass concentration of TP increased by 46.93% at BSR (Figure 6G). For TN, the mass concentration of TN increased by 356.24% at BSR, while the mass concentration of TN decreased by 44.66% at TXDG (Figure 6H). In general, the water quality indicators had different degrees of differences before and after the rainstorm at each monitoring section; and differences in pH were the smallest, while differences in turbidity, NH3−N and TP were relatively large.
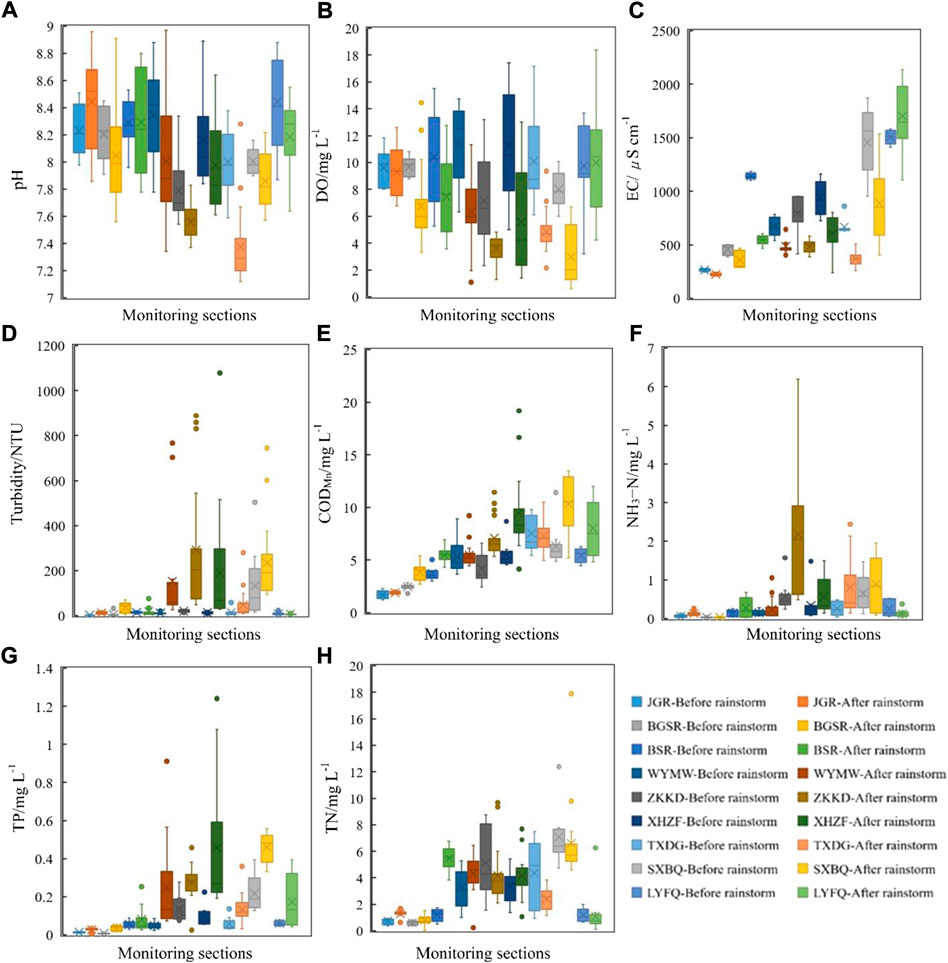
FIGURE 6. The differences of the pH (A), DO (B), EC (C), Turbidity (D), CODMn (E), NH3−N (F), TP (G), and TN (H) at each monitoring station before and after the rainstorm. Boxplots show the maximum, upper-quartile, median, lower-quartile, and minimum of the distribution across sites.
According to the spatial cluster analytical results of the IWq before and after the rainstorm (Figure 7), the IWq could be divided into three groups before the rainstorm: Group A included JGR and BGSR; Group B included BSR, LYFQ, WYMW, XHZF and TXDG; and Group C included ZKKD and SXBQ. The IWq could also be divided into three groups after the rainstorm: Group A included JGR, BGSR and LYFQ; Group B included BSR, WYMW and TXDG; and Group C included ZKKD, XHZF and SXBQ. The results showed that the degree of water pollution basically ranked as Group C > Group B > Group A, and the degree of water pollution in each group increased after the rainstorm.
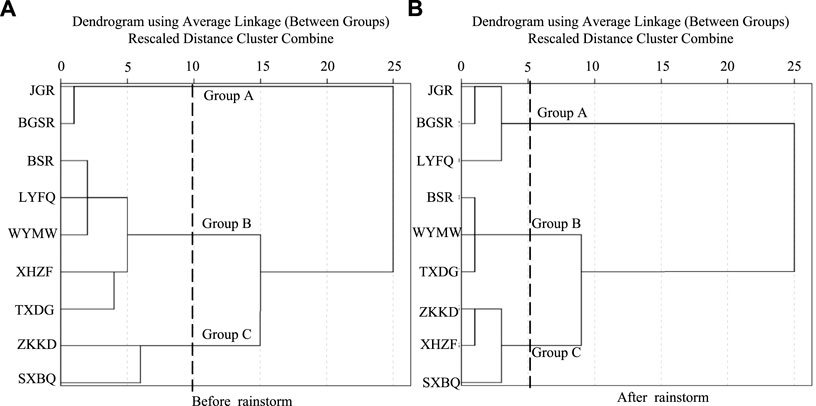
FIGURE 7. Spatial scale cluster analysis of the comprehensive water quality identification index before rainstorm (A) and after rainstorm (B). The spatial differences of the comprehensive water quality identification index at each monitoring station before and after the rainstorm according to the dendrogram using Average Linkage (Between Groups) Rescaled Distance Cluster Combine.
The IWq distribution in the monitoring section before and after the rainstorm was analyzed (Figure 8). The results showed that the water quality condition at BSR increased by 36.84% to Class IV, and the water quality condition in Class IV and Class V increased by 42.11 and 5.26%, respectively, at WYMW. The water quality condition at ZKKD increased by 42.11 and 15.79% to Class V and Inferior Class V, respectively, and the water quality condition of Class IV, Class V and Inferior Class V increased by 26.32, 36.84 and 10.53%, respectively, at XHZF. The water quality condition at TXDG increased by 52.63 and 10.53% to Class IV and Class V, respectively. The water quality condition at SXBQ increased by 25.73 and 36.84% to Class V and Inferior Class V, respectively. After the rainstorm, the water pollution of each monitoring section increased, indicating that the rainstorm had a greater impact on river water pollution. The water quality of the reservoir was better, indicating that the larger the water area was, the smaller the impact of the rainstorm on water pollution.
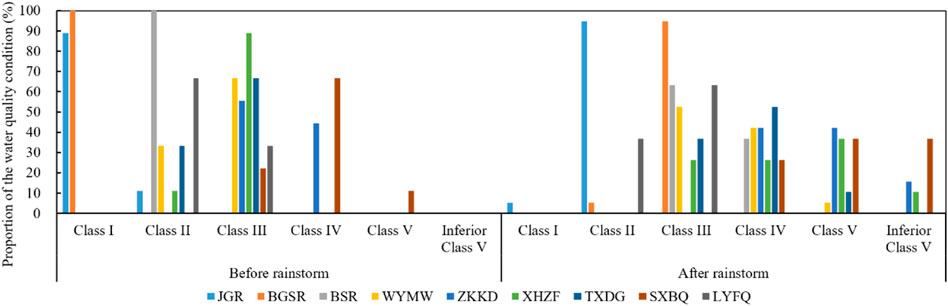
FIGURE 8. The distribution of the IWq of each monitoring section before and after the rainstorm.
According to the principal component analysis, the Kaiser-Meyer-Olkin (KMO) values were 0.566 and 0.686 before and after the rainstorm, respectively, indicating that the data series of the water quality indicators before and after the rainstorm was suitable for principal component analysis. The eigenvalues of the main components and the contribution rates of variances were obtained in the Henan section in the Huaihe River Basin before and after the rainstorm (Table 3), and the components with eigenvalues greater than 1 were identified as their principal components according to relevant studies (Zhang et al., 2017). Therefore, three principal components were extracted before and after the rainstorm, and the contribution rates of cumulative variance reached 72.361 and 72.75%, respectively.
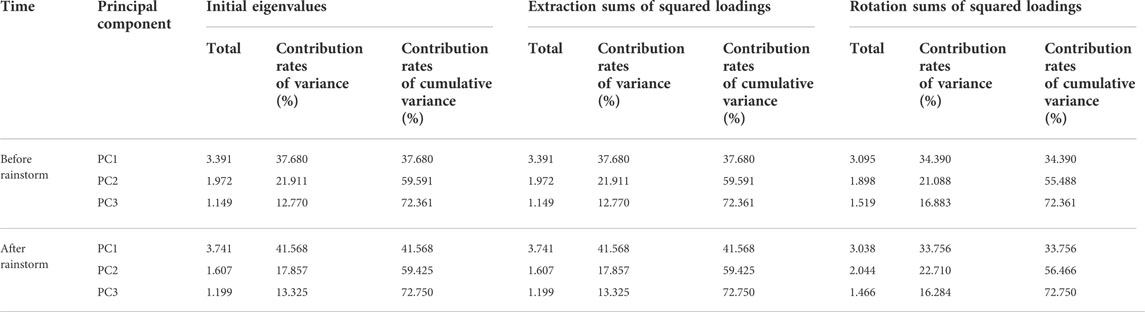
TABLE 3. Total variance in the interpretation of the main components of water quality indicators in the Huaihe River Basin before and after rainstorm.
Before the rainstorm (Figure 9A), the eigenvalue of the first principal component (PC1) extracted before the rainstorm was 3.391, and the contribution rate of variance was 37.680%. The main load water quality indicators were EC, turbidity, CODMn, NH3−N, TP and TN. The eigenvalue of the second principal component (PC2) was 1.972, and the contribution rate of variance was 21.911%. The main load water quality indicators were pH and DO. The eigenvalue of the third principal component (PC3) was 1.149, and the contribution rate of variance was 12.770%. The main load water quality indicator was WT. After the rainstorm (Figure 9B), the eigenvalue of the first principal component (PC1) extracted was 3.741, and the contribution rate of variance was 41.568%. The main load water quality indicators were turbidity, CODMn, NH3−N, TP and TN. The eigenvalue of the second principal component (PC2) was 1.607, and the contribution rate of variance was 17.857%. The main load water quality indicators were WT, pH and DO. The eigenvalue of the third principal component (PC3) was 1.199, and the contribution rate of variance was 13.325%. The main load water quality indicator was EC.
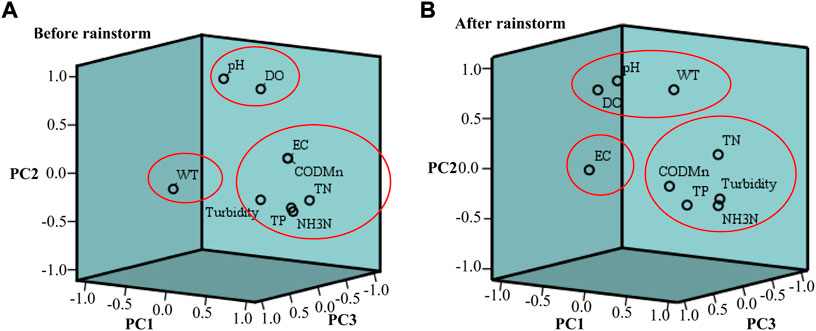
FIGURE 9. The rotation factor load of water quality indicators before rainstorm (A) and after rainstorm (B) in the Huaihe River Basin. The sample data passed the test of the Kaiser-Meyer-Olkin (KMO) and Bartlett, the principal components were identified by the eigenvalues greater than 1.
The linear fitting results of the predictive values and measured values of water pollutants before and after the rainstorm are shown in Figure 10. The results indicated that the R2 values of the linear fitting were all above 0.50 between the predicted values and measured values of DO, TP and TN before and after the rainstorm. The R2 values of the linear fitting was 0.1856 between the predicted values and measured values of CODMn before the rainstorm but was 0.7613 after the rainstorm. The R2 values of the linear fitting was approximately 0.47 between the predicted values and measured values of NH3−N before and after the rainstorm. Overall, the APCS-MLR was basically reliable, and the calculation results were more reliable.
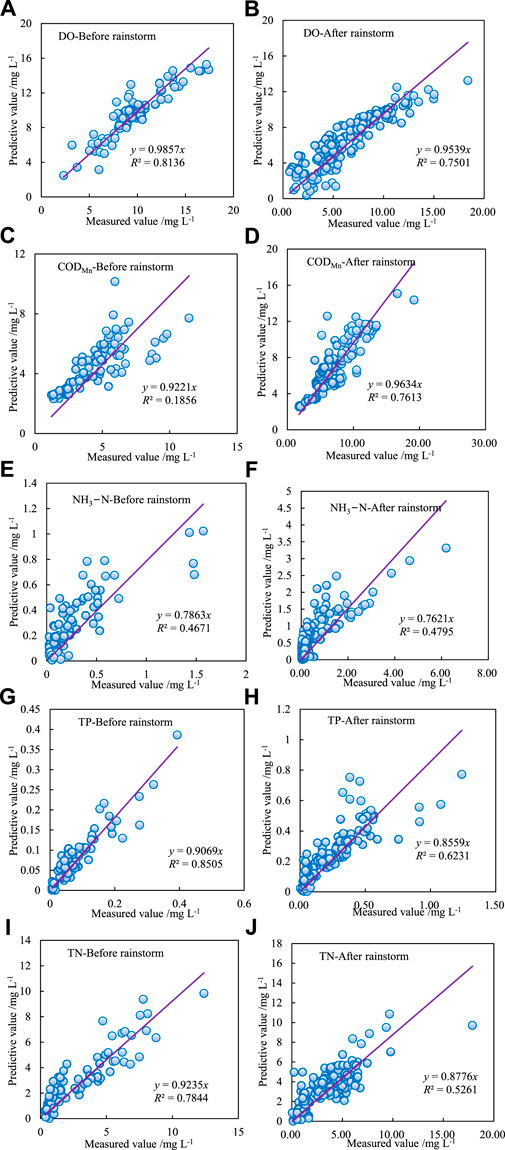
FIGURE 10. Comparison between the measured value and predicted value of the DO (A), CODMn (C), NH3−N (E), TP (G), and TN (I) before rainstorm, and the DO (B), CODMn (D), NH3−N (F), TP (H), and TN (J) before rainstorm. The functional relationships between each principal component and water pollutants were established, and the water pollutants were predicted before and after the rainstorm.
In Figure 11, the absolute contribution rate of DO from the PC2 before the rainstorm was 56.29%, and the absolute contribution rates of the PC2 and unidentified pollution sources were 50.77 and 47.35% after the rainstorm, respectively. The impact of the PC2 on DO decreased after the rainstorm, while the impact of unidentified pollution sources on DO increased. The absolute contribution rates of CODMn form the PC1 and unidentified pollution sources were 33.86 and 38.04% before the rainstorm, respectively. The absolute contribution rate of unidentified pollution sources was 43.12% after the rainstorm, and the impact of the PC3 and unidentified pollution sources on CODMn increased. The absolute contribution rates of NH3−N form the PC2 and unidentified pollution sources were 39.09 and 37.01% before the rainstorm, respectively, while the absolute contribution rates of NH3−N increased after the rainstorm, which were 45.09 and 51.62%, respectively. The absolute contribution rates of TP form the PC1 and the PC2 were 41.11 and 45.59% before the rainstorm, respectively. The absolute contribution rates of TP from the PC2 and unidentified pollution sources were 45.43 and 47.51%, respectively, after the rainstorm, and the impact of the unidentified pollution sources on TP increased. The absolute contribution rates of TN from the PC1 and the PC2 were 31.05 and 35.79% before the rainstorm, respectively. The absolute contribution rates of TN from the PC2 and unidentified pollution sources increased after the rainstorm, which were 60.26 and 34.77%, respectively.
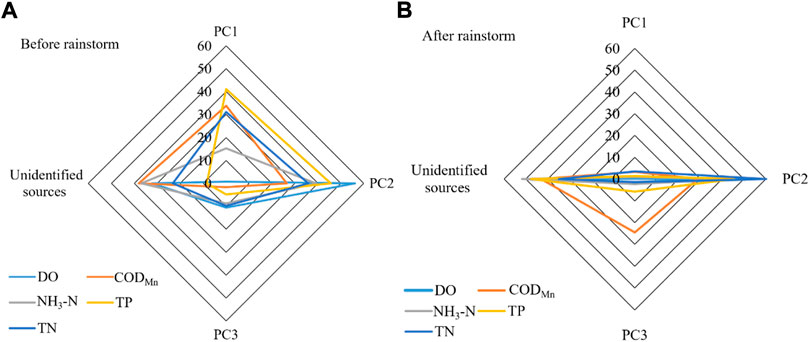
FIGURE 11. The contribution rates for water pollutants before rainstorm (A) and after rainstorm (B). The absolute contribution rates of pollution sources (PC1, PC2, PC3, and unidentified pollution sources) to water pollutants were calculated based on absolute principal components-multiple linear regression model.
The behavior of pollutants in the process of rainstorm runoff was more complex, which mainly included the source of pollutants and the pollutants migration transformation rule and so on. In this study, the sources and characteristics of pollutants in urban rainfall runoff, sources and characteristics of agricultural non-point source pollutants under rainfall conditions and driving mechanism of rainstorm runoff process on river water environment are discussed.
Urban rainfall runoff pollutants are an important source of river pollutants (Han et al., 2020; Huang et al., 2020). Urban rainfall runoff pollution is a water pollution phenomenon in which the pollutants are carried into the receiving water through scouring and leaching of the surface runoff, and the surface accumulation of the suspended solids (SSs), organic compounds, N, P, metal ions, bacteria and viruses flows into the river by urban rainfall runoff, which indicates that urban rainfall runoff pollution has become the main pollution source of rivers (Pan et al., 2022). The relevant studies have shown that particulate TN, COD and TP in urban rainfall runoff account for 65, 58 and 92% of the total concentration, respectively (Zhao et al., 2007; Li et al., 2010). The initial 30% rainstorm runoff could basically carry more than 50% of the load of TSS, COD, TN and TP respectively (Li et al., 2007). The concentrations of COD and SS in the water of urban rainfall runoff were much higher than that of domestic sewage (Chen et al., 2011).
In addition, the influencing factors of the pollutant concentration level in the urban rainfall runoff are very complex because in regional differences of the air pollution status, climate characteristics, wind speed and human activity intensity. Relevant studies have found that the rainfall intensity and previous drought period were the main factors affecting the pollutant concentrations of urban road rainfall runoff (Lee et al., 2011), and the concentrations of pollutants would be higher if the previous drought periods were longer and the rainfall intensity was greater (Huang et al., 2007). The pollutant concentrations of rainstorm runoff on steep roads were most significantly affected by the rainfall intensity, which might be the result of the dual influences of road slope and rainfall intensity and indicated that the rainstorm runoff from roads in mountain cities might contain more prominent pollution intensity (Yan et al., 2011). Studies on the pollution characteristics of rainfall runoff pollution in different regions showed that the underlying surface type had a significant impact on the characteristics of rainfall and runoff pollution and the initial scouring effect (Chen et al., 2017). The initial scouring effect of rainfall runoff on pollutants in different urban functional areas was different, but had an obvious scouring effect on TSS, TN, TP and COD (Geonha et al., 2007; Ma et al., 2021).
On the whole, the above research results were consistent with the increase of the turbidity, CODMn and NH3−N mass concentrations after rainstorm in this study. Therefore, exploring the source and distribution characteristics of urban rainfall runoff pollutants was helpful to understand the migration process of urban rainfall runoff pollutants into the river, and provide data basis and scientific decision-making basis for urban runoff pollution prevention and control.
The agricultural non-point source pollution is composed of soil sediment particles, pesticides and other harmful substances; nutrients such as nitrogen and phosphorus; and agricultural production wastes, and the river water ecological environment deteriorates because of the increasing or decreasing transport of surface runoff and sediment in the basin (Yang and Wu, 2018; Ji et al., 2020). Relevant studies showed that the rainfall intensity had a significant impact on nitrogen and phosphorus emissions in the Fengyu River in the Erhai Basin (Li et al., 2019), the total amount of TN lost to the Huaihe River Basin by rainfall runoff reached 1.4433 million t (Wang et al., 2017). The concentrations of the water quality indices increased after rainfall in the Shahe Reservoir, and agricultural non-point source pollution was the main factor affecting that affected the water quality of the North Canal in the flood season (Jing et al., 2013; Xin et al., 2021). The length and gradient of slope, vegetation coverage and rainfall characteristics were the main influencing factors for reducing runoff nitrogen and phosphorus pollution in the riparian zone (Zhu et al., 2022).
In addition, the different land use configurations could change the impact of rainfall on nitrogen loss, and land cover could reduce the impact of rain on the surface reducing the nitrogen form the soil in runoff through rain water. Different land use patterns have an impact on the nitrogen content of surface runoff and groundwater (Wu et al., 2012; Chen et al., 2016; Oliveira et al., 2016). The concentration of TN at the site of traditional agriculture was greater than that of the agroforestry-water complex in the process of runoff nitrogen loss in secondary rainfall (Luo et al., 2021). The nitrogen and phosphorus leaching loss showed different characteristics under different rainfall intensities because of the runoff yield model and production flow (Ren et al., 2013). Results showed that the concentration of nitrogen in the runoff was higher in the early stage of runoff production and then decayed rapidly, and the output of soluble nitrogen in the runoff was primarily nitrate nitrogen, accounting for 71.0–99.7% of the cumulative loss (Guan et al., 2020). The TN discharge could be effectively reduced by controlling the field ditch water level, and the reduction rates under 10, 15 and 25 mm h−1 rainfall intensities were 100.00, 63.56 and 33.98%, respectively (Wang et al., 2019b).
Overall, the above research results were consistent with the increase of TP and TN mass concentrations after rainstorm in this study. Therefore, the analysis of the sources and characteristics of agricultural non-point source pollutants under rainfall conditions could provide the scientific basis for ecological environment protection and agricultural non-point source pollution control in the watershed.
Relevant scholars have carried out a large number of studies from the perspectives of runoff generation and flood formation, soil erosion and sediment transport, and water pollutant migration with the increase in extreme precipitation frequency and intensity. The results showed that extreme precipitation events could have a large impact on river water quality risk, especially in areas affected by non-point source pollution (Zhong et al., 2017; Xie et al., 2018). A large amount of domestic garbage, sediment particles, and agricultural non-point source pollutants could flow into the river along with the surface runoff when a rainstorm occurred, which would have a negative impact on the river water body within a certain period of time (Wang et al., 2011; Yang et al., 2016). The water quality indicators significantly decreased or increased during a period of time after the rainstorm and gradually recovered to the level of the water quality indicators before the rainstorm, which indicated that the river water body had a certain purification effect through self-regulation after the rainstorm.
The surface runoff carried a large amount of pollution from urban pollution sources and agricultural non-point sources pollutions into the river after the rainstorm, and the rainstorm process accelerated the water velocity and enhanced the scouring action of sediments, which increased the absolute contribution rates of the unidentified pollution sources regarding water pollutants and enhanced the influence of internal sources in sediment on the water pollutants and physical characteristics (Xu et al., 2012; Dou et al., 2016; Xin et al., 2021). At present, the analysis of pollution sources has a certain subjectivity through the use of statistical methods that enhance the accuracy of pollution source analysis, which is necessary to improve the monitoring data series and carry out relevant research based on the component characteristics of pollution sources, and to improve the accuracy of results by combining various pollution source analytical models.
In summary, extreme rainstorms not only affect human life and economic and social development, but also bring large challenges to the aquatic ecological environment. Revealing the differing characteristics of water pollutants before and after rainstorms and identifying pollution sources could provide a theoretical basis for protecting and managing the aquatic ecological environment in the future.
In this study, the water pollutant differential characteristics and pollution source identification in the Henan section in the Huaihe River Basin before and after a rainstorm were explored, and the following conclusions were drawn:
1) The pH, DO, and EC decreased after the rainstorm compared to before the rainstorm, and the average rates were −2.35%, −35.40% and −29.23%, respectively. The turbidity, CODMn, NH3−N, TP and TN increased after the rainstorm compared to before the rainstorm, and the average rates were 592.88, 41.01, 90.58, 203.97 and 49.35%, respectively.
2) The correlations of water quality indicators were affected by the rainstorm, and the correlations between pH and DO and other water quality indices increased after the rainstorm, while the correlations between WT, turbidity, CODMn, NH3−N, TP and TN decreased significantly after the rainstorm.
3) The water quality indicators of each monitoring section were obviously different before and after the rainstorm, and the difference in pH value was the smallest, while the differences in turbidity, NH3−N and TP were relatively larger. The water pollution of each monitoring section increased after the rainstorm, for example, the water quality conditions at WYMW, ZKKD, XHZF, TXDG and SXBQ increased by 5.26, 42.11, 36.84, 10.53 and 25.73% to Class V, respectively, and the water quality conditions at ZKKD, XHZF and SXBQ increased by 15.79, 10.53 and 36.84% to Inferior Class V, respectively.
4) The impact of unidentified pollution sources on water pollutants increased. Before the rainstorm, the absolute contribution rates of the PC2 to DO, NH3−N, TP and TN were 56.29, 39.09, 45.59 and 35.79%, respectively. The absolute contribution rate of unidentified pollution sources to CODMn was 38.04%. After the rainstorm, the absolute contribution rates of the PC2 to DO and TN were 50.77 and 60.26%, respectively. The absolute contribution rates of unidentified pollution sources to CODMn, NH3−N and TP were 43.12, 51.62 and 47.51%, respectively.
5) It is suggested to strengthen the initial rainwater treatment to reduce the impact of rainstorm runoff period on water quality risks, strengthen the tracking and monitoring of water quality in the watershed to finely control water quality, and improve the water quality monitoring data series to improve the accuracy of pollution source analysis results.
The original contributions presented in the study are included in the article/Supplementary Material, further inquiries can be directed to the corresponding authors.
All authors contributed to the study conception and design. YZ: Project administration, Data curation, Methodology, Writing–original draft; LZ: Visualization, Validation, Funding acquisition, Writing-editing; PL: Project administration, Writing-review and editing, Supervision; ZD: Validation, Writing- review; MD: Methodology, Writing- review; ZH: Visualization, Validation; ZL: Data curation, Conceptualization; XQ: Project administration, Writing-review, Funding acquisition. All authors read and approved the final manuscript.
This work was supported by the Natural Science Foundation of Henan Province, China (grant number 212300410310); the Fundamental Research Funds for the Central Public-interest Scientific Institution (grant numbers FIRI2022-01, FIRI20210105); the National Natural Science Foundation of China (grant numbers 51879239, 42101043); and the National Key Research and Development Program of China (grant number 2021YFD1700900).
The authors declare that the research was conducted in the absence of any commercial or financial relationships that could be construed as a potential conflict of interest.
All claims expressed in this article are solely those of the authors and do not necessarily represent those of their affiliated organizations, or those of the publisher, the editors and the reviewers. Any product that may be evaluated in this article, or claim that may be made by its manufacturer, is not guaranteed or endorsed by the publisher.
Ali, H., and Mishra, V. (2018). Contributions of dynamic and thermodynamic scaling in subdaily precipitation extremes in India. Geophys. Res. Lett. 45 (5), 2352–2361. doi:10.1002/2018GL077065
Aydin, H., Ustaoğlu, F., Tepe, Y., and Soylu, E., N. (2021). Assessment of water quality of streams in northeast Turkey by water quality index and multiple statistical methods. Environ. Forensics 22 (1-2), 270–287. doi:10.1080/15275922.2020.1836074
Cha, M., Lu, Z., Zhai, J., and Zhang, F. (2018). Using double-suppressed BP neutral network model to predict water quality in Laoha River. J. Water Resour. Water Eng. 2, 56–61. doi:10.11705/j.issn.1672-643X.2018.02.10
Che, R., Lin, S., Fan, Z. Y., Li, W. J., Zeng, F. T., Mao, B. J., et al. (2019). Effects of continuous extreme rainfall on water quality of the Dongjiang River basin. Environ. Sci. 40 (10), 4440–4449. doi:10.13227/j.hjkx.201902042
Chen, C. L., Gao, M., Xie, D. T., and Ni, J. (2016). Spatial and temporal variations in non-point source losses of nitrogen and phosphorus in a small agricultural catchment in the Three Gorges Region. Environ. Monit. Assess. 188 (4), 257. doi:10.1007/s10661-016-5260-0
Chen, W. W., Wu, X. K., and Li, Z. M. (2017). Simulation model of rainfall wash-off pollutant on urban roof. J. Water Resour. Archit. Eng. 15 (1), 48–51. doi:10.3969/j.issn.1672-1144.2017.01.010
Chen, Y., Zhao, J. Q., and Hu, B. (2011). Study on pollution and sedimentation property of urban trunk road runoff in Xi’an city. Chin. J. Environ. Eng. 5 (2), 331–336. (in Chinese).
Cheng, G. W., Wang, M. J., Chen, Y., and Gao, W. (2020). Source apportionment of water pollutants in the upstream of Yangtze River using APCS-MLR. Environ. Geochem. Health 42 (11), 3795–3810. doi:10.1007/s10653-020-00641-z
China's State Environmental Protection Administration (2002). Environmental quality standard for surface water (EQSSW), GB 3838-2002. BeiJing: State Environment Protection Administration (SEPA), General Administration for Quality Supervision, Inspection and Quarantine of PR China. http://english.mee.gov.cn/Resources/standards/water_environment/quality_standard/200710/t20071024_111792.shtml.
Dookie, N., Chadee, X. T., and Clarke, R. M. (2019). Trends in extreme temperature and precipitation indices for the caribbean small islands: Trinidad and Tobago. Theor. Appl. Climatol. 136, 31–44. doi:10.1007/s00704-018-2463-z
Dorina, C., He, L. F., Wang, X. M., and Chen, S. (2022). Fine observation characteristics and thermodynamic mechanisms of extreme heavy rainfall in Henan on July 2021. J. Appl. Meteorological Sci. 33 (1), 1–15. doi:10.11898/1001-7313.20220101
Dou, M., Mi, Q. B., Li, G. Q., and Zhang, Y. Y. (2016). Research on water quality transformation mechanism in Sluice-controlled river reachesⅠ. Development of the mathematical model. J. Hydraulic Eng. 47 (4), 527–536. doi:10.13243/j.cnki.slxb.20150095
Du, Z. P., Wang, M. J., Yan, C. A., and Gao, W. (2020). Pollution source apportionment of Lake Dianchi based on absolute principal component score -multiple linear regression. Acta Sci. Circumstantiae 40 (3), 1130–1137. doi:10.13671/j.hjkxxb.2019.0358
Fasching, C., Ulseth, A. J., Schelker, J., Steniczka, G., and Battin, T. J. (2016). Hydrology controls dissolved organic matter export and composition in an Alpine stream and its hyporheic zone. Limnol. Oceanogr. 61 (2), 558–571. doi:10.1002/lno.10232
Gan, L., Liu, R., Ji, Q., Li, X., and You, L. (2021). Spatio-temporal evolution characteristics analysis of extreme precipitation in Sichuan province, China. Mt. Res. 39 (1), 10–24. doi:10.16089/j.cnki.1008-2786.000572
Geonha, K., Joonghyun, Y., and Jeongkon, K. (2007). Diffuse pollution loading from urban stormwater runoff in Daejeon city, Korea. J. Environ. Manag. 85 (1), 9–16. doi:10.1016/j.jenvman.2006.07.009
Gholizadeh, M. J., Melesse, M. A., and Reddi, L. (2016). Water quality assessment and apportionment of pollution sources using APCS-MLR and PMF receptor modeling techniques in three major rivers of South Florida. Sci. Total Environ. 566-567, 1552–1567. doi:10.1016/j.scitotenv.2016.06.046
Guan, R. H., Ma, B. G., Huang, Z. X., and Qi, S. W. (2020). Experimental study of simulated rainfall on nitrogen and phosphorus loss from farmland in Southern Hebei Province, Chin. J. Agro-Environment Sci. 39 (3), 581–589. doi:10.11654/jaes.2019-0991
Han, X., Xie, Z. Y., Tian, Y. H., Yan, W., Miao, L., Zhang, L. L., et al. (2020). Spatial and seasonal variations of organic corrosion inhibitors in the Pearl River, South China: Contributions of sewage discharge and urban rainfall runoff. Environ. Pollut. 262, 114321. doi:10.1016/j.envpol.2020.114321
He, B., He, J., Wang, L., Zhang, X., and Bi, E. (2019). Effect of hydrogeological conditions and surface loads on shallow groundwater nitrate pollution in the Shaying River basin: Based on least squares surface fitting model. Water Res. 163, 114880. doi:10.1016/j.watres.2019.114880
Hou, X. K., Zhang, K., Duan, P. Z., Wang, X., Ta, L., Guo, Y., et al. (2021). Pollution source apportionment of Tuohe River based on absolute principal component score-multiple linear regression. Res. Environ. Sci. 34 (10), 2350–2357. doi:10.13198/j.issn.1001-6929.2021.05.30
Hua, F. Y., Huang, T. L., Li, N., Si, F., Huang, C., and Zhao, L. Y. (2021). Influence of rainfall runoff with different intensities on thermal stratification and water quality of water source reservoir. China Environ. Sci. 41 (3), 1234–1242. doi:10.19674/j.cnki.issn1000-6923.2021.0137
Huang, C., Huang, Y. L., Li, Y., Li, N., Qi, Y. Z., Si, F., et al. (2021). Temporal and spatial evolution of storm runoff and water quality assessment in Jinpen Reservoir. Environ. Sci. 42 (3), 1380–1390. doi:10.13227/j.hjkx.202007180
Huang, J. L., Du, P. F., Ao, C. T., Lei, M. H., Zhao, D. Q., Ho, M. H., et al. (2007). Characterization of surface runoff from a subtropics urban catchment. J. Environ. Sci. 19 (2), 148–152. doi:10.1016/S1001-0742(07)60024-2
Huang, Z., Zhao, J. L., Yang, Y. Y., Jia, Y. W., Zhang, Q. Q., Chen, C. E., et al. (2020). Occurrence, mass loads and risks of bisphenol analogues in the Pearl River Delta region, South China: Urban rainfall runoff as a potential source for receiving rivers. Environ. Pollut. 263, 114361. doi:10.1016/j.envpol.2020.114361
Ji, B. H., Li, W., Chang, J. J., Li, X., Si, G. Z., He, F., et al. (2020). Characteristics of bacterial community structure in sediments with different emergent plants in Dianchi lakeside wetland. J. Ecol. Rural Environ. 36 (3), 390–398. doi:10.19741/j.issn.1673-4831.2019.0182
Jing, H. W., Zhang, Z. G., and Guo, J. (2013). Water pollution characteristics and pollution sources of Bei Canal River system in Beijing. China Environ. Sci. 33 (2), 319–327. (in Chinese).
Karthikeyan, P., Venkatachalapathy, R., and Vennila, G. (2017). Multivariate analysis for river water quality assessment of the Cauvery River, Tamil Nadu, India. Indian J. Geo-marine Sci. 46 (4), 785–790.
Kowalkowski, T., Zbytniewski, R., Szpejna, J., and Buszewski, B. (2006). Application of chemometrics in river water classification. Water Res. 40 (4), 744–752. doi:10.1016/j.watres.2005.11.042
Lam, Q. D., Schmalz, B., and Fohrer, N. (2012). Assessing the spatial and temporal variations of water quality in lowland areas, Northern Germany. J. Hydrology 438, 137–147. doi:10.1016/j.jhydrol.2012.03.011
Lee, J. Y., Kim, H., Kim, Y., and Han, M. Y. (2011). Characteristics of the event mean concentration (EMC) from rainfall runoff on an urban highway. Environ. Pollut. 159, 884–888. doi:10.1016/j.envpol.2010.12.022
Lee, M. H., Lee, Y. K., Derrien, M., Choi, K., Shin, K. H., Jang, K. S., et al. (2019). Evaluating the contributions of different organic matter sources to urban river water during a storm event via optical indices and molecular composition. Water Res. 165, 115006. doi:10.1016/j.watres.2019.115006
Li, F. R., Li, Y. Z., Liu, Y., Li, X. M., and Guo, H. C. (2013). Source apportionment and spatial pattern analysis of River Niulanjiang. Res. Environ. Sci. 26 (12), 1356–1363. doi:10.13198/j.issn.1001-6929.2013.12.014
Li, L. Q., Yin, C. Q., He, Q. C., and Kong, L. L. (2007). First flush of storm runoff pollution from an urban catchment in China. J. Environ. Sci. 19 (3), 295–299. doi:10.1016/S1001-0742(07)60048-5
Li, L. Q., Zhu, R. X., Guo, S. G., and Yin, C. Q. (2010). Research on spatial differentiation of urban stormwater runoff quality by source area monitoring. Environ. Sci. 31 (12), 2896–2904. doi:10.13227/j.hjkx.2010.12.034
Li, R., Zou, Z., and An, Y. (2016). Water quality assessment in Qu River based on fuzzy water pollution index method. J. Environ. Sci. 12, 87–92. doi:10.1016/j.jes.2016.03.030
Li, W., Wu, J. H., Zhou, C. J., and Nsabimana, A. (2021). Groundwater pollution source identification and apportionment using PMF and PCA-APCS-MLR receptor models in Tongchuan City, China. Arch. Environ. Contam. Toxicol. 81 (3), 397–413. doi:10.1007/s00244-021-00877-5
Li, X. H., Lei, Q. L., Zhou, J. G., Zhang, Y. T., Li, Y., Hu, W. L., et al. (2019). Effect of rainfall intensity on the content of nitrogen and phosphorus components in plateau areas: A case study of the Fengyu River watershed. Environ. Sci. 40 (12), 5375–5383. doi:10.13227/j.hjkx.201901094
Li, Y., Bi, J. L., Wang, L. S., Tang, W. Z., Shan, B. Q., Yang, L., et al. (2015). Effect of storm runoff on the water quality of urban rivers with unconventional water sources. Acta Sci. Circumstaniae 35 (2), 443–448. doi:10.13671/j.hjkxxb.2014.0759
Liang, X. Y., Niu, Z. M., Xu, X. B., and Wang, N. A. (2020). Changes of extreme climate events in Gansu Province from 1960 to 2016. J. Lanzhou Univ. Nat. Sci. 56 (2), 231–242. doi:10.13885/j.issn.0455-2059.2020.02.012
Liu, L. L., Tang, Z., Kong, M., Chen, X., Zhou, C. C., Huang, K., et al. (2019b). Tracing the potential pollution sources of the coastal water in Hong Kong with statistical models combining APCS-MLR. J. Environ. Manag. 245, 143–150. doi:10.1016/j.jenvman.2019.05.066
Liu, R. R., Gu, N. N., Li, G. D., and Wu, C. D. (2019a). Water quality assessment of Liuhe River based on single-factor standard index method. J. Jianghan Univ. Nat. Sci. Ed. 2, 139–145. doi:10.16389/j.cnki.cn42-1737/n.2019.02.006
Liu, Y., Hu, Y. C., Hu, Y. M., Gao, Y. Q., and Liu, Z. Y. (2021). Water quality characteristics and assessment of Yongding New River by improved comprehensive water quality identification index based on game theory. J. Environ. Sci. 104, 40–52. doi:10.1016/j.jes.2020.10.021
Luo, Y. F., Chen, F. X., Zhou, H., Long, Y., Yan, D. C., Tan, W. H., et al. (2021). Effects of different land use practices on Nitrogen Loss from runoff during rainfall events. Environ. Sci. 42 (5), 2260–2267. doi:10.13227/j.hjkx.202009177
Luo, Z., and Zuo, Q. (2019). Evaluating the coordinated development of social economy, water, and ecology in a heavily disturbed basin based on the distributed hydrology model and the harmony theory. J. Hydrology 574, 226–241. doi:10.1016/j.jhydrol.2019.04.042
Ma, J. J., Yu, T., Chen, Y. F., Yao, H. M., and Li, Y. (2020). Water quality evaluation of the middle and lower reaches of Hanjiang River based on comprehensive water quality identification index. Pearl River 41 (9), 63–69. doi:10.3969/j.issn.1001-9235.2020.09.010
Ma, W. X., Huang, T. L., Li, X., Zhang, H. H., and Ju, T. (2015). Impact of short-term climate variation and hydrology change on thermal structure and water quality of a canyon-shaped, stratified reservoir. Environ. Sci. Pollut. Res. 22 (23), 18372–18380. doi:10.1007/s11356-015-4764-4
Ma, Y. K., Wang, S. H., Zhang, X. Y., and Shen, Z. Y. (2021). Transport process and source contribution of nitrogen in stormwater runoff from urban catchments. Environ. Pollut. 289, 117824. doi:10.1016/j.envpol.2021.117824
Meng, L., Zuo, R., Wang, J. S., Yang, J., Teng, Y. G., Shi, R. T., et al. (2018). Apportionment and evolution of pollution sources in a typical riverside groundwater resource area using PCA-APCS-MLR model. J. Contam. Hydrology 218, 70–83. doi:10.1016/j.jconhyd.2018.10.005
Meng, L., Zuo, R., Wang, J. S., Yang, J., Teng, Y. G., Zhai, Y. Z., et al. (2017). Quantitative source apportionment of groundwater pollution based on PCA-APCS-MLR. China Environ. Sci. 37 (10), 3773–3786. (in Chinese).
Ning, Z. R., and Li, H. B. (2020). Assessment and analysis of water quality in Ningxia section of the Yellow River based on comprehensive water quality identification index. J. Irrigation Drainage 39 (1), 56–61. doi:10.13522/j.cnki.ggps.2020197
Oliveira, L. D., Maillard, P., and Dapé, J. (2016). Modeling the effect of land use/land cover on nitrogen, phosphorous and dissolved oxygen loads in the Velhas River using the concept of exclusive contribution area. Environ. Monit. Assess. 188 (6), 333. doi:10.1007/s10661-016-5323-2
Pan, X. R., Zuo, J. E., Zhang, Y., Men, C., Zhang, L. P., and Huang, S. B. (2022). Temporal and spatial distribution characteristics and source apportionment of runoff pollution in Langfang city. Environ. Sci. 43 (2), 795–802. doi:10.13227/j.hjkx.202103119
Parr, T. B., Cronan, C. S., Ohno, T., Findlay, S. E. G., Smith, S. M. C., and Simon, K. S. (2015). Urbanization changes the composition and bioavailability of dissolved organic matter in headwater streams. Limnol. Oceanogr. 60 (3), 885–900. doi:10.1002/lno.10060
Qi, R., Xu, F. F., Yang, F., and Yan, C. Z. (2020). Analysis of nitrogen pollution and its pollution sources in the Muli River Basin. Environ. Sci. 41 (7), 3165–3174. doi:10.13227/j.hjkx.201912058
Qiu, Y., Lu, C., Xu, Z., and Wang, Y. Q. (2017). Spatio-temporal variation characteristics and water pollution sources in the Huangshui River Basin. Acta Sci. Circumstantiae 37 (8), 2829–2837. doi:10.13671/j.hjkxxb.2017.0090
Ren, Y. B., Ren, N. Q., Li, X. K., and Li, J. G. (2013). Efficiency of urban wetlands in removing agricultural non-point source pollution. Asian J. Chem. 25 (9), 4726–4730. doi:10.14233/ajchem.2013.14074
Ren, Y., Zhang, F., Wang, J., Zhang, Y., Yang, S. T., Abduwasit, G., et al. (2017). Spatio-temporal characteristics and source identification of surface water pollutants in Lake Ebinur Watershed, Xinjiang. J. Lake Sci. 29 (5), 1143–1157. doi:10.18307/2017.0512
Shen, D., Huang, S. H., Zhang, Y. P., and Zhou, Y. C. (2021). The source apportionment of N and P pollution in the surface waters of lowland urban area based on EEM-PARAFAC and PCA-APCS-MLR. Environ. Res. 197, 111022. doi:10.1016/J.ENVRES.2021.111022
Shi, W. C., Gu, Z. G., Feng, Y., Wu, Y. N., Wu, X. R., and Zhang, Z. S. (2020). Source apportionment of heavy metals in sediments with application of APCS-MLR model in Baoxiang River. Environ. Sci. Technol. 43 (10), 51–59. doi:10.19672/j.cnki.1003-6504.2020.10.007
Shi, W. R., Li, X., Zeng, M. J., Zhang, B., Wang, H. B., Zhu, K. F., et al. (2021). Multi-model comparison and high-resolution regional model forecast analysis for the “7.20” Zhengzhou severe heavy rain. Trans. Atmos. Sci. 44 (5), 688–702. doi:10.13878/j.cnki.dqkxxb.20210823001
Tang, P., and Wang, H. (2019). Study on the ranking of urban surface water environment quality Based on water quality Iindex method. J. Anhui Agric. Sci. 16, 78–86. doi:10.3969/j.issn.0517-6611.2019.16.023
Ustaoğlu, F., Taş, B., Tepe, Y., and Topaldemir, H. (2021). Comprehensive assessment of water quality and associated health risk by using physicochemical quality indices and multivariate analysis in Terme River, Turkey. Environ. Sci. Pollut. Res. 28, 62736–62754. doi:10.1007/s11356-021-15135-3
Ustaoğlu, F., Tepe, Y., Tas, B., Tepe, Y., and Taş, B. (2020). Assessment of stream quality and health risk in a subtropical Turkey River system: A combined approach using statistical analysis and water quality index. Ecol. Indic. 113, 105815. doi:10.1016/j.ecolind.2019.105815
Ustaoğlu, F., and Tepe, Y. (2019). Water quality and sediment contamination assessment of Pazarsuyu Stream, Turkey using multivariate statistical methods and pollution indicators. Int. Soil Water Conservation Res. 7, 47–56. doi:10.1016/j.iswcr.2018.09.001
Wang, H., Wu, W. J., Wang, G., Zhao, Z., Chen, J. M., and Yan, C. A. (2021). Evolution characteristics of extreme precipitation events and its urban effect in Kunming City. Water Resour. Prot. 37 (4), 61–68. doi:10.3880/j.issn.1004-6933.2021.04.009
Wang, X., Hao, F. H., Cheng, H. G., Yang, S. T., Zhang, X., and Bu, Q. S. (2011). Estimating non-point source pollutant loads for the large-scale basin of the Yangtze River in China. Environ. Earth Sci. 63 (5), 1079–1092. doi:10.1007/s12665-010-0783-0
Wang, X. L., Li, J. S., Li, S. M., and Zheng, X. T. (2017). A study on removing nitrogen from paddy field rainfall runoff by an ecological ditch-zeolite barrier system. Environ. Sci. Pollut. Res. 24 (35), 27090–27103. doi:10.1007/s11356-017-0269-7
Wang, Y., Fang, Y. Q., Ji, J., Qin, G. F., Ma, R. J., and Li, X. D. (2019b). The loss of nitrogen and phosphorus from dryland farmland under different rainfall intensities. J. Agric. Resour. Environ. 36 (6), 814–821. doi:10.13254/j.jare.2018.0210
Wang, Y. L., Su, C. J., Chen, X. H., and Wang, J. W. (2019). Change trend and cause of salt tide in Modaomen Channel during dry seasons. Water Resour. Prot. 35 (2), 37–43. doi:10.3880/j.issn.1004-6933.2019.02.006
Wang, Y., Lu, S. G., Feng, Q., Liu, X. D., Liu, J. J., Zhao, W. J., et al. (2019a). Spatio-temporal characteristics and source identification of water pollutants in the upper and middle reachers of Heihe River. China Environ. Sci. 39 (10), 4194–4204. doi:10.19674/j.cnki.issn1000-6923.2019.0492
Wu, L., Long, T. Y., and Cooper, W. J. (2012). Simulation of spatial and temporal distribution on dissolved non-point source nitrogen and phosphorus load in Jialing River Watershed, China. Environ. Earth Sci. 65 (6), 1795–1806. doi:10.1007/s12665-011-1159-9
Xie, K., Luo, Y., Feng, Y. Y., He, Q. P., Zhang, K. Q., Shen, S. Z., et al. (2020). Comprehensive evaluation of water quality changes in agricultural irrigation ditches in the rainy season under different planting patterns in the west of Erhai, China. J. Agro-Environment Sci. 39 (10), 2387–2396. doi:10.11654/jaes.2020-0741
Xie, S. Q., Du, Y., Zeng, Y., and Miao, Q. (2018). Classification of yearly extreme precipitation events and associated flood risk in the Yangtze-Huaihe River valley. Sci. China Earth Sci. 61 (9), 1341–1356. doi:10.1007/s11430-017-9212-8
Xin, Y., Li, P., Wu, J. F., Xu, C. G., Shen, P. H., Wei, Y. S., et al. (2021). Impacts of heavy rainfall on the water quality of Shahe reservoir in the north canal basin. Acta Sci. Circumstantiae 41 (1), 199–208. doi:10.13671/j.hjkxxb.2020.0525
Xu, H. S., Xu, Z. X., Tang, F. F., Yu, W. D., and Cheng, Y. P. (2012). Spatiotemporal variation analysis and identification of water pollution sources in the Zhangweinan River Basin. Environ. Sci. 33 (2), 359–369. doi:10.13227/j.hjkx.2012.02.018
Xu, X. M., and Zhang, X. Q. (2021). Changes in precipitation extremes in shenzhen city from 1961 to 2019. J. Nat. Disasters 30 (3), 43–51. doi:10.13577/j.jnd.2021.0305
Xu, Z. X. (2005). Comprehensive water quality identification index for environmental quality assessment of surface water. J. Tongji Univ. Nat. Sci. 33 (4), 482–488. (in Chinese).
Yan, W. T., Han, Y., and He, Q. (2011). Characterization of stormwater runoff pollution in mountain city. J. Civ. Environ. Eng. 33 (3), 136–142. doi:10.11835/j.issn.1674-4764.2011.03.024
Yang, F., Jiang, Y. F., Wang, C. C., Huang, X. N., Wu, Z. Y., and Chen, L. (2016). Characteristics of nitrogen and phosphorus losses in Longhong ravine basin of Westlake in rainstorm runoff. Environ. Sci. 37 (1), 141–147. doi:10.13227/j.hjkx.2016.01.019
Yang, L. Z., and Wu, Y. H. (2018). Prevention and control of agricultural non-point source pollution and aquatic environmental protection. Bull. Chin. Acad. Sci. 33 (2), 168–176. doi:10.16418/j.issn.1000-3045.2018.02.006
Yang, X., Cui, H., Liu, X., Wu, Q. G., and Zhang, H. (2020). Water pollution characteristics and analysis of Chaohu Lake basin by using different assessment methods. Environ. Sci. Pollut. Res. 27, 18168–18181. doi:10.1007/s11356-020-08189-2
Yoon, B., and Raymond, P. A. (2012). Dissolved organic matter export from a forested watershed during Hurricane Irene. Geophys. Res. Lett. 39 (17), L18402. doi:10.1029/2012GL052785
Zhai, P. M., Zhou, B. Q., and Chen, Y. (2018). A review of climate change attribution studies. J. Meteorol. Res. 32 (5), 671–692. doi:10.1007/s13351-018-8041-6
Zhang, H., Cheng, S. Q., Li, H. F., Fu, K., and Xu, Y. (2020a). Groundwater pollution source identification and apportionment using PMF and PCA-APCA-MLR receptor models in a typical mixed land-use area in Southwestern China. Sci. Total Environ. 741, 140383. doi:10.1016/j.scitotenv.2020.140383
Zhang, H., Li, H. F., Yu, H. R., and Cheng, S. Q. (2020b). Water quality assessment and pollution source apportionment using multi-statistic and APCS-MLR modeling techniques in Min River Basin, China. Environ. Sci. Pollut. Res. 27, 41987–42000. doi:10.1007/s11356-020-10219-y
Zhang, T., Chen, Q. W., Yi, Q. T., Wang, M., Huang, W., and Feng, R. R. (2017). Spatial and seasonal variations of water quality in the upstream plain river networks of the Taihu Basin. J. Lake Sci. 29 (6), 1300–1311. doi:10.18307/2017.0602
Zhang, Y., Dou, M., Li, P., Liang, Z. J., Wang, C., and Dai, P. (2020). Spatiotemporal variation characteristics and source identification of water pollutants in Shayinghe River basin. River Res. Appl. 37, 1089–1103. doi:10.1002/rra.3623
Zhang, Y., Zou, L., Liang, Z. J., Dou, M., Li, P., and Huang, Z. D. (2021). Differential characteristics and source identification of water quality of the rivers in Northern Henan before and after Rainstorm. Environ. Sci. 43 (5), 2537–2547. doi:10.13227/j.hjkx.202109010
Zhao, J. W., Shan, B. Q., and Yin, C. Q. (2007). Pollutant loads of surface runoff in Wuhan city zoo, an urban tourist area. J. Environ. Sci. 19 (4), 464–468. doi:10.1016/S1001-0742(07)60077-1
Zhong, K. Y., Zheng, F. L., Wu, H. Y., and Qin, C. (2017). Effects of precipitation extremes change on sediment load in Songhua River Basin. Trans. Chin. Soc. Agric. Mach. 48 (8), 245–252. doi:10.6041/j.issn.1000-1298.2017.08.028
Zhou, F., Huang, G. H., Guo, H. C., Zhang, W., and Hao, Z. J. (2007). Spatio-temporal patterns and source apportionment of coastal water pollution in eastern Hong Kong. Water Res. 41 (15), 3429–3439. doi:10.1016/j.watres.2007.04.022
Zhou, Y. Q., Liu, M., Zhou, L., Jang, K. S., Xu, H., Shi, K., et al. (2020). Rainstorm events shift the molecular composition and export of dissolved organic matter in a large drinking water reservoir in China: High frequency buoys and field observations. Water Res. 187, 116471. doi:10.1016/j.watres.2020.116471
Zhu, L., Wang, Y. N., Han, M., Zhu, Y. Z., Yu, H. B., and Song, Y. H. (2018). Spatio-temporal distribution of water quality and source identification of pollution in Wushui River Basin. Acta Sci. Circumstantiae 38 (6), 2150–2156. doi:10.13671/j.hjkxxb.2017.0345
Keywords: extreme rainfall event, water pollutants, source contributions, APCS-MLR, Huaihe River Basin
Citation: Zhang Y, Zou L, Li P, Du Z, Dou M, Huang Z, Liang Z and Qi X (2022) Differential characteristics and source contribution of water pollutants before and after the extreme rainfall event in the Huaihe River Basin. Front. Environ. Sci. 10:1003421. doi: 10.3389/fenvs.2022.1003421
Received: 26 July 2022; Accepted: 31 August 2022;
Published: 23 September 2022.
Edited by:
Andrew Hursthouse, University of the West of Scotland, United KingdomReviewed by:
Fikret Ustaoğlu, Giresun University, TurkeyCopyright © 2022 Zhang, Zou, Li, Du, Dou, Huang, Liang and Qi. This is an open-access article distributed under the terms of the Creative Commons Attribution License (CC BY). The use, distribution or reproduction in other forums is permitted, provided the original author(s) and the copyright owner(s) are credited and that the original publication in this journal is cited, in accordance with accepted academic practice. No use, distribution or reproduction is permitted which does not comply with these terms.
*Correspondence: Lei Zou, em91bGVpQGlnc25yci5hYy5jbg==; Ping Li, bGlwaW5nMDVAY2Fhcy5jbg==
Disclaimer: All claims expressed in this article are solely those of the authors and do not necessarily represent those of their affiliated organizations, or those of the publisher, the editors and the reviewers. Any product that may be evaluated in this article or claim that may be made by its manufacturer is not guaranteed or endorsed by the publisher.
Research integrity at Frontiers
Learn more about the work of our research integrity team to safeguard the quality of each article we publish.