- College of Resources and Environment, Huazhong Agricultural University, Wuhan, China
Many studies have established the correlation between crop residual burning (CRB) and air pollutants such as particulate matter (PM) pollutants. However, few studies have compared CRB’s correlations with all major air pollutants, including PM with aerodynamic diameters less than 10
1 Introduction
Owing to rapid economic development over the past three decades (Chen and Xie, 2014), China has experienced severe and persistent air pollution (Li et al., 2020). Air pollution is associated with severe health risks and has attracted considerable attention from the public and government (Shen et al., 2020). Both gaseous pollutant and particulate matter (PM) levels in the urban areas of China have significantly increased in the recent past (Ma et al., 2019; Wu et al., 2019). PM, including
Owing to these efforts, air quality in many urban centers in China has begun to show marked and sustained improvement (Silver et al., 2018; Li et al., 2019; Tilt, 2019; Zhai et al., 2019). A large body of literature has confirmed that annual average concentrations of
As a significant air pollutant, crop residue burning (CRB) in open fields is among the most important contributors to short-term and severe air pollution in China (Li et al., 2010; Tao et al., 2013; Ni et al., 2017); China accounts for 17.9% of the global crop straw production (Yin et al., 2017b). The country has suffered from intensive open CRB on a large scale for a long time (Chen et al., 2017). According to estimates, China produced 630 million tons of crop residue from 1995 to 2005; on average, one-third of it remained unused, most of which was burned in fields (Liu et al., 2008; Wang et al., 2013; Qiu et al., 2014; Hou et al., 2019). Studies have reported that despite the Chinese government’s proposed regulations and laws to prohibit CRB, the total amount of CRB in China has continuously increased from 2001 to 2018 (Cao et al., 2006; Yan et al., 2006; Huang et al., 2012a; Zhuang et al., 2018b; Yin et al., 2021). Thus, it is essential to determine the impact of CRB on air pollution.
Many studies have demonstrated that periods of significant CRB or biomass burning lead to an immediate increase in
These studies have confirmed the high correlation between CRB and certain air pollutants and suggested that during periods of CRB, concentrations of a few air pollutants increase. However, few studies have fully examined changes in all major air pollutants, including PM10, PM2.5,
However, a few scholars have used emission factors to calculate the emission inventory for CRB. In these studies, all major air pollutants were calculated and estimated (Yang et al., 2008; Granier et al., 2011). For example, Yang et al. (2008) used emission factors proposed by a few studies to estimate the amount of crop residues in Suqian, China, and the total amount of emissions from CRB during summer and autumn harvests. Specifically, the emissions included total suspended particulates (TSP),
These studies, based on emission factors, can provide general information regarding the spatial distribution of pollutant loads or emissions produced by CRB on a large scale. However, because pollutants were calculated using a coefficient method at the annual level, it is difficult to track specific and accurate variabilities of air pollutants during periods of intensive CRB (Yu et al., 2019). Within this context, it is necessary to determine the correlation or impact of CRB on the changes in all important air pollutants. Although many studies have focused on the impact of CRB on PM air pollutants or the emission inventories of CRB for many pollutants, few studies have used national site monitoring to clarify the influence of seasonal CRB in China on all major air pollutants. The impact of seasonal CRB in China on the spatial and temporal changes in all major air pollutants is still unclear. To fill the gaps in the literature, the present study aimed to estimate how all major air pollutant concentrations change during CRB seasons and their differences in different regions with varying amounts of CRB.
As there was an obvious change in CRB spots in China from 2015 to 2016 (Yu et al., 2019), the present study used the 2015 and 2016 data and extracted the daily spatial distribution of CRB in mainland China from the Moderate Resolution Imaging Spectroradiometer (MODIS) images to obtain the hourly concentrations of six major pollutants,
2 Materials and methods
2.1 Data
2.1.1 MODIS fire product
We selected the MODIS Thermal Anomalies/Fire Daily L3 Global Product (MOD14A1) from 2015 to 2016 to detect fires (accessed at https://modis.gsfc.nasa.gov/data/dataprod/mod14.php). We downloaded 18 images covering all of China every day from January 2015 to December 2016 and then extracted the daily fire burning spots (Huang et al., 2012a; Yin et al., 2017b). The values were 7, 8, or 9 if there were fire spots, according to the product. Thereafter, the daily fire spots provided by MOD14A1 were overlaid with the spatial scale of agricultural land provided by the land-use datasets to identify the fire spots as CRB spots. It is assumed that the fire points located on agricultural lands are CRB spots.
2.1.2 Air quality monitoring data
Air quality monitoring data were obtained from the China National Environmental Monitoring Center (CNEMC) (accessed at http://www.cnemc.cn/), which has published hourly air quality data for the six criteria pollutants at individual monitoring sites since January 2013 (Wang et al., 2014). Data from 1 January 2015 to 31 December 2016 were used in the present study. Daily concentrations of six criteria air pollutants, including
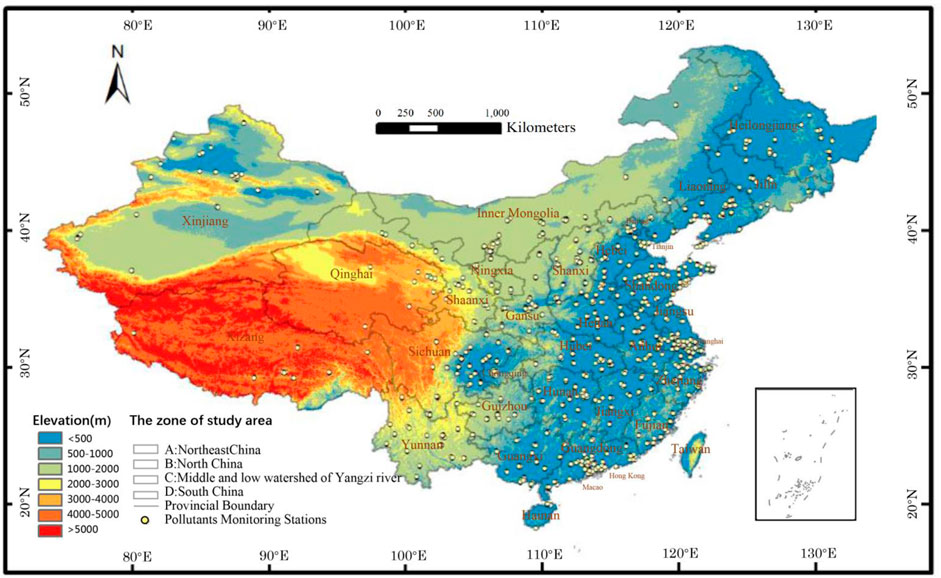
The monitoring sites, located in eastern and central China, had high economic development and a dense population, which included a mix of urban and background sites (Wang et al., 2013). The spatial distribution of monitoring sites along with the elevation and provincial boundaries is presented in Figure 1.
2.1.3 Land-use data and precipitation data
Land-use data were used to detect the spatial distribution of CRB. We downloaded the 2015 land-use dataset from the Data Center for Resources and Environmental Sciences, Chinese Academy of Sciences (accessed at http://www.resdc.cn). The land-use dataset was produced based on Landsat 8 images, including 25 primary land-use categories (http://www.resdc.cn/data.aspx?DATAID=184) with a resolution of 1 km × 1 km. In the present study, classes 11 and 12, which represent agricultural land, were used to overlay the fire spots and extract the CRB spots.
The daily precipitation data at each meteorological station from January 2015 to December 2016 were sourced from the China Meteorological Administration (http://www.cma.gov.cn/). Daily precipitation at meteorological stations was interpolated to present daily precipitation to a 1 km spatial resolution using an inverse distance weighting technique in ArcGIS software. The spatial precipitation resolution was the same as that of the MODIS fire production used in the present study. On the day when an air quality monitoring site was located in a place with precipitation greater than zero, the air quality monitoring site should be eliminated when analyzing the influence of CRB on air quality changes.
2.2 Methods
2.2.1 Temporal impact of CRB on air pollutants
There are several sources of air pollution. To clarify the temporal impact of CRB on air pollutants, we assumed that the other sources were generally unchanged in two adjacent months. Therefore, the months with abnormally high pollutant concentrations (
where
Thereafter,
2.2.2 Spatial impact of CRB on air pollutants
The temporal analysis presented the overall influence of CRB on air pollution at the provincial level. To present the spatial impact of CRB on air quality, the rate of air pollutant change in periods with intensive CRB spots, denoted as RPR, was calculated for each monitoring site (see Eq. 2). Before calculating the RPR, the period with intensive CRB spots (Pd) is defined. CRB is usually concentrated in one or two seasons, which is consistent with the sowing or harvest season (Huang et al., 2012b; Chen et al., 2017). Therefore, it is necessary to focus on periods with intensive CRB to quantify the influence of CRB on air pollutants (Chen and Xie, 2014; Yu et al., 2019). In the present study, we selected Pds at the provincial level because the agricultural form was similar in one province. We assumed that the Pds in 2015 and 2016 were the same, which facilitated the following comparative analysis. There is no consensus on Pd selection because the studies have been performed at different spatial and temporal scales. To identify the Pd in the present study, we ruled that one province should have one or two Pds, which was determined by its CRB seasonal features. The Pd for a specific province should be a continuous period and contain the maximum daily CRB spots in the CRB season. Meanwhile, during Pd, the number of CRB spots should show an increasing trend in the beginning, then reach a peak, and finally, experience a decline. This can be considered one Pd for a specific province.
After identifying Pd, the RPR was calculated as the ratio of the average air pollutant concentrations in Pd at a site to the average air pollutant concentration in the periods before and after Pd at the site:
where
To avoid the influence of precipitation on air quality, monitoring sites located in places with precipitation greater than zero were eliminated when calculating
The spatial distribution of the CRB was also extracted for Pd. We applied the methodology described by Yu et al. (2019), who calculated the intensity of the CRB spots (ICP) at each spatial grid during the Pd. The spatial patterns of RPR and ICP, which reflect the changes in air pollutants during the CRB seasons and the density of CRB, respectively, were compared and analyzed to determine the spatial impact of CRB on air pollution.
3 Results
3.1 CRB counts and concentration of air pollutants at the provincial level
Quantitative statistics of cumulative CRB spots in 2015 and 2016 for provinces and their ratio to the total national number of CRB spots are presented in Figure 2. In 2015, there were 54,071 CRB spots in China, which decreased to 39,140 in 2016. Approximately 55% and 50% of the retrieved CRB spots were located in Heilongjiang, Liaoning, and Jilin in 2015 and 2016, respectively. In contrast, only approximately 1.40% of the retrieved CRB spots were located in the northwestern provinces of Gansu, Ningxia, Qinghai, and Tibet in 2015 and 2016, respectively. In summary, a significant decrease in CRB occurred between 2015 and 2016, and there was a considerable difference in CRB at the provincial level. The differences in quantitative CRB at the provincial level are probably due to the varying local climates and topological limitations on agricultural production in provinces. Therefore, it is sensible to analyze the amount of CRB and its influence on air pollution at the provincial level.
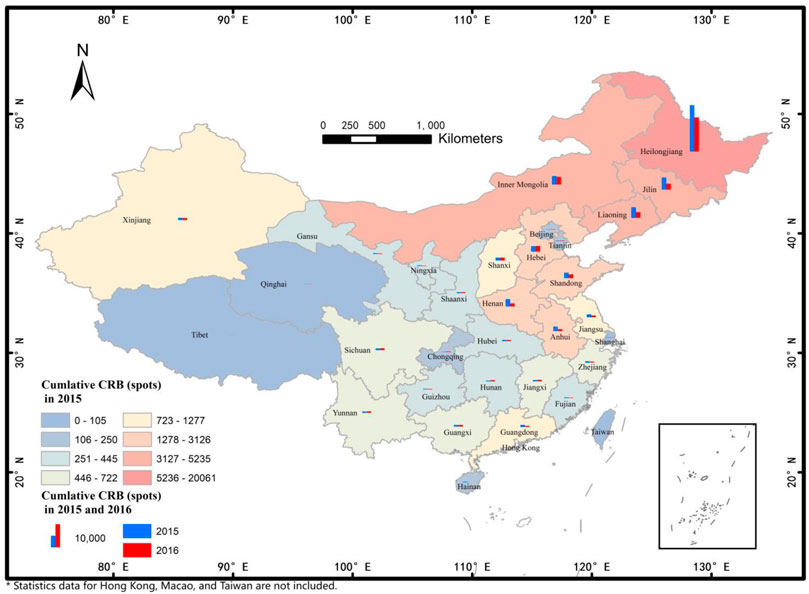
FIGURE 2. Spatial distribution of cumulative CRB spots in China (2015 and 2016) at the provincial level.
To simplify the analysis process, we selected provinces with high CRB to conduct the following analysis. Specifically, eight provinces with the largest number of CRB spots were selected: Heilongjiang, Jilin, Liaoning, Inner Mongolia, Henan, Shandong, Hebei, and Anhui. The total number of CRB spots in these eight provinces was 43,300 and 29,223, contributing approximately 80% and 75% of the total national CRB, in 2015 and 2016, respectively.
3.2 Temporal changes in air pollutants under CRB
3.2.1 Changes in monthly air pollutants
The monthly average concentrations of the six major air pollutants and the daily number of CRB spots at the provincial level in 2015 and 2016 were analyzed; Figure 3 presents the changes in air pollutant concentrations. The unit of each air pollutant in all figures and tables is consistent with the original data provided by the CNEMC. To make it readable in Figure 3, we multiplied the coefficient of 10 by the CO concentrations in Figure 3.
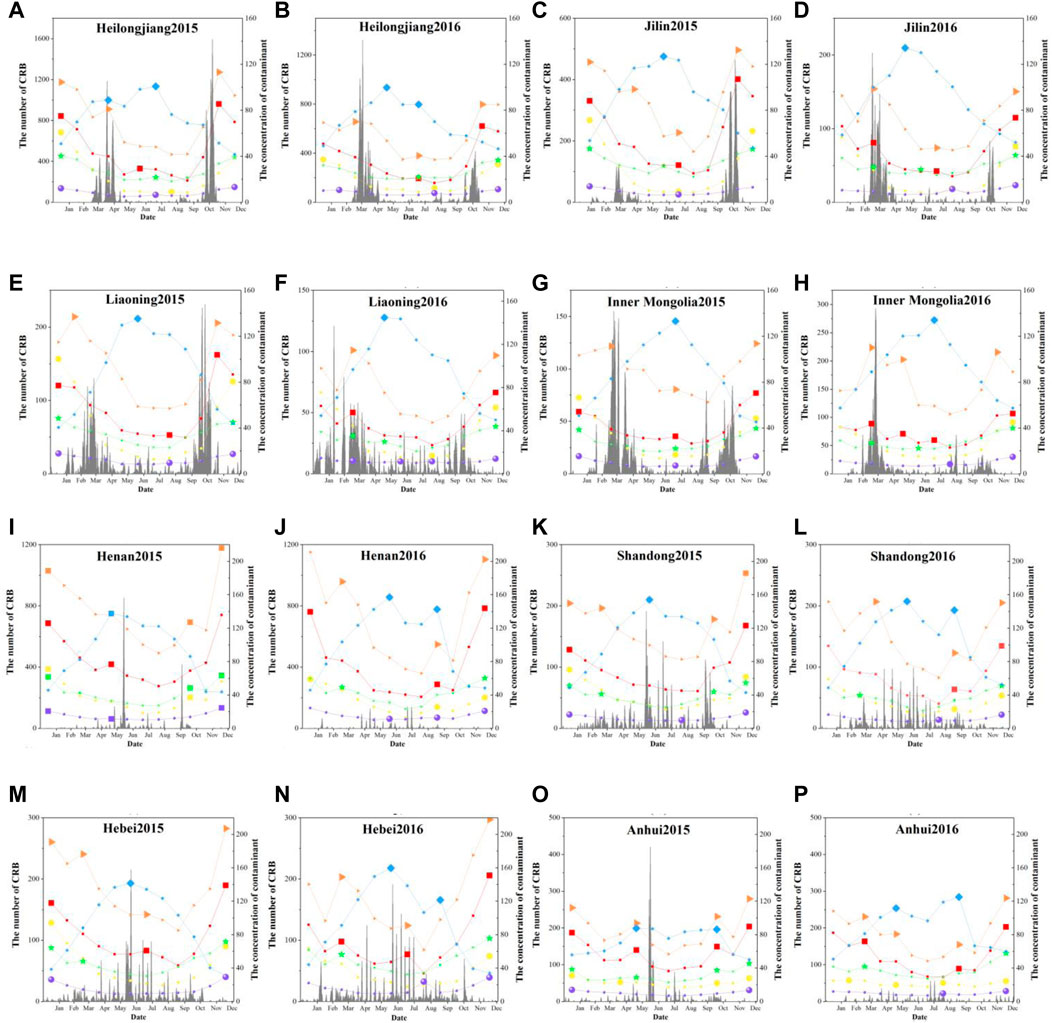
FIGURE 3. Temporal change in monthly average concentrations of six major air pollutants and the daily number of CRB spots from 2015 to 2016, (A,B) in Heilongjiang, (C,D) in Jilin, (E,F) in Liaoning, (G,H) in Inner Mongolia, (I,J) in Henan, (K,L) in Shandong, (M,N) in Hebei, and (O,P) in Anhui.
In general, the concentrations of most pollutants were higher in winter and lower in summer, including
In Heilongjiang, Jilin, and Liaoning, CRB was concentrated in spring (March and April) and autumn (October) (Figure 3), which is consistent with the results of previous studies (Zha et al., 2013; Wang et al., 2015). In months with concentrated CRB, the provinces experienced abnormally high levels of air pollution due to
Henan, Shandong, Hebei, and Anhui had limited CRB, which was usually concentrated during summer. This is probably because a small amount of CRB cannot create a regional or provincial impact on air pollution, and weather conditions in summer do not promote air pollution for most pollutants except
The Mc analysis showed that in northeast China, a significant amount of CRB occurred (contributing to more than 50% of the total CRB in China, based on the data listed in Figure 3) during spring and summer, and it was vulnerable to abnormally high concentrations of one or two major air pollutants. However, for other provinces in China, CRB usually occurs during summer at a lower frequency. Although this does not usually lead to a provincial increase in major air pollutants, attention should be paid to
3.2.2 Changes in air pollutants in 2015 and 2016
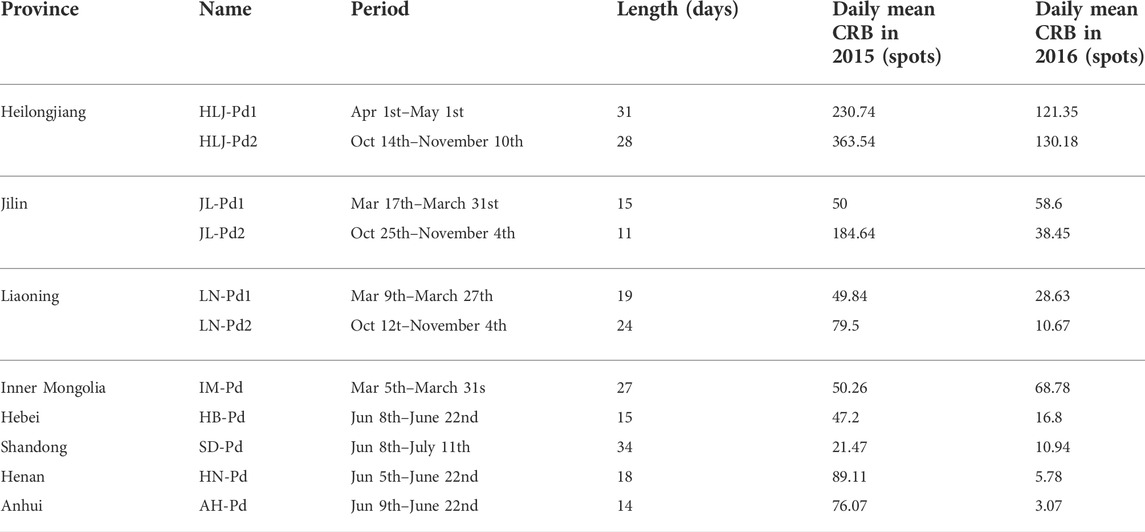
In addition to the monthly analysis, the changes in air pollutants in 2015 and 2016 were compared because there was a considerable drop from 54,071 CRB spots in 2015 to 39,140 in 2016 on the national scale. Table 1 presents the selected Pds in the provinces in 2015 and 2016. The box-plot analysis showed the ranges, means, medians, and outliers of all air pollutant concentrations in the selected Pds in 2015 and 2016.
Heilongjiang, Jilin, and Liaoning had the highest number of CRB spots, which decreased from 29,831 CRB spots in 2015 to 19,743 in 2016. HLJ-Pd1, HLJ-Pd2, JL-Pd2, LN-Pd1, and LN-Pd2 experienced a decrease in the mean concentrations of almost all the major air pollutants from 2015 to 2016 in the same Pds. For example, in HLJ-Pd1, the mean concentrations of
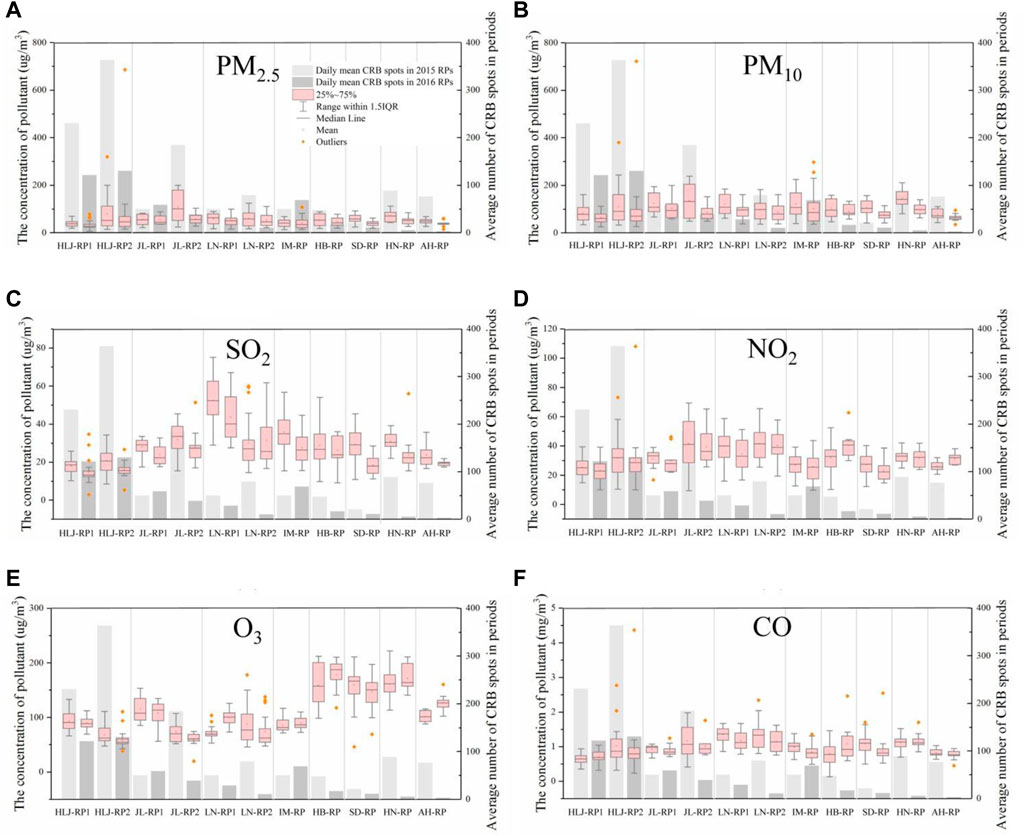
FIGURE 4. Boxplots of six air pollutants in Pds at the provincial level in 2015 and 2016 for (A)
In addition to the decrease in the mean concentrations of air pollutants from 2015 to 2016, our findings also showed that the maximum air pollutant concentrations in the Pds decreased from 2015 to 2016. For example, in JL-Pd2, the mean concentrations of
The results for northeast China suggest that a substantial decrease in CRB in a short time would lead to an obvious decrease in the mean concentrations and a decrease in the maximum concentrations of air pollutants. Even if CRB was lower in other provinces, changes in the concentrations of air pollutants and CRB spots were also detected. For IM-Pd, the daily mean number of CRB spots increased from 50.26 spots in 2015 to 68.78 in 2016. Changes in the mean concentrations of Pd from 2015 to 2016 were not significant. However, the maximum concentrations of
For Hebei, Shandong, Henan, and Anhui, the daily mean CRB spots were lower compared to Heilongjiang, Jilin, Liaoning, and Inner Mongolia; however, a decreasing trend in CRB was also observed in the latter four provinces from 2015 to 2016. Along with the decrease in CRB in 2015, the mean concentrations of
In summary, according to the box-plot analysis of air pollutant concentrations during the CRB seasons, CRB decreased from 2015 to 2016, and most air pollutants decreased in the provinces. In most cases, the mean concentrations of air pollutants were higher in Pds with greater CRB. Furthermore, both the maximum concentration and the number of outliers increased during the period with greater CRB. Therefore, it is beneficial for residents to pay greater attention to controlling extremely high air pollutants during CRB seasons, rather than just controlling mean concentrations.
3.3 Spatial contributions of CRB to six major air pollutants in Pds
Additionally, the spatial contributions of CRB to the changes in air pollutants were calculated and presented. The
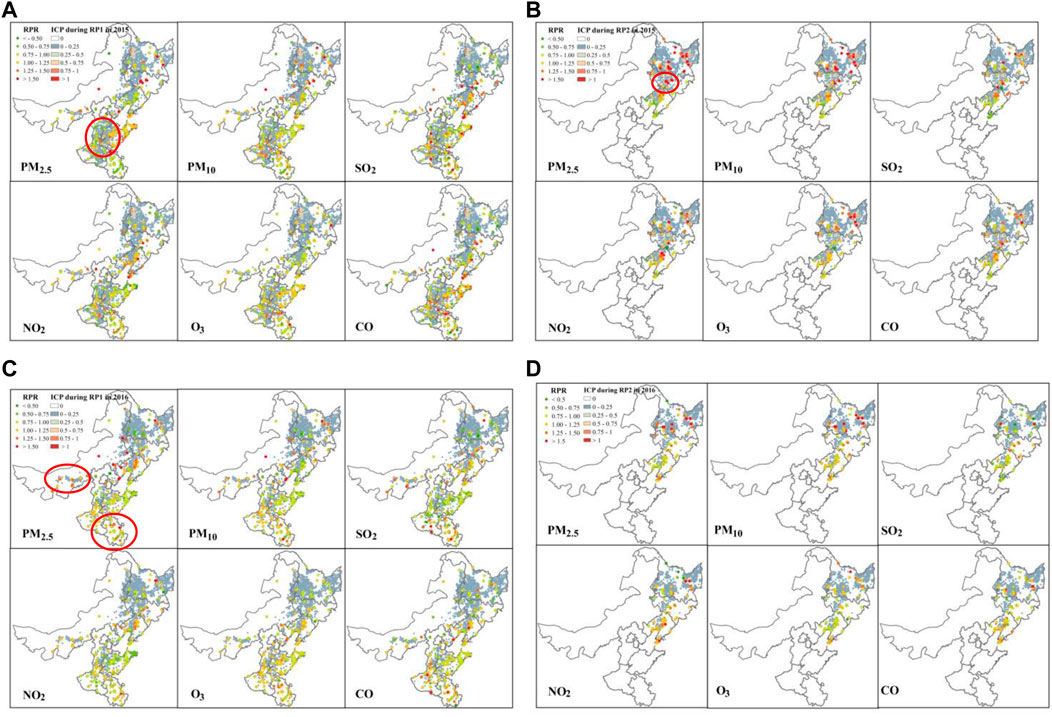
FIGURE 5. Spatial distribution of RPR for monitoring sites in different Pds: (A) HLJ-Pd1, JL-Pd1, LN-Pd1, IM-Pd, HB-Pd, SD-Pd, HN-Pd, and AH-Pd in 2015, (B) HLJ-Pd2, JL-Pd2, and LN-Pd2 in 2015, (C) HLJ-Pd1, JL-Pd1, LN-Pd1, IM-Pd, HB-Pd, SD-Pd, HN-Pd, and AH-Pd in 2016, and (D) HLJ-Pd2, JL-Pd2, and LN-Pd2 in 2016.
Heilongjiang, Jilin, and Liaoning had high RPR for almost all pollutants. Specifically, the RPR for Pd2 was the highest in 2015. In Heilongjiang, Jilin, and Liaoning, 67.88%, 72.12%, 48.48%, 80.00%, 77.58%, and 69.09% of the monitoring sites experienced an RPR greater than 1 during this period for
For IM-Pd, in 2016, the sites close (see the marked area in Inner Mongolia in Figure 5C) to CRB experienced a higher RPR, especially for
In general, the results of the spatial analysis were consistent with those of the box-plot analysis. A severe influence of CRB on air pollution has been detected in Heilongjiang, Jilin, and Liaoning. Therefore, substantial CRB leads to a large-scale impact on air pollution. When the CRB spots were limited, such as in Hebei, Shandong, Henan, and Anhui, the impact of air pollution occurred at places in or close to CRB spots and did not lead to an obvious impact on places further away from CRB.
4 Discussion
Given the immensity of crop residue in China and its adverse impact on air quality, regulations have been established to control emissions from open CRB since 1999 (Sun et al., 2016; Huang et al., 2019; Yang et al., 2020). However, despite these regulations, changes in practice have not been widely adopted by farmers (Yang et al., 2020) because of difficulties in the sustainable use of crop residues (Huang et al., 2019). In this context, understanding the changes in air pollution during periods of intensive or substantial CRB remains a significant public issue.
Although many studies have calculated the annual emissions of CRB in China for various air pollutants using emission factors from different aspects, short-term changes in air pollutants during the CRB seasons remain a concern for the public and government. Previous studies have confirmed a decrease in air quality during seasons with intensive CRB for
Many studies have suggested that PM air quality had improved from 2015 to 2016 because of the introduction of relevant laws and regulations, such as the Five-year Air Pollution Prevention and Control Action Plan in China. Silver et al. (2018) found that in China, from 2015 to 2017,
There are multiple anthropogenic sources of air pollution, including industrial processes and fossil fuel combustion (Song et al., 2017), motor vehicles (Liao et al., 2015), and waste burning. However, these sources usually show annual rather than seasonal trends. As an important source of air pollution, seasonal changes in CRB may lead to seasonal changes in air pollution. The results showed a drop in CRB spots from 2015 to 2016, which could be a contributor to air quality improvement in China (Yamaji et al., 2010; Chen et al., 2015; Wen et al., 2018). Wen et al. (2018) analyzed the spatiotemporal variations of daily
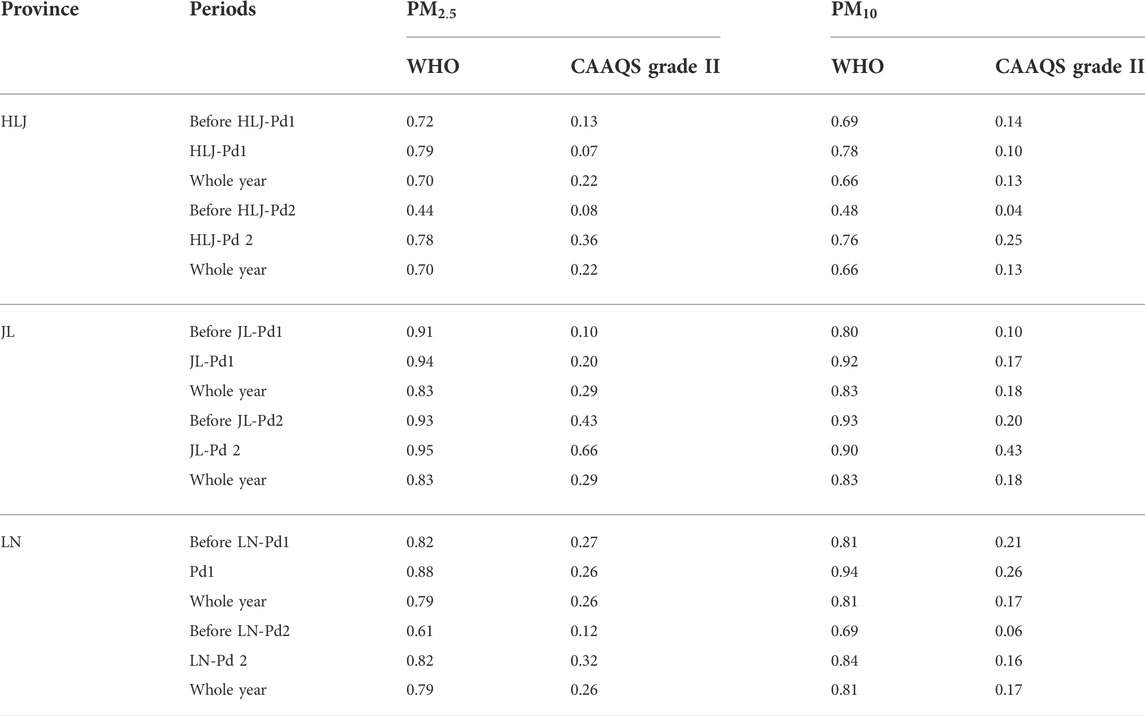
Our study detected the severe impact of CRB on PM pollutants in northeast China, and to fully understand this impact, two associated health risk standards of air pollution were used to discuss the impact degree of CRB on air quality. These two standards are grade II standards of the Chinese Ambient Air Quality (CAAQS) issued by the Chinese Ministry of Ecology and Environment (2012) (revised in 2018) and the standard released by the World Health Organization (2016) (https://www.who.int/airpollution/publications/aqg2005/en/). The ratio of monitoring sites exceeding health risk limitations in periods with intensive CRB was calculated for the provinces in northeast China for PM pollutants (see Table 2).
The results showed that the ratio of sites exceeding health risk limitations was higher for Pd than for 20 days before Pd or for the entire year. These results confirm our conclusions. The results of this study are useful for the Chinese government to formulate regulations on air quality promotion during CRB seasons from a holistic perspective. Recently, scholars have focused on air pollutant characteristics and health risks at national, regional, and provincial scales (Chen et al., 2013; Shen et al., 2017; Luo et al., 2020; Maji et al., 2020; Shen et al., 2020). However, most of these studies have been conducted at the annual change level. In this study, the associated health risks of air pollutants during a specific period with intensive CRB were discussed. As high health risks and increases in air pollutant concentration have been confirmed during CRB seasons, it is necessary to emphasize CRB management during specific periods, such as sowing and harvesting seasons.
5 Conclusion
This study reveals changes in air quality during periods of substantial CRB. The results suggest a spatially varying impact of CRB in China. Severely poor air quality was found in northeast China, where CRB was concentrated. Using remote sensing images, higher concentrations of PM pollutants were detected during seasons with substantial CRB. Meanwhile, an increase in pollutant concentration occurred on a larger scale in northeast China compared to other provinces. The results also confirm a decrease in air pollutant concentration from 2015 to 2016, when CRB decreased. These results may contribute to CRB control in China by identifying hotspots.
However, this study has a few limitations. It used a statistical method to identify the spatial and temporal changes in air pollutant concentrations during CRB seasons. The mechanism by which CRB emits air pollutants and how these pollutants are processed in the atmosphere have not been discussed. The statistical results indicate a seasonal trend in CRB and a correlation between CRB spots and concentrations of air pollutants. This facilitates the overall control of CRB and air pollution to determine key seasons and air pollutant types in regions. In future studies, spatial statistics can be combined with simulation models, such as the Community Multiscale Air Quality Modeling System (CMAQ) and Weather Research and Forecasting (WRF) model coupled with Chemistry (WRF-Chem), to fully reflect the changes in air quality.
Data availability statement
The raw data supporting the conclusion of this article will be made available by the authors, without undue reservation.
Author contributions
All authors contributed to the study conception and design. TW: methodology, investigation, formal analysis, and writing the original draft; KM: data curation, software, visualization, and writing the original draft; PF: conceptualization and writing—editing; and WH: funding acquisition and writing—review and editing. All contributed to the manuscript and agree to its submission. All authors read and approved the final manuscript.
Funding
This work was provided by the National Natural Science Foundation of China under grant nos. 42171056, U2240222, and 41877001.
Acknowledgments
The authors would like to thank the Data Central, Institute of Geographic Sciences and Natural Resources Research, Chinese Academy of Sciences, for providing the land-use datasets.
Conflict of interest
The authors declare that the research was conducted in the absence of any commercial or financial relationships that could be construed as a potential conflict of interest.
Publisher’s note
All claims expressed in this article are solely those of the authors and do not necessarily represent those of their affiliated organizations, or those of the publisher, the editors, and the reviewers. Any product that may be evaluated in this article, or claim that may be made by its manufacturer, is not guaranteed or endorsed by the publisher.
References
Bao, J. Z., Yang, X. P., Zhao, Z. Y., Wang, Z. K., Yu, C. H., and Li, X. D. (2015). The spatial-temporal characteristics of air pollution in China from 2001-2014. Int. J. Environ. Res. Public Health 12 (12), 15875–15887. doi:10.3390/ijerph121215029
Cao, G. L., Zhang, X. Y., and Zheng, F. C. (2006). Inventory of black carbon and organic carbon emissions from China. Atmos. Environ. X. 40 (34), 6516–6527. doi:10.1016/j.atmosenv.2006.05.070
Chen, Y., and Xie, S. D. (2014). Characteristics and formation mechanism of a heavy air pollution episode caused by biomass burning in Chengdu, Southwest China. Sci. Total Environ. 473, 507–517. doi:10.1016/j.scitotenv.2013.12.069
Chen, R. J., Wang, X., Meng, X., Hua, J., Zhou, Z. J., Chen, B. H., et al. (2013). Communicating air pollution-related health risks to the public: An application of the Air Quality Health Index in Shanghai, China. Environ. Int. 51, 168–173. doi:10.1016/j.envint.2012.11.008
Chen, W. W., Tong, D., Zhang, S. C., Dan, M., Zhang, X. L., and Zhao, H. M. (2015). Temporal variability of atmospheric particulate matter and chemical composition during a growing season at an agricultural site in northeastern China. J. Environ. Sci. 38, 133–141. doi:10.1016/j.jes.2015.05.023
Chen, J. M., Li, C. L., Ristovski, Z., Milic, A., Gu, Y. T., Islam, M. S., et al. (2017). A review of biomass burning: Emissions and impacts on air quality, health and climate in China. Sci. Total Environ. 579, 1000–1034. doi:10.1016/j.scitotenv.2016.11.025
Chinese Ministry of Ecology and Environment (2012). Ambient air quality standards (GB3095-2012). Beijing: China Environmental Press.
Filonchyk, M., Yan, H. W., and Li, X. J. (2018). Temporal and spatial variation of particulate matter and its correlation with other criteria of air pollutants in Lanzhou, China, in spring-summer periods. Atmos. Pollut. Res. 9 (6), 1100–1110. doi:10.1016/j.apr.2018.04.011
Geng, G. N., Xiao, Q. Y., Zheng, Y. X., Tong, D., Zhang, Y. X., Zhang, X. Y., et al. (2019). Impact of China's air pollution prevention and control action plan on PM2.5 chemical composition over eastern China. Sci. China Earth Sci. 62 (12), 1872–1884. doi:10.1007/s11430-018-9353-x
Granier, C., Bessagnet, B., Bond, T., D'Angiola, A., van der Gon, H. D., Frost, G. J., et al. (2011). Evolution of anthropogenic and biomass burning emissions of air pollutants at global and regional scales during the 1980-2010 period. Clim. Change 109 (1-2), 163–190. doi:10.1007/s10584-011-0154-1
He, J. J., Gong, S. L., Yu, Y., Yu, L. J., Wu, L., Mao, H. J., et al. (2017). Air pollution characteristics and their relation to meteorological conditions during 2014-2015 in major Chinese cities. Environ. Pollut. 223, 484–496. doi:10.1016/j.envpol.2017.01.050
Hou, L. L., Chen, X. G., Kuhn, L. N., and Huang, J. K. (2019). The effectiveness of regulations and technologies on sustainable use of crop residue in Northeast China. Energy Econ. 81, 519–527. doi:10.1016/j.eneco.2019.04.015
Huang, X., Li, M. M., Li, J. F., and Song, Y. (2012a). A high-resolution emission inventory of crop burning in fields in China based on MODIS thermal anomalies/fire products. Atmos. Environ. X. 50, 9–15. doi:10.1016/j.atmosenv.2012.01.017
Huang, X., Song, Y., Li, M. M., Li, J. F., and Zhu, T. (2012b). Harvest season, high polluted season in East China. Environ. Res. Lett. 7 (4), 044033. doi:10.1088/1748-9326/7/4/044033
Huang, X. L., Cheng, L. L., Chien, H. P., Jiang, H., Yang, X. M., and Yin, C. B. (2019). Sustainability of returning wheat straw to field in Hebei, Shandong and jiangsu provinces: A contingent valuation method. J. Clean. Prod. 213, 1290–1298. doi:10.1016/j.jclepro.2018.12.242
Hwang, S. H., Lee, J. Y., Yi, S. M., and Kim, H. (2017). Associations of particulate matter and its components with emergency room visits for cardiovascular and respiratory diseases. PLoS One 12 (8), e0183224. doi:10.1371/journal.pone.0183224
Li, W. J., Shao, L. Y., and Buseck, P. R. (2010). Haze types in Beijing and the influence of agricultural biomass burning. Atmos. Chem. Phys. 10 (17), 8119–8130. doi:10.5194/acp-10-8119-2010
Li, R., Cui, L. L., Li, J. L., Zhao, A., Fu, H. B., Wu, Y., et al. (2017). Spatial and temporal variation of particulate matter and gaseous pollutants in China during 2014-2016. Atmos. Environ. X. 161, 235–246. doi:10.1016/j.atmosenv.2017.05.008
Li, R., Wang, Z. Z., Cui, L. L., Fu, H. B., Zhang, L. W., Kong, L. D., et al. (2019). Air pollution characteristics in China during 2015-2016: Spatiotemporal variations and key meteorological factors. Sci. Total Environ. 648, 902–915. doi:10.1016/j.scitotenv.2018.08.181
Li, C. L., Liu, M., Hu, Y. M., Zhou, R., Huang, N., Wu, W., et al. (2020). Spatial distribution characteristics of gaseous pollutants and particulate matter inside a city in the heating season of Northeast China. Sustain. Cities Soc. 61, 102302. doi:10.1016/j.scs.2020.102302
Liao, X., Tu, H., Maddock, J. E., Fan, S., Lan, G., Wu, Y., et al. (2015). Residents’ perception of air quality, pollution sources, and air pollution control in Nanchang, China. Atmos. Pollut. Res. 6 (5), 835–841. doi:10.5094/APR.2015.092
Liu, H., Jiang, G. M., Zhuang, H. Y., and Wang, K. J. (2008). Distribution, utilization structure and potential of biomass resources in rural China: With special references of crop residues. Renew. Sustain. Energy Rev. 12 (5), 1402–1418. doi:10.1016/j.rser.2007.01.011
Luo, H. P., Guan, Q. Y., Lin, J. K., Wang, Q. Z., Yang, L. Q., Tan, Z., et al. (2020). Air pollution characteristics and human health risks in key cities of northwest China. J. Environ. Manage. 269, 110791. doi:10.1016/j.jenvman.2020.110791
Lv, B. L., Zhang, B., and Bai, Y. Q. (2016). A systematic analysis of PM2.5 in Beijing and its sources from 2000 to 2012. Atmos. Environ. X. 124, 98–108. doi:10.1016/j.atmosenv.2015.09.031
Ma, X. Y., Jia, H. L., Sha, T., An, J. L., and Tian, R. (2019). Spatial and seasonal characteristics of particulate matter and gaseous pollution in China: Implications for control policy. Environ. Pollut. 248, 421–428. doi:10.1016/j.envpol.2019.02.038
Maji, K. J., Li, V. O. K., and Lam, J. C. K. (2020). Effects of China's current Air Pollution Prevention and Control Action Plan on air pollution patterns, health risks and mortalities in Beijing 2014-2018. Chemosphere 260. 127572. doi:10.1016/j.chemosphere.2020.127572
Ni, H. Y., Tian, J., Wang, X. L., Wang, Q. Y., Han, Y. M., Cao, J. J., et al. (2017). PM2.5 emissions and source profiles from open burning of crop residues. Atmos. Environ. X. 169, 229–237. doi:10.1016/j.atmosenv.2017.08.063
Peng, R. D., Bell, M. L., Geyh, A. S., McDermott, A., Zeger, S. L., Samet, J. M., et al. (2009). Emergency admissions for cardiovascular and respiratory diseases and the chemical composition of fine particle air pollution. Environ. Health Perspect. 117 (6), 957–963. doi:10.1289/ehp.0800185
Qiu, H. G., Sun, L. X., Xu, X. L., Cai, Y. Q., and Bai, J. F. (2014). Potentials of crop residues for commercial energy production in China: A geographic and economic analysis. Biomass Bioenergy 64, 110–123. doi:10.1016/j.biombioe.2014.03.055
Sahu, S. K., Mangaraj, P., Beig, G., Samal, A., Pradhan, C., Dash, S., et al. (2021). Quantifying the high resolution seasonal emission of air pollutants from crop residue burning in India. Environ. Pollut. 286, 117165. doi:10.1016/j.envpol.2021.117165
Saxena, P., Sonwani, S., Srivastava, A., Jain, M., Srivastava, A., Bharti, A., et al. (2021). Impact of crop residue burning in Haryana on the air quality of Delhi, India. Heliyon 7 (5), e06973. doi:10.1016/j.heliyon.2021.e06973
Shen, F. Z., Ge, X. L., Hu, J. L., Nie, D. Y., Tian, L., and Chen, M. D. (2017). Air pollution characteristics and health risks in Henan Province, China. Environ. Res. 156, 625–634. doi:10.1016/j.envres.2017.04.026
Shen, F. Z., Zhang, L., Jiang, L., Tang, M. Q., Gai, X. Y., Chen, M. D., et al. (2020). Temporal variations of six ambient criteria air pollutants from 2015 to 2018, their spatial distributions, health risks and relationships with socioeconomic factors during 2018 in China. Environ. Int. 137, 105556. doi:10.1016/j.envint.2020.105556
Silver, B., Reddington, C. L., Arnold, S. R., and Spracklen, D. V. (2018). Substantial changes in air pollution across China during 2015-2017. Environ. Res. Lett. 13 (11), 114012. doi:10.1088/1748-9326/aae718
Song, C., Wu, L., Xie, Y., He, J., Chen, X., Wang, T., et al. (2017). Air pollution in China: Status and spatiotemporal variations. Environ. Pollut. 227, 334–347. doi:10.1016/j.envpol.2017.04.075
Sun, J. F., Peng, H. Y., Chen, J. M., Wang, X. M., Wei, M., Li, W. J., et al. (2016). An estimation of CO2 emission via agricultural crop residue open field burning in China from 1996 to 2013. J. Clean. Prod. 112, 2625–2631. doi:10.1016/j.jclepro.2015.09.112
Sun, X., Luo, X. S., Xu, J. B., Zhao, Z., Chen, Y., Wu, L. C., et al. (2019). Spatio-temporal variations and factors of a provincial PM2.5 pollution in eastern China during 2013-2017 by geostatistics. Sci. Rep. 9, 3613. doi:10.1038/s41598-019-40426-8
Tao, J., Zhang, L. M., Engling, G., Zhang, R. J., Yang, Y. H., Cao, J. J., et al. (2013). Chemical composition of PM2.5 in an urban environment in Chengdu, China: Importance of springtime dust storms and biomass burning. Atmos. Res. 122, 270–283. doi:10.1016/j.atmosres.2012.11.004
Tilt, B. (2019). China's air pollution crisis: Science and policy perspectives. Environ. Sci. Policy 92, 275–280. doi:10.1016/j.envsci.2018.11.020
Wang, X. Y., Yang, L., Steinberger, Y., Liu, Z. X., Liao, S. H., and Xie, G. H. (2013). Field crop residue estimate and availability for biofuel production in China. Renew. Sustain. Energy Rev. 27, 864–875. doi:10.1016/j.rser.2013.07.005
Wang, Y. G., Ying, Q., Hu, J. L., and Zhang, H. L. (2014). Spatial and temporal variations of six criteria air pollutants in 31 provincial capital cities in China during 2013-2014. Environ. Int. 73, 413–422. doi:10.1016/j.envint.2014.08.016
Wang, L. L., Xin, J. Y., Li, X. R., and Wang, Y. S. (2015). The variability of biomass burning and its influence on regional aerosol properties during the wheat harvest season in North China. Atmos. Res. 157, 153–163. doi:10.1016/j.atmosres.2015.01.009
Wen, X., Zhang, P. Y., and Liu, D. Q. (2018). Spatiotemporal variations and influencing factors analysis of PM2.5 concentrations in Jilin province, northeast China. Chin. Geogr. Sci. 28 (5), 810–822. doi:10.1007/s11769-018-0992-0
World Health Organization (2016). “WHO air quality guidelines for paticulate matter, ozone, nitrogen dioxide and sulfur dioxide:global update 2005,” in Summary of risk assessment (Switzerland: WHO Press).
Wu, R. S., Song, X. M., Chen, D. H., Zhong, L. J., Huang, X. L., Bai, Y. C., et al. (2019). Health benefit of air quality improvement in Guangzhou, China: Results from a long time-series analysis (2006-2016). Environ. Int. 126, 552–559. doi:10.1016/j.envint.2019.02.064
Xu, Q., Li, X., Wang, S., Wang, C., Huang, F. F., Gao, Q., et al. (2016). Fine particulate air pollution and hospital emergency room visits for respiratory disease in urban areas in beijing, China, in 2013. PLoS One 11 (4), e0153099. doi:10.1371/journal.pone.0153099
Yamaji, K., Li, J., Uno, I., Kanaya, Y., Irie, H., Takigawa, M., et al. (2010). Impact of open crop residual burning on air quality over Central Eastern China during the Mount Tai Experiment 2006 (MTX2006). Atmos. Chem. Phys. 10 (15), 7353–7368. doi:10.5194/acp-10-7353-2010
Yan, X. Y., Ohara, T., and Akimoto, H. (2006). Bottom-up estimate of biomass burning in mainland China. Atmos. Environ. X. 40 (27), 5262–5273. doi:10.1016/j.atmosenv.2006.04.040
Yang, S. J., He, H. P., Lu, S. L., Chen, D., and Zhu, J. X. (2008). Quantification of crop residue burning in the field and its influence on ambient air quality in Suqian, China. Atmos. Environ. X. 42 (9), 1961–1969. doi:10.1016/j.atmosenv.2007.12.007
Yang, G. Y., Zhao, H. M., Tong, D. Q., Xiu, A. J., Zhang, X. L., and Gao, C. (2020). Impacts of post-harvest open biomass burning and burning ban policy on severe haze in the Northeastern China. Sci. Total Environ. 716, 136517. doi:10.1016/j.scitotenv.2020.136517
Yin, D. Y., Zhao, S. P., and Qu, J. J. (2017a). Spatial and seasonal variations of gaseous and particulate matter pollutants in 31 provincial capital cities, China. Air Qual. Atmos. Health 10 (3), 359–370. doi:10.1007/s11869-016-0432-1
Yin, S., Wang, X. F., Xiao, Y., Tani, H., Zhong, G. S., and Sun, Z. Y. (2017b). Study on spatial distribution of crop residue burning and PM2.5 change in China. Environ. Pollut. 220, 204–221. doi:10.1016/j.envpol.2016.09.040
Yin, S., Guo, M., Wang, X. F., Yamamoto, H., and Ou, W. (2021). Spatiotemporal variation and distribution characteristics of crop residue burning in China from 2001 to 2018. Environ. Pollut. 268, 115849. doi:10.1016/j.envpol.2020.115849
You, W., Zang, Z. L., Zhang, L. F., Li, Z. J., Chen, D., and Zhang, G. (2015). Estimating ground-level PM10 concentration in northwestern China using geographically weighted regression based on satellite AOD combined with CALIPSO and MODIS fire count. Remote Sens. Environ. 168, 276–285. doi:10.1016/j.rse.2015.07.020
Yu, M. M., Yuan, X. L., He, Q. Q., Yu, Y. H., Cao, K., Zhang, W. T., et al. (2019). Temporal-spatial analysis of crop residue burning in China and its impact on aerosol pollution. Environ. Pollut. 245, 616–626. doi:10.1016/j.envpol.2018.11.001
Zha, S. P., Zhang, S. Q., Cheng, T. T., Chen, J. M., Huang, G. H., Li, X., et al. (2013). Agricultural fires and their potential impacts on regional air quality over China. Aerosol Air Qual. Res. 13 (3), 992–1001. doi:10.4209/aaqr.2012.10.0277
Zhai, S. X., Jacob, D. J., Wang, X., Shen, L., Li, K., Zhang, Y. Z., et al. (2019). Fine particulate matter (PM2.5) trends in China, 2013-2018: separating contributions from anthropogenic emissions and meteorology. Atmos. Chem. Phys. 19 (16), 11031–11041. doi:10.5194/acp-19-11031-2019
Zhang, L. B., Liu, Y. Q., and Hao, L. (2016). Contributions of open crop straw burning emissions to PM2.5 concentrations in China. Environ. Res. Lett. 11 (1), 014014. doi:10.1088/1748-9326/11/1/014014
Zhuang, Y., Chen, D. L., Li, R. Y., Chen, Z. Y., Cai, J., He, B., et al. (2018a). Understanding the influence of crop residue burning on PM2.5 and PM10 concentrations in China from 2013 to 2017 using MODIS data. Int. J. Environ. Res. Public Health 15 (7), 1504. doi:10.3390/ijerph15071504
Keywords: crop residue burning, MODIS, major air pollutant, China, spatiotemporal changes
Citation: Wang T, Meng K, Fu P and Huang W (2022) Crop residual burning correlations with major air pollutants in mainland China. Front. Environ. Sci. 10:1002610. doi: 10.3389/fenvs.2022.1002610
Received: 25 July 2022; Accepted: 28 September 2022;
Published: 14 October 2022.
Edited by:
Qingsong He, Huazhong University of Science and Technology, ChinaReviewed by:
Qingqing He, Wuhan University of Technology, ChinaMing Luo, Sun Yat-sen University, China
Copyright © 2022 Wang, Meng, Fu and Huang. This is an open-access article distributed under the terms of the Creative Commons Attribution License (CC BY). The use, distribution or reproduction in other forums is permitted, provided the original author(s) and the copyright owner(s) are credited and that the original publication in this journal is cited, in accordance with accepted academic practice. No use, distribution or reproduction is permitted which does not comply with these terms.
*Correspondence: Wei Huang, Y2NhbkBtYWlsLmh6YXUuZWR1LmNu
 Tianwei Wang
 Ke Meng
 Wei Huang