 Bin Chen1
 Junhao Ye
- 1China Southern Power Grid Company Limited, Guangzhou, China
- 2Guangzhou University School of Economics and Statistics, Guangzhou, Guangdong, China
- 3Digital Grid Group of China Southern Power Grid, Guangzhou, Guangdong, China
Improving energy efficiency and optimizing energy structure is the key to achieving the “dual carbon” goal and high-quality development. This paper calculates the energy efficiency of 30 provinces in China between 2000 and 2017 using the DEA method. The study found that in China, the energy efficiency is higher in East China than in West China, in South China than in North China, and in the coastal areas than in the interior. Moreover, the efficiency gap between clean fuel and fossil fuel is widening. Taking total power consumption as energy input and measuring carbon emissions using regional grid base line emission factor can accurately measure China’s clean energy efficiency. The conclusions of the study provide important references for promoting China’s energy transformation and the development of the green economy.
1 Introduction
On 22 September 2020, President Xi Jinping solemnly announced to the world at the 75th UN General Assembly that China would strive to achieve the goal of “carbon peaking” by 2030 and further realize “carbon neutrality” by 2060, which are also called “double carbon” goal. There is no doubt that the key to achieving the “double carbon” goal is to improve energy efficiency and optimize energy structure.
Although China is a country rich in natural resources, the per-capita quantity of resources is relatively low compared with other countries. As a result, China’s import dependence on oil and natural gas has always been high. However, owing to the impact of the COVID-19 pandemic and regional political and military conflicts, there exists dramatic imbalance between energy supply and demand in today’s world, with drastic fluctuations in energy prices and a gap in imported fossil energy supply. Considering these difficulties, it is particularly important whether clean energy can fill the gap and improve the overall energy efficiency. Koirala and Bohara (2021) proposed that households have no incentive to adopt the energy efficiency policy, which has created an unusual gap in energy efficiency of US. Wang et al. (2022) found that the energy efficiency of different provincal regions in China is different, and here is a resource curse at the national level. Paramati et al. (2022) believed that the energy intensity of 28 OECD countries has been decreasing in recent years as the application of environmentally friendly technologies. However, most of the existing studies still focus on fossil energy efficiency, while there is a lack of comparative researches associated with clean energy efficiency, which results in the shortage of theoretical basis for clean energy-related policies. Therefore, this paper adopts DEA method based on directional distance function to calculate China’s inter-provincial efficiency and the structure of fossil energy and clean energy. Besides, this paper also makes a comparative analysis between clean energy efficiency and fossil energy efficiency, and discuss how to improve the overall energy efficiency or realize the transformation of energy structure.
The rest of this paper proceeds as follows: The second part is a review of related literature. The third part introduces the DEA model, describes the variables adopted and data sources. The fourth part reports the calculation results of clean energy and fossil energy efficiency, and analyzes China’s energy efficiency structure. The fifth part provides a summary and policy suggestions.
2 Literature review
Existing studies on energy efficiency can be divided into three categories: Calculation of energy efficiency, determinants of energy efficiency and the influences of energy efficiency on the economy or the society. There are mainly two ways to calculate energy efficiency. One is the calculation of single-factor energy efficiency. Shi (2002) analyzed the changes in China’s energy efficiency from the perspective of energy intensity, arguing that the opening up, the upgrading of industrial structure and the reformation of economic system are the three key reasons why China was able to improve its energy efficiency since 1978. Lyubich et al. (2018) used energy productivity to measure the energy efficiency of enterprises, arguing that this index is more comparable with other productivity index. Although the calculation of single-factor energy efficiency is easy to perform, but it has a disadvantage that only the relationship between energy input and economic output is measured, while the influences of other input factors on productivity are ignored, possibly bringing about biases during the calculation of energy efficiency. Another method is total factor energy efficiency. The radial definition of technical, allocative and overall productive efficiency introduced by Farrell (1957) and the non-radial concept of input specific technical efficiency introduced by Kopp (1981) can be helpful to understand the concept of total factor productive efficiency. Inspired by Kopp (1981), Filippini and Hunt (2009) proposed that total factor energy efficiency can be calculated more accurately through estimating a single conditional input demand frontier function. Hu and Wang (2006) measured China’s total factor energy efficiency for the first time.Shi et al. (2008) calculated China’s energy efficiency from 1980 s to the beginning of this century using stochastic frontier production function (SFPF), concluding that improving the efficiency of resource allocation in the backward regions and enhancing the scientific and technological communications between developed regions and backward regions are the only two ways for backward regions to improve energy efficiency. Shi and Shen (2008) took knowledge stock into consideration while calculating total-factor energy efficiency, and analyzed the determinants of China’s inter-provincial total-factor energy efficiency. The results show that the resource-rich regions, such as Shanxi and Sichuan, had relatively lower total factor energy efficiency. The main reason is that market segmentation distorts the efficiency of resource allocation. Chen (2010) took pollution as an undesirable output, finding that the green total-factor energy efficiency level was much lower than the traditional energy efficiency. Zhang et al. (2011) calculated the total factor energy efficiency of the Yangtze River Delta region and found that when considering pollutant emissions, the excessive use of energy has resulted in a decrease in the growth rate of energy efficiency in the Yangtze River Delta region.
The second category of the studies focused on the determinants of energy efficiency or structure, such as industrial restructuring, technological progress and management (Kumbhakar and Wang, 2005; Yuan et al., 2012; Wang and Feng, 2013). According to structural division, these studies can be divided into two types. The first type focuses on the time structure of energy efficiency. Wilson et al. (1994) analysed the energy efficiency trends in Australia over the 17 year period from 1973 to 1974 to 1990–1991 and proved that energy efficiency gains in Australia may have been earlier underestimated. Shi (2002) explained the rise of energy efficiency following China’s rapid economic growth in the mid-1990 s from a long-term perspective, and pointed out that multiple factors, such as the opening up, the reformation of the economic system and the improvement of industrial structure, contribute to the accelerated growth of China’s energy utilization efficiency; Wu (2009) analyzed the changes in China’s energy efficiency from the perspective of short-term fluctuations, concluding that s government consumption and short-term changes in energy prices have significant impacts on energy efficiency. The second type of research focuses on the regional structure of energy efficiency. Wei and Shen (2009) analyzed the differences of energy efficiency at the country level, concluding that a uniform market can be established to improve energy efficiency. Zhang and Wu (2011). Measured total factor energy efficiency of 24 developing countries and found a U-shaped relationship between total factor energy efficiency and income per capita. Sun et al. (2021) investigated the energy efficiency of 24 innovating countries in the world between 1994 and 2013 and showed a positive, significant relationship between knowledge spillover and country-specific energy efficiency performance. Pan et al. (2017) analyzed the influences of technological progress on energy efficiency at the provincial level, and found that the impacts of technological progress on energy efficiency vary in different regions and years. The difference was mainly caused by market distortion. Chen and Chen (2019) analyzed the energy efficiency structure of enterprises, concluding that enterprise scale and regional disparity are the two main factors for the differences in the energy efficiency between enterprises. Shi and Li (2020) found that the establishment of emission trading market exerted an influence on green total-factor energy efficiency, and discussed the transmission effects of green technology innovation.
The third category of the studies focused on the influences of energy efficiency on the economy, society or the environment. Herring (2006) has argued that improving energy efficiency due to the energy rebound effect does not reduce national energy consumption and a more effective CO2 policy is to concentrate on shifting to non-fossil fuels. However, Shao et al. (2013) argues that the idea of reducing energy consumption by improving energy efficiency is generally practicable in China. Wang et al. (2010) argues that carbon dioxide emissions are reduced with the improvement of energy efficiency in the industrial sector. Lin and Liu (2015) claims that foreign trade has increased energy efficiency and thus improved the ecological environment. Liu et al. (2020) explored the relationship between energy efficiency and social welfare and found that the reduction of energy efficiency could reduce social welfare.
Reviewing the existing literature, it can be found that while using the indicator of energy efficiency, whether it is single factor energy efficiency or total factor energy efficiency, most of the studies simply convert coal, oil, natural gas and electricity into standard coal consumption as energy input without distinction between fossil energy and clean energy. This implicates the lack of sufficient researches on clean energy efficiency. In view of the above, this paper includes clean energy in the research to calculate fossil energy efficiency and clean energy efficiency respectively, and further explore the gap between the two types of energy efficiency.
3 DEA model
3.1 Model introduction
In this paper, data envelopment analysis (DEA), a method based on the multiple input-multiple output (MIMO) technology, is primarily used to calculate energy efficiency. The advantage of DEA model is that it can evaluate the operation efficiency of multi input and multi output decision making unit. DEA model does not need to specify the production function in the form of input and output, so it can evaluate the efficiency of decision making unit (DMU) and more complex production relations. In addition, the weight of DEA model is generated by mathematical programming based on data, and it is not necessary to set the weight of input and output in advance, so it is not affected by human subjective factors.
Based on the directional distance function (DDF) proposed by Fare et al. (2007), output-oriented DEA method is used to investigate China’s inter-provincial fossil energy efficiency and clean energy efficiency, during which we treat carbon dioxide emissions as an undesirable output. Specifically, each province is taken as a decision-making unit (DMU), and it is assumed that there are
According to Chung et al. (1997), production possibility is a closed and bounded set, while production inputs and desirable output are characterized by strong disposability. Besides, if we want
To calculate green energy efficiency more accurately, Chung et al. (1997) also considered the directional distance function (DDF), which is expressed as follows:
where
3.2 Variable selection
There are three types of variables used to calculate energy efficiency: inputs, desirable output and undesirable output. In this paper, the input variables selected for the calculation of China’s fossil energy efficiency are capital, labor, and energy. The desirable output variable is GDP. The undesirable output variable is carbon dioxide emission, and this is also a common practice in energy efficiency calculation. For capital input, capital stock is selected as an indicator, and the perpetual inventory method is used for calculation. In this paper, the method proposed by Zhang et al. (2004) is adopted for calculation with 2000 as the base period. For labor input, the year-end number of people employed in each province is selected as an indicator. Since coal, petroleum and natural gas are three major types of fossil energy. We convert seven specific types of fossil fuels into standard coal per 10,000 tons, including coal, coke, crude oil, gasoline, diesel, fuel oil, and natural gas, which is used as energy input. For GDP, the year2000 is taken as the base period to deflate the nominal GDP of each year in order to obtain the real annual GDP. The amount of consumption of the above seven energy types is multiplied by their carbon emission factor respectively to calculate the amount of carbon dioxide emissions.
For the calculation of clean energy efficiency, the following five variables are required: capital stock, labor force, energy input, GDP, and carbon dioxide emissions. The capital stock, labor force, and GDP are the same as those for fossil energy, but the major difference lies in energy input and carbon dioxide emissions. According to the existing literature, clean energy input can be measured by each province’s total yield of hydropower, wind power, nuclear power and photovoltaic power generation or total power consumption. For the former, the corresponding carbon emission factor is zero, and for the latter, the corresponding power carbon emission factor can be measured by either of the average regional grid emission factor and regional baseline grid emission factor. This paper calculates China’s clean energy efficiency using the above three different methods, and further explores which method is more accurate.
3.3 Data sources
This paper uses panel data of 30 Chinese provinces and regions collected from 2000 to 2017, with a total of 540 samples, and Tibet is excluded due to the lack of data. In addition, some energy input data of several provinces and years are missing, and these missing data are complemented by interpolation. All the above data are from China Statistical Yearbook, China Labour Statistical Yearbook, Chinese Energy Statistics Yearbook, and carbon emission factor reports issued by the National Development and Reform Commission (NDRC).
4 Empirical results and analysis
4.1 Calculation results of China’s fossil energy efficiency
First, the fossil energy efficiency is calculated. The results are shown in Figures 1, 2. As can be seen, among the three major economic zones, i.e., East China, central China and West China, the fossil energy efficiency of West China is significantly lower than that of the former two.
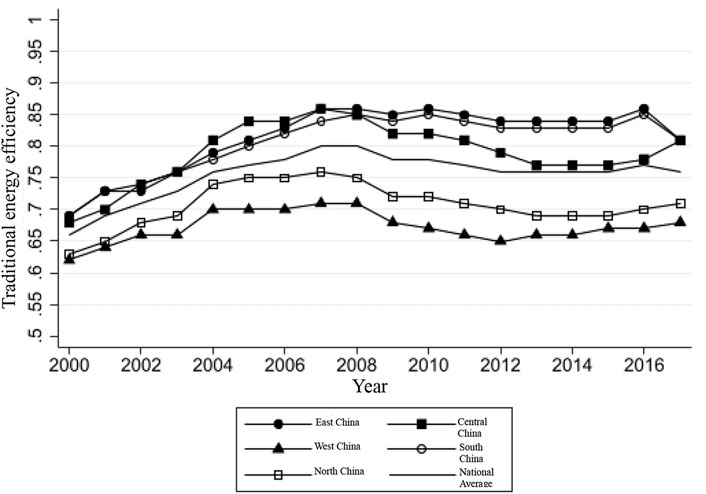
FIGURE 1. 2000-2017 fossil energy efficiency structure of China.
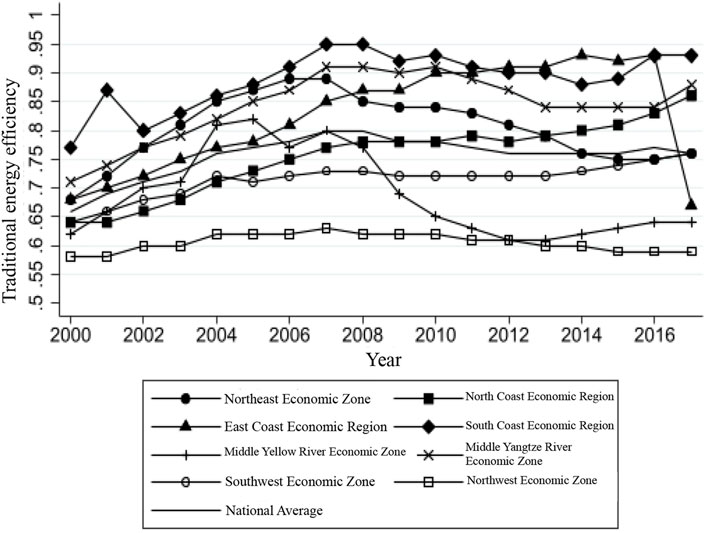
FIGURE 2. 2000-2017 fossil energy efficiency structure of China’s eight economic zones.
The energy efficiency of the eastern and central regions was similar between 2000 and 2007, after which the eastern region gradually became larger than the central region. The fossil energy efficiency of South China and North China showed the same trend, i.e., rose first and then leveled off, but the fossil energy efficiency of South China was higher than that of North China.
Figure 2 shows the fossil energy efficiency structure of China’s eight major economic zones. In general, the fossil energy efficiency of most of China’s economic zones rose first and then tended to stabilize. The national average was 0.66 in 2000, and this value gradually increased to 0.80 by 2007. Later, it gradually leveled off, and finally stabilized at 0.76. For each economic zone, most of them showed steady growth in fossil energy efficiency over the period from 2000 to 2007. The difference began to appear in 2007. The North Coast Economic Region, East Coast Economic Region and Southwest Economic Zone still showed an upward trend after that. The Middle Yangtze River Economic Zone, South Coast Economic Region, and Northwest Economic Zone gradually stabilized, accompanied by slight fluctuations from time to time. On the contrary, the fossil energy efficiency of the Northeast Economic Zone and Middle Yellow River Economic Zone declined somewhat. To be specific, the energy efficiency of the East Coast Economic Region, South Coast Economic Region, and Middle Yangtze River Economic Zone ranked top nationwide. The energy efficiency of the Middle Yellow River Economic Zone was low for the main reason that Inner Mongolia, Shanxi and some other provinces in Middle Yellow River Economic Zone were heavily dependent on resources, with fossil energy such as coal, accounting for a large proportion of the entire energy industry, thus resulting in excessively high carbon dioxide emissions and further leading to low energy efficiency. Finally, the energy utilization efficiency of the Northwest Economic Zone ranked last nationwide possibly due to its weak economic foundation, lack of energy and traffic inconvenience. Despite its backward development of science and technology compared with developed regions such as the East Coast Economic Region and South Coast Economic Region, the output efficiency would be far lower than the latter given the same amount of input.
4.2 Calculation results of China’s clean energy efficiency
Regarding the calculation of China’s clean energy efficiency, this paper adopts two indicators of clean energy (including hydropower, wind power, nuclear power, solar power, etc.) on the energy input side, i.e., total production and total power consumption. For the calculation of carbon emissions corresponding to total power consumption, the average regional grid emission factor and regional baseline grid emission factor are adopted. Thus, three different results of China’s clean energy efficiency can be obtained.
(1) Calculation results based on the new energy Figures 3, 4 show China’s clean energy efficiency calculated with the total production of clean energy such as hydropower, wind power, nuclear power, and solar energy as energy inputs, and the corresponding carbon emission factor is zero. As can be seen from Figure 3, among the three major economic zones, the clean energy efficiency ranked from high to low in east China, central China and West China. The clean energy efficiency of central China was very close to the national average. In addition, the clean energy efficiency of South China was significantly higher than that of North China. The gap between the two began to gradually widen in 2000, and remained stable after reaching a peak in 2011.
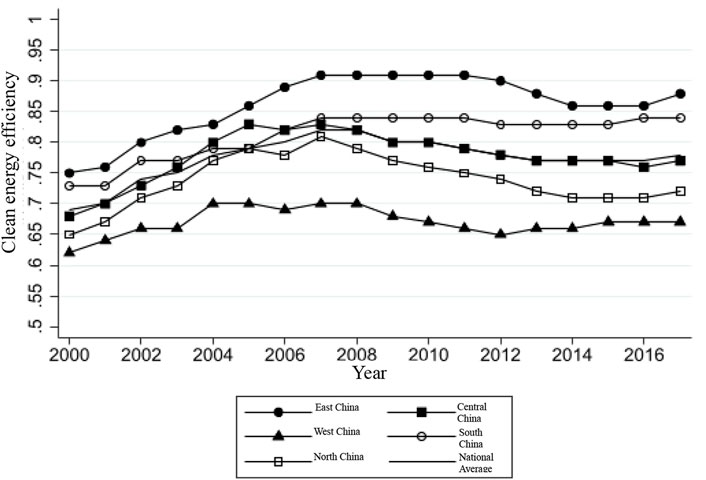
FIGURE 3. 2000-2017 clean energy efficiency structure of China (new energy).
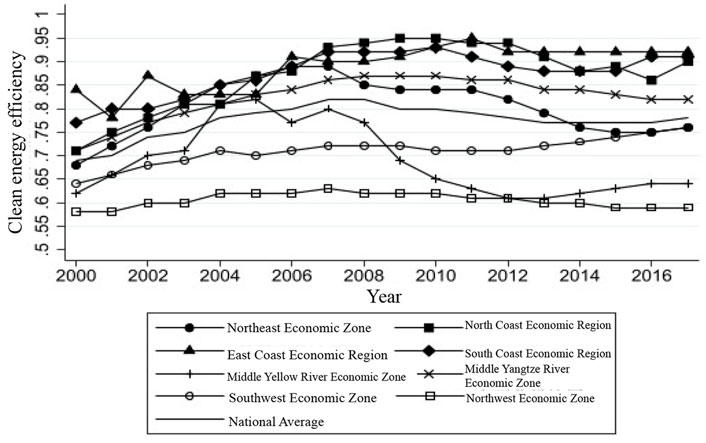
FIGURE 4. 2000-2017 clean energy efficiency structure of China’s eight economic zones (new energy).
In Figure 4, China’s energy efficiency structure calculated on this baseline is analyzed from the perspective of the eight major economic zones. As can be seen from Figure 4, the clean energy efficiency of most of China’s economic zones remained stable with slow growth. The average national clean energy efficiency was 0.69 in 2000, and increased to 0.78 in 2017, a growth rate of only 13%. From a regional perspective, the fossil energy efficiency of 17 provinces in five major economic zones, including the Northeast Economic Zone, North Coast Economic Region, East Coast Economic Region, South Coast Economic Region and Middle Yangtze River Economic Zone, was generally higher than the national average. The North Coast Economic Region, East Coast Economic Region, and South Coast Economic Region, located in coastal areas, had very high energy efficiency, mainly due to good economic benefits from excellent geological conditions and policy support. On the other hand, clean energy was commonly applied in these regions, so the growth of carbon dioxide emissions was slower than that of GDP. The Middle Yellow River Economic Zone had lower efficiency for the main reason that Shanxi and Inner Mongolia, major producers of thermal power, are located in this region, where coal and other fossil energy occupy an absolutely dominant position, while clean energy develops slowly. Moreover, they provide energy for other provinces. The green energy efficiency of the Southwest Economic Zone and Northwest Economic Zone was always significantly lower than the national average. However, the Southwest Economic Zone had relatively higher green energy efficiency compared with Northwest Economic Zone, which underwent a slight increase. From the perspective of time, the green energy efficiency of most economic zones showed an upward trend from 2000 to 2006. After that, the efficiency of the Northeast Economic Zone Middle Yellow River Economic Zone decreased, while other economic zones remained at a certain level.
(2) Calculation results based on total power consumption and average emission factor
Figures 5, 6 show China’s clean energy efficiency calculated using average regional grid emission factor with total power consumption as the energy input. As shown in Figure 5, under this calculation principle, the clean energy efficiency of central China was higher than that of East China before 2009, and then slightly lower than the latter, while the energy efficiency of West China remained at a relatively backward level. The clean energy efficiency of South China was significantly higher than that of North China. From the perspective of time, the clean energy efficiency of all economic zones, including East China, central China and West China or North China and South China, maintained a steady growth from 2000 to 2007, and then stabilized at a certain level.
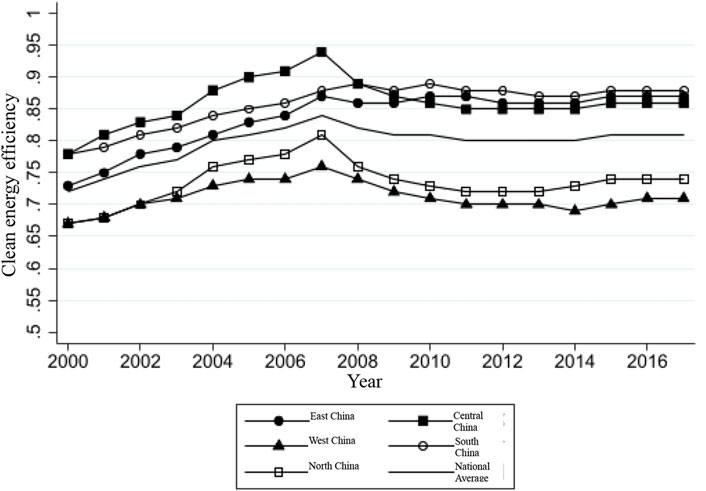
FIGURE 5. 2000-2017 green and clean energy efficiency structure of China (average emission factor).
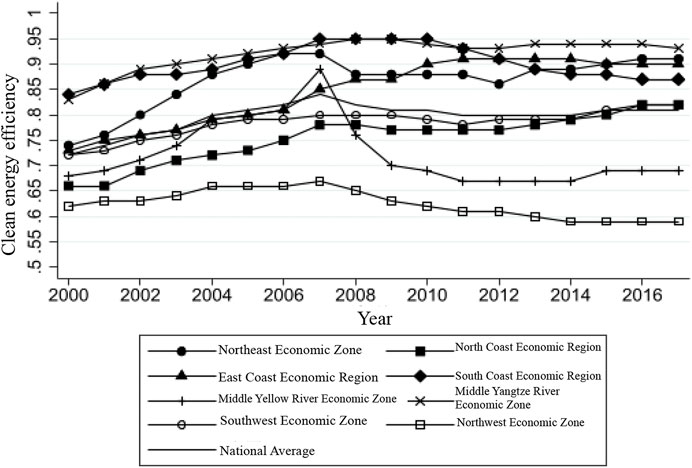
FIGURE 6. 2000-2017 green and clean energy efficiency structure of China’s eight major economic zones (average emission factor).
As can be seen from Figure 6, the clean energy efficiency of most Chinese economic zones grew slowly. The average national clean energy efficiency was 0.72 in 2000 and increased to 0.81 in 2017, a growth rate of 12.5% only. Specifically, the clean energy efficiency of three major economic zones, including the Northeast Economic Zone, Middle Yangtze River Economic Zone and South Coast Economic Region, consistently ranked top nationwide. Taking the Middle Yangtze River Economic Zone as an example, its total-factor clean energy efficiency was 0.83 in 2000, 0.11 higher than the national average, and 0.93 in 2017, 0.12 higher than the national average. It was followed by the Southwest Economic Zone and North Coast Economic Region. The efficiency of the Middle Yellow River Economic Zone was significantly lower than the national average after 2007, mainly because the region is rich in fossil energy such as coal, which provided the impetus for its early economic growth, promoting the improvement of energy efficiency. Further, path dependence would occur at the later stage, with energy transformation and upgrading running into a bottleneck. The clean energy efficiency of the Northwest Economic Zone consistently ranked last nationwide.
(3) Calculation results based on total electricity consumption caliber baseline grid emission factor
Figures 7, 8 show China’s clean energy efficiency calculated using the regional baseline grid emission factor with total power consumption as the energy input. Figure 7 shows that the clean energy efficiency of East China and central China are similar, and both are significantly higher than West China. On the other hand, the clean energy efficiency of South China was also higher than that of North China. From the perspective of time, clean energy efficiency was growing slowly nationwide.
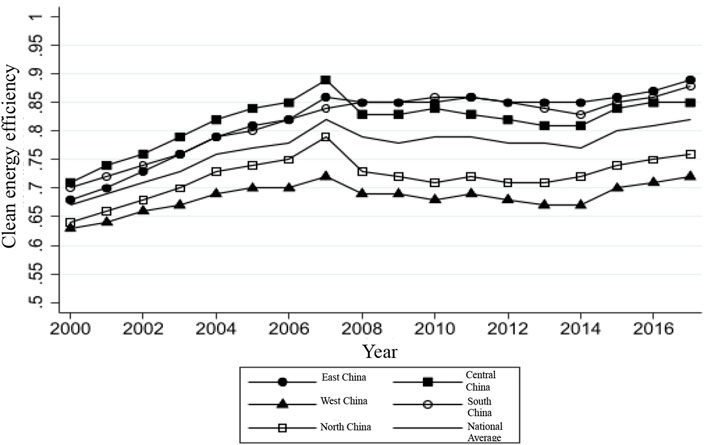
FIGURE 7. 2000-2017 green and clean energy efficiency structure of China (baseline grid emission factor).
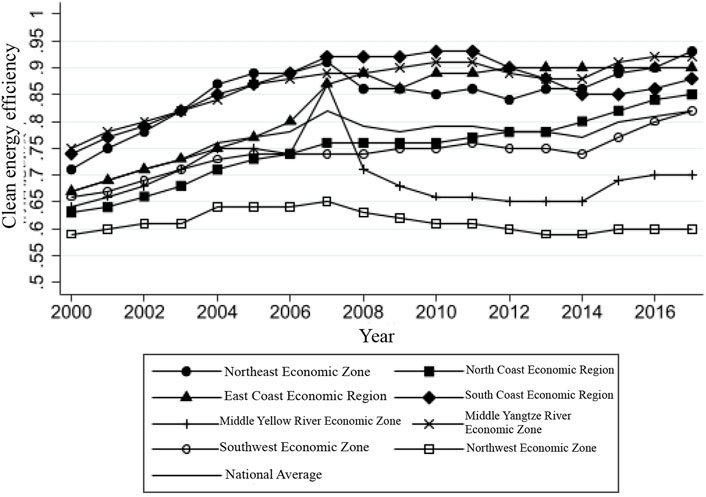
FIGURE 8. 2000-2017 green and clean energy efficiency structure of China’s eight economic zones (baseline grid emission factor).
Figure 8 shows that clean energy efficiency was gradually increasing in most economic zones of China. The average national clean energy efficiency was 0.67 in 2000 and increased to 0.82 in 2017. From a regional perspective, the green energy efficiency of the Northeast Economic Zone, Middle Yangtze River Economic Zone, East Coast Economic Region, and South Coast Economic Region was always higher than the national average. Taking the Middle Yangtze River Economic Zone as an example, its green total-factor clean energy efficiency had risen to 0.92 by 2017, a value close to the productive frontier. This is mainly because this zone includes areas such as Hubei, Hunan and other places that are rich in hydropower resources. It was followed by the North Coast Economic Region and Southwest Economic Zone. The North Coast Economic Region does not have clean energy reserves, but rather a good economic foundation. Sichuan provides hydropower for the Southwest Economic Zone, which is, however, dragged down by the slow economic growth of Yunnan and Guizhou. The efficiency value of the Middle Yellow River Economic Zone was significantly lower than the national average after 2007. From the perspective of time, the green energy efficiency of most economic zones was on the rise. Although the energy efficiency of the North Coast Economic Region and Southwest Economic Zone was positioned at the intermediate level nationwide, it showed good growth momentum and great development potential.
(4) Comparison of different calculation methods
In conclusion, there is barely a difference in green total-factor energy efficiency structure between the three methods. From a regional perspective, the efficiency of East China and central China was higher than that of West China, the efficiency of South China was higher than that of North China, and the efficiency of the coastal areas was higher than that of the interior. From the perspective of time, the efficiency increased rapidly from 2000 to 2007, and then gradually stabilized. Also, there is a difference among the results achieved by the three methods. The energy efficiency of the North Coast Economic Region in Figure 4 is significantly higher than that in Figures 6–8. The highest clean energy efficiency of the North Coast Economic Region in the three figures is 0.95 (Figure 4), 0.82 (Figure 6), and 0.85 (Figure 8), respectively. The clean energy efficiency of the Middle Yellow River Economic Zone is also lower than that in Figures 6–8. This is mainly because the first result is achieved from the production data of clean energy, which was used as the energy input, but sometimes, this cannot reflect the actual regional energy input. The Northern Economic Zone, including Beijing, Tianjin, Hebei, and Shanxi, is short of clean energy, and its actual energy production is smaller than its actual consumption. If energy efficiency is calculated under this condition, the input will be underestimated, with higher efficiency obtained. The Middle Yellow River Economic Zone comprises of major energy provinces, such as Shanxi and Inner Mongolia. For example, Inner Mongolia is rich in wind power. The energy produced in these regions is not only consumed locally, but also provided to other provinces. Its actual energy production is greater than its actual consumption. So, if the energy efficiency is calculated under this condition, the energy input will be overestimated, with lower efficiency obtained. Besides, the clean energy efficiency shown in Figure 6 grows at a slower rate than those in the other two figures. Taking the national average as an example, the 2000-2017 growth rate of national clean energy efficiency was 0.09 in Figures 6, 0.11 (Figure 4) and 0.15 (Figure 8) in other two figures. This is mainly because carbon emissions are calculated using the regional grid average emission factor in Figure 6, but this factor was not updated after 2012. The emission factor should also be gradually reduced with the advancement of technology. If the average regional grid emission factor is adopted, the undesirable output and carbon emissions of subsequent years will be overestimated, resulting in low energy efficiency and overall growth. Therefore, when clean energy efficiency is calculated, it is relatively more reasonable and practicable to take total power consumption as the energy input and use the regional baseline grid emission factor to calculate carbon dioxide emissions as an undesirable output. This calculation method will be taken as the baseline hereinafter to compare fossil energy efficiency with clean energy efficiency.
4.3 Analysis of the gap between fossil energy efficiency and clean energy efficiency
China’s efficiency of fossil energy efficiency and clean energy efficiency was calculated respectively above, and the following is a comparative analysis of the two types of efficiency. For the convenience of research, this paper figures out the gap between China’s clean energy efficiency and fossil energy efficiency (the value of clean energy efficiency minus that of fossil energy efficiency) (as summarized in Table 1) and the change rate of both (as summarized in Table 2).

TABLE 1. The gap between China’s fossil energy efficiency and clean energy efficiency.
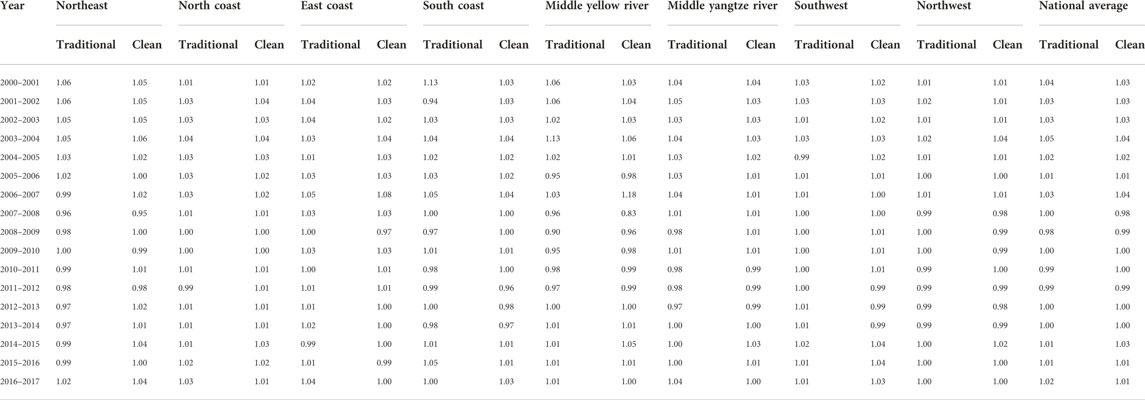
TABLE 2. Change rate of China’s fossil energy efficiency and clean energy efficiency.
Table 1 shows that in general, there is a small gap between China’s clean energy efficiency and fossil energy efficiency. As can be seen from the national average, the minimum gap between them is 0.1, while the maximum difference is 0.6. However, it is worth noting that this difference is gradually widening, which may be due to progress in clean energy application technology and increased returns to scale from growing clean energy production. Foreseeably, the gap between clean energy efficiency and fossil energy efficiency will widen in the future. This shows that given sufficient clean energy endowment, it is practicable to gradually replace fossil energy with clean energy to improve overall energy efficiency, develop the green economy, and achieve the goal of carbon neutrality at an early date.
For each economic zone, there is a different gap between the two types of efficiency. The green energy efficiency of the three major economic zones, i.e., the Northeast Economic Zone, Middle Yangtze River Economic Zone and Southwest Economic Zone, was higher than their fossil energy efficiency. The Northeast Economic Zone has a solid foundation for wind power generation and photovoltaic power generation. At the same time, the hydrogen energy industry shows a promising development trend. There are sufficient hydropower resources in the Middle Yangtze River Economic Zone and Southwest Economic Zone. The efficiency of the Middle Yellow River Economic Zone decreased first and then increased, from 0.02 in 2000 to -0.07 in 2008 and finally to 0.06 in 2017. In economically developed areas such as the East Coast Economic Region, North Coast Economic Region, and the South Coast Economic Region, the green energy efficiency was closer to or even slightly lower than the fossil energy efficiency. The main reason is that there is no geographical environment for clean energy development in these areas.
The indicator MLPI will be used hereinafter to further analyze the difference in change rate between fossil energy efficiency and clean energy efficiency. As shown in Table 2, MLPI was greater than 1 in most of the years, indicating that both fossil energy efficiency and clean energy efficiency were at the growth stage. According to the national average, for either fossil energy or clean energy, its growth showed a “U”-shaped trend. The trough period began in 2007 and ended in 2012. MLPI was lower than 1 in most of the years, and the energy efficiency declined to some extent.
From the perspective of regional disparity, the rate of change in fossil energy efficiency and clean energy efficiency was similar among the five major economic zones, including the North Coast Economic Region, East Coast Economic Region, South Coast Economic Region, Middle Yangtze River Economic Zone and Northwest Economic Zone. There was a large difference in the rate of change of the two energy efficiency in the Middle Yellow River Economic Zone, mainly due to the relatively large fluctuations in the rate of change of clean energy efficiency, but in recent years the two have gradually converged. From 2015 to 2017, the clean energy efficiency of the Southwest Economic Zone grew faster than its fossil energy efficiency. From 2008 onward, the fossil energy efficiency of the Northeast Economic Zone grew more slowly than its clean energy efficiency. To sum up, despite similar growth rates of clean energy efficiency and fossil energy efficiency nationwide, for each economic zone and even each province, due to the differences in resource endowment, technical conditions and economic foundation, the rate of change in the efficiency of both energy types was not the same. For each region, reasonable energy policies should be formulated according to the actual local conditions to further develop the energy industry. For example, clean energy can be further developed in the Northeast Economic Zone.
5 Discussion
In this paper, the DEA method was used to calculate the 2000-2017 fossil energy and clean energy efficiency of 30 Chinese provinces. The research findings are as follows: First, the fossil energy efficiency of most Chinese provinces increased first and then gradually stabilized, and was higher in East China than in West China, higher in South China than in North China, and higher in the coastal areas than in the interior. This result is consistent with the conclusions of Guan et al. (2015), Zhao and Dong (2022). According to the research of Guan et al. (2015), the fossil energy efficiency of the eastern region was significantly higher than that of the central and western regions between 2006 and 2011, about 0.84–0.98 in the eastern region, about 0.56–0.75 in the central region, and about 0.65–0.70 in the western region, which was consistent with the calculation data in this paper (Figure 1). Zhao and Dong (2022) believe that China’s industrial energy efficiency presents a spatial distribution pattern of South Central China > East China > Southwest China > Northeast China > North China > Northwest China. The conclusions of this paper are basically the same. It is believed that the energy efficiency of each economic region can be divided into three levels: the first level is the Eastern Coast, Southern Coast and Middle Yangtze River; The second level is the Northeast, the Northern Coast and the Great Southwest; The third level is the Middle Yellow River and the Northwest (Figure 2, Figure 4, Figure 6 and Figure 8). The difference of energy efficiency is related to economic basis, industrial structure, location factors, factor endowment and other factors, which also confirms the hypothesis of “resource curse” proposed by Wang et al. (2022).
Second, the clean energy efficiency of most Chinese provinces gradually increased. Moreover, the clean energy efficiency of the Northeast Economic Zone, Middle Yangtze River Economic Zone, East Coast Economic Region and South Coast Economic Region has consistently been higher than the national average (Figure 4, Figure 6 and Figure 8). Although the energy efficiency difference between clean energy and fossil energy is low at present, the gap is gradually expanding. It can be seen that the use of clean energy instead of fossil energy can improve the total factor energy efficiency. This is consistent with the conclusion of Cai and Cheng (2022), but they also pointed out that with the increase of the proportion of clean energy consumption, its promotion effect will continue to weaken.
Third, the change trend of clean energy efficiency has been gradually stable since 2008, and the clean energy efficiency of the middle reaches of the Middle Yellow River Economic Zone and the Northwest Economic Zone has even shown a downward trend, which is inconsistent with Shi and Li (2020) that the emission right market improves the green total factor energy efficiency, or at least, the emission rights trading has limited impact on the improvement of clean energy efficiency.
6 Conclusion
Based on the above discussions, this paper puts forward some conclusions as follows:
First, it is more reasonable and practicable to calculate China’s green energy efficiency by taking total power consumption as the energy input and adopting the carbon dioxide emissions calculated using the regional baseline grid emission factor as an undesirable output. Therefore, relevant government departments, such as NDRC, should chair the carbon emission calculation work and update the power carbon emission calculation coefficient in a timely manner. With the expanding application scope of clean energy, the update of the power carbon emission factor will not only help to measure carbon dioxide emissions, but also improve the accuracy of clean energy efficiency. The accurate measurement of indicators is of great importance for implementing and evaluating China’s energy conservation and emission reduction policies.
Second, it is practicable to upgrade and optimize industrial structure and energy structure, and vigorously develop clean energy. Clean energy has broad development prospects. With the advancement of technology, the clean energy efficiency is gradually exceeding fossil energy efficiency. By expanding the application of clean energy, we can effectively realize energy transformation and upgrading, develop the green economy, and achieve the “double carbon” goal at an early date.
Third, it is practicable to create a reasonable institutional environment, and transfer environmental responsibility to governments at all levels to avoid any negative effect of “one-size-fits-all” energy policies. There is a difference in resource endowment and economic foundation from region to region, so energy development policies should be formulated according to local conditions.
Data availability statement
The original contributions presented in the study are included in the article/Supplementary Material, further inquiries can be directed to the corresponding author.
Author contributions
Data and analysis: BC, YD, and JY. writing the original draft: BC, YD, JY, HX, YH, and PB. Resources: JY. revising and editing: YD, HX, YH, and PB. All authors have read and agreed to the published version of the manuscript.
Funding
This research received a funding from the National Natural Science Foundation of China, the Key Project of China Southern Power Grid Co. Ltd. (ZBKJXM20210229).
Conflict of interest
The authors declare that the research was conducted in the absence of any commercial or financial relationships that could be construed as a potential conflict of interest.
Publisher’s note
All claims expressed in this article are solely those of the authors and do not necessarily represent those of their affiliated organizations, or those of the publisher, the editors and the reviewers. Any product that may be evaluated in this article, or claim that may be made by its manufacturer, is not guaranteed or endorsed by the publisher.
References
Cai, H. X., and Cheng, X. L. (2022). Evaluation of China’s regional energy efficiency from the perspective of renewable energy. Soft Sci. 36 (6), 56–62. doi:10.13956/j.ss.1001-8409.2022.06.08
Chen, S. Y. (2010). Green industrial revolution in China: A perspective from the change of environmental total factor productivity(1980-2008). Econ. Res. J. (11), 21–34+58.
Chen, Z., and Chen, Q. Y. (2019). Energy efficiency of Chinese firms: Heterogeneity, influencing factors and policy implications. China Ind. Econ. 40 (12), 78–82. doi:10.3760/cma.j.issn.0253-2727.2019.01.017
Chung, Y. H., Fare, R., and Grosskopf, S. (1997). Productivity and undesirable outputs: A directional distance function approach. J. Environ. Manag. 51 (3), 229–240. doi:10.1006/jema.1997.0146
Farrell, M. J. (1957). The measurement of productive efficiency. J. R. Stat. Soc. Ser. A 120 (3), 253–281. doi:10.2307/2343100
Filippini, M., and Hunt, L. C. (2009). Energy demand and energy efficiency in the OECD countries: a stochastic demand frontier approach. CEPE Working Paper.
Gong, D. P., Zhao, T., Ci, Z. C., and Yao, H. (2015). Evaluation of regional industrial fossil energy efficiency in China based on super SBM and factors analysis. Acta Sci. Circumstantiae 35 (2), 585–595.
Herring, H. (2006). Energy efficiency—a critical view. Energy 31 (1), 10–20. doi:10.1016/j.energy.2004.04.055
Hu, J. L., and Wang, S. C. (2006). Total-factor energy efficiency of regions in China. Energy Policy 34 (17), 3206–3217. doi:10.1016/j.enpol.2005.06.015
Koirala, B. S., and Bohara, A. K. (2021). Do energy efficiency building codes help minimize the efficiency gap in the U.S.? A dynamic panel data approach. Energy & Environ. 32 (3), 506–518. doi:10.1177/0958305x20943881
Kumbhakar, S. C., and Wang, H. J. (2005). Estimation of growth convergence using a stochastic production frontier approach. Econ. Lett. 88 (3), 300–305. doi:10.1016/j.econlet.2005.01.023
Lin, B. Q., and Liu, H. X. (2015). Do energy and environment efficiency benefit from foreign trade?——the case of China's industrial sectors. Econ. Res. J. 50 (9), 127–141.
Liu, Z. M., Deng, M. Y., Yang, D., and Ma, Y. (2020). Can reducing the energy cost of enterprises improve energy efficiency and social welfare——analysis from the perspective of cross subsidy. China Ind. Econ. (3), 100–118. doi:10.19581/j.cnki.ciejournal.2020.03.016
Lyubich, E., Shapiro, J. S., and Walker, R. (2018). Regulating mismeasured pollution: Implications of firm heterogeneity for environmental policy. Cowles Foundation Discussion Papers.
Pan, X. F., Peng, X. X., and Li, B. (2017). Market distortion, technological progress and energy efficiency: Policy choice based on the provincial heterogeneity. J. World Econ. (1), 91–115.
Paramati, S. R., Shahzad, U., and Doğan, B. (2022). The role of environmental technology for energy demand and energy efficiency: Evidence from OECD countries. Renew. Sustain. Energy Rev. 153, 111735. doi:10.1016/j.rser.2021.111735
Shao, S., Yang, L. L., and Huang, T. (2013). Theoretical model and experience from China of energy rebound effect. Econ. Res. J. (2), 96–109.
Shi, B., and Shen, K. R. (2008). Market segment and total factor energy ffficiency in China: An empirical analysis based on superefficiency DEA. J. World Econ. (9), 49–59.
Shi, D., and Li, S. L. (2020). Emissions trading system and energy use efficiency——measurements and empirical evidence for cities at and above the prefecture level. China Ind. Econ. (9), 5–23. doi:10.19581/j.cnki.ciejournal.2020.09.001
Shi, D. (2002). The improvement of energy consumption efficiency in China’s economic growth. Econ. Res. J. (9), 49–56+94.
Shi, D., Wu, L. X., Fu, X. X., and Wu, B. (2008). Research on regional difference in China’s energy efficiency and causes: Based on variance decomposition of stochastic frontier production function (SFPF). Manag. World (2), 35–43. doi:10.19744/j.cnki.11-1235/f.2008.02.005
Sun, H., Edziah, B. K., Kporsu, A. K., Sarkodie, S. A., and Taghizadeh-Hesary, F. (2021). Energy efficiency: The role of technological innovation and knowledge spillover. Technol. Forecast. Soc. Change 167, 120659. doi:10.1016/j.techfore.2021.120659
Wang, F., and Feng, G. F. (2013). Evaluation of China’s regional energy and environmental efficiency based on DEA window model. China Ind. Econ. (07), 58–70. doi:10.19581/j.cnki.ciejournal.2013.07.005
Wang, F., Wu, L. H., and Yang, C. (2010). Driving factors for growth of carbon dioxide emissions during economic development in China. Econ. Res. J. (2), 123–136.
Wang, Y., Deng, X. Z., Zhang, H. W., Liu, Y., Yue, T., and Liu, G. (2022). Energy endowment, environmental regulation, and energy efficiency: Evidence from China. Technol. Forecast. Soc. Change 177, 121528. doi:10.1016/j.techfore.2022.121528
Wei, C., and Shen, M. H. (2009). Scale efficiency and allocation efficiency: An explanation on China’s energy inefficiency. J. World Econ. (4), 84–96.
Wilson, B., Trieu, L. H., and Bowen, B. (1994). Energy efficiency trends in Australia. Energy Policy 22 (4), 287–295. doi:10.1016/0301-4215(94)90003-5
Wu, L. X. (2009). The fluctuations of China's energy efficiency: Theoretical explains, numerical simulations and policy experiments. Econ. Res. J. (5), 130–142+160.
Yuan, Y. J., Guo, L. L., and Sun, J. (2012). Structure, technology, management and energy stochastic frontier approach based on provincial panel data during 2000-2010. China Ind. Econ. (7), 18–30. doi:10.19581/j.cnki.ciejournal.2012.07.002
Zhang, J., Wu, G. Y., and Zhang, J. P. (2004). The estimation of China’s provincial capital stock: 1952-2000. Econ. Res. J. (10), 35–44.
Zhang, W., and Wu, W. Y. (2011). Research on total-factor energy efficiency of metropolitan regions of Yangtze River Delta based on environmental performance. Econ. Res. J. (10), 95–109.
Zhang, X. P., Cheng, X. M., Yuan, J. H., and Gao, X. J. (2011). Total-factor energy efficiency in developing countries. Energy Policy 39 (2), 644–650. doi:10.1016/j.enpol.2010.10.037
Keywords: DEA, clean energy efficiency, carbon dioxide emission, China, environment
Citation: Chen B, Dai Y, Ye J, Xu H, Huang Y and Bie P (2022) Evaluating energy efficiency from the perspective of clean energy and carbon emission. Front. Environ. Sci. 10:1002572. doi: 10.3389/fenvs.2022.1002572
Received: 25 July 2022; Accepted: 25 August 2022;
Published: 17 October 2022.
Edited by:
Mihaela Simionescu, Romanian Academy, RomaniaReviewed by:
Alexandra Horobet, Bucharest Academy of Economic Studies, RomaniaMagdalena Radulescu, University of Pitesti, Romania
Copyright © 2022 Chen, Dai, Ye, Xu, Huang and Bie. This is an open-access article distributed under the terms of the Creative Commons Attribution License (CC BY). The use, distribution or reproduction in other forums is permitted, provided the original author(s) and the copyright owner(s) are credited and that the original publication in this journal is cited, in accordance with accepted academic practice. No use, distribution or reproduction is permitted which does not comply with these terms.
*Correspondence: Junhao Ye, aG91Yml4aWUwM0AxNjMuY29t