 Yusen Chen
 Shihang Zhang1,2,4†
- 1Xinjiang Institute of Ecology and Geography, Chinese Academy of Sciences, Xinjiang Uygur Autonomous Region, Urumqi, China
- 2University of Chinese Academy of Sciences, Beijing, China
- 3National Engineering Technology Research Center for Desert-Oasis Ecological Construction, Xinjiang Uygur Autonomous Region, Urumqi, China
- 4State Key Laboratory of Desert and Oasis Ecology, Xinjiang Institute of Ecology and Geography Chinese Academy of Sciences, Xinjiang Uygur Autonomous Region, Urumqi, China
Soil nutrient status is a crucial measure of soil fertility, which not only coordinates and provides the nutrients necessary for plant growth, but also stimulates the decomposition of soil humus and biogeochemical cycles. Therefore, understanding the distribution characteristics of soil nutrients in the Kyrgyzstan, while exploring the drivers of their variability, is important for understanding ecological processes and the distribution of soil resources. Simultaneously, the study of the spatial distribution of soil multifunctionality and its drivers across Kyrgyzstan can better elucidate the functions of the entire ecosystem, assist in optimizing the allocation of resources and serve as a reference material for the scientific and rational management of the country’s soil ecosystems. In this paper, We have used field sampling data from Kyrgyzstan, to examined the geographic variability and distribution of soil nutrients and soil multifunctionality within different soil depths, as well as the drivers in the country, using a combination of factor analysis and structural equation modeling (SEM). Findings indicated: (1)The topsoil of Kyrgyzstan (0–30 cm) stores 4.24 ± 0.59 Pg of SOC, 0.33 ± 0.06 Pg of total nitrogen (TN), 0.31 ± 0.03 Pg of total phosphorus (TP), and 5.12 ± 1.84 Pg of total potassium (TK). The nutrient reserves of various land-cover categories vary greatly across the nation, with grasslands accounting for the largest reserves (40%) but urban areas allocating the smallest proportion (0.3%). (2): the analysis revealed that using the linear or nonlinear fitting equations, the majority of soil nutrients exhibited a strong correlation with each other and also environmental parameters; (3): in Kyrgyzstan, soil multifunctionality varied substantially from –0.63 to 2.30 across regions. (4): according to the SEM results, NPP, wind speed (VS), MAP, longitude (Lon), SWC, and pH directly affected soil multifunctionality. In addition, several indirect effects of ST, MAT, Sard, and latitude (Lat) on soil multifunctionality were observed. Lon, map, SWC, and pH also had various direct and indirect impacts on soil multifunctionality. The findings of this study shed light on the functions of the entire soil ecosystem in the Kyrgyz Republic that help better predict the effects of environmental changes on ecosystem multifunctionality in drylands and provide a scientific basis for rational utilization of soil resources, efficient management of dryland soils, and prevention of land productivity decline in the country.
1 Introduction
Soils participate in and regulate the nutrient cycles within ecosystems, with soil nutrients being one of the most important soil characteristics (Sterner and Elser, 2017). Soil nutrient status is a significant indicator of soil fertility since it not only regulates the delivery of the nutrients required for plant development but also promotes the breakdown of soil humus and biogeochemical cycles (Verhoeven et al.,. 2009). soil organic carbon (SOC), nitrogen (N), and phosphorus (P) make up the majority of the soil nutrients and are essential to plant development and different physiological processes (Meersmans et al., 2008). Plaza et al. (2018) reported that global reserves of soil C, N, and P in the soil surface layer (0–30 cm) were more than 50% of those in the whole soil layer (0–100 cm) (Plaza et al., 2018). For instance, soil organic carbon (SOC) is not only an essential component of soil fertility, but also a vital contributor to agricultural productivity and quality, as well as having important supporting/regulatory functions for ecosystem services. Soil nitrogen and phosphorus affect soil characteristics, plant development (Quilchano et al., 2008), and soil microbial activity (Hati et al., 2008). Compared to other soil nutrients, soil nitrogen and phosphorus are regarded as the fundamental nutrients that most frequently limit soil productivity (Giesler et al., 2002). Soil C, N, and P are the three most abundant elements in living organisms, and their ratios have been identified as important indicators of ecosystem structure and function at macroscopic scales, while also being hypothesized to reflect the composition of living organisms within the ecosystem (Rodríguez et al., 2009). Potassium (K) stimulates photosynthesis, and also enhances plant economic water usage, among other roles, and elemental K has garnered substantial scholarly attention in recent soil nutrient research (Guo et al., 2000). plaza et al. (2018) assessed global soil C, N, and P stocks in the global soil (0–30 cm) and discovered that the elemental stocks in the soil surface layer (0–30 cm) comprised more than fifty percent of the overall soil layer (0–100 cm) (Plaza et al., 2018). In order to achieve integrated management of soil functions and maximize the ecological service value of soil, it is crucial to examine the spatial distribution pattern of nutrients in the soil surface layer, estimate the content of nutrients in the surface layer, and investigate the chemometric relationships between elements. Therefore, the emphasis of this research is on the state of nutrients in the surface soil in Kyrgyzstan.
Soil nutrients are susceptible to intricate scale-dependent relationships and geographical variability, as well as complex linkages between environmental variables that affect the multi-scale variability of soil nutrients (Li et al., 2003). Studies have shown that soil nutrients respond to environmental factors such as soil pH, ambient temperature, and average annual precipitation (Miller et al., 2004; Tian et al., 2018). Liu et al. (2013) demonstrated that land use, precipitation, and temperature had significant effects on both STN and STP; Brovelli et al. (2012) analyzed the dynamics of soil carbon and nitrogen in riparian soils and discovered that soil carbon and nitrogen content varied on a temporal scale in response to changes in climatic conditions and the uptake of inputs from surface vegetation; Wang et al. (2016) demonstrated that precipitation and vegetation changes had significant effects on STN and STP. Existing approaches to assess the multifunctionality of ecosystems include the average approach (Maestre et al., 2021), functional replacement across species (Guo et al., 2017), the single thresholding method (Zavaleta et al., 2010), the multi-threshold method (Byrnes et al., 2014), and factor analysis that have both benefits and drawbacks. In this study, we first calculated the soil versatility index using the average approach and component analysis, then we combined soil pH, soil water content (SWC), soil temperature (ST), mean annual temperature (MAT), mean annual rainfall (MAP), net primary plant productivity (NPP), and sunshine radiation (Sard) with soil nutrients. Finally we performed correlation analysis and adopted the structural equation modeling (SEM) approach. The goal of this study was to investigate the determinants of geographical variation in nutrient concentrations in the topsoil of Kyrgyzstan to expand the related soil research in Kyrgyzstan and eventually benefit local agricultural production.
Ecosystem multifunctionality (EMF) is the capacity of an ecosystem to simultaneously maintain numerous ecosystem functions and services, i.e. the ecosystem’s overall function (Zavaleta et al., 2010). Increasingly, researchers are utilizing Soil Multifunctionality (SMF) to describe the multifunctionality of the entire ecosystem (Ding and Eldridge, 2021) Soils play an important role in the terrestrial ecosystem as a whole (Bui and Henderson, 2013); hence, more study on soil multifunctionality will lead to a better understanding of the integrated service capacity of soils. SMF is geographically influenced by various climatic elements (such as precipitation and its seasonality, soil dryness, and soil moisture) and soil characteristics (such as pH and sand content), and increases with plant or soil microbial diversity (Ding and Eldridge, 2021). Quantifying the national SMF of Kyrgyzstan and its drivers can consequently give a reference for the scientific and rational management of the entire national soil environment.
This study addresses the following scientific concerns using field measurements of soil nutrients in Kyrgyzstan from 2011 to 2015, as well as data on their physical and chemical qualities and meteorological environment. 1) What are the nutrient stocks, spatial distribution patterns, and influencing factors of Kyrgyzstan’s surface soils (0–30 cm)? 2) What are the spatial variability characteristics and driving elements of the SMF? On the basis of the aforementioned scientific concerns, we hypothesize that 1) the distribution of soil nutrients and SMF in Kyrgyzstan is very spatially diverse and 2) temperature and precipitation are likely to be the primary causes of regional variability in nutrients and SMF.
The analysis of the spatial relationships between climate, soil, and plant and soil multifunctionality provides a foundation for local ecosystem management to improve local land-cover efficiency and a reference for the efficient and rational management of soil resources and ecosystems across the nation.
2 Materials and methods
2.1 Overview of the study area
The Kyrgyz Republic is situated in the center of the Eurasian continent (39.18°–43.24°N, 69.23°–80.20°E) and has an area of 199,900 square kilometers, bordering China, Uzbekistan, Kazakhstan, and Tajikistan (Figure 1). The region is mountainous, with the highest peak, called Tomur, rising to approximately 7,000 m, and Issyk-Kul valley framed by mountains, with the lowlands comprising only 15% of the total land area. The average annual precipitation varies between 200 and 800 mm, and the climate is characteristic of the continental temperate zone. The country has abundant water resources, pastures, and arable land, with grasslands constituting 38.5% of the national territory. Agricultural land comprises 19.8% of the total land area.
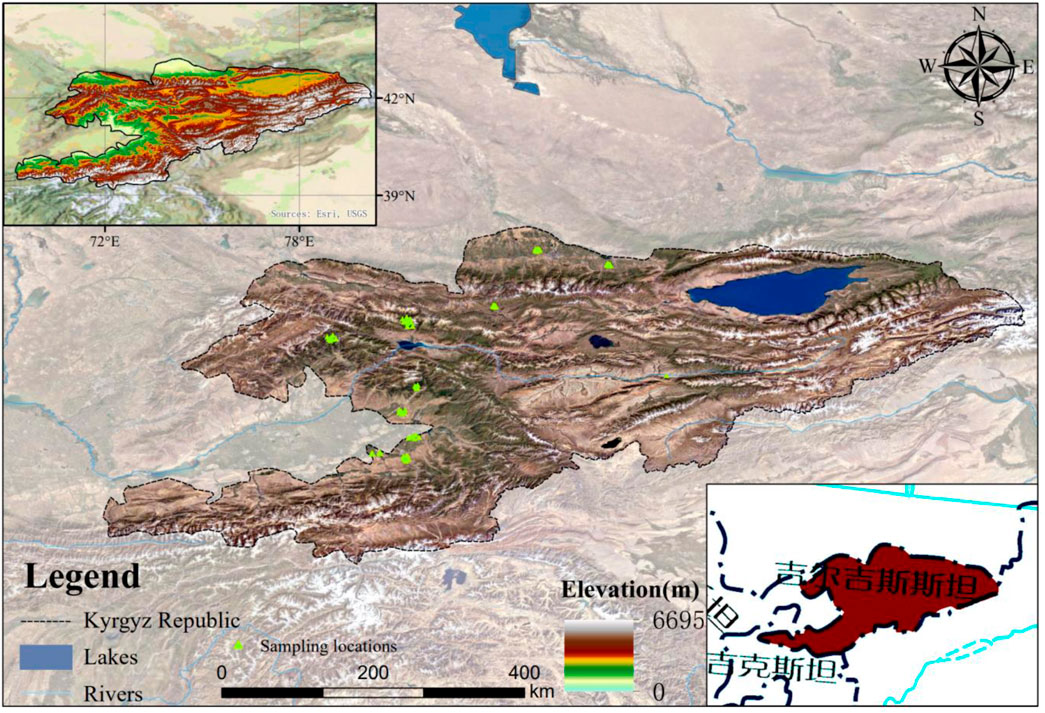
FIGURE 1. Overview of the study area. The map is based on the standard map No. GS (2021)5453 downloaded from the map technology review center of Ministry of natural resources, the standard map is not modified.
2.2 Data sources
2.2.1 Surface soil nutrient data
Field surveys and laboratory tests were used to gather data on the nutrient contents of the soil surface. During the field study conducted in Kyrgyzstan between 2011 and July 2015, 136 sampling locations were selected, and land-cover types were collected. The soil pH, organic matter fast-acting potassium (AK) were analyzed for 159 soil samples, and eight ions were evaluated for 41 samples. Data were compiled using 114 soil samples.
2.2.2 Environmental data
The Terra Climatic is a global dataset (http://doi.org/10.1038/sdata.2017.191) of monthly climate water balance and land surface temperature from the University of Idaho. It consists of meteorological data such as precipitation, maximum and minimum temperatures, and variations in pressure of water vapor, wind speed, and solar radiation. The aforementioned meteorological data were obtained from the cloud computing platform (GEE) for reprojection and cropping procedures.
Land cover data were obtained from ESA’s global land cover database with coverage at 300-m spatial resolution from 1992 to 2020 (https://cds.climate.copernicus.eu/cdsapp#!/dataset/satellite-land-cover), which classifies the global land surface into 22 categories based on the UN FAO Land Cover Classification System (LCCS).
2.2.3 Sampling and determination of quantitative soil functional indicators
Based on the study conducted by Maestre et al. (2012), thirteen soil functional indicators related to four ecosystem processes (C, N, P, and K) were chosen to assess the multifunctionality of soil in the research area (Maestre et al., 2012). These markers were found to have a close relationship with the cycling and content of carbon, nitrogen, and phosphorus in the ecosystem (Dai et al., 2020; Maestre et al., 2021). These soil indicators essentially reflect different processes of ecosystems, including carbon, nitrogen, and phosphorus sequestration, soil and water conservation, and animal hosting (Chytrý et al., 2010). The average approach and the factor analysis developed by Hooper and Vitousek (1998) were used to calculate the soil multifunctionality index in this study (Hooper and Vitousek, 1998). The results of these two techniques (Figure 2) indicated that the two multifunctionality indices (MF1 and MF2) were quite comparable (R2 = 0.866, p < 0.001), and both had significant positive relationships with eight single soil functions (Table 1).
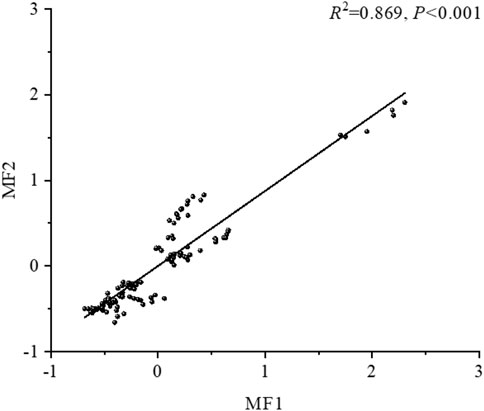
FIGURE 2. Indices of soil multifunctionality derived from the two quantification techniques; MF1: Multifunctionality index calculated using the average approach; MF2: Multifunctionality index calculated using the factor analysis approach.
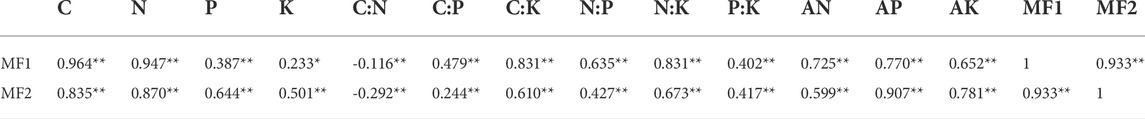
TABLE 1. Correlation between individual soil functions and soil multifunctionality indices.
2.3 Calculation of nutrient density and content of the surface soil
The mean value method was first proposed by Hopper and Vitousek (Hooper and Vitousek, 1998), which converts the measured values of ecosystem functions in a sample, then standardises these functional indicators, and finally the multifunctionality index is the calculation of the mean value of each co-functional value to represent it. quantitative characterisation of multiple ecosystem processes, calculated as follows:
where MFa denotes ecosystem multifunctionality, fi denotes the measured value of function i, ri is the mathematical function that converts fi into a positive value, g denotes the normalisation of all measured values and F denotes the number of functions measured.
Based on the calculation of the mean method, some scholars later began to experiment with factor analysis to obtain similar multifunctionality indices. The thinking behind this calculation is that the parameters of these functional indicators are first downscaled for factor analysis, and then each factor score is obtained, and then each factor score is used to express multifunctionality, and this method can, to a certain extent, measure the trade-offs between the various functions:
where,
In the above equation, MFa denotes the ecosystem multifunctionality index, zi is the factor score, ai is the variance contribution of each factor, zij is the standardised value of variable i at the factor j, and wij denotes the factor score coefficient of variable i at the factor j.
The nutrient element contents of the soil layers were first determined. Using the depth of each layer as a weighting factor, the average values of physicochemical parameters of the soil profile were determined. Tian et al. (2006) calculated the nutrient density (Density) for a single layer in the soil profile as follows (Tian et al., 2006
Where Bi (Bulk density) represents the soil water capacity expressed in g/cm3 in various places; Di (Depth) denotes the soil depth in cm, and Ci (Content) signifies the nutrient content of the horizontal layer of soil (%). Using spatial interpolation and the usual kriging technique, a geographical distribution map of soil nutrients for Tajikistan was drawn. The raster layer was then formed using the surface with a resolution of 300 m × 300 m, a density value of Densityi (kg/m2), and an area value of Areai for each grid square (m2). Nutrient content was calculated using the following formula (Liu et al., 2011):
2.4 Statistical analysis
In this study, the relationships between soil pH, soil water content (SWC), soil temperature (ST), mean annual temperature (MAT), mean annual rainfall (MAP), net primary productivity (NPP), mean annual wind speed (VS), the difference in saturated atmospheric pressure (VPD), solar radiation (Sard), and soil nutrients were determined using correlation analysis, and a structural equation modeling (SEM) method was used to identify the drivers for spatial variability in surface soil nutrients in Kyrgyzstan.
Initially, a descriptive statistical analysis of the soil nutrient contents and other related environmental indicators was performed for all regions of the country; the kriging interpolation was used in ArcGIS 10.2 to investigate the spatial distribution of nutrient contents; the correlation analysis of soil nutrients and environmental factors was performed using the “corrplot” package under R version 4.1.1. Different functional models, including linear, quadratic, power, etc. that best fit the SOC, TK, TP, and TK were selected using the “Lavaan” package in R version 4.1.1. The best-fit model selection was based on the model’s AIC value; the Origin (version 2021) was used to create simple scatter plots, bar charts, 3D pie charts, etc.
3 Results
3.1 Descriptive statistics of soil nutrient contents and environmental factors
Table 2 shows the changes in soil nutrient contents and environmental factors at representative sample locations in Kyrgyzstan. The mean values for SOC, TN, TP, TK, AN, AP, and AK were 14.80 g/kg, 1.25 g/kg, 0.96 g/kg, 17.88 g/kg, 51.71 mg/kg, 12.84 mg/kg, and 216.18 mg/kg, respectively. The total coefficients of variation (CVs) for all nutrients varied from 0.44 to 0.84, demonstrating a rather substantial geographical variation in soil nutrient concentrations across various locations. The values of mean annual precipitation (MAP) and mean annual temperature (MAT) at each sampling point of the region were 414.81 mm and 6.32°C, respectively, and the coefficient of variation (CV) of MAP was 0.260, while that of MAT was 0.78, indicating that the region has small variations in MAP but large variations in MAT across space. The mean values of VS and Sard were 0.11 and 0.03, respectively, and their CVs were low, indicating the minor variations in VS and Sard throughout the area. The mean values of VS and Sard were 0.11 and 0.03, respectively, with both having modest CV values, showing that regional variations in VS and Sard were negligible. The soils in this region have a mean pH value of 7.82 and a minimum pH value of 6.89, indicating that they are mostly neutral and moderately alkaline.
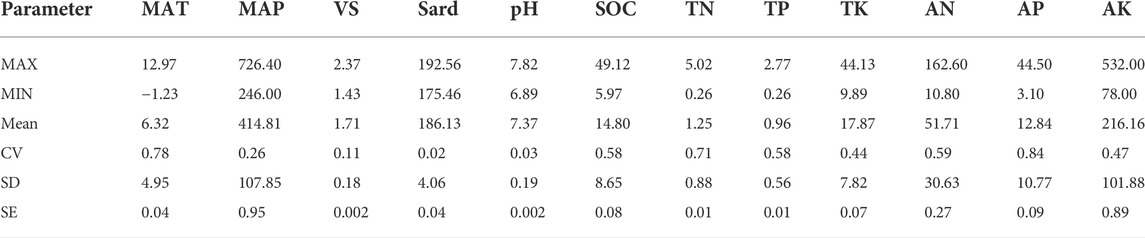
TABLE 2. Descriptive statistics of soil nutrient contents and environmental factors.
3.2 Patterns of the spatial distribution of soil nutrient stocks and concentrations in surface soil (0–30 cm)
The average SOC density of surface soil in Kyrgyzstan was 18.25 ± 1.29 kg/m2, with a content capacity of 4.24 ± 0.59 Pg; the average TN density of surface soil was 1.51 ± 0.24 kg/m2, with a content capacity of 0.33 ± 0.06 Pg; however, the average TP density was 1.29 ± 0.11 kg/m2, with a content capacity of 0.31 ± 0.03 Pg, and the average TK density was 23.98 (Figure 3).
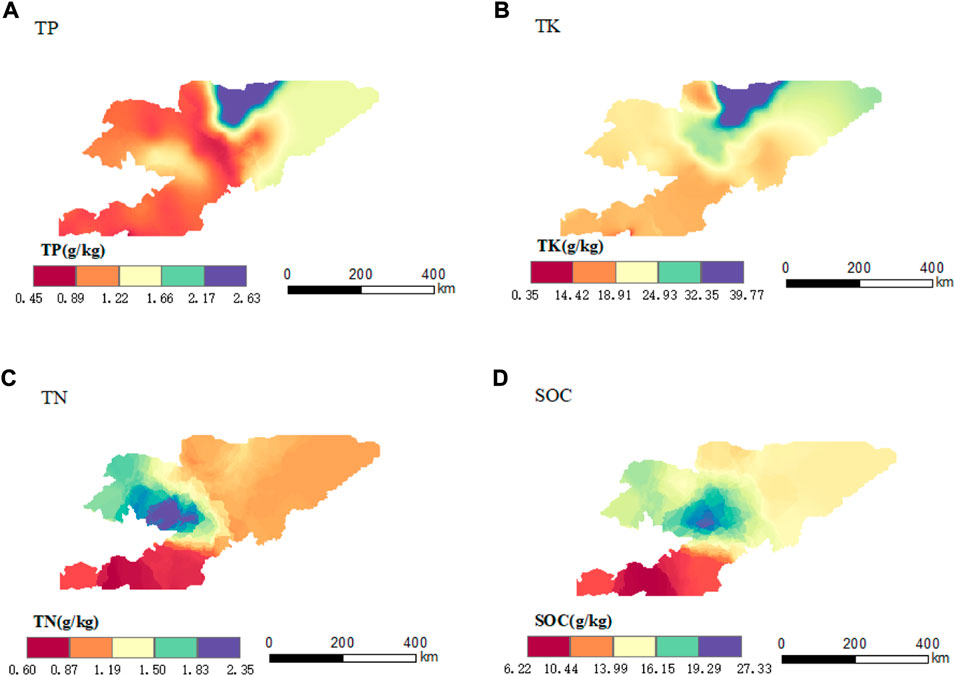
FIGURE 3. Spatial patterns of soil nutrient contents in the surface layer of soil (0–30 cm). (A–D) are the relative spatial distribution features of TP, TK, TN, and SOC.
Based on the optimal spatial interpolation of SOC, TN, TP, and TK for the entire soil surface in Kyrgyzstan using the ordinary kriging method, the spatial distribution of SOC, TN, TP, and TK contents in soil was mapped, with the SOC content within the range of 13.99–16.15 g/kg and an average of 14.80 g/kg. The average concentrations of TP and TK in the study area were 0.96 g/kg and 17.87 g/kg, ranging from 0.89 to 1.66 mg/kg and 18.91–24.93 mg/kg, respectively, in the whole region. The center of the nation had the highest SOC and TN contents, whose geographic distribution had a high degree of similarity; the Northeast region had the highest contents of TP and TK, whose spatial distribution had a high degree of similarity.
3.3 Proportions of soil nutrient stocks in various land-cover types
To better elucidate the spatial distribution features of soil nutrient contents under various land-cover types, the entire Kyrgyzstan country was categorized into six land-cover types, including grassland, forest, urban, agricultural land, bush, and desert, based on ESA’s “Land cover categorization” (see Figure 4, in which permafrost and water areas were not determined). ArcGIS 10.2 was used to calculate the area of each land-cover type, which was paired with data on the nutrient contents of each land-cover type to estimate the nutrient values in these six land-cover categories (Figure 5). As the nutrient densities of soils in various land-cover types considerably varied, so the area of each land-cover type; thus, the soil nutrient stocks in various land-cover types also varied considerably. Among the reserves of various land-cover types, grassland allocated the largest proportion (40%), while urban had the lowest proportion, approximately 0.3%, and the combined nutrients of agriculture, forest, and scrub accounted for approximately 50% of the overall reserves (Figure 4).
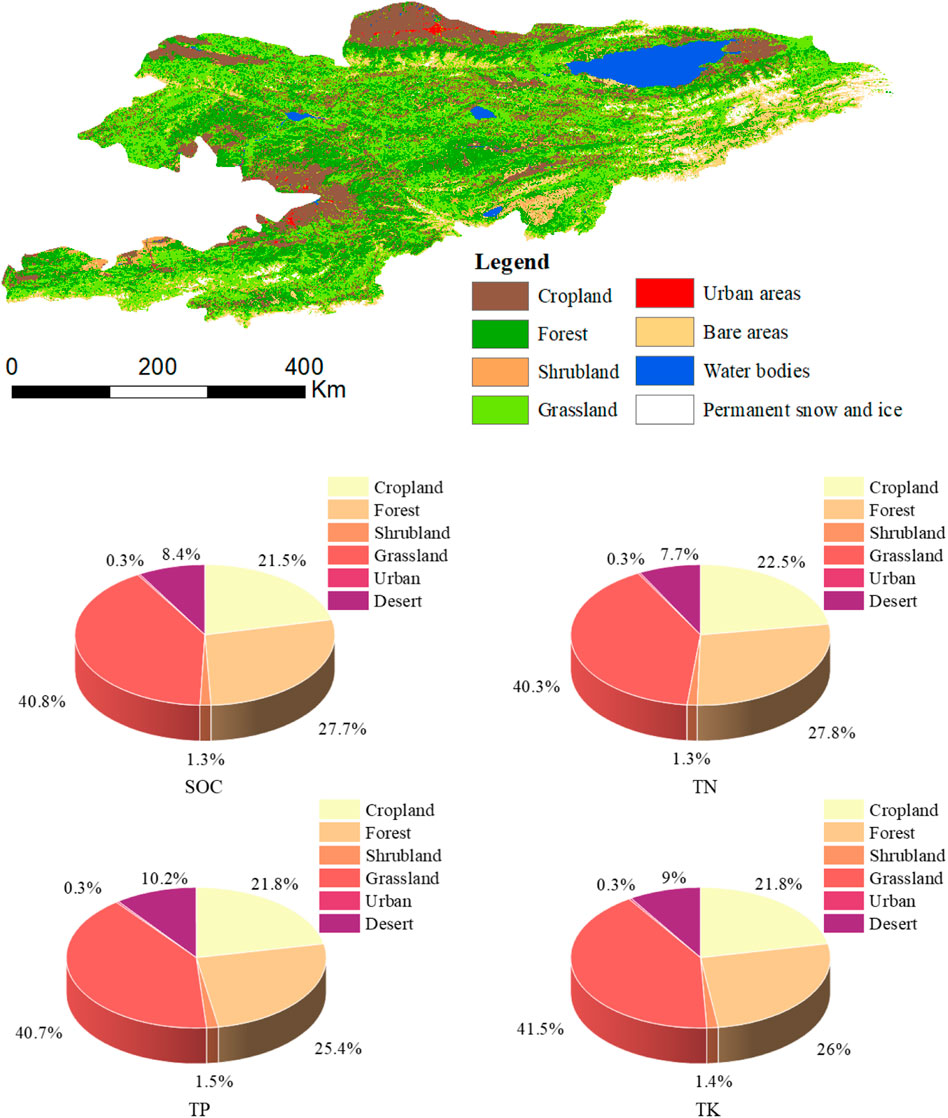
FIGURE 4. Maps of various land-cover types and proportions of nutrient stocks in each land-cover type in Kyrgyzstan.
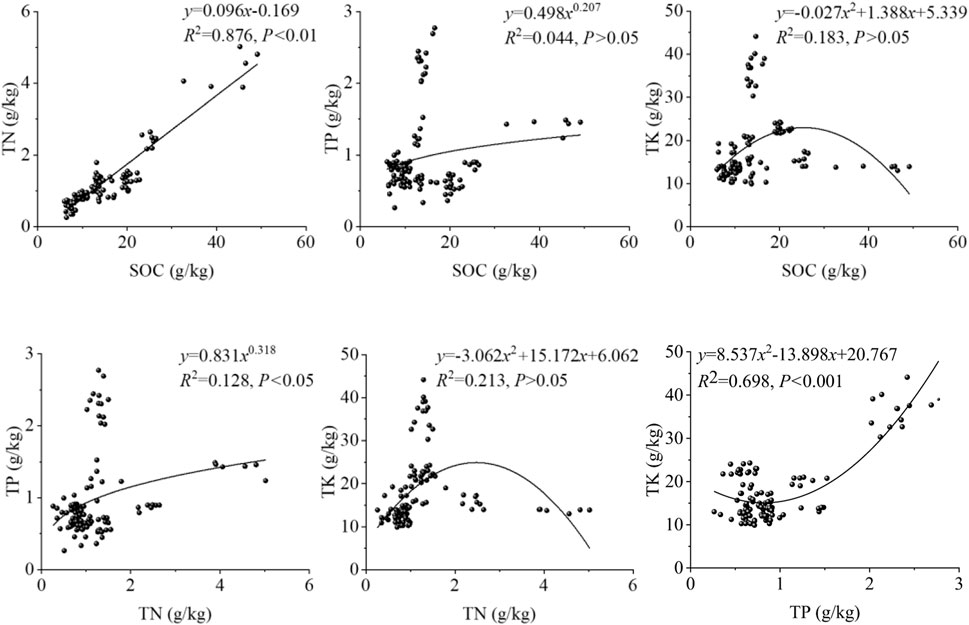
FIGURE 5. Correlations between soil C, N, P, and K contents.
3.4 Interactions between soil nutrient contents and environmental variables
Except between SOC and TP, TK, TN, and TK, AN and TP, and TK and AK, there were significant relationships between the contents of most nutrients (Table 3).

TABLE 3. Correlation coefficients between soil nutrients.
The relationship between soil nutrient contents and environmental variables is shown in Figure 6. Overall, most environmental parameters were substantially associated with the contents of soil nutrients. SWC and NPP were substantially related to all seven nutrients. The linear and nonlinear fitting equations revealed (Figure 5) that soil SOC had a highly significant linear relationship with TN, while soil TN had a substantial relationship with TP, and soil TP had a highly significant quadratic relationship with TK.
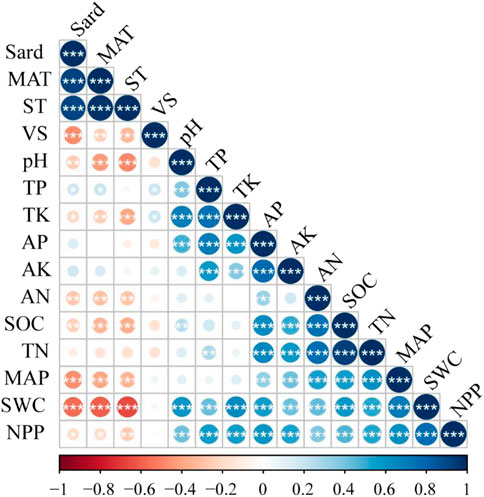
FIGURE 6. Heat map depicting the relationship between soil nutrients and environmental variables.
There was a strong link between soil SOC and all environmental parameters except for VS Only MAP, SWC, VPD, and NPP were substantially related to soil TN levels. With the exception of MAP and ST, all environmental parameters were highly significantly linked to soil TP. There were no significant relationships between soil TK, MAP, and VPD. AN demonstrated very substantial associations with the majority of environmental factors, except for pH. There was a high degree of similarity between AP and AK and environmental parameters, exhibiting the correlations between soil nutrients and all environmental factors except for pH (Table 4).

TABLE 4. Average AIC values of the different fitting results.
Note: Srad represents solar radiation; MAT stands for mean annual temperature; MAP signifies mean annual precipitation; ST denotes soil temperature; VS stands for mean wind speed at 10 m height; pH represents soil pH; TP: total phosphorus in the soil; TK: total potassium in the soil; AP: fast-acting phosphorus in the soil; AK: fast-acting potassium in the soil; AN: fast-acting nitrogen in the soil; SOC: soil organic carbon; TN: total nitrogen; SWC: soil water content; NPP: net primary productivity.
3.5 The spatial variability of soil multifunctionality by influencing soil properties
Throughout Kyrgyzstan, the soil multifunctionality of soils was spatially heterogeneous (Figure 7), with soil multifunctionality indices ranging from -0.63 to 2.30. The soil multifunctionality values ranged from -0.63 to -0.20, comprising approximately 22.46% of the country’s total land area; soil multifunctionality values ranged from -0.20 to 0.16, accounting for approximately 50.40% of the country’s total land area; soil multifunctionality values in were within the range of 0.16–0.43, allocating approximately 20.50% of the country’s total land area. soil multifunctionality values ranged from 0.43 to 0.77, which comprised approximately 4.18% of the country’s land area encompassing the smallest land area, accounting for approximately 2.47% of the nation’s land area, with soil multifunctionality values within the range of ∼0.77–2.30. From west to east, the soil multifunctionality index in the region generally increases and then decreases, with the highest and lowest soil multifunctionality indices in the central region and the southwest and northwest directions, respectively.
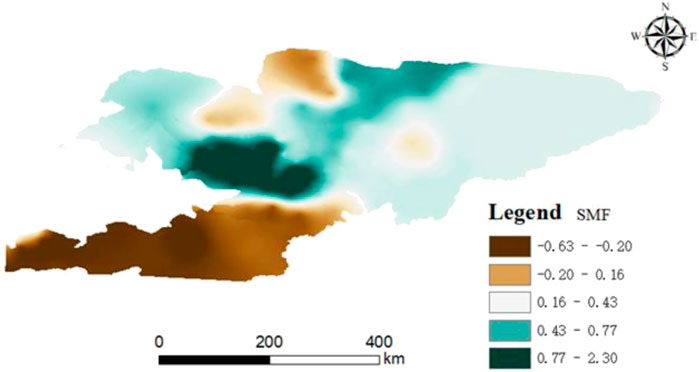
FIGURE 7. Maps of the spatial variability of soil multifunctionality.
3.6 Relationships between environmental variables and soil multifunctionality
SEM analysis results revealed that the model explained 31% of soil multifunctionality (Figure 8). NPP, SWC, MAP, and pH presented direct beneficial effects on soil multifunctionality, with loadings of 0.29***, 0.33**, 0.32**, and 0.17*, respectively, whereas VS and Lon exerted direct negative effects, with loadings of -0.2* and -0.36*, respectively.
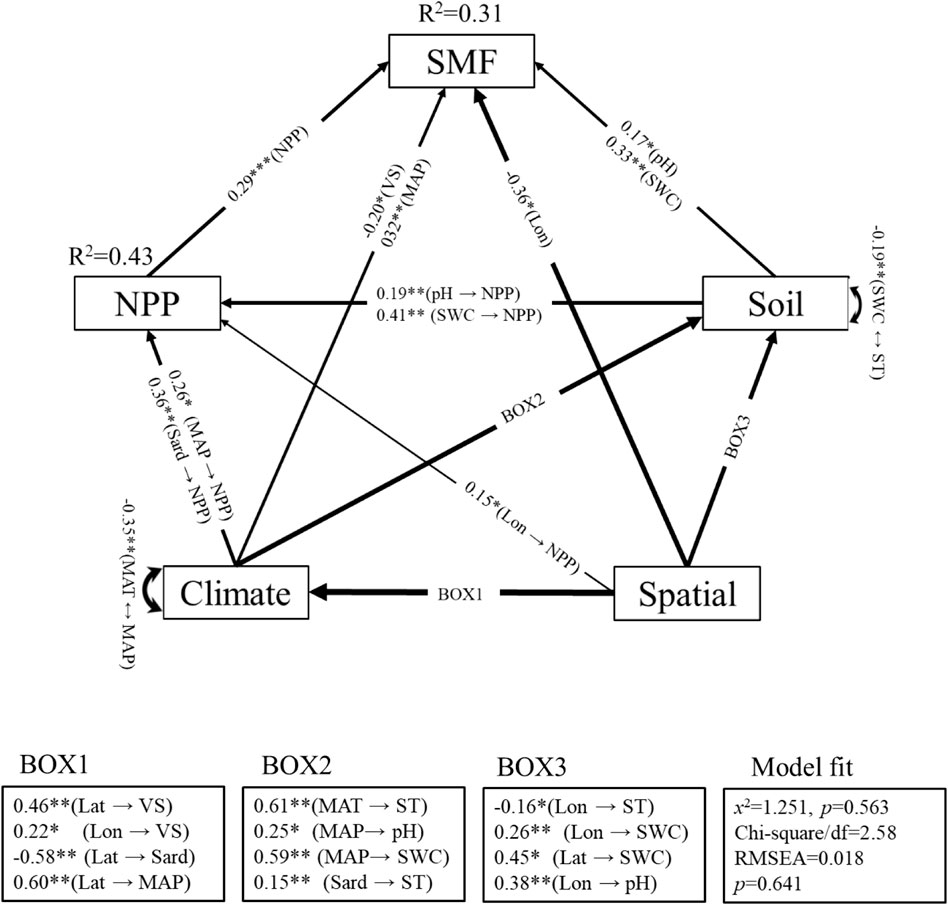
FIGURE 8. Results of the SEM analysis showing the direct and indirect effects of environmental variables on soil multifunctionality. Note: *: p < 0.05; **: p < 0.01; ***: p < 0.001.
In addition, indirect effects of ST, MAT, Sard, and Lat on soil multifunctionality were detected. Lon, MAP, SWC, and pH had various direct and indirect impacts on soil multifunctionality. As shown in Figure 8, in addition to their direct beneficial effects on soil multifunctionality, the soil indicators SWC and pH also had a favorable effect on soil multifunctionality through modulation of NPP, with loadings of up to 0.19** and 0.41**, respectively.
The standardized total effects (based on the sum of direct and indirect effects derived from SEM) indicated that MAT, VS, ST, and Lon had a negative relationship with soil multifunctionality, whereas there were positive relationships between all other variables and soil multifunctionality (Figure 9).
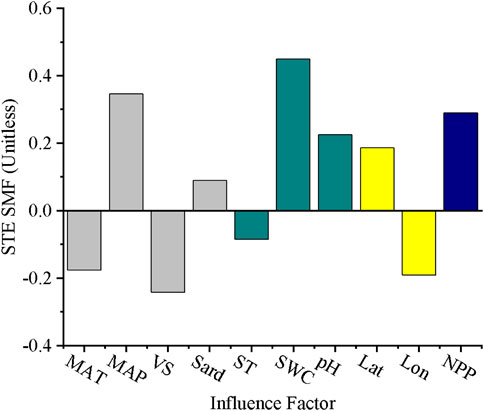
FIGURE 9. The normalized total effects (direct and indirect effects) derived from structural equation modeling (SEM).
4 Discussion
The SOC concentration reflects in part the formation process and fertility level of the soil (Xiong and Li, 1990), and the SOC content of the research area’s soil is comparatively high at 14.80 g/kg. N is the most limiting element for plant development (Liu et al., 2017) and also the essential nutrient for all organisms (Galloway et al., 2004), and soil available nitrogen (AN) directly influences the uptake and absorption of other nutrients by nitrogen-fixing plants (Dai et al., 2020). The study area is rich in nitrogen, with 1.25 g/kg of TN and 95.9 mg/kg of AN. P is an essential nutrient element for plant growth, mostly derived from the mineralization of decomposed organic matter and weathering of soil mineral particles; P deficiency may be prevalent in some temperate locations due to its low biological efficiency (Fisher and Dan, 2000). Soil TP content in the study area was high (0.96 g/kg); AP is an important indicator of the soil phosphorus supply capacity and risk of P loss (Zhang and Wu, 2021), with the content of 12.84 mg/kg, marking the study area as the P-rich area; K is an essential element for plant growth and development and can promote photosynthesis of plants, which leads to greater production of compounds, particularly starch; AK content was 0.1–0.2%.
The primary source of soil nutrients is the weathering of minerals in natural settings, but the intensity of human activities and the extent of their impact under various land-cover types are also significant factors influencing soil nutrients. Different land-cover types modify the soil microhabitat, resulting in creating distinct nutrient concentration trends (Zhao et al., 2018). Soil nutrient levels vary dynamically with land-cover and land management approaches, especially abrupt land-use/land cover changes (Gross and Harrison, 2019). In this study, both the soil nutrient concentrations and the land cover area under various land-cover options varied greatly. Grasslands constitute the largest area, approximately 82,400 km2, while urban areas constitute the smallest area, approximately 0.07 million km2, making grasslands around 120 times larger than urban areas. The great differences in nutrient content maximized the already-existing differences in nutrient contents. This is compatible with hypothesis (1), as nutrient distribution is highly spatially heterogeneous.
Soil pH is one of the main factors influencing soil chemical, physical, and biological processes and properties (Brady et al., 2008), and it also is one of the most important determinants of soil nutrient transformations and nutrient use efficiency (Lin et al., 2020), which can directly or indirectly influence soil nutrient levels. The soil pH in the study area ranged from 6.890 to 7.820, which is neutral and exhibited a highly positive correlation with soil nutrients, especially SOC, TP, TK, and AN (Figure 6). Plants cannot withstand both low and high pH due to weak aluminum toxicity, availability of certain nutrients under low pH conditions, and poor solubility of certain critical elements under high pH conditions (Tyler, 2003). Therefore, a positive linear relationship between soil pH and nutrients is more common in studies with acidic and neutral soils. The significant positive correlation between vegetation NPP and all soil nutrients in this study may be explained by the fact that the slightly increased soil pH (weakly acidic to weakly alkaline) can create a soil environment that is more suitable for plant growth and, thus, favor the content of soil nutrients in Kyrgyzstan, showing an overall highly significant positive correlation between soil pH and soil nutrients. This is similar to the results obtained by Zhang et al. (Zhang et al., 2021), who reported that a slight increase in soil pH increased the content of organic carbon and nitrogen in semi-arid steppe soils.
C, N, and P cycles are significantly altered by global changes such as rising temperatures and varying precipitation patterns (Yue et al., 2016). On a regional scale, it has been demonstrated that soil nutrient (C and N e.g.) contents were favorably correlated with precipitation but negatively correlated with temperature (Post et al., 1982; Miller et al., 2004). Precipitation increased SOC and TN stocks by affecting soil moisture and enhancing subsurface biomass (Fang et al., 2018). James et al. (2015) and Rumpel, 2011, and Koel-Knaben (2011) reported that increased precipitation enhanced the transport of dissolved C and N to deeper soil layers (Rumpel, 2011; James et al., 2015). The association between MAP and MAT soil nutrients differed significantly, with the former exhibiting a highly significant positive correlation with soil nutrients but the latter showing a predominantly negative correlation. Kyrgyzstan is considered a dry zone based on the worldwide categorization (Maestre et al., 2021), where soil water content is commonly regarded as a limiting factor for many terrestrial ecosystem processes and a key driver of plant growth and soil microbial activity (Moyano et al., 2013). MAP and SWC exhibited a highly strong positive correlation, indicating that MAP can influence soil microorganisms and plants through SWC. Increases in precipitation resulted in increased plant productivity and nitrogen inputs in the soil. This effect may be more pronounced in arid and semi-arid regions where plant growth is primarily limited by water supply (Longfei et al.,. 2015); an increase in MAP leads to an increase in soil nitrogen content due to the input of exotic nitrogen, indicating a positive correlation between these two, which is consistent with the findings of this study. The aforementioned data are compatible with hypothesis (2), which states that temperature and precipitation are the primary determinants of the spatial distribution of nutrients.
C and N availability in soil is controlled by not only plant organic matter inputs, apoplankton and roots but also microbial activity (Gavrichkova et al., 2019). Soil bacteria control the formation of soil organic matter (SOM) and the release of extracellular enzymes by C and N turnover (Sterner and Elser, 2017). The elevated temperature immediately accelerated microbial processes and turnover rates, affecting the availability of water and nutrients and, thereby extending the plant growing season (Fang et al., 2017). Hobbie et al. (2002) discovered that climate warming enhanced the decomposition of large amounts of organic carbon present in high-latitude soils (positive feedback in climate warming), which resulted in a release of significant quantities of carbon into the atmosphere as carbon dioxide (Hobbie et al., 2002), thereby decreasing the organic carbon level in the soil. Soil extracellular enzymes catalyze the rate-limiting step of soil organic carbon decomposition, and the rates of their catalysis, production, and degradation are temperature-dependent (Jing et al., 2014). Therefore, an increase in temperature may stimulate soil extracellular enzyme activities, thereby accelerating soil organic carbon decomposition and reducing soil SOC stocks. MAT demonstrated a highly significant negative correlation with SOC. MAT also exhibited a negative correlation with TN but for a highly significant negative correlation with AN. This could be due to the increase in ST with an increase in MAT over a wide range of temperatures, indicating a highly significant positive correlation between these two, leading to promoting the growth of ammonia-oxidizing archaea (AOA) communities and increasing ammonia oxidation rates, the rate-limiting step in nitrification and also an important indicator of soil N cycling (Fierer et al., 2009). MAT had a negative correlation with TN and a strong negative correlation with AN because a portion of the digestive reaction was released into the air in the form of gas (likely with a low flux). Temperature increases contribute to a transition from mostly anabolic to predominantly catabolic pathways in the microbially-driven nitrogen cycle. Increased soil temperature increased the rates of nitrification and denitrification, resulting in an increase in N2O emissions by 227% and a fall in soil TN concentration (Dai et al., 2020). MAP exhibited positive correlations with TP and TK but highly significant positive correlations with AP and AK, whereas MAT had strong negative impacts on TP and TK, but no correlations were detected between AP and AK. This may be a result of draining nutrients in the dry zone region by higher MAP (Liu et al., 2017). MAP was positively correlated with TP and TK; therefore, the increase in MAP may increase the soil SWC, which in turn creates a more suitable environment for the survival of soil microbes and thereby increases their activities and consequently degrades TP and TK, leading to increasing AP and AK. TP and TK increased with leaching on one side, whereas some components were degraded and absorbed by soil microorganisms; therefore, the hypothesis about the lack of significant association between TP and TK and MAP must be confirmed in future trials. Within a limited temperature range, the increase in MAT accelerated the absorption of elemental phosphorus and potassium by bacteria by increasing their activities. In addition, a minor increase in soil temperature accelerated the decomposition of organic compounds like TP and TK by soil enzymes, leading to a reduction in TP and TK contents. VS only demonstrated a significant correlation with TP and TK, presumably because the long-term increase in VS caused the weathering of rocks, making P and K more sensitive to weathering and release. Sard and MAT had a significant positive correlation, and both correlated the same with soil nutrients; therefore, Sard may have influenced soil nutrients through modifying MAT levels and, consequently, MAT levels.
Consistent with hypothesis, the regional distribution of SMF in this investigation is similarly highly varied (1). In this study, vegetation NPP was the most important factor, exerting a significant direct positive effect on soil multifunctionality. It has been demonstrated that plant species diversity was positively correlated with soil multifunctionality in extremely arid regions, while the correlation was stronger in less arid environments. There was a strong correlation between vegetation NPP and plant species richness (Abatzoglou et al., 2018); therefore, the significant positive influence of NPP on soil multifunctionality observed in our study is consistent with the findings of previous research studies. It has been demonstrated that the pH of the soil environment is the most important factor in determining soil functions (Ding and Eldridge., 2021). Zhang et al. (2021) discovered that a minor increase in soil pH was beneficial to organic carbon and nitrogen content in semi-arid grassland soils, thereby having a substantial favorable impact on changes in soil multifunctionality (Zhang et al., 2021). Both ST and MAT had adverse indirect impacts on soil multifunctionality. Within a particular temperature range, it is possible that a rise in soil temperature would enhance the decomposition and mineralization of organic materials, thus improving soil multifunctionality. Possibly due to the close relationship between seasonal precipitation and soil moisture, soil multifunctionality is limited more by the increase in precipitation than in temperature (Eldridge et al., 2019). Higher SWC concentrations may drive the growth of a plant root and soil microbial activity, further influencing plant metabolism and nutrient loss. In addition, increasing soil moisture can affect CO2 emissions by promoting plant growth and the ensuing allocation of subsurface carbon and carbon substrates (Liu et al., 2017). The majority of studies have demonstrated that soil microbial diversity had a significant effect on soil multifunctionality, and different soil environmental conditions also influenced the relationship between soil microbes and soil multifunctionality, e.g., the relationship between soil microbial diversity and soil multifunctionality was stronger when soil moisture levels were low (Durán et al., 2018). This study has limitations due to a lack of data on soil microorganisms and the relationship between soil microbes and soil multifunctionality. Changes in spatial patterns had both direct and indirect effects on soil multifunctionality, and spatial variability of soil properties is generally controlled by the interaction between biological, chemical, and physical processes occurring simultaneously and at multiple scales (Zuo et al., 2010). Changes in spatial patterns have concurrently contributed to alterations in the weather, soil, and vegetation NPP. Variations in temperature, soil properties, and plants have been proven to exert distinct effects on the regional variability of soil multifunctionality, implying that no individual environmental factor may optimize all soil functions (Ding and Eldridge, n. d.). Spatial variation in soil multifunctionality is not caused by a single environmental variable but rather by a combination of environmental conditions.
5 Conclusion
In this study, field sampling data from Kyrgyzstan were analyzed to characterize the spatial variability of the distribution of soil nutrients and soil multifunctionality at different soil depths in the country using the average approach, factor analysis, and structural equation modeling (SEM) to determine the driving mechanisms. The findings of the study were as follows:
(1) The surface soils (0–30 cm) of entire Kyrgyzstan contain 4.24 ± 0.59 Pg of soil organic carbon (SOC), 0.33 ± 0.06 Pg of total nitrogen (TN), 0.31 ± 0.03 Pg of total phosphorus (TP), and 5.12 ± 1.88 Pg of total potassium (TK). Soil nutrient reserves of various land-cover types vary substantially, with grassland contributing up to 40% to the total soil nutrient reserves and urban areas accounting for approximately 0.3%. Approximately 50% of the total soil nutrient reserves are derived from arable land, woodland, and shrubland.
(2) Fitting linear or nonlinear equations revealed a highly significant linear relationship between soil organic carbon (SOC) and total nitrogen (TN), a significant power function relationship between soil total nitrogen (TN) and total phosphorus (TP), and a highly significant quadratic relationship between soil total phosphorus (TP) and total potassium (TK). Overall, a highly strong positive correlation was observed between NPP and all soil nutrients. Mean annual precipitation (MAP) and soil water content (SWC) demonstrated highly significant positive correlations with soil nutrients, whereas mean annual temperature (MAT) and soil temperature (ST) showed highly significant negative correlations with soil nutrients, and there were differing correlations between other environmental variables and various nutrients.
(3) Soil multifunctionality is spatially heterogeneous throughout Kyrgyzstan, with soil multifunctionality indices ranging from -0.63 to 2.30. From west to east, soil multifunctionality indices showed a generally increasing trend, followed by a decreasing trend in the region, with the highest indices in the central region mostly comprising agricultural and pastoral lands but lower indices in the South-western and Eastern Alpine regions.
(4) SEM analysis showed significant positive direct effects of NPP, SWC, MAP, and pH on soil multifunctionality, while VS and Lon had negative effects on soil multifunctionality. In addition, we found multiple indirect effects of ST, MAT, Sard, and Lat on soil multifunctionality. However, Lon, MAP, SWC, and pH had direct and multiple indirect effects on soil multifunctionality.
This paper investigates soil ecosystem processes and the distribution of soil resources in Kyrgyzstan. The results of this study provide further clarification of the spatial heterogeneity and driving factors of the entire soil ecosystem functioning in Kyrgyzstan, which helps better predict the impact of environmental changes on the ecosystem multifunctionality in drylands and provides a scientific basis for the rational use of soil resources and efficient management of dryland soils to prevent further land degradation in the country.
Data availability statement
The datasets presented in this study can be found in online repositories. The names of the repository/repositories and accession number(s) can be found in the article/Supplementary Material.
Author contributions
YC and SZ made equally and mainly contribution to this work. YC and SZ are Co-first authors of this article, Other authors have contributed to this article to a certain degree, HL: formal analysis. All authors commented on previous versions of the manuscript. All authors read and approved the final manuscript.
Funding
“This work was supported by [Strategic priority research project of Chinese Academy of Sciences] (Grant numbers [XDA20030102]) [The Key Technical Talent Project of Chinese Academy of Sciences (Research on desertification technology along the “Belt and Road”)] Author Yusen Chen has received research support from Xinjiang Institute of Ecology and Geography Chinese Academy of Sciences.”
Acknowledgments
I would like to thank the Institute of ecology and geography of the Chinese Academy of Sciences for its help and support in my work.
Conflict of interest
The authors declare that the research was conducted in the absence of any commercial or financial relationships that could be construed as a potential conflict of interest.
Publisher’s note
All claims expressed in this article are solely those of the authors and do not necessarily represent those of their affiliated organizations, or those of the publisher, the editors and the reviewers. Any product that may be evaluated in this article, or claim that may be made by its manufacturer, is not guaranteed or endorsed by the publisher.
References
Abatzoglou, J. T., Dobrowski, S. Z., Parks, S. A., and Hegewisch, K. C. (2018). TerraClimate, a high-resolution global dataset of monthly climate and climatic water balance from 1958–2015. Sci. data 5, 170191–170212. doi:10.1038/sdata.2017.191
Brady, N. C., Weil, R. R., and Weil, R. R. (2008). The nature and properties of soils. Upper Saddle River, NJ: Prentice-Hall.
Bui, E. N., and Henderson, B. L. (2013). C:N:P stoichiometry in Australian soils with respect to vegetation and environmental factors. Plant Soil 373, 553–568. doi:10.1007/s11104-013-1823-9
Byrnes, J. E. K., Gamfeldt, L., Isbell, F., Lefcheck, J. S., Griffin, J. N., Hector, A., et al. (2014). Investigating the relationship between biodiversity and ecosystem multifunctionality: Challenges and solutions. Methods Ecol. Evol. 5, 111–124. doi:10.1111/2041-210x.12143
Chytrý, M., Danihelka, J., Ermakov, N., Hájek, M., Valachovič, M., Koci, M., et al. (2010). Plant species richness in continental southern siberia: Effects of pH and climate in the context of the species pool hypothesis. Glob. Ecol. Biogeogr. 16, 668–678. doi:10.1111/j.1466-8238.2007.00320.x
Dai, Z., Yu, M., Chen, H., Zhao, H., Huang, Y., Su, W., et al. (2020). Elevated temperature shifts soil N cycling from microbial immobilization to enhanced mineralization, nitrification and denitrification across global terrestrial ecosystems. Glob. Chang. Biol. 26, 5267–5276. doi:10.1111/gcb.15211
Ding, J., and Eldridge, D. J. (2021). Climate and plants regulate the spatial variation in soil multifunctionality across a climatic gradient. CATENA 201, 105233. doi:10.1016/j.catena.2021.105233
Durán, J., Delgado-Baquerizo, M., Dougill, A. J., Guuroh, R. T., Linstdter, A., Thomas, A. D., et al. (2018). Temperature and aridity regulate spatial variability of soil multifunctionality in drylands across the globe. Ecology 99, 1184–1193. doi:10.1002/ecy.2199
Eldridge, D. J., Delgado-Baquerizo, M., Quero, J. L., Ochoa, V., Maestre, F. T., Garcia-Palacios, P., et al. (2019). Surface indicators are correlated with soil multifunctionality in global drylands. J. Appl. Ecol. 57, 424–435. doi:10.1111/1365-2664.13540
Fang, C., Ye, J., Gong, Y., Pei, J., Yuan, Z., Xie, C., et al. (2017). Seasonal responses of soil respiration to warming and nitrogen addition in a semi-arid alfalfa-pasture of the Loess Plateau, China. Sci. Total Environ. 590, 729–738. doi:10.1016/j.scitotenv.2017.03.034
Fang, J., Yu, G., Liu, L., Hu, S., and Chapin, F. S. (2018). Climate change, human impacts, and carbon sequestration in China. Proc. Natl. Acad. Sci. U. S. A. 115, 4015–4020. doi:10.1073/pnas.1700304115
Fierer, N., Strickland, M. S., Liptzin, D., Bradford, M. A., and Cleveland, C. C. (2009). Global patterns in belowground communities. Ecol. Lett. 12, 1238–1249. doi:10.1111/j.1461-0248.2009.01360.x
Galloway, J. N., Dentener, F. J., Capone, D. G., Boyer, E. W., Vosmarty, C. J., Seitzinger, S. P., et al. (2004). Nitrogen cycles: Past, present, and future. Biogeochemistry 70, 153–226. doi:10.1007/s10533-004-0370-0
Gavrichkova, O., Scartazza, A., Guidolotti, G., Kuzyakov, Y., Calfapietra, C., Mattioni, M., et al. (2019). When the Mediterranean becomes harsh: Heat pulses strongly affect C allocation in plant-soil-atmosphere continuum in Eucalyptus camaldulensis. Environ. Exp. Bot. 162, 181–191. doi:10.1016/j.envexpbot.2019.02.019
Giesler, R., Petersson, T., and Högberg, P. (2002). Phosphorus limitation in boreal forests: Effects of aluminum and iron accumulation in the humus layer. Ecosystems 5, 300–314. doi:10.1007/s10021-001-0073-5
Gross, C. D., and Harrison, R. B. (2019). The case for digging deeper: Soil organic carbon storage, dynamics, and controls in our changing world. Soil Syst. 3, 28. doi:10.3390/soilsystems3020028
Guo, L., Cheng, J., Luedeling, E., Koerner, S. E., He, J.-S., Xu, J., et al. (2017). Critical climate periods for grassland productivity on China’s Loess Plateau. Agric. For. Meteorol. 233, 101–109. doi:10.1016/j.agrformet.2016.11.006
Guo, X., Fu, B., and Chen, L. (2000). The spatio-temporal variability of soil nutrients in zunhua Plain of Hebei Province. ACTA Geogr. Sin. Ed. 55, 555–566.
Hati, K. M., Swarup, A., Mishra, B., Manna, M. C., Wanjari, R. H., Mandal, K. G., et al. (2008). Impact of long-term application of fertilizer, manure and lime under intensive cropping on physical properties and organic carbon content of an Alfisol. Geoderma 148, 173–179. doi:10.1016/j.geoderma.2008.09.015
Hobbie, S. E., Nadelhoffer, K. J., and Högberg, P. (2002). A synthesis: The role of nutrients as constraints on carbon balances in boreal and arctic regions. Plant Soil 242, 163–170. doi:10.1023/a:1019670731128
Hooper, D. U., and Vitousek, P. M. (1998). Effects of plant composition and diversity on nutrient cycling. Ecol. Monogr. 68, 121–149. doi:10.1890/0012-9615(1998)068[0121:eopcad]2.0.co;2
James, J., Knight, E., Gamba, V., and Harrison, R. (2015). Deep soil: Quantification, modeling, and significance of subsurface nitrogen. For. Ecol. Manage. 336, 194–202. doi:10.1016/j.foreco.2014.10.010
Jing, X., Wang, Y., Chung, H., Mi, Z., Wang, S., Zeng, H., et al. (2014). No temperature acclimation of soil extracellular enzymes to experimental warming in an alpine grassland ecosystem on the Tibetan Plateau. Biogeochemistry 117, 39–54. doi:10.1007/s10533-013-9844-2
Li, Z. A., Zou, B., Cao, Y. S., Ren, H., and Liu, J. (2003). Analysis on soil nutrient characteristics of typical hilly degraded wasteland in South China. Acta Ecol. Sin. 23, 1648–1656.
Lin, X. B., Sun, Y. M., Jiang, X. F., Huang, S. S., He, S. L., Yu, P. L., et al. (2020). [Soil fertility characteristics and their influencing factors in tea plantations of Jiangxi Pro-vince, China]. Chin. J. Appl. Ecol. 31, 1163–1174. doi:10.13287/j.1001-9332.202004.022
Liu, Y., Wang, C., He, N., Wen, X., Gao, Y., Li, S., et al. (2017). A global synthesis of the rate and temperature sensitivity of soil nitrogen mineralization: Latitudinal patterns and mechanisms. Glob. Chang. Biol. 23, 455–464. doi:10.1111/gcb.13372
Liu, Z., Shao, M., and Wang, Y. (2011). Effect of environmental factors on regional soil organic carbon stocks across the Loess Plateau region, China. Agric. Ecosyst. Environ. 142, 184–194. doi:10.1016/j.agee.2011.05.002
Longfei, C., Zhibin, H., Jun, D., Junjun, Y., and Xi, Z. (2015). Patterns and controls of soil organic carbon and nitrogen in alpine forests of northwestern China. For. Sci. 66, 1033–1040. doi:10.5849/forsci.14-231
Maestre, F. T., Benito, B. M., Berdugo, M., Concostrina‐Zubiri, L., Delgado‐Baquerizo, M., Eldridge, D. J., et al. (2021). Biogeography of global drylands. New Phytol. 231, 540–558. doi:10.1111/nph.17395
Maestre, F. T., Quero, J. L., Gotelli, N. J., Escudero, A., Ochoa, V., Delgado-Baquerizo, M., et al. (2012). Plant species richness and ecosystem multifunctionality in global drylands. Science 335, 214–218. doi:10.1126/science.1215442
Meersmans, J., De Ridder, F., Canters, F., De Baets, S., and Van Molle, M. (2008). A multiple regression approach to assess the spatial distribution of Soil Organic Carbon (SOC) at the regional scale (Flanders, Belgium). Geoderma 143, 1–13. doi:10.1016/j.geoderma.2007.08.025
Miller, A. J., Amundson, R., Burke, I. C., and Yonker, C. (2004). The effect of climate and cultivation on soil organic C and N. Biogeochemistry 67, 57–72. doi:10.1023/B:BIOG.0000015302.16640.A5
Moyano, F. E., Manzoni, S., and Chenu, C. (2013). Responses of soil heterotrophic respiration to moisture availability: An exploration of processes and models. Soil Biol. Biochem. 59, 72–85. doi:10.1016/j.soilbio.2013.01.002
Plaza, C., Zaccone, C., Sawicka, K., Méndez, A. M., Tarquis, A., Gascó, G., et al. (2018). Soil resources and element stocks in drylands to face global issues. Sci. Rep. 8, 13788–8. doi:10.1038/s41598-018-32229-0
Post, W. M., Emanuel, W. R., Zinke, P. J., and Stangenberger, A. G. (1982). Soil carbon pools and world life zones. Nature 298, 156–159. doi:10.1038/298156a0
Quilchano, C., Marañón, T., Pérez-Ramos, I. M., Noejovich, L., Valladares, F., and Zavala, M. A. (2008). Patterns and ecological consequences of abiotic heterogeneity in managed cork oak forests of Southern Spain. Ecol. Res. 23, 127–139. doi:10.1007/s11284-007-0343-6
Rodríguez, A., Durán, J., Fernández-Palacios, J. M., and Gallardo, A. (2009). Spatial pattern and scale of soil N and P fractions under the influence of a leguminous shrub in a Pinus canariensis forest. Geoderma 151, 303–310. doi:10.1016/j.geoderma.2009.04.019
Rumpel, C., and Kogel-Knabner, I. (2011). K?gel-Knabner, IDeep soil organic matter—A key but poorly understood component of terrestrial C cycle. Plant Soil 338, 143–158. doi:10.1007/s11104-010-0391-5
Sterner, R. W., and Elser, J. J. (2017). “Ecological stoichiometry,” in Ecological stoichiometry (Princeton, New Jersey, United States: Princeton university press).
Tian, D., Reich, P. B., Chen, H., Xiang, Y., Luo, Y., Ying, S., et al. (2018). Global changes alter plant multi-element stoichiometric coupling. New Phytol. 221, 807–817. doi:10.1111/nph.15428
Tian, H., Wang, S., Liu, J., Pan, S., Chen, H., Zhang, C., et al. (2006). Patterns of soil nitrogen storage in China. Glob. Biogeochem. Cycles 20, 1001. doi:10.1029/2005GB002464
Tyler, G. (2003). [Forum: Calcium and plant species richness] | some ecophysiological and historical approaches to species richness and calcicole/calcifuge behaviour: Contribution to a debate. Folia Geobot. 38, 419–428. doi:10.1007/bf02803249
Verhoeven, J., Verhoeven, Jos T A, Lawniczak, A., E., and Guesewell, S. (2009). Effect of N:K supply ratios on the performance of three grass species from herbaceous wetlands. Basic Appl. Ecol. 10, 715–725. doi:10.1016/j.baae.2009.05.004
Yue, K., Fornara, D. A., Yang, W., Peng, Y., Li, Z., Wu, F., et al. (2016). Effects of three global change drivers on terrestrial C:N:P stoichiometry: A global synthesis. Glob. Chang. Biol. 23, 2450–2463. doi:10.1111/gcb.13569
Zavaleta, E. S., Pasari, J. R., Hulvey, K. B., and Tilman, G. D. (2010). Sustaining multiple ecosystem functions in grassland communities requires higher biodiversity. Proc. Natl. Acad. Sci. U. S. A. 107, 1443–1446. doi:10.1073/pnas.0906829107
Zhang, J., Wu, X., Shi, Y., Jin, C., Wang, J., Wei, X., et al. (2021). A slight increase in soil pH benefits soil organic carbon and nitrogen storage in a semi-arid grassland. Ecol. Indic. 130, 108037. doi:10.1016/j.ecolind.2021.108037
Zhang, X. T., and Wu, X. Q. (2021). Spatiotemporal variation of NPP in Yunnan faulted basin from 2005 to 2019 based on CASA model. Acta Geosci. Sin. 42, 426–434.
Zhao, Z., Liu, G., Liu, Q., Chong, H., He, L., and Wu, C. (2018). Distribution characteristics and seasonal variation of soil nutrients in the mun river basin, Thailand. Int. J. Environ. Res. Public Health 15, 1818. doi:10.3390/ijerph15091818
Zuo, X. A., Zhao, X. Y., Zhao, H. L., Guo, Y. R., Zhang, T. H., and Cui, J. Y. (2010). Spatial pattern and heterogeneity of soil organic carbon and nitrogen in sand dunes related to vegetation change and geomorphic position in Horqin Sandy Land, Northern China. Environ. Monit. Assess. 164, 29–42. doi:10.1007/s10661-009-0872-2
Keywords: soil Nutrients, SMF, Drivers, spatial distribution, structural equation modeling
Citation: Chen Y, Zhang S, Li H and Wang Y (2022) Drivers of nutrient content and spatial variability of soil multifunctionality in the topsoil of Kyrgyzstan. Front. Environ. Sci. 10:1001984. doi: 10.3389/fenvs.2022.1001984
Received: 24 July 2022; Accepted: 29 August 2022;
Published: 23 September 2022.
Edited by:
Z. Y. Yuan, Institute of Soil and Water Conservation (CAS), ChinaReviewed by:
Kai Yue, Fujian Normal University, ChinaYaofeng Wang, Xinjiang Agricultural University, China
Lei Feng, Xinjiang Agricultural University, China
Copyright © 2022 Chen, Zhang, Li and Wang. This is an open-access article distributed under the terms of the Creative Commons Attribution License (CC BY). The use, distribution or reproduction in other forums is permitted, provided the original author(s) and the copyright owner(s) are credited and that the original publication in this journal is cited, in accordance with accepted academic practice. No use, distribution or reproduction is permitted which does not comply with these terms.
*Correspondence: Yongdong Wang, d2FuZ3lkQG1zLnhqYi5hYy5jbg==
†These authors have contributed equally to this work and share first authorship