
94% of researchers rate our articles as excellent or good
Learn more about the work of our research integrity team to safeguard the quality of each article we publish.
Find out more
ORIGINAL RESEARCH article
Front. Environ. Sci., 24 October 2022
Sec. Environmental Informatics and Remote Sensing
Volume 10 - 2022 | https://doi.org/10.3389/fenvs.2022.1001190
 Whitney M. Holeva-Eklund1,2*
 Steven J. Young3James Will3
 Nicole Busser3John Townsend3
 Crystal M. Hepp2,4,5
Background: Aedes aegypti mosquitoes transmit dengue, yellow fever, Zika, and chikungunya viruses. Their range has recently been expanding throughout the world, including into desert regions such as Arizona in the southwestern United States. Little is understood about how these mosquitoes are surviving and behaving in arid environments, habitat that was previously considered inhospitable for the vector. The goal of this study is to create quarterly species distribution models based on satellite imagery and socioeconomic indicators for Ae. aegypti in Maricopa County, Arizona from 2014 to 2020.
Methods: Trapping records for Ae. aegypti in Maricopa County, Arizona from 2014 to 2020 were split into 25 quarterly time periods. Quarterly species distribution models (Maxent) were created using satellite imagery-derived vegetation and moisture indices, elevation, and socioeconomic factors (population density, median income) as predictors. Maps of predicted habitat suitability were converted to binary presence/absence maps, and consensus maps were created that represent “core” habitat for the mosquito over 6 years of time. Results were summarized over census-defined zip code tabulation areas with the goal of producing more actionable maps for vector control.
Results: Population density was generally the most important predictor in the models while median income and elevation were the least important. All of the 25 quarterly models had high test area under the curve values (>0.90) indicating good model performance. Multiple suburban areas surrounding the Phoenix metropolitan core area were identified as consistent highly suitable habitat.
Conclusion: We identified long term “core” habitat for adult female Ae. aegypti over the course of 6 years, as well as “hotspot” locations with greater than average suitability. Binary maps of habitat suitability may be useful for vector control and public health purposes. Future studies should examine the movement of the mosquito in this region over time which would provide another clue as to how the mosquito is surviving and behaving in a desert region.
Aedes aegypti mosquitoes are vectors of great public health importance as they are capable of transmitting dengue, Zika, chikungunya, and yellow fever viruses (Pialoux et al., 2007; Guzman and Harris, 2015; Monath and Vasconcelos, 2015; Musso and Gubler, 2016). Importantly, although this mosquito initially spread throughout the world hundreds of years ago, their range has rapidly expanded into new regions and environments (Kraemer et al., 2015), putting an even greater number of people at risk of contracting these diseases. This vector lives in close proximity to human settlements, is active during daytime hours, and feeds preferentially on humans for blood meals, making the mosquito an efficient vector of diseases (Christophers, 1960). Aedes aegypti mosquitoes need water for larval development and generally reside in warm, tropical regions of the world, as their survival and reproductive cycles are greatly impacted by temperature (Brady et al., 2014). Their range has been expanding into more temperate regions of the world, such as the United States and Europe, driven by human movement, human development, and changes in land use and land cover (Kraemer et al., 2019; Wilke et al., 2020). With some exceptions of greater distances traveled, this mosquito is generally found to have a small range of about 100–200 m over the course of their lifetime (Harrington et al., 2005; Juarez et al., 2020), so their distribution is generally not homogeneous over an entire urban area but rather depends on habitat availability and microenvironment characteristics.
Past studies have focused on identifying the areas of a city well suited to hosting Ae. aegypti and identifying characteristics of the well-suited areas that can be targeted for mosquito control purposes. One approach to these studies has been to utilize species distribution models and satellite imagery to better understand the landscape characteristics that may be associated with Ae. aegypti populations. The goal of species distribution modeling is to predict the distribution of a species across a landscape given information about environmental variables (Franklin, 1995). Environmental variables may include weather or climate variables, soil variables, topographic variables, or landscape variables (Franklin, 1995). Species distribution models are based in ecological niche theory, the idea that the distribution of a species is limited by environmental characteristics (Vandermeer, 1972). Maxent is a popular freely available machine learning technique for species distribution modeling that uses presence-only observations of a species along with environmental variables to predict the probability of presence of the species throughout the study region (Phillips et al., 2006; Phillips and Dudík, 2008). This method has been used by several studies in the past in combination with remote sensing to predict the occurrence of Ae. aegypti (Arboleda et al., 2012; Espinosa et al., 2016; Estallo et al., 2018; Andreo et al., 2021; Hopperstad et al., 2021). One advantage of this approach is the creation of habitat suitability maps that could be useful for identifying consistent hot spots of the mosquito and for vector control planning.
Past studies using Maxent have been conducted in tropical areas, where diseases caused by pathogens transmitted by Ae. aegypti greatly impact populations. In Argentina, two studies used satellite imagery and socioeconomic factors to predict the distribution of larval habitat of Ae. aegypti, but seasonal or temporal trends were not evaluated (Espinosa et al., 2016; Estallo et al., 2018) while in Florida one study that combined land cover, climatic variables, and human population data to predict larval habitat suitability for Ae. aegypti using 6 weeks of larval collection data found that remotely sensed variables were more predictive than locally collected data (Hopperstad et al., 2021). Other studies created multiple species distribution models for one mosquito season (Andreo et al., 2021) or over multiple years (Arboleda et al., 2012) to identify core larval habitat for the vector and areas of the city that may benefit most from vector control activity. Some studies have used a similar but slightly different approach than the study presented in this manuscript by utilizing climate variables rather than satellite imagery to predict habitat suitability for Ae. aegypti using Maxent (Abdelkrim et al., 2021).
The goal of this study is to build on this previous research in order to create quarterly species distribution models based on satellite imagery and socioeconomic indicators for Ae. aegypti in Maricopa County, Arizona from 2014 to 2020. Maricopa County is located in the Sonoran Desert, habitat that may not naturally be suitable for the mosquito vector. However, anthropogenic modifications to the environment have created an oasis in the desert that has allowed this mosquito vector to thrive in this area. According to adult mosquito trapping data and information provided by the Maricopa County Environmental Services Vector Control Division (MCESVCD), the Ae. aegypti population in Maricopa County, Arizona has been increasing over the last decade, and the mosquito is now routinely trapped year-round in this region. Aedes aegypti has been identified in Arizona as far back as 1931 and 1946 in Tucson (Bequaert, 1947; Murphy, 1953) and 1951 in Yuma (Richards et al., 1956). However, the mosquito was not identified in routine surveillance for decades despite no specific efforts to reduce its population in Arizona (Engelthaler et al., 1997). It is possible that the Pan American Health Organization campaign to eradicate Ae. aegypti in the Americas contributed to the mosquito not being detected in Arizona in the mid-20th century, but the exact cause of the perceived disappearance of the mosquito remains unclear (Uribe, 1983; Engelthaler et al., 1997; Hotez, 2016). In the mid-1990s, Ae. aegypti was once again trapped in Tucson and along the Arizona-Mexico border (Engelthaler et al., 1997). By studying routine trapping data from the past 15 years, it is now clear that the population of the vector is generally increasing in Maricopa County. In 2020, the number of Ae. aegypti trapped decreased substantially, and the reasons for the decrease are unclear; however, 2021 was the biggest year on record as of September.
Past studies have attempted to create multitemporal species distribution models for Ae. aegypti using satellite imagery and socioeconomic factors as predictors either by creating multiple models within one mosquito season or by creating yearly models over the course of multiple years. This project has extended this research by creating multiple seasonal models per year over the course of 6 years, which allowed the evaluation of both seasonal and long-term trends in habitat suitability for Ae. aegypti in Maricopa County. Similar to previous studies, we hypothesized that we would identify areas in Maricopa County that consistently support Ae. aegypti populations over multiple seasons and years. We also anticipated that, given the close relationship the vector has with human populations, human population density would be an important predictor in the models. Finally, given that the mosquito prefers a humid or tropical environment, we expected that increased vegetation would be associated with increased Ae. aegypti presence in Maricopa County.
This project is also the first of its kind, as far as we are aware, to utilize satellite imagery and socioeconomic predictors to predict habitat suitability for Ae. aegypti using Maxent in an arid desert environment, habitat into which this vector has recently expanded. This project will be a step toward the long-term objective of developing an understanding of the underlying geographic distribution and movement of the mosquito vector Ae. aegypti in Maricopa County, Arizona and, more broadly, in arid desert environments. In addition to contributing to the growing body of research that is attempting to understand the distribution of this vector, especially in territories into which the mosquito has recently expanded, the findings of this study will be beneficial to vector control and public health efforts as the mosquito population increases and outbreaks of disease occur.
Maricopa County is located in south central Arizona in the southwestern United States. The county comprises approximately 24,000 square kilometers of land and contains Arizona’s capital and most populous city, Phoenix, along with over 20 additional recognized cities and towns (Maricopa County, 2021). The population of Maricopa County is approximately 4.5 million residents (Maricopa County, 2021). The county is located in a desert climate with generally low humidity. Phoenix has an average annual rainfall of 20.4 cm, an average maximum temperature of 41.2°C for the hottest month, July, and an average minimum temperature of 7.1°C for the coldest month, December (Schmidli, 1996). Rainfall is scarce and sporadic for most of the year, while monsoon season in July and August can bring torrential rains (Schmidli, 1996). Like most desert climates, the temperature can fluctuate drastically between the daytime high and the nighttime low with variations of 15°C or more in 1 day being common (Schmidli, 1996). For this study, we chose not to include weather predictors due to the relatively small study area that should have fairly consistent weather and climate and also due to the lack of availability of this type of data at the scale of our other predictors (30 m).
Maricopa County, Arizona is an at-risk location for potential importation of Ae. aegypti-transmitted pathogens due to the established presence of the mosquito vector and a high volume of travelers crossing the border into Arizona from areas with endemic Ae. aegypti-transmitted pathogens, such as Mexico and Central America. On average, over 25 million travelers cross the border from Mexico into Arizona each year (United States Department of Transportation, 2022). Further, all travelers crossing the land border from Mexico into Arizona, regardless of their origin, will cross through an area that regularly experiences outbreaks of disease associated with Ae. aegypti, which creates the risk that viremic travelers could introduce pathogens to the mosquito vector population in Arizona. Sonora, Mexico, which is just south of the Arizona-Mexico border, recorded over 300 laboratory-confirmed cases of Zika virus (Secretaría de Salud, 2018) (the most cases of all Mexican states) in 2018 and 982 and 2,606 probable cases of dengue (Secretaría de Salud, 2019) in 2018 and 2019, respectively, which raises concerns about the pathogens that cause these diseases spreading to and becoming established in the Ae. aegypti population in Arizona. In Arizona, seventeen travel-related cases of dengue infection were reported in 2019, twelve of which were identified in Maricopa County (Arizona Department of Health Services-Office of Infectious Disease Services, 2019). Furthermore, as recently as 2014, outbreaks of dengue resulting in nearly 100 reported cases have occurred along the Arizona-Mexico border in Yuma, Arizona which is less than 200 miles from densely populated Maricopa County (Jones et al., 2016).
MCESVCD performs regular CO2 trapping of adult mosquitoes throughout Maricopa County, but with traps concentrated in the Phoenix metropolitan area, by setting up more than 800 overnight CO2 traps for a 12-h period each week. The trapping program in Maricopa County is one of the most comprehensive programs in the country, both in the amount of area covered and in the regularity with which traps are placed. Through an established partnership with MCESVCD, we gained access to this trapping data for the years 2014–2020. The provided data includes the trapping date, number of adult mosquitoes trapped, species and sex of the mosquitoes, identification number of the trap, and latitude and longitude values.
To create the multitemporal models for this study, we divided the study period into quarters that roughly reflect four seasons of the year with varying levels of mosquito activity. The quarters were defined as follows: February 1–April 30, May 1–July 31, August 1–October 31, and November 1–January 31 (Table 1). To suit the requirements of Maxent, the species distribution model used for this study, trapping data were converted to presence only records for each quarter by creating a list of observations at unique locations defined by latitude and longitude and then removing duplicate observations for each location in each quarter. Due to missing data for three quarters (8/1/2018–10/31/2018, 11/1/2018–1/31/2019, and 11/1/2020–1/31/2021), presence only records were available to create 25 quarterly models from 2014 to 2020.
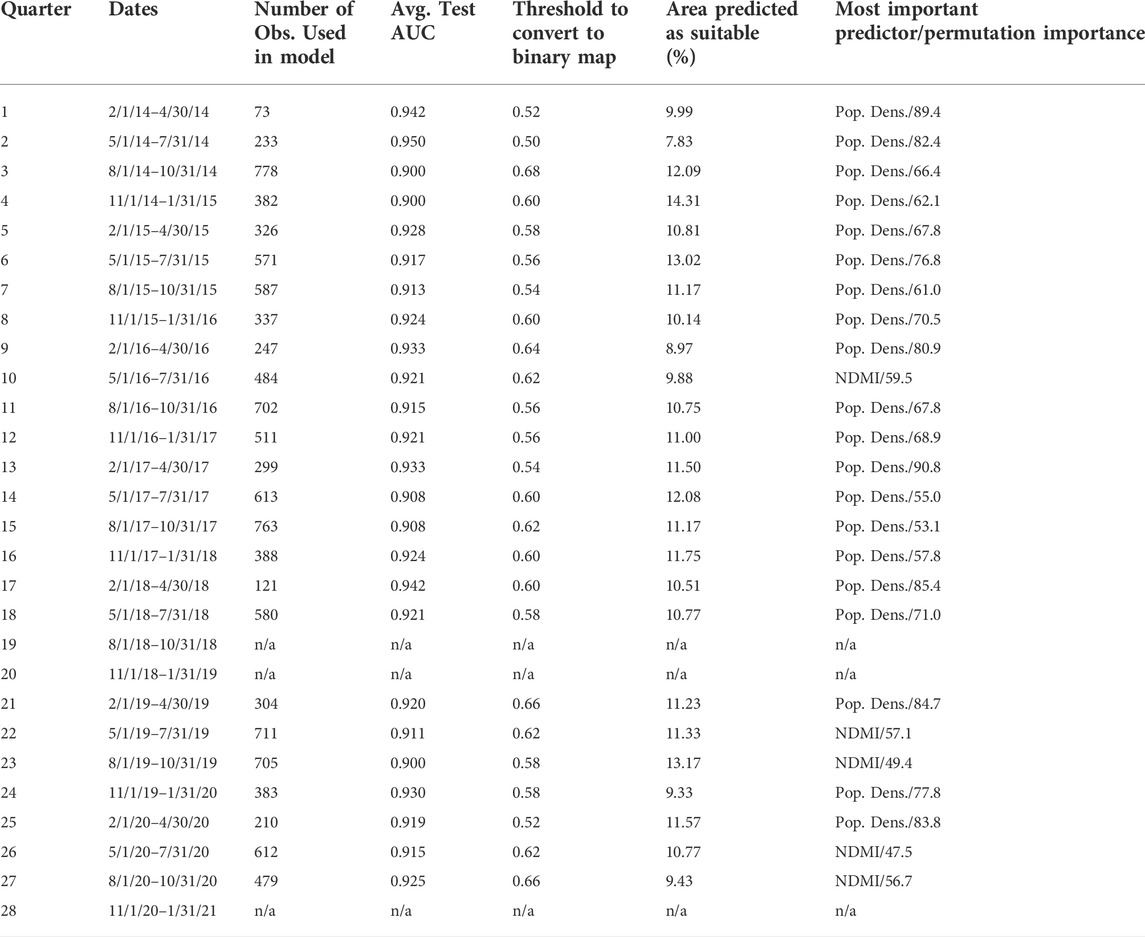
TABLE 1. Quarters with descriptive statistics and results. This table shows the quarter number, dates, number of observations used in model building, average test area under curve (AUC) from Maxent output, the threshold used to convert the suitability output to binary presence/absence data using a 10 percent omission threshold, the percentage of area calculated as suitable after converting to binary data, and the most important predictor with the permutation importance.
Google Earth Engine (Gorelick et al., 2017) was used to download Landsat 8 OLI satellite imagery (Irons et al., 2012) clipped to Maricopa County, Arizona. For each quarter, all available Landsat 8 images with top of atmosphere reflectance were downloaded. Then, any pixels with a cloud score of 1 or cloud shadow confidence score of 3 were masked. For each Landsat 8 image available, the Normalized Difference Vegetation Index (NDVI) and the Normalized Difference Moisture Index (NDMI) were calculated using bands 5 and 4 or bands 5 and 6, respectively. Finally, the mean NDVI and mean NDMI values were calculated for each pixel using all Landsat 8 images in that quarter. Landsat 8 imagery has a resolution of 30 m, so the resulting NDVI and NDMI products for each quarter in turn also had a 30-m resolution. Elevation data from the NASA Shuttle Radar Topography Mission (SRTM) were also clipped to Maricopa County, Arizona in Google Earth Engine (Farr et al., 2007). The images were exported from Google Earth Engine to be used with Maxent. The resample function from the raster package (Version 3.5–11) was used to ensure that the elevation raster matched the extent and cell size of the NDVI and NDMI rasters exactly (Hijmans, 2021).
Socioeconomic predictors were also included due to the close relationship that Ae. aegypti mosquitoes have with humans. Socioeconomic predictors were downloaded from the United States Census TIGER/Line Shapefiles with Selected Demographic and Economic Data from the American Community Survey 5-Year Estimates from 2019 at the block group resolution (US Census Bureau, 2021). Data were downloaded for all of Arizona, so only those block groups that have their centroid in Maricopa County were selected for further use using ArcMap (Version 10.7.1).
Socioeconomic predictors of interest were population density and median income. Predictors were chosen based on a priori assumptions about potential influences on the suitability of habitat and the availability of blood meals for the vector. Population density was included because the vector generally prefers to feed on humans for blood meals (Christophers, 1960), so areas with more people may be better able to support Ae. aegypti populations. Further, a similar study found human population density was the most influential factor for predicting habitat suitability for Ae. aegypti in an Argentinian city (Estallo et al., 2018). Median income was included after conversations with MCESVCD staff indicated a potential correlation between Ae. aegypti populations and higher income areas, potentially due to an increased use of water for landscaping, water features, or pools.
Population density was calculated by dividing the population of each block group by the area of each block group in square kilometers. The polygon layers for these two variables of interest were converted to rasters using the Polygon to Raster tool in ArcMap (Version 10.7.1) using the setting MAXIMUM_AREA; extent and cell size was set to match that of the NDVI rasters downloaded from Google Earth Engine. The rasters for population density and median income were exported from ArcMap (Version 10.7.1) in ASCII format. Before continuing with further analysis, the socioeconomic predictor rasters were imported to RStudio (Version 1.4.1717) along with the NDVI, NDMI, and elevation rasters (R Core Team, 2021). The resample function from the raster package (Version 3.5-11) was used to ensure that the socioeconomic rasters matched the extent and cell size of the NDVI, NDMI, and elevation rasters exactly (Hijmans, 2021).
The first step in the modeling process involved evaluating the correlation of the five rasters (NDVI, NDMI, elevation, population density, median income) from each quarter to ensure that no rasters had a correlation of >0.7, as was done in Estallo et al. (2018) and Abdelkrim et al. (2021). Next, we determined the best settings with which to run Maxent for each quarter individually using the ENMeval package (Version 2.0.2) in RStudio (Version 1.4.1717) using 10-fold cross validation (Kass et al., 2021; R Core Team, 2021). The possible settings from which we chose the best model included the features L, LQ, H, LQH, LQHP, LQHPT (L, Linear; Q, Quadratic; P, Product; H, Hinge; T, Threshold) with a regularization multiplier between 1 and 5 (Phillips, 2005; Merow et al., 2013). The best settings for each quarter were chosen based on the model with the lowest delta corrected Akaike Information Criterion (AICc) (Hurvich and Tsai, 1989). Using the ENMeval package, a bias file was also created based on the observations for each quarter. Bias files help address the issues that arise when sampling is not random throughout the study area by biasing the background points selected to be in the same area where the majority of observations occurred, thereby reducing potential bias towards predicting higher suitability in areas that are simply more accessible and therefore more sampled. This approach is preferred over filtering observations when the species is expected to be spatially clumped, as is the case for Ae. aegypti, which would be expected to have greater populations around densely populated areas (Kramer-Schadt et al., 2013).
Next, we ran Maxent (version 3.4.0) for each quarter using the bias file created for each quarter and the best settings possible as described above. Each Maxent model was created using 10-fold cross validation, and the average output across all 10 folds was further evaluated. Supplementary Table S2 for the feature settings and regularization multiplier used for each quarter.
The Maxent output included habitat suitability maps for Maricopa County with values ranging from 0 to 1 representing the estimated habitat suitability for Ae. aegypti mosquitoes for each 30-m by 30-m square in the county, based on the observations for that quarter (Phillips, 2005). These maps were then converted to binary presence/absence maps based on the 10 percent omission threshold determined using the package SDMtools (Version 1.1-221.2) in RStudio (Version 1.4.1717) (VanDerWal et al., 2019; R Core Team, 2021) (Table 1; Supplementary Figures S1–S25). We chose to use the 10 percent omission threshold to create binary maps such that the area that is identified as suitable would encompass nearly all observations. However, this threshold also delineates a smaller area that is considered suitable by removing observations in areas with conditions in which the mosquito is not as consistently trapped. Other species distribution model studies have also utilized this approach (Radosavljevic and Anderson, 2014; Hopperstad et al., 2021).
After the suitability maps were converted to binary values, we calculated the percentage of area in the county that was deemed suitable for each quarter by dividing the number of pixels deemed suitable by the total number of pixels in the study area (Table 1). Further, consensus maps were created by overlaying the binary maps for each year, each season, and for all maps as described above (Figure 2; Supplementary Figures S26–S36). Areas that were predicted as consistently suitable in each of the quarterly maps were considered suitable for the consensus maps (Arboleda et al., 2012). For the consensus maps, the percent of area predicted as suitable and the omission rate, or percentage of positive observations that were not predicted based on the suitable area, was calculated (Table 2).
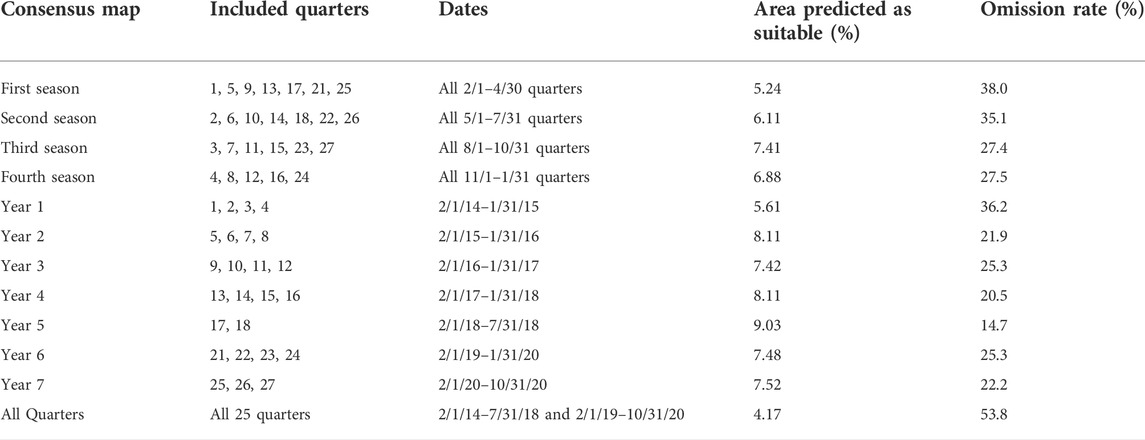
TABLE 2. Consensus map aggregations with descriptive statistics and results. This table shows the consensus aggregation with the quarters used for each, the dates for each consensus map, the percentage of area predicted as suitable after converting to a binary map, and the omission rate of the binary map.
Consensus maps were created for each year (e.g., year 1 was an aggregate of quarter 1, quarter 2, quarter 3, and quarter 4) and for each season (e.g., all February–April quarters; all May–July quarters; all August–October quarters; and all November–January quarters) by averaging the predicted suitability by pixel (Supplementary Figures S26–S36). Additionally, an overall consensus map was created by averaging the predicted suitability values for all 25 quarterly maps (Figure 1).
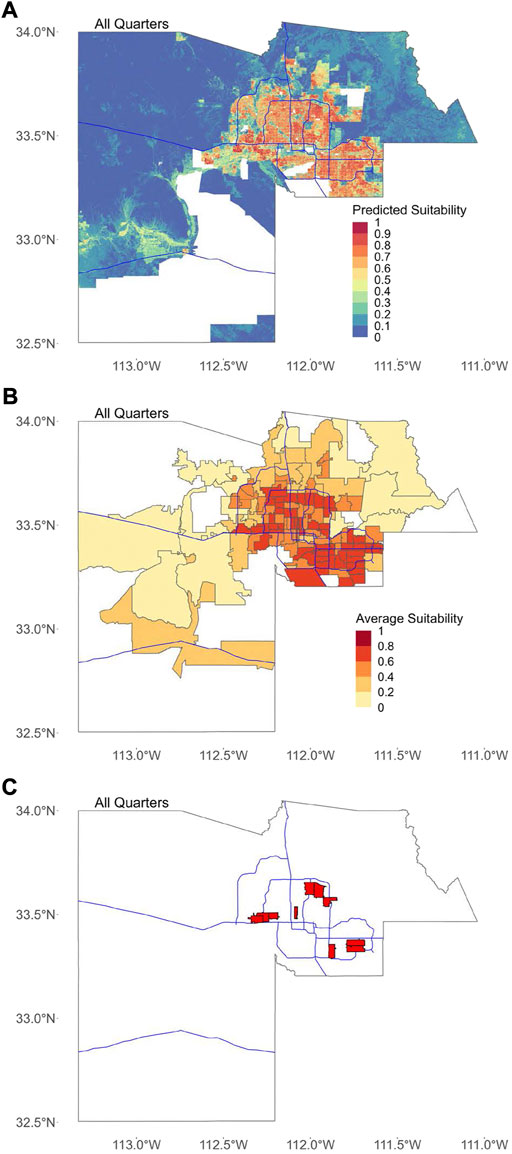
FIGURE 1. Average predicted suitability for all quarters. In all figures, blue lines represent major freeways in Maricopa County as a spatial reference. (A) Map showing the mean predicted suitability for each 30-m by 30-m pixel, calculated as the mean of the predicted suitability for all 25 quarters. Areas with missing data where suitability was not predicted are shown in white. (B) Predicted suitability for all quarters averaged by ZCTA. (C) The location of ten ZCTAs with the highest average suitability for all quarters.
Maps of major freeways were downloaded from the AZGeo Data Hub to use as location references for the maps produced in this study. The data for the freeways maps was provided by the Maricopa Association of Governments and is publicly available and free to download as a shapefile (https://azgeo-data-hub-agic.hub.arcgis.com/).
Using the binary maps, we were able to calculate the percentage of area in Maricopa County that was determined to be suitable for Ae. aegypti for each quarter as well as for all of the consensus maps. We were also able to aggregate the results for block groups, tracts, and zip code tabulation areas (ZCTAs) in two different ways in order to produce more actionable maps for vector control, since individual 30-m by 30-m pixels would be difficult to target for mosquito control. First, using the original habitat suitability output (with values ranging 0–1), we were also able to determine the average suitability for the aggregate areas for each quarter and for the consensus maps. We produced these average maps for each quarter and again for all consensus average predicted suitability maps (Figure 1; Supplementary Figures S1–S36). Second, using the quarterly and consensus binary maps, we are able to determine the proportion of area that was predicted to be suitable within block groups, tracts, and ZCTAs (Figure 2; Supplementary Figures S1–S36). The 2019 shapefiles for the various census areas were downloaded from the United States Census Bureau (https://www.census.gov/geographies/mapping-files/time-series/geo/tiger-line-file.2019.html), then imported to RStudio (Version 1.4.1717) where we used the function “zonal” from the raster (Version 3.5–11) package to determine the mean suitability value and the proportion of area predicted as suitable for each aggregate area. Maps were then created using ggplot2 (Version 3.3.5) and the sf (Version 1.0–5) packages or using the raster (Version 3.5–11) package (Wickham, 2011; Pebesma, 2018; Hijmans, 2021; R Core Team, 2021).
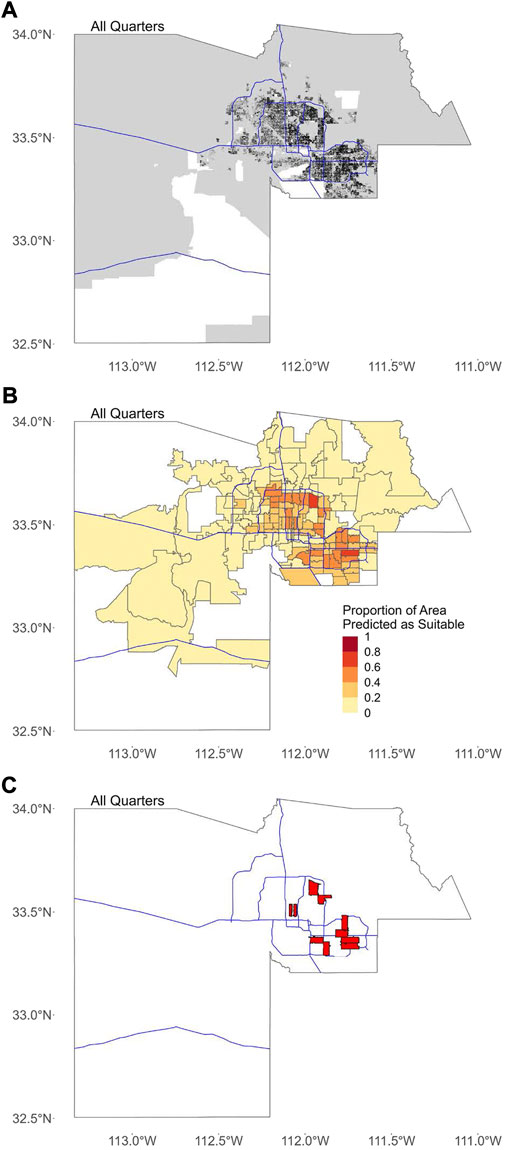
FIGURE 2. Binary maps for all quarters. In all figures, blue lines represent major freeways in Maricopa County as a spatial reference. (A) The consensus binary map for all quarters created by overlaying the binary map for all 25 quarters. Areas with missing data where suitability was not predicted are shown in white. (B) Proportion of area in each ZCTA predicted as suitable based on binary map in (A). (C) The location of ten ZCTAs with the highest proportion of area predicted as suitable for all quarters.
Trapping observations from 2014 to 2020 were split into 28 quarterly time periods, with full data available for only 25 quarters (Table 1). The number of observations varied for each quarter from a low of 73 locations (2/1/2014–4/30/2014) to a high of 778 locations (8/1/2014–10/31/2014) (Table 1). Overall, for all 25 quarters for which data was available, there were 11,399 locations at which Ae. aegypti was observed, although the locations were not unique for each quarter. The mean number of locations at which Ae. aegypti was observed per quarter was 456 (standard deviation: 203).
The following five predictors were used: NDVI, NDMI, elevation (range: 125–2,304 m, mean: 498 m, standard deviation: 258 m), population density (range: 0–14,657 people per square kilometer, mean: 182 people per square kilometer, standard deviation: 625 people per square kilometer), and median income (range: $10,716–$250,001, mean: $73,046, standard deviation: $33,123). The range, mean, and standard deviation values for NDVI and NDMI for each quarter can be found in Supplementary Table S1. The importance for each predictor varied from quarter to quarter, but population density was almost always the most important predictor (20/25 models) (Table 1) while median income (16/25 models) or elevation (9/25 models) was the least important predictor for all quarters. NDMI was the most important predictor for five quarters: quarters 10, 22, 23, 26, and 27. Increased human population density appears to be associated with greater suitability for Ae. aegypti while increased NDVI also appears to be associated with greater suitability for the mosquito up to a certain point, likely because extremely vegetated areas are more likely to have lower human population density (Supplementary Figures S37–S61).
Output included an image showing the pixel-by-pixel habitat suitability value on a scale of 0–1 (with 1 being highest suitability) (Supplementary Figures S1–S25), response curves for each predictor (Supplementary Figures S37–S61), the value for the average permutation importance for each predictor across all folds (Phillips, 2005; Phillips et al., 2006), a receiver operating characteristic (ROC) curve, and test area under curve (AUC) value (Estallo et al., 2018) which provides a threshold-independent approach to evaluating model performance (Table 1). All quarterly models had high (≥0.90) test AUC, indicating excellent model fit (Estallo et al., 2018) (Table 1). Suitability was generally high in the Phoenix metropolitan area and lower in the rural areas of the county; however, there did exist quite a bit of variation in suitability throughout the Phoenix area, with the eastern and southeastern portions of the metropolitan area generally having the highest predicted suitability.
After the suitability maps were converted to binary values, we calculated the percentage of area in Maricopa County that was found to be suitable for each quarter (Table 1). For the consensus maps, the percentage of area in Maricopa County found to be suitable and the omission rate was calculated (Table 2). For the quarterly maps, the area deemed suitable ranged from 7.83% to 14.31% of Maricopa County. For the quarterly consensus maps, the percentage of area of Maricopa County deemed suitable for each quarter was: 5.24% in the February–April quarter, 6.11% for the May–July quarter, 7.41% for the August–October quarter, and 6.88% for the November–January quarter. For the yearly consensus maps, the area of Maricopa County deemed suitable for each year was: 5.61% for year 1, 8.11% for year 2, 7.42% for year 3, 8.11% for year 4, 9.03% for year 5, 7.48% for year 6, and 7.52% for year 7. The overall consensus map had 4.17% of the area of Maricopa County as suitable. For each of the 25 quarterly binary maps, the omission rate was approximately 10% as that is how the threshold was selected; for the consensus maps, the omission rate was calculated by overlaying the observations for all maps combined onto the consensus binary map. The quarterly omission rates were: 38.0% in the February–April quarter, 35.1% for the May–July quarter, 27.4% for the August–October quarter, and 27.5% for the November–January quarter. The yearly omission rates were: 36.2% for year 1, 21.9% for year 2, 25.3% for year 3, 20.5% for year 4, 14.7% for year 5, 25.3% for year 6, and 22.2% for year 7. The omission rate for the overall binary map was 53.8%.
The top 10 block groups, tracts, and ZCTAs in terms of overall average suitability were spread throughout the Phoenix metropolitan area in the southeastern, northeastern, central, and southwestern areas (Figure 1). All of the top 10 block groups, tracts, and ZCTAs in terms of the proportion of area predicted as suitable are located in the central Phoenix or the eastern/southeastern Phoenix metropolitan areas (Figure 2).
Through the creation of species distribution models for 25 quarterly time periods over 6 years, we were able to identify potential long term “core” habitat for the mosquito vector, as well as some “hotspot” locations with greater than average suitability that could potentially be targeted for vector control activity. We confirmed our hypotheses by identifying areas in Maricopa County that consistently support Ae. aegypti populations, by determining that human population density is an important predictor for the presence of Ae. aegypti populations, and by determining that increased vegetation, up to a certain point, is associated with the presence of Ae. aegypti populations in Maricopa County. One of the greatest strengths of this study is the ability to look at seasonal trends over the course of 6 years, providing further insight into the long-term habits of the vector in this region. Furthermore, this is the first study, as far as we are aware, that has evaluated species distribution models for the vector Ae. aegypti in a desert region.
Binary maps, especially the consensus binary maps, are potentially great tools for vector control planning purposes. Distilling 6 years of trapping data down into one map that shows locations with consistent habitat suitability for Ae. aegypti populations can help to provide an overall summary of the activity of Ae. aegypti since it has become strongly established in this region. It also helps to “fill in the gaps” between trapping locations and to identify additional areas that may have high suitability for the vector but are not currently being as intensively trapped or observed. Of course, the threshold that is chosen to create the binary maps has a substantial impact on the areas that are identified as suitable compared to the areas that are not.
We found that the omission rate was much higher for the consensus maps than it was for quarterly maps, indicating that there is a consistent area that is suitable for the vector, but that a lot of mosquito activity is also observed outside of this core area. This study does not provide insight into preferred larval habitat as the distribution maps were based solely on trapping data for adult mosquitoes, although it is reasonable to assume that the presence of adult female mosquitoes may indicate the presence of suitable larval habitat in which eggs can be deposited. Future studies should examine the movement of the mosquito in this region over time which would provide another clue as to how the mosquito is surviving and behaving in a desert region.
Tract and ZCTA aggregations should be interpreted with caution since the census data for population density and median income were both collected at the block group level. Some tracts and ZCTAs have missing data due to 50 census block groups having missing median income information. Further, the census tracts and ZCTAs may not have the same composition as the block groups that made up the predictors, but instead are an aggregate of all characteristics in that area. In particular, the ZCTA results may be skewed because ZCTAs are not meant to represent a homogenous population. However, the results are still useful for vector control purposes because they provide an easier tool for planning instead of individual 30-m by 30-m pixels, and in the event of an outbreak predicted habitat suitability for Ae. aegypti can quickly be linked to human case data which is generally reported at the ZCTA level. Importantly, the overall characteristics of the tract or ZCTA may not reflect the smaller areas that are actually suitable for the vector.
Our study, like the Argentina-based findings published by Estallo et al., 2018 and the Florida-based findings published by Hopperstad et al. (2021), indicated that human population density is an important factor when determining habitat suitability for Ae. aegypti. Given that this mosquito vector is highly anthropophilic, this is an expected finding. Like Andreo et al. (2021) and Arboleda et al. (2012), we were able to create species distribution models for multiple time periods which could then be converted to binary suitability maps and overlaid to determine the areas that are consistently suitable for the vector over a longer time period. Similarly, we hope that these maps can be helpful for vector control purposes by identifying core areas that serve as consistent habitat for the vector over a longer time period. As in Arboleda et al. (2012), we found that the omission rate was much higher for the consensus maps than it was for individual maps, indicating that there is a consistent area that is suitable for the vector over time, but that populations of the vector are also observed in different areas outside of this core habitat depending on the year and season
Although the maps produced in this study may be helpful for vector control and public health purposes, the results may suffer from the modifiable areal unit problem (MAUP) due to the scale of the predictors used compared to the range of the mosquito that we attempted to model (Openshow, 1979; Jelinski and Wu, 1996; Wong, 2004). The MAUP can be broken down into two primary issues: 1) that the results of any analysis are dependent on the scale of the inputs; and 2) that the results of an analysis will differ based on how areal units are “zoned,” even when they are the same size. For example, the results of this analysis may have been different had we used finer or coarser resolution satellite imagery or socioeconomic predictors at the census tract or ZCTA level rather than the census block group level. Additionally, even if the information used in the analysis remained at the same scale, there could be differences in the results based on how the areal units were grouped together. Furthermore, the results could vary based on how they are aggregated after the analysis is performed, so it is wise to interpret all results and conclusions with caution until more research has been conducted and we have a better understanding of these relationships.
One limitation of this study was that trapping data was represented only as presence data. This means that outputs that represent suitability do not account for differences in abundance throughout the county (Elith et al., 2011). Some areas that are predicted to be suitable may only have small or transient populations of Ae. aegypti whereas others may have large, consistent populations of the vector and therefore a large increase in the potential risk of pathogen transmission by the mosquito. Presence only data also may not account for fluctuations in populations due to interventions such as insecticide application, which were not accounted for in this study, although MCESVCD regularly uses pyrethroids to control mosquito populations throughout the county. Future studies that explore species distribution models that account for abundance could be helpful to more specifically identify areas that have large populations of Ae. aegypti where people may be more likely to be exposed to pathogens that cause disease. Additionally, models that explicitly account for interventions could help to evaluate the effectiveness of these interventions.
As of yet, we cannot determine whether the findings presented in this study for highly suitable areas would be correlated with risk of disease in the event of an outbreak, although findings by Arboleda et al. indicate that areas predicted as suitable by a species distribution model are correlated with human cases of dengue (Arboleda et al., 2012). In the event of a future outbreak, it will be important to evaluate the relationship between our suitability maps and the incidence of human cases of disease; however, past studies suggest that the maps produced by this study could be helpful for a public health response during an outbreak of disease vectored by Ae. aegypti. It is our hope that preparing this information ahead of time could help to reduce the burden and cost of disease in Maricopa County if an outbreak does occur.
The goal of this study was to create quarterly species distribution models based on satellite imagery and socioeconomic indicators for Ae. aegypti in Maricopa County, Arizona from 2014 to 2020. This project was intended to be a step toward the long-term objective of developing an understanding of the underlying geographic distribution and movement of the mosquito vector Ae. aegypti in Maricopa County, Arizona and, more broadly, in arid desert environments. As the vector continues to expand its range throughout the world, including rapid expansions into the desert southwestern United States, further understanding of the mosquito’s behavior in these regions will be needed in order to prepare for a potential outbreak of disease. It is our goal to create a better understanding of the distribution and behavior of the vector in this region to aid public health and vector control efforts aimed at reducing the risk and burden of disease in the event an outbreak occurs.
The datasets presented in this study can be found in online repositories. The names of the repository/repositories and accession number(s) can be found below: https://drive.google.com/drive/folders/1Hrqs-Vpv-9w64rtBBXuKq9Po51D3A3-G?usp=sharing.
Conceptualization: WH-E and CH. Methodology: WH-E, SY, JW, NB, and JT. Investigation: WH-E, CH, SY, JW, NB, and JT. Visualization: WH-E. Funding acquisition: WH-E and CH. Project administration: WH-E and CH. Supervision: CH. Writing original draft: WH-E. Writing—review and editing: WH-E, CH, SY, JW, NB, and JT. Final approval: All authors.
Research reported in this publication was supported by the National Institute On Minority Health And Health Disparities of the National Institutes of Health under Award Number F31MD015674 (WH-E). Pacific Southwest Regional Center of Excellence for Vector-Borne Diseases funded by the U.S. Centers for Disease Control and Prevention Cooperative Agreement 1U01CK000516 (CH and WH-E). New Investigator Award (ADHS18-198866) from the Arizona Biomedical Research Centre (CH). Bridge-Funding Initiative Award from the Flinn Foundation (CH).
A preprint of this manuscript is available at: https://www.biorxiv.org/content/10.1101/2022.03.30.486464v1.
The authors declare that the research was conducted in the absence of any commercial or financial relationships that could be construed as a potential conflict of interest.
All claims expressed in this article are solely those of the authors and do not necessarily represent those of their affiliated organizations, or those of the publisher, the editors and the reviewers. Any product that may be evaluated in this article, or claim that may be made by its manufacturer, is not guaranteed or endorsed by the publisher.
The content is solely the responsibility of the authors and does not necessarily represent the official views of the National Institutes of Health, Centers for Disease Control and Prevention, the Arizona Biomedical Research Centre, or the Flinn Foundation.
The Supplementary Material for this article can be found online at: https://www.frontiersin.org/articles/10.3389/fenvs.2022.1001190/full#supplementary-material
Abdelkrim, O., Samia, B., Said, Z., and Souad, L. (2021). Modeling and mapping the habitat suitability and the potential distribution of Arboviruses vectors in Morocco. Parasite 28, 37. doi:10.1051/parasite/2021030
Andreo, V., Cuervo, P. F., Porcasi, X., Lopez, L., Guzman, C., and Scavuzzo, C. M. (2021). Towards a workflow for operational mapping of Aedes aegypti at urban scale based on remote sensing. Remote Sens. Appl. Soc. Environ. 23, 100554. doi:10.1016/j.rsase.2021.100554
Arboleda, S., Jaramillo-O, N., and Peterson, A. T. (2012). Spatial and temporal dynamics of Aedes aegypti larval sites in Bello, Colombia. J. Vector Ecol. 37 (1), 37–48. doi:10.1111/j.1948-7134.2012.00198.x
Arizona Department of Health Services-Office of Infectious Disease Services (2019). Arizona 2019 dengue statistics. Available at: https://www.azdhs.gov/documents/preparedness/epidemiology-disease-control/mosquito-borne/dengue/data/dengue-2019-stats.pdf.
Bequaert, J. (1947). Aëdes aegypti (Linnaeus), the yellow fever mosquito, in Arizona (Diptera). Bull. Brooklyn Entomological Soc. 41 (5), 157.
Brady, O. J., Golding, N., Pigott, D. M., Kraemer, M. U. G., Messina, J. P., Reiner, R. C., et al. (2014). Global temperature constraints on Aedes aegypti and Ae. albopictus persistence and competence for dengue virus transmission. Parasit. Vectors 7, 338. doi:10.1186/1756-3305-7-338
Christophers, S. R. (1960). Aedes aegypti: The yellow fever mosquito. Cambridge: Cambridge University Press.
Elith, J., Phillips, S. J., Hastie, T., Dudík, M., Chee, Y. E., and Yates, C. J. (2011). A statistical explanation of MaxEnt for ecologists. Divers. Distrib. 17 (1), 43–57. doi:10.1111/j.1472-4642.2010.00725.x
Engelthaler, D. M., Fink, T. M., Levy, C. E., and Leslie, M. J. (1997). The reemergence of Aedes aegypti in Arizona. Emerg. Infect. Dis. 3 (2), 241–242. doi:10.3201/eid0302.970223
Espinosa, M., Weinberg, D., Rotela, C. H., Polop, F., Abril, M., and Scavuzzo, C. M. (2016). Temporal dynamics and spatial patterns of Aedes aegypti breeding sites, in the context of a dengue control program in Tartagal (Salta Province, Argentina). PLOS Negl. Trop. Dis. 10, e0004621. doi:10.1371/journal.pntd.0004621
Estallo, E. L., Sangermano, F., Grech, M., Ludueña-Almeida, F., Frías-Cespedes, M., Ainete, M., et al. (2018). Modelling the distribution of the vector Aedes aegypti in a central Argentine city. Med. Vet. Entomol. 32 (4), 451–461. doi:10.1111/mve.12323
Farr, T. G., Rosen, P. A., Caro, E., Crippen, R., Duren, R., Hensley, S., et al. (2007). The shuttle radar topography mission. Rev. Geophys. 45 (2), RG2004–33. doi:10.1029/2005rg000183
Franklin, J. (1995). Predictive vegetation mapping: Geographic modelling of biospatial patterns in relation to environmental gradients. Prog. Phys. Geogr. Earth Environ. 19 (4), 474–499. doi:10.1177/030913339501900403
Gorelick, N., Hancher, M., Dixon, M., Ilyushchenko, S., Thau, D., and Moore, R. (2017). Google Earth engine: Planetary-scale geospatial analysis for everyone. Remote Sens. Environ. 202, 18–27. doi:10.1016/j.rse.2017.06.031
Guzman, M. G., and Harris, E. (2015). Dengue. Lancet 385, 453–465. doi:10.1016/s0140-6736(14)60572-9
Harrington, L. C., Scott, T. W., Lerdthusnee, K., Coleman, R. C., Costero, A., Clark, G. G., et al. (2005). Dispersal of the dengue vector Aedes aegypti within and between rural communities. Am. J. Trop. Med. Hyg. 72 (2), 209–220. doi:10.4269/ajtmh.2005.72.209
Hijmans, R. J. (2021). raster: Geographic data analysis and modeling. Available at: https://CRAN.R-project.org/package=raster.
Holeva-Eklund, WM (2022). Species Distribution Modeling of Aedes aegypti in Maricopa County, Arizona from 2014-2020. BioRxiv [Preprint]. Available at: https://www.biorxiv.org/content/10.1101/2022.03.30.486464v1
Hopperstad, K. A., Sallam, M. F., and Reiskind, M. H. (2021). Estimations of fine-scale species distributions of Aedes aegypti and Aedes albopictus (Diptera: Culicidae) in eastern Florida. J. Med. Entomol. 58 (2), 699–707. doi:10.1093/jme/tjaa216
Hotez, P. J. (2016). Zika in the United States of America and a fateful 1969 decision. PLoS Negl. Trop. Dis. 10, e0004765. doi:10.1371/journal.pntd.0004765
Hurvich, C. M., and Tsai, C. L. (1989). Regression and time series model selection in small samples. Biometrika 76 (2), 297–307. doi:10.1093/biomet/76.2.297
Irons, J. R., Dwyer, J. L., and Barsi, J. A. (2012). The next Landsat satellite: The Landsat data continuity mission. Remote Sens. Environ. 122, 11–21. doi:10.1016/j.rse.2011.08.026
Jelinski, D. E., and Wu, J. (1996). The modifiable areal unit problem and implications for landscape ecology. Landsc. Ecol. 11, 129–140. doi:10.1007/bf02447512
Jones, J. M., Lopez, B., Adams, L., Gálvez, F. J. N., Núñez, A. S., Santillán, N. A. H., et al. (2016). Binational dengue outbreak along the United States–Mexico border — Yuma county, Arizona, and sonora, Mexico, 2014. MMWR. Morb. Mortal. Wkly. Rep. 65 (19), 495–499. doi:10.15585/mmwr.mm6519a3
Juarez, J. G., Garcia-Luna, S., Chaves, L. F., Carbajal, E., Valdez, E., Avila, C., et al. (2020). Dispersal of female and male Aedes aegypti from discarded container habitats using a stable isotope mark-capture study design in South Texas. Sci. Rep. 10, 6803. doi:10.1038/s41598-020-63670-9
Kass, J. M., Muscarella, R., Galante, P. J., Bohl, C. L., Pinilla-Buitrago, G. E., Boria, R. A., et al. (2021). ENMeval 2.0: Redesigned for customizable and reproducible modeling of species’ niches and distributions. Methods Ecol. Evol. 12 (9), 1602–1608. doi:10.1111/2041-210x.13628
Kraemer, M. U. G., Sinka, M. E., Duda, K. A., Mylne, A. Q. N., Shearer, F. M., Barker, C. M., et al. (2015). The global distribution of the arbovirus vectors Aedes aegypti and Ae. albopictus. Elife 4, e08347. doi:10.7554/elife.08347
Kraemer, M. U. G., Reiner, R. C., Brady, O. J., Messina, J. P., Gilbert, M., Pigott, D. M., et al. (2019). Past and future spread of the arbovirus vectors Aedes aegypti and Aedes albopictus. Nat. Microbiol. 4, 854–863. doi:10.1038/s41564-019-0376-y
Kramer-Schadt, S., Niedballa, J., Pilgrim, J. D., Schröder, B., Lindenborn, J., Reinfelder, V., et al. (2013). The importance of correcting for sampling bias in MaxEnt species distribution models. Divers. Distrib. 19 (11), 1366–1379. doi:10.1111/ddi.12096
Maricopa County 2021. Maricopa county quick facts. Available at: https://www.maricopa.gov/3598/County-Quick-Facts [Accessed January 26, 2022].
Merow, C., Smith, M. J., and Silander, J. A. (2013). A practical guide to MaxEnt for modeling species’ distributions: What it does, and why inputs and settings matter. Ecography 36 (10), 1058–1069. doi:10.1111/j.1600-0587.2013.07872.x
Monath, T. P., and Vasconcelos, P. F. C. (2015). Yellow fever. J. Clin. Virol. 64, 160–173. doi:10.1016/j.jcv.2014.08.030
Musso, D., and Gubler, D. J. (2016). Zika virus. Clin. Microbiol. Rev. 29 (3), 487–524. doi:10.1128/cmr.00072-15
Openshow, S. (1979). A million or so correlation coefficients, three experiments on the modifiable areal unit problem. Stat. Appl. Spatial Sci. 1979, 127–144.
Pebesma, E. (2018). Simple features for R: Standardized support for spatial vector data. R. J. 10, 439. doi:10.32614/rj-2018-009
Phillips, S. J., and Dudík, M. (2008). Modeling of species distributions with maxent: New extensions and a comprehensive evaluation. Ecography 31 (2), 161–175. doi:10.1111/j.0906-7590.2007.5203.x
Phillips, S. J., Anderson, R. P., and Schapire, R. E. (2006). Maximum entropy modeling of species geographic distributions. Ecol. Modell. 190 (3-4), 231–259. doi:10.1016/j.ecolmodel.2005.03.026
Pialoux, G., Gaüzère, B. A., Jauréguiberry, S., and Strobel, M. (2007). Chikungunya, an epidemic arbovirosis. Lancet Infect. Dis. 7 (5), 319–327. doi:10.1016/s1473-3099(07)70107-x
R Core Team (2021). R: A language and environment for statistical computing. Available at: https://www.R-project.org/.
Radosavljevic, A., and Anderson, R. P. (2014). Making better maxent models of species distributions: Complexity, overfitting and evaluation. J. Biogeogr. 41 (4), 629–643. doi:10.1111/jbi.12227
Richards, C. S., Nielsen, L. T., and Rees, D. M. (1956). Mosquito records from the great basin and the drainage of the lower Colorado river. Mosq. News 16, 10–17.
Schmidli, R.J. (1996). Climate of Phoenix, Arizona. U.S. Department of Commerce, National Oceanic and Atmospheric Administration, National Weather Service.
Secretaría de Salud, E. U. M. (2018). Boletín epidemiólogico, sistema nacional de vigilancia epidemiológica sistema único de información, semana 52. Available at: https://www.gob.mx/cms/uploads/attachment/file/425972/sem52.pdf.
Secretaría de Salud, E. U. M. (2019). Panorama epidemiólogico de dengue. Available at: https://www.gob.mx/cms/uploads/attachment/file/524262/Pano_dengue_52_2019.pdf.
United States Department of Transportation 2022. Bureau of transportation statistics border crossing/entry data. Available at: https://www.bts.gov/browse-statistical-products-and-data/border-crossing-data/border-crossingentry-data [Accessed January 26, 2022].
Uribe, L. J. (1983). The problems of Aedes aegypti control in the Americas. Bull. Pan Am. Health Organ. 17 (2), 133–141.
US Census Bureau (2021). TIGER/Line with selected demographic and economic data. Available at: https://www.census.gov/geographies/mapping-files/time-series/geo/tiger-data.html.
Vandermeer, J. H. (1972). Niche theory. Annu. Rev. Ecol. Syst. 3, 107–132. doi:10.1146/annurev.es.03.110172.000543
VanDerWal, J., Falconi, L., Januchowski, S., Shoo, L., and Storlie, C. (2019). SDMTools: Species distribution modelling tools: Tools for processing data associated with species distribution modelling exercises. Availabe at: https://CRAN.R-project.org/package=SDMTools.
Wilke, A. B. B., Benelli, G., and Beier, J. C. (2020). Beyond frontiers: On invasive alien mosquito species in America and Europe. PLoS Negl. Trop. Dis. 14, e0007864. doi:10.1371/journal.pntd.0007864
Wong, D. W. S. (2004). “The modifiable areal unit problem (MAUP),” in WorldMinds: Geographical perspectives on 100 problems: Commemorating the 100th anniversary of the association of American geographers 1904–2004. Editors D. G. Janelle, B. Warf, and K. Hansen (Charm: Springer Science & Business Media), 571–575.
Keywords: mosquito, vector, desert, distribution, vegetation, moisture, socioeconomic, Maxent
Citation: Holeva-Eklund WM, Young SJ, Will J, Busser N, Townsend J and Hepp CM (2022) Species distribution modeling of Aedes aegypti in Maricopa County, Arizona from 2014 to 2020. Front. Environ. Sci. 10:1001190. doi: 10.3389/fenvs.2022.1001190
Received: 23 July 2022; Accepted: 11 October 2022;
Published: 24 October 2022.
Edited by:
Yizi Shang, China Institute of Water Resources and Hydropower Research, ChinaReviewed by:
Roxanne Connelly, Centers for Disease Control and Prevention, United StatesCopyright © 2022 Holeva-Eklund, Young, Will, Busser, Townsend and Hepp. This is an open-access article distributed under the terms of the Creative Commons Attribution License (CC BY). The use, distribution or reproduction in other forums is permitted, provided the original author(s) and the copyright owner(s) are credited and that the original publication in this journal is cited, in accordance with accepted academic practice. No use, distribution or reproduction is permitted which does not comply with these terms.
*Correspondence: Whitney M. Holeva-Eklund,d2hpdG5leS5ob2xldmFAbmF1LmVkdQ==
Disclaimer: All claims expressed in this article are solely those of the authors and do not necessarily represent those of their affiliated organizations, or those of the publisher, the editors and the reviewers. Any product that may be evaluated in this article or claim that may be made by its manufacturer is not guaranteed or endorsed by the publisher.
Research integrity at Frontiers
Learn more about the work of our research integrity team to safeguard the quality of each article we publish.