 Shazia Rehman1,2,3
 Erum Rehman
 Ayesha Mumtaz
 Zhang Jianglin
- 1Department of Dermatology, Shenzhen People’s Hospital, The Second Clinical Medical College, Jinan University, The First Affiliated Hospital, Southern University of Science and Technology, Shenzhen, China
- 2Candidate Branch of National Clinical Research Center for Skin Diseases, Shenzhen, China
- 3Department of Biomedical Sciences, Pak-Austria Fachhochschule, Institute of Applied Sciences and Technology, Haripur, Pakistan
- 4School of Economics, Shandong University of Finance and Economics, Jinan, China
- 5College of Public Administration, Zhejiang University, Hangzhou, China
Environmental degradation has been identified as a major worldwide concern in recent decades, with CO2 emissions considered as one of the primary drivers of this catastrophe. This study creatively analyzes the underlying impact of wind and solar energy generation, economic development, fossil fuel consumption on CO2 emissions to mitigate the environmental degradation in the world’s top three largest energy consumers and CO2 emitters nations namely, China, India, and the USA. To investigate the integrated impact of CO2 emission, a grey relational analysis (GRA) technique is adopted for the year 1990–2017. The Grey technique for order of preference by similarity to ideal solution (G-TOPSIS) technique was employed for further optimization by prioritizing the explanatory factors that have potential influence on CO2 emissions in the selected nations. The outcomes through the GRA technique discovered that India is a major contributor of carbon emission caused by economic development, and China appeared to be the more afflicted nation for raising its carbon emissions owing to fossil fuel consumption. Whereas, the generation of solar and wind energy are grounded factors in the reduction of carbon emissions for China and the USA. In addition, the generation of wind energy showed a considerable impact in the reduction of CO2 emissions, based on the G-TOPSIS analysis. This suggests that reducing CO2 emissions would require a compendious transition from nonrenewable to renewable resources, while the United States and China appear to be on a more promising direction to environmental sustainability than India. As a growing renewable energy pioneer, India should increase the utilization of minimal carbon sources of energy in its electricity grid while limiting its reliance on fossil fuels. The findings of the study potentially aid governments and policymakers in making better decisions and investments to mitigate CO2 emissions while fostering a more environmentally friendly atmosphere.
Introduction
Fossil fuel combustion is widely regarded as a major contributor to climate change and global warming because carbon dioxide is emitted directly into the atmosphere, which causes global warming (IPCC Working Group et al., 2013). And this is a growing source of concern. While the atmospheric concentrations of carbon dioxide peaked in 2016, it was revealed that 2015, 2016, and 2017 were the three hottest years in human history (Yang et al., 2020). A growing percentage of these Greenhouse Gas (GHG) emissions now comes from emerging nations, necessitating the implementation of immediate energy regulatory measures (Liu et al., 2019). Likewise, low-carbon energy sources have sparked the interest of academics, enterprises, and industries throughout the world, with experts predicting that renewables will be the driving force behind long-term growth (Charfeddine and Kahia, 2019; Chien et al., 2021). Electricity generation is a major source of greenhouse gas emissions, which explains why this is the case (Pfeiffer and Mulder, 2013). As a result, renewable energy based on electricity would continue to expand primarily through solar, wind, biomass, hydro and geothermal, etc. (Xia and Wang, 2020). The Renewable Global Status Report has compiled a list of the world’s top renewable energy investor economies (REN21, 2020). As a result, India, China, and the United States are among the world’s leading renewable energy developers. China, India, and other emerging nations are deliberately embracing renewable energy technologies from developed countries, which is far from a coincidence. For three contradictory reasons, this study focuses on China, India, and the United States. They are the world’s largest coal consumers, the world’s top Greenhouse gas emitters, and the three potential leaders in renewable energy. In contrast, the upsurge of such economies is causing observable changes in the global economic system, necessitating more detailed analyses (Dechezleprêtre et al., 2011; Khattak et al., 2020; Ahmad M et al., 2020). Consequently, it appears to be true especially for India and China, who share important and unresolved socioeconomic traits that threaten US supremacy. According to the BRICS paradigm, India and China together accounts for 36% of the global population in 2019 due to massive infrastructural development and growing per capita income (Zakarya et al., 2015; Davis et al., 2018). To begin, India, China, and the United States are the world’s top three black coal producers with 765 million tons, 3,683 million tons, and 685 million tons of coal in 2018 respectively (BSPR, 2018). Such economies continue to rely heavily on fossil fuels for energy for generating electricity, their energy decisions have a significant impact on global GHG emissions (Mahmoodi, 2017; Farhani et al., 2014; Khan et al., 2021). In 2017, coal accounted for 71% (India), 74% (China), and 30% (the USA) of the total energy generation, respectively (IEA, 2019a). In regards to the United States, we must recognize that coal-based electricity production has decreased in recent times, despite remaining relatively high (IEA, 2020). China and India, as the world’s two largest rising economies, have seen significant economic development in the recent decade. Yet, this growth has indeed been associated with a substantial boost in their power consumption particularly power-based coal for industries, clearly making India and China, respectively, the world’s top and fourth-biggest coal consumers (Sridhar, 2018; Fareed et al., 2020). As a result, unless substantial changes are made, emissions from India, China, and the United States are projected to continue to cause global warming, despite the fact that other parts of the globe are alarmed about the issue (Nathaniel and Iheonu, 2019; Rehman et al., 2019).
Second, being the world’s largest emitters of air pollution, these three nations are important determinants of environmental change accounting for 29.3 percent (China), 13.7 percent (the USA), and 6.6 percent (India) of global carbon emissions in the year 2017. As a result, extensive environmental initiatives implemented in all of these three nations are likely to be highly effective (Wu et al., 2019; Shahbaz et al., 2020). This emission from fossil combustion in China have increased at an exponential rate, about 789 million tonnes of CO2 in 1971 to 9,257 Mt/CO2 in 2017. Likewise, in the United States, this metric increased from 4,289 Mt/CO2 to 4,761 MtCO2 during the same period. Finally, between 1971 and 2017, this was magnified 10 times in India, from 181 to 2,161 Mt/CO2 (Sinha and Shahbaz, 2018; IEA, 2019b). Nonetheless, they are projected to significantly lessen their ecological influence in the future, despite their continued reliance on fossil fuels, these nations burned over 45 percent of global fuels in the year 2016 (Xia and Wang, 2020; Anser et al., 2020; Murshed, 2021). In spite of the Trump administration’s withdrawal from the Paris Accord, several American states have proceeded to undertake green (Hildreth and Anderson, 2018). At the 2015 Paris Climate Change Conference, India and China, as members of the BRICS nations, confirmed their abatement objectives (Fareed et al., 2016; Haseeb et al., 2018). In actuality, they agreed to reduce intensity of GHG emissions by approximately 43–60% in 2030 (Bogner et al., 2008). Thirdly, these economies have moved to the top 3 worldwide competitors in installed renewable power generation and energy generation (especially wind, solar photovoltaic, and hydropower), according to the (IEA, 2018). Furthermore, by 2022, these nations will add up to two-thirds of worldwide renewable growth. This is not unexpected, given that increasing the percentage of clean energy technologies in the energy supply has been proven to be an effective strategy for reducing pollution while also generating large economic advantages (Rehman et al., 2020). Following President Xi Jinping’s push for an “energy revolution,” China’s electrical industry has experienced significant changes. Between 2000 and 2018, China’s renewable energy generation increased sevenfold: from 21,770 to 169,510 thousand tons of oil equivalent (ktoe). Looking at disaggregated figures, the wind has grown exponentially from 615–295,023 GWh in energy generation. Likewise, solar photovoltaic capacity has increased significantly since 2000, rising from 22 GWh in 2000 to 130,658 GWh in 2018. This is a pattern that is likely to prevail. China, as the world’s largest renewable energy investor, will contribute 40% of global capacity increase by 2024 (Xu et al., 2020). In the United States, the energy policy environment has radically shifted during the last decade. Due to the rise of natural gas-powered generators, coal-based electricity output has plummeted. Over the period 2000–2018, the percentage of renewable energy in electricity generation climbed from 8 to 17% (IPCC, 2019). Wind and solar PV have seen the most growth at the disaggregated energy level. In the case of India, the nation is coping with a surge in energy consumption, which is being driven by the country’s significant population expansion (∼1.36 billion people in 2019) and its rapidly expanding economy. To improve access to electricity for everyone, the government has been working hard for 2 decades to incorporate a major percentage of renewable sources of energy into the national power network (Vidyarthi and Mishra, 2020; Li et al., 2021). Renewable energy generation (wind, solar, and hydro) increased from 6,583 (ktoe) in 2000 to 19,662 (ktoe) in 2017. Moreover, in 2000, wind and solar photovoltaic generated 1,684 GWh and 2 GWh, respectively. India ranked sixth in the world in terms of solar photovoltaic capacity in 2018 (International Renewable Energy Agency, 2019). Due to support from the national and state government, solar photovoltaic production in India is predicted to exceed about
Consequently, this research is motivated by the need to analytically validate the influence of economic variables on environmental degradation as assessed by CO2 emissions for the top three biggest energy consumers and CO2 emitters nations of the world namely, China, India, and the USA. Annual data from 1990 to 2017 are used for study objectives. Our analysis contributes to the present literature in terms of both empirically and methodologically. Theocratically, it seeks to assess the degree of proximity (closeness) of the selected factors with CO2 emissions using an advanced mathematical grey relational analysis (GRA) model. Implementing the multicriteria decision-making (MCDM) approaches in this study will enable healthcare policymakers in making rational decisions on the best strategy to mitigate CO2 emissions in the selected countries by focusing on the worse factors.
The contribution of this article is mirrored in the following three aspects. First, the grey relational analysis (GRA) i.e., Deng GRA, absolute GRA, and second synthetic (SS-GRA) are employed to demonstrate that it outperforms traditional statistical models. Traditional statistical models simply evaluate the relationship between two data sequences; they do not offer the degree of closeness (proximity). As a result, it is an excellent contribution to the current literature because GRA has an advantage over conventional techniques in that it not only provides the relationship between explanatory and response variables but also the degree of proximity (closeness). More extensively, the Deng GRA model explores the partial proximity of two data sequences, whereas A-GRA shows the integral proximity. While the SS-GRA approach incorporates the benefits of both Deng and absolute GRA models and illustrates inclusive proximity. Also, it provides a weighting scheme and ranking criteria, which is quite useful when several variables are included in the research with equal worth. Consideration of endogeneity concerns in the acquisition of carbon emission-related variables is the main contribution to this type of study. Secondly, a grey-based Technique for Order of Preference by Similarity to Ideal Solution (G-TOPSIS) has been deployed to identify the key influencing factor that intensifies the carbon emissions in the selected regions. The visual abstract of the study is presented in Figure 1.
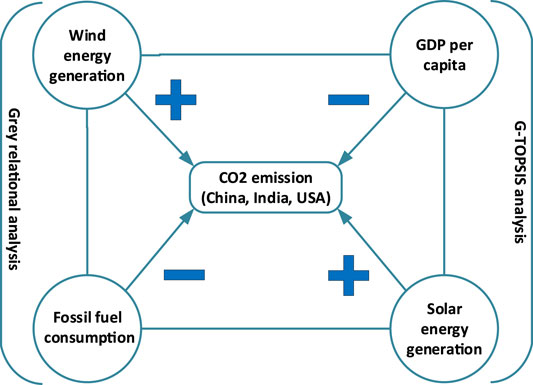
FIGURE 1. The visual abstract.
Materials and Methods
Data Source
Solar energy generation, wind energy generation, economic growth (in terms of GDP), consumption of fossil fuel, and environmental pollution (CO2). The time period was determined by the availability of wind and solar data for each country, which covered different periods. This is because wind and solar development strategies in all three countries (India, China, and the United States) did not begin at the same time. As a result, we kept the dataset span consistent across all nations, i.e., 1990–2017. GDP data is accessed from the World Development Indicators (WDI) and is given in constant LCU (World Developement Indicator, 2019). Carbon emissions (CO2) from fuel-burning are used as an indicator for pollution in the environment. Pollution figures are presented in thousand tonnes and are based on the International Energy Agency’s (IEA) CO2 Emissions from Fuel Combustion Statistics (2019) (IEA, 2019a). In terms of energy variables, we employ fossil fuel consumption as well as wind and solar energy generation (thousands of tonnes of oil equivalent (ktoe)). Both sets of energy statistics are obtained via the IEA World Energy Statistics and Balances database (2019) (IEA, 2019b). The description of all the selected study variables is summarized in Table 1.
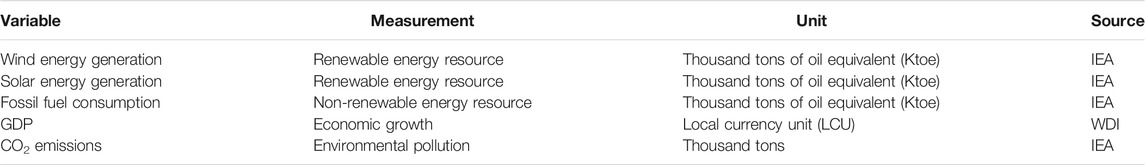
TABLE 1. Description of the study variables.
Grey System Theory
GRA methods are one of the core area subjects of the grey system theory (GST), introduced by Deng Julong, a Chinese scholar, in 1982 (Ng, 1994) to manage dubious systems with limited input. GST belongs to the category of uncertainty theories, that also incorporates rough set theory, fuzzy theory, interval theory, and other related theories. Additionally, GST, as led by its methodology, addresses the vulnerability in a manner distinct from previous vulnerability suppositions. The grey framework categorizes the world’s systems into three different groups which are white, black, and grey. If there is no information provided it refers to black data. Whereas, if complete information is accessible, it is described as white data or structure. Thusly, a GS turns into a framework that is partially known and rather cryptic (Kalyon et al., 2018; Liu, 2018; Sun et al., 2020). The grey theory and related models are well-known for their potential to predict and develop choices based on smaller sample sizes, poor and inadequate data. The GRA models attempt to grasp unclear correlations between GST features. The implications of GST have been applied so far in various field successfully (Sallehuddin et al., 2008; Kalyon et al., 2018; Rehman et al., 2021b; Rehman E et al., 2021). The general concept behind GRA is the degree/intensity of proximity or closeness of the geometrical framework of the data series suggests that the structured parameters might be implemented to predict the proximity of a link among the system variables. This proximity is known as correlation in the literature. D-GRA, A-GRA, and SS-GRA are the three components of the GRA model. In essence, the D-GRA model assesses the effect of one variable reflected by a data series on the other. Whereas, the absolute GRA model evaluates the relationship between the two. Moreover, the second synthetic GRA model estimates an overall degree of the relationship among the parameters under consideration. A comprehensive review of GRA models can be found in the work of Liu Sifeng (Liu et al., 2017). The algorithms involved with the grey methods are explained in the following sections.
Grey Relational Decision Analyses
Deng’s GRA model was employed to measure the partial closeness (a measure of influence) of the selected variables, whereas the absolute GRA model was used to evaluate the integral closeness (degree of correlation) of the selected variables. The second synthetic GRA model was performed to obtain an overall estimate (weight) of inclusive proximity by accompanying the methods outlined in (Javed and Liu, 2018). The diagrammatic framework of the grey methodology is shown in Figure 2. The algorithms involved with the grey methods are explained in the following sections.
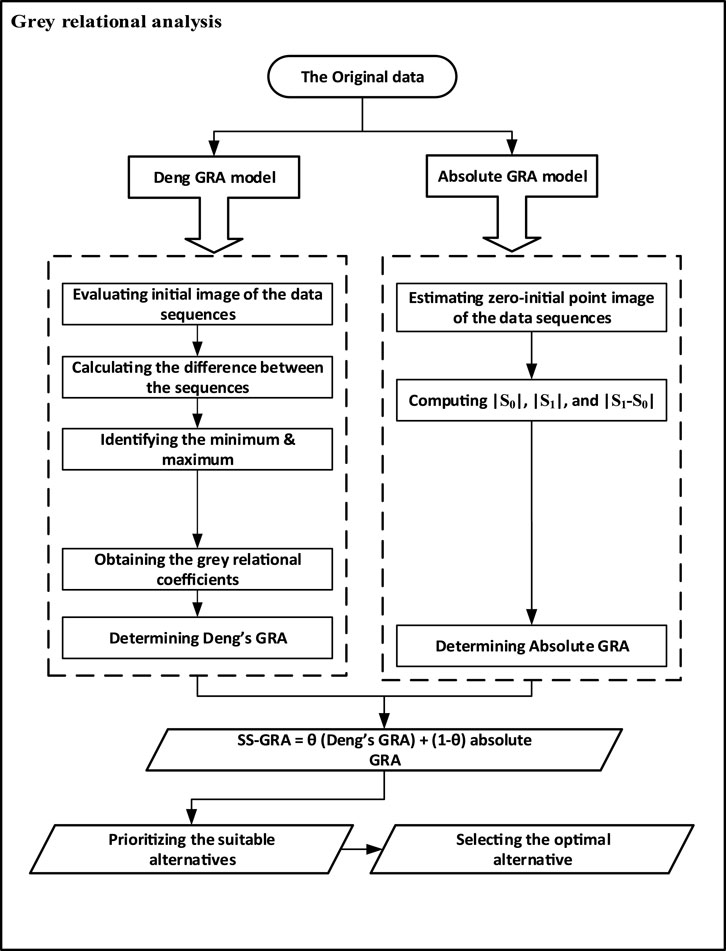
FIGURE 2. Framework for the proposed grey methodology.
Deng’s GRA Model
Let
Where,
Here,
Absolute GRA Model
Let
where,
Second Synthetic GRA Model
The second synthetic GRA model is an approach to estimate SS-GRA and can be acquired by utilizing the accompanying equation.
where
Grey Numbers
A grey number represents an interim with unspecified information but a well-defined range of possibilities which is depicted by a sign
Description 1: If
Description 2: If
Description 3: If
Let
The length of the grey number
If there are two Grey numbers
Grey TOPSIS Method
Huang and Yun proposed the TOPSIS idea in 1981, in which “n” alternatives are evaluated using “m” number of criteria. The TOPSIS method’s main goal is to find +ve and −ve ideal solutions (variants) to a situation that have the greatest relative proximity to the pattern (+ve) and the least relative proximity to the anti-pattern (−ve). The +ve ideal solution portrays the raise in the response variable, while, the −ve ideal solution portrays the decline in the response variable. Since data is not always precise in reality, the GT is employed to account for ambiguities. As new techniques emerge, the TOPSIS method continues to evolve. We employed this approach in conjunction with grey numbers from grey system theory in the current investigation (GST). This technique is solved using the steps listed below (Ren et al., 2007; Tabor, 2019).
Stage-1: Initially, grey numbers with the accompanying values are assigned to verbal judgments of criteria significance by the decision makers: highly insignificant [0.0, 0.2], insignificant [0.2, 0.4], moderately significant [0.4, 0.6], significant [0.6, 0.8], highly significant [0.8, 1.0] (Mahmoudi et al., 2019).
Stage-2: We use the arithmetic mean technique to aggregate the results after determining the level of significance of the decision-making criteria (h) by assuming the number of decision-makers as p:
Stage-3: To establish the state of each of the criteria, the linguistic variables ought to be employed. The score of alternative k in the criteria h is determined by the accompanying relation, presuming that the frequency of decision-makers is p:
where;
Stage-4: In the fourth stage, constructing the grey decision matrix in the following structure:
Stage-5: Established the normalized grey decision matrix in the accompanying structure:
If the variable attribute is beneficial, the normalization equation is as follows:
And, on the off chance that the variable attribute is non-beneficial, the data is normalized using the accompanying equation.
The grey matrix’s range will remain within
Stage-6: Assemble the weighted normalized grey decision-making matrix in the accompanying structure:
Stage-7: Determine the ideal solution based on the assumption that given the set of “n” prospective alternatives
where,
Stage-8: Determine the anti-ideal solution based on the assumption that given the set of “n” prospective alternatives
where,
Stage-9: Estimate the distances between the alternatives under consideration, as well as the ideal (
where,
Stage10: Create a synthetic assessment metric for variations
The closer the value of the measure is to one, the minimal the interval of the assessment of the variant away from the ideal solution
Stage-11: Then, in decreasing order, generate a rating for “n” alternatives based on linear streaming synthetic assessment metrics. The alternative with the lowest degree of grey synthetic evaluation will end up contributing more adversely to the response variable, whereas, alternative with the highest degree of grey synthetic evaluation will end up contributing positively to the response variable. The diagrammatic view of the G-TOPSIS methodology is presented in Figure 3.
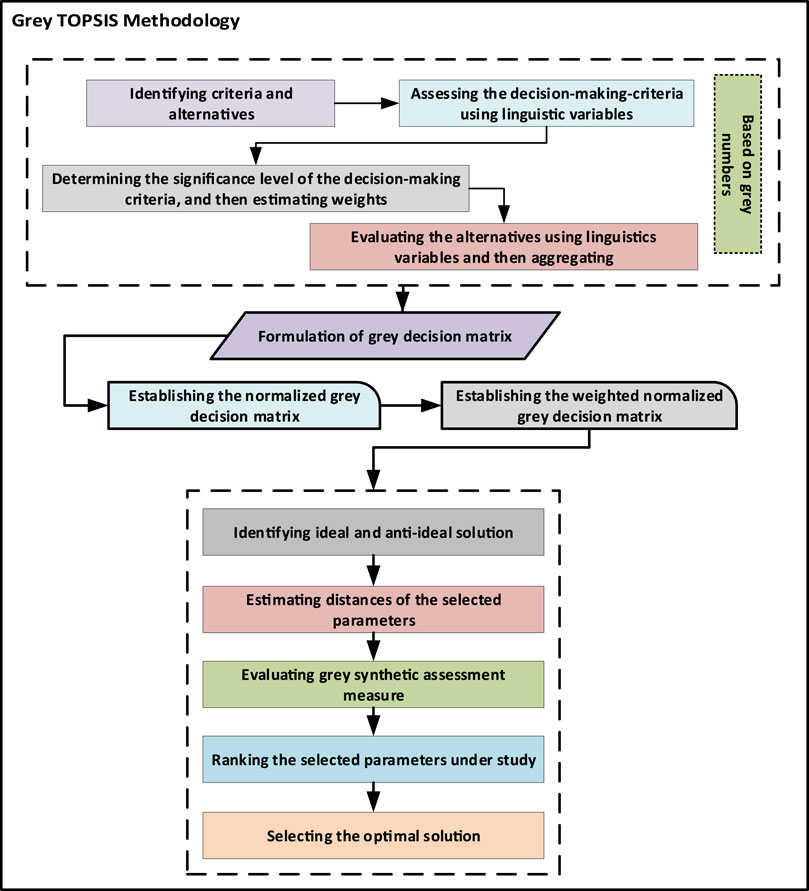
FIGURE 3. The framework of proposed grey-based TOPSIS.
Results
The present research utilized grey relational techniques to estimate the degree of proximity between solar energy generation, wind energy generation, economic growth, fossil fuels consumption, and carbon (CO2) emissions among China, India, and the USA for the years 1990–2017. Table 2–5 demonstrates the findings of the grey relational models, namely, the Deng GRA, absolute GRA, and the SSGRA for CO2 emissions for each selected variable. The absolute GRA and the SS-GRA models have values ranging from [0, 1]. Whereas, Deng GRA has values in the range of [0.5–1]. If it is close to 1, it is regarded as potentially associated and if diverges from 1, considered to be weak. While, Figures 4–7 show a graphical representation of the proximity between the studied variables based on GRA findings.

TABLE 2. Grey relational assessment for wind energy generation and CO2 emission.

TABLE 3. Grey relational assessment for GDP per capita and CO2 emission.

TABLE 4. Grey relational assessment for fossil fuel consumption and CO2 emission.

TABLE 5. Grey relational assessment for solar energy generation and CO2 emission.
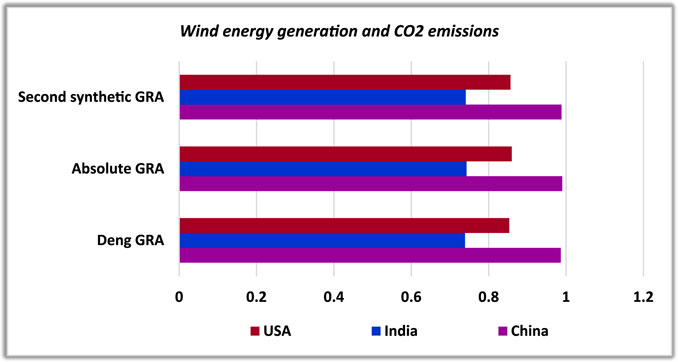
FIGURE 4. Grey relational assessment between wind energy generation and CO2 emissions.
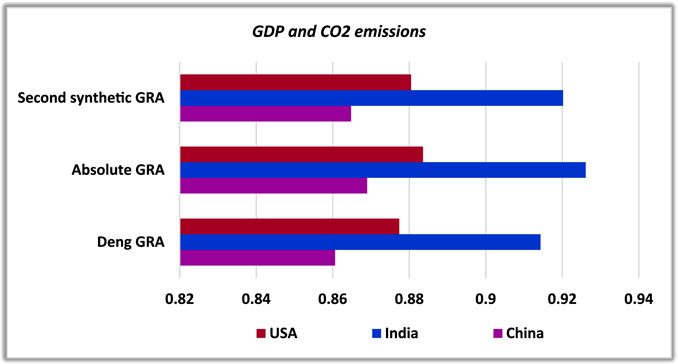
FIGURE 5. Grey relational assessments between GDP per capita and CO2 emissions.

FIGURE 6. Grey relational assessment between fossil fuel consumption and CO2 emissions.
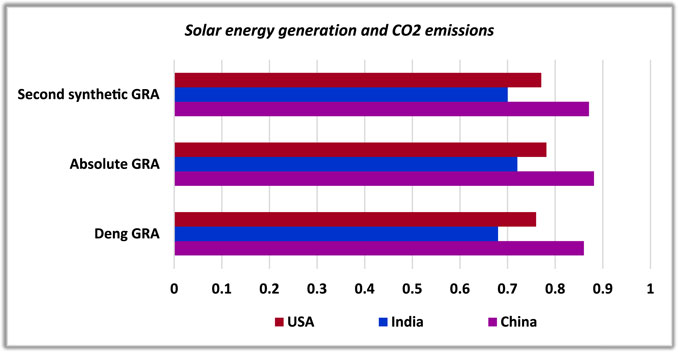
FIGURE 7. Grey relational assessment between solar energy generation and CO2 emissions.
Wind energy generation: In the present analysis, as indicated by Deng GRA model findings (Table 2), a more grounded measure of influence (partial proximity) between wind energy generation and carbon emission (0.9865:1st) is observed in China whereas, a most fragile connection (integral proximity) is seen for India (0.7388:3rd). The higher measure of the influence of wind energy generation on CO2 emission portrays that the factors are unequivocally interconnected with one another. Then again, the same succession showed up from the findings of the absolute GRA model. The degree of inclusive proximity (strength of association) is found much higher for China with an estimated weight of 0.9903. At a more aggregate level, as per SS-GRA findings, wind energy generation is distinguished as the major contributor in reducing carbon emission when compared with solar energy generation in China. After China, the USA appeared to be more influenced by wind energy generation in mitigating carbon emission with an estimated grey degree of 0.8565.
GDP per capita: Considering the impact of economic development on CO2 emission, all selected nations sustained their ranking order across all grey incidence models; however, the degree of proximity (closeness) was determined to be greater for India. As per Deng GRA estimates, carbon emission tends to be more strongly influenced by economic growth in India (0.9143) when compared with China (0.8606) and the USA (0.8774). Nonetheless, as per absolute GRA model findings, the measure of association is observed much higher in India with a grey degree of 0.9261 due to economic growth. Overall, the degree of proximity between CO2 emission and GDP per capita was observed exceptionally high in India trailed by the USA and China with an estimated weight of 0.9202, 0.8805, and 0.8648 respectively. Broadly speaking, GDP per capita had all the earmarks of being a potential factor in raising CO2 emission in India when compared with the USA and China (Table 3).
Fossil fuel consumption: China is distinguished as the most grounded contributor of carbon emission among the selected countries due to fossil fuel consumption with an estimated weight of 0.9592, though the least influence is seen with the USA (0.8765) under Deng GRA model results. In addition, the degree of integral closeness for China (0.9634) is found exceptionally high as compared to the USA (0.8811) and India (0.9140) for absolute GRA findings. Notably, with the SS-GRA model, China (0.9613) kept up with its position and ranked first among all selected nations, portraying that fossil fuel consumption is profoundly persuasive in raising carbon emission, trailed by India (0.9080) and the USA (0.8788) (Table 4).
Solar energy generation: According to GRA findings (Table 5), China (Deng GRA:0.8603, absolute GRA:0.8815, SS-GRA:0.8709, rank:1st) has the high proximity between solar energy generation and CO2 emission trailed by USA (Deng GRA:0.7599, absolute GRA:0.7815, SS-GRA:0.7707), whereas the weakest proximity is observed for India (Deng GRA:0.6800, absolute GRA:0.7206, SSDGIA:0.62450, rank:3rd), and all countries sustained their position under all grey incidence models. Altogether, the estimates from the SS-GRA model uncover that among all three countries, China appears to be the main country where solar energy generation is observed highly linked with CO2 emission. The findings show that solar energy generation is contributing to reducing carbon emissions in China when compared to India and the USA.
The GRA findings are depicted graphically in Figure 8 in descending order. The graph depicts a ranking sequence of the studied nations based on each explanatory variable separately. The weights calculated by GRA models (shown in Tables 2–5) are used to establish a ranking pattern.
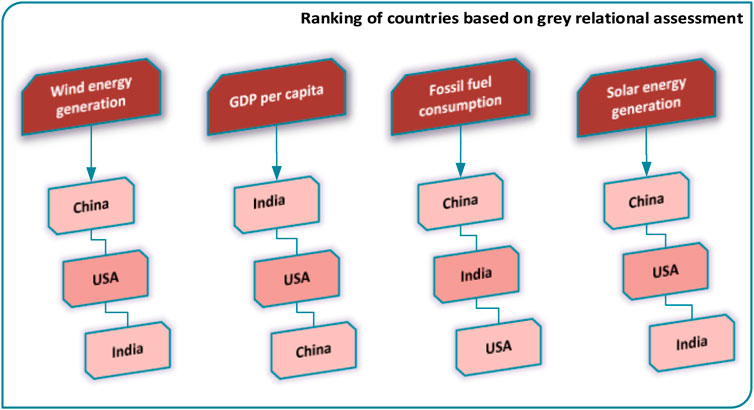
FIGURE 8. Ranking sequences of selected nations based on GRA modeling.
G-TOPSIS Analysis
For this subsection, we implemented G-TOPSIS to measure and provide a ranking order to the intensity of the explanatory variables (wind energy generation, GDP per capita, fossil fuel consumption, solar energy generation) on carbon emission for all the selected countries. Based on expert opinion, we first constructed an initial grey decision matrix for all studied explanatory variables using Eqs 20, 21. We transformed the decision matrix into grey numbers through linguistic variables and we then built a standardized grey decision matrix against each of the explanatory factors across all countries, independently (using Eq. 22). After evaluating the weights for each criterion (countries), we then built a weighted normalized grey decision matrix using equation using Eqs 24, 25. Next, we determined the patterns for the ideal and anti-ideal solutions using Eqs 27, 28. All these findings are summarized in Table 6.
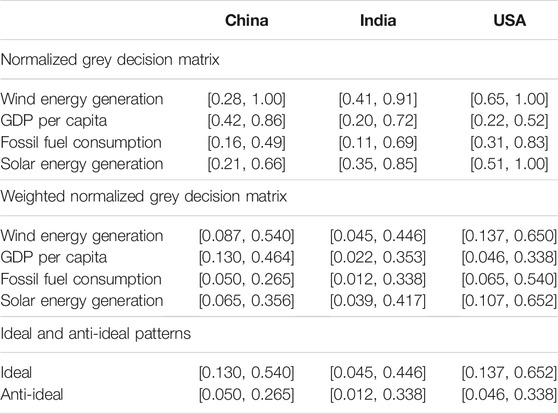
TABLE 6. Formation of a grey decision matrix to identify the potential factor.
Using Eq. 29, we computed distances of the alternatives (wind energy generation, GDP per capita, fossil fuel consumption, solar energy generation) from ideal and anti-ideal patterns against each criterion (countries) and results are presented in Table 7.
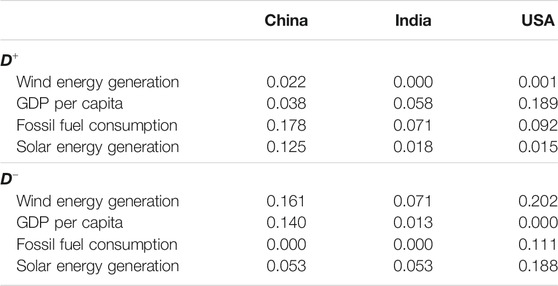
TABLE 7. Estimated distances from the ideal and anti-ideal pattern.
Based upon distances calculated in Table 7, we established grey synthetic assessment measures of the factors (wind energy generation, GDP per capita, fossil fuel consumption, solar energy generation) for carbon emissions in the selected countries and then created a ranking pattern in descending order which can be seen in Table 8. The graphical representation of grey based TOPSIS assessment can be seen in Figure 9.
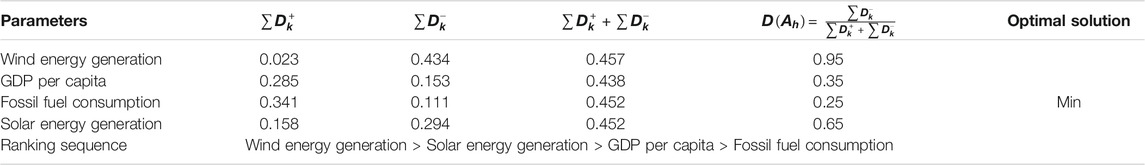
TABLE 8. Estimated grey degree of synthetic assessment.
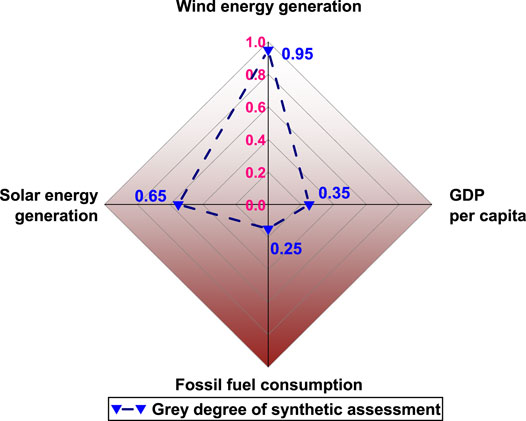
FIGURE 9. The G-TOPSIS assessment.
The variable with the least value of G-TOPSIS evaluation will contribute more negatively to the response variable which is carbon emissions, whereas the variable with the maximum value of G-TOPSIS evaluation will contribute more positively to the response variable. Therefore, it is reasonable to conclude that fossil fuel consumption (0.25) appeared as the worst factor in accelerating carbon emission in the selected countries followed by GDP per capita (0.35). Whereas, wind energy generation (0.95) contributes emphatically to reducing carbon emission in the selected countries led by solar energy generation (0.65).
Discussion and Conclusion
In terms of environmental degradation, the most important environmental challenge confronting the globe today is climate change, with over usage of conventional fossil fuels regarded as the root cause of the problem. According to this preliminary research, environmental improvement and economic growth are inconsistent since economic growth is achieved at the price of environmental degradation. As a result, environmentally acceptable techniques are required to meet the societal goals of regulating carbon emissions while allowing economic expansion to proceed. Adequate policies are those that provide incentives for enhancing efficiency and productivity or for deploying pollution-reduction technologies. Certain sustainable development theories contend that a lack of critical environmental protection rules and regulations accelerates the degradation process. Hence, the present study takes a step forward in evaluating the degree of proximity (closeness) between wind energy generation, GDP per capita, fossil fuel consumption, and solar energy generation with carbon emissions among the top three biggest energy consumers and CO2 emitters nations of the world (China, India, and the USA) utilizing time series data for the period 1990 to 2017. The research has been carried out using three grey relation models i.e., Deng GRA, absolute GRA, and second synthetic GRA models which may be implemented as a viable alternative to conventional data analysis approaches. According to GRA’s results, China and India appeared as the biggest emitter of CO2 emissions in terms of fossil fuel consumption and economic development, respectively. Whereas, in terms of renewable energy consumption, China ranked top among all selected nations, followed by USA and India. To manage such emissions that have negative effects on environmental degradation and economic development, China and India must put up several measures to restrict the utilization of fossil fuel consumption for their energy demand. While China’s energy use plays a vital role, its energy consumption needs to be sustained to minimize emissions and therefore, lessen environmental damage. The obvious low cost of conventional fossil resources and China’s fossil fuel-dominated energy endowments have provoked China to burn a considerable amount of coal. This scenario is not only hampering China’s low-carbon economy but can also impede the technological advancement of renewable energy (Wang et al., 2020; Xu and Lin, 2021). Technological innovation is a driving force in the advancement of renewable energy (Xin-gang and Wei, 2020). Despite recent significant advancement in China’s renewable energy technology, however, there is a synergic link between the emissions of CO2 and advancement level, demonstrating that massive carbon emissions have facilitated renewable energy technological innovation (Lei et al., 2021). Renewable energy development is critical to China’s energy safety and autonomy, and climate mitigation (Chen et al., 2019; Ahmad F et al., 2020; Godil et al., 2021).
In case of India, the present research discovered that when assessing the effect of GDP on carbon emissions among the selected nations, India came out on top, and under G-TOPSIS analysis, fossil fuel consumption appeared to be a strong influencing factor when compared to GDP. This implies that the use of fossil fuels is a greater risk factor for environmental degradation, while green energy generation, particularly wind energy generation, is more effective at mitigating the effects of carbon emissions. Our findings are consistent with previous studies that found a strong positive effect of renewable resources on environmental quality (Balsalobre-Lorente et al., 2018; Shahzad et al., 2021). Because of its fast-growing status, the Indian economy is heavily reliant on energy consumption. India requires more energy to achieve growing production demands and ensure long-term economic development (Ahmad et al., 2016; Sinha and Shahbaz, 2018; Fareed et al., 2018). Policymakers should take into account disaggregated sources of energy in order to establish a strategy for the best mix of energy sources to strengthen environmental quality without compromising economic growth. Pollution has a negative impact on public health. By identifying a substitute for fossil fuel emissions, the Indian government could perhaps attain its objective of optimum economic growth with minimal carbon emissions. According to the analysis, wind energy generation is more beneficial in terms of strengthening environmental quality since it emits fewer pollutants into the environment than other non-renewable resources.
On a broad level, this finding would emphasize the need for policymakers participating in the energy sector by harnessing clean energy resources to meet an increasing requirement for energy fluctuations by changes in economic output. It is clearly defined and depicted by the present analysis, that the fossil fuel explanatory variable is the principal driver of carbon emissions in China and India. However, we discovered that even green energy technology, especially wind and solar are trending towards a direction signalized by carbon emissions in India. Based on the study outcomes, policy suggestions can be offered. First, because fossil fuel utilization is a significant contributor to carbon dioxide emissions in all three economies, governments might have to reinforce sustainable energy subsidies with additional measures aimed at lowering power-based fossil fuel consumption. This may be accomplished, in particular, by strict fossil-based energy conservation regulations or additional energy-efficiency initiatives. Besides, despite increased expenditures in the wind and solar energy, these sources of energy (particularly wind) may become increasingly significant in the energy portfolio. However, nonrenewable fuels continue to dominate their respective proportions, and more regulations promoting low-carbon energy alternatives are recommended. Third, the government should supervise and assist businesses in their technological innovation efforts, as well as expand the volume of technology expenditures. The fact that CO2 emissions have a beneficial influence on technical innovation suggests that renewable technologies are proactively responding to changes in the climate. The policy implications suggest that we must recognize the significance of renewable energy technology innovation in carbon emissions mitigation, and monetary assistance is essential to increase the level of innovation. On the other hand, the significance of the energy pricing system in fostering technological innovation must be gradually rationalized. Technological innovation is critical in promoting the expansion of renewable energy.
The present investigation only includes the top three nations responsible for carbon dioxide emissions, which limits the scope of the investigation. For further research, it is advised that more nations and other economic variables influencing CO2 emissions to be investigated. Furthermore, it is vital to broaden the study by investigating the impact of COVID-19 on energy demand transitions. Evidence suggests that when industries closed, energy use reduced swiftly, but air traffic and public transportation usage decreased significantly. However, the use of surgical masks and their massive manufacture might have severely negative environmental consequences. As a result, we anticipate that the data’s expansion will address these concerns in depth.
Data Availability Statement
The data used to support the findings of this study are included within the article.
Author Contributions
All authors listed have made a substantial, direct, and intellectual contribution to the work and approved it for publication.
Funding
This work is supported by the Union Program of Science and Health of Hunan Province, China (2019JJ80011). The funder had no role in study design, data collection, and analysis, decision to publish, or preparation of the manuscript.
Conflict of Interest
The authors declare that the research was conducted in the absence of any commercial or financial relationships that could be construed as a potential conflict of interest.
Publisher’s Note
All claims expressed in this article are solely those of the authors and do not necessarily represent those of their affiliated organizations, or those of the publisher, the editors and the reviewers. Any product that may be evaluated in this article, or claim that may be made by its manufacturer, is not guaranteed or endorsed by the publisher.
References
Ahmad, A., Zhao, Y., Shahbaz, M., Bano, S., Zhang, Z., Wang, S., et al. (2016). Carbon Emissions, Energy Consumption and Economic Growth: An Aggregate and Disaggregate Analysis of the Indian Economy. Energy Policy 96, 131–143. doi:10.1016/j.enpol.2016.05.032
Ahmad F, F., Draz, M. U., Ozturk, I., Su, L., and Rauf, A. (2020). Looking for Asymmetries and Nonlinearities: the Nexus between Renewable Energy and Environmental Degradation in the Northwestern Provinces of China. J. Clean. Prod. 266, 121714. doi:10.1016/j.jclepro.2020.121714
Ahmad M, M., Khattak, S. I., Khan, A., and Rahman, Z. U. (2020). Innovation, Foreign Direct Investment (FDI), and the Energy-Pollution-Growth Nexus in OECD Region: a Simultaneous Equation Modeling Approach. Environ. Ecol. Stat. 27 (2), 203–232. doi:10.1007/s10651-020-00442-8
Anser, M. K., Hanif, I., Alharthi, M., and Chaudhry, I. S. (2020). Impact of Fossil Fuels, Renewable Energy Consumption and Industrial Growth on Carbon Emissions in Latin American and Caribbean Economies. Atm 33 (3), 201–213. doi:10.20937/ATM.52732
Balsalobre-Lorente, D., Shahbaz, M., Roubaud, D., and Farhani, S. (2018). How Economic Growth, Renewable Electricity and Natural Resources Contribute to CO2 Emissions? Energy Policy 113, 356–367. doi:10.1016/j.enpol.2017.10.050
Bogner, J., Pipatti, R., Hashimoto, S., Diaz, C., Mareckova, K., Diaz, L., et al. (2008). Mitigation of Global Greenhouse Gas Emissions from Waste: Conclusions and Strategies from the Intergovernmental Panel on Climate Change (IPCC) Fourth Assessment Report. Working Group III (Mitigation). Waste Manag. Res. 26 (1), 11–32. doi:10.1177/0734242X07088433
BSPR (2018). Retrieved November 14, 2021, from Statistical Review of World Energy 2012. Available at: https://www.google.com/search?q=British+Petroleum+Statistical+Review+of+World+Energy%3B+2009%2C+June.&rlz=1C1CHZL_enTH815TH815&oq=British+Petroleum+Statistical+Review+of+World+Energy%3B+2009%2C+June.&aqs=chrome.69i57.981j0j4&sourceid=chrome&ie=UTF-8 (Accessed November 14, 2021).
Charfeddine, L., and Kahia, M. (2019). Impact of Renewable Energy Consumption and Financial Development on CO2 Emissions and Economic Growth in the MENA Region: A Panel Vector Autoregressive (PVAR) Analysis. Renew. Energ. 139, 198–213. doi:10.1016/j.renene.2019.01.010
Chen, Y., Wang, Z., and Zhong, Z. (2019). CO2 Emissions, Economic Growth, Renewable and Non-renewable Energy Production and Foreign Trade in China. Renew. Energ. 131, 208–216. doi:10.1016/J.RENENE.2018.07.047
Chien, F., Ngo, Q.-T., Hsu, C.-C., Chau, K. Y., and Mohsin, M. (2021). Assessing the Capacity of Renewable Power Production for green Energy System: a Way Forward towards Zero Carbon Electrification. Environ. Sci. Pollut. Res. 28, 65960–65973. doi:10.1007/S11356-021-15517-7
Davis, S. J., Lewis, N. S., Shaner, M., Aggarwal, S., Arent, D., Azevedo, I. L., et al. (2018). Net-zero Emissions Energy Systems. Science 360 (6396), eaas9793. doi:10.1126/science.aas9793
Dechezleprêtre, A., Glachant, M., Haščič, I., Johnstone, N., and Ménière, Y. (2011). Invention and Transfer of Climate Change–Mitigation Technologies: a Global Analysis. Rev. Environ. Econ. Pol. 5 (1), 109–130.
Elavarasan, R. M., Shafiullah, G. M., Padmanaban, S., Kumar, N. M., Annam, A., Vetrichelvan, A. M., et al. (2020). A Comprehensive Review on Renewable Energy Development, Challenges, and Policies of Leading Indian States with an International Perspective. IEEE Access 8, 74432–74457. doi:10.1109/access.2020.2988011
Fareed, Z., Ali, Z., Shahzad, F., Nazir, M. I., and Ullah, A. (2016). Determinants of Profitability: Evidence from Power and Energy Sector. Stud. Univ. Babes-Bolyai 61 (3), 59–78. doi:10.1515/subboec-2016-0005
Fareed, Z., Meo, M. S., Zulfiqar, B., Shahzad, F., and Wang, N. (2018). Nexus of Tourism, Terrorism, and Economic Growth in Thailand: New Evidence from Asymmetric ARDL Cointegration Approach. Asia Pac. J. Tourism Res. 23 (12), 1129–1141. doi:10.1080/10941665.2018.1528289
Fareed, Z., Iqbal, N., Shahzad, F., Shah, S. G. M., Zulfiqar, B., Shahzad, K., et al. (2020). Co-variance Nexus between COVID-19 Mortality, Humidity, and Air Quality index in Wuhan, China: New Insights from Partial and Multiple Wavelet Coherence. Air Qual. Atmos. Health 13, 673–682. doi:10.1007/s11869-020-00847-1
Farhani, S., Chaibi, A., and Rault, C. (2014). CO2 Emissions, Output, Energy Consumption, And Trade In Tunisia. Economic Modelling 38, 426–434. doi:10.1016/j.econmod.2014.01.025
Godil, D. I., Yu, Z., Sharif, A., Usman, R., and Khan, S. A. R. (2021). Investigate the Role of Technology Innovation and Renewable Energy in Reducing Transport Sector CO2 Emission in China: A Path toward Sustainable Development. Sustain. Develop. 29, 694–707. doi:10.1002/sd.2167
Haseeb, A., Xia, E., DanishBaloch, M. A., Baloch, M. A., and Abbas, K. (2018). Financial Development, Globalization, and CO2 Emission in the Presence of EKC: Evidence from BRICS Countries. Environ. Sci. Pollut. Res. 25 (31), 31283–31296. doi:10.1007/S11356-018-3034-7
Hildreth, J. A. D., and Anderson, C. (2018). Does Loyalty Trump Honesty? Moral Judgments of Loyalty-Driven Deceit. J. Exp. Soc. Psychol. 79, 87–94. doi:10.1016/j.jesp.2018.06.001
IEA (2018). World Energy Outlook 2018. Available at: https://www.iea.org/reports/world-energy-outlook-2018 (Accessed November 14, 2021).
IEA (2019a). Global CO2 Emissions in 2019 Analysis - IEA. Available at: https://www.iea.org/articles/global-co2-emissions-in-2019 (Accessed November 14, 2021).
IEA (2020). International Energy Agency Paris, France: IEA. Available at: https://www.google.com/search?q=International+Energy+Agency+%28IEA%29%2C+2020&sxsrf=AOaemvLmLoxHgiu-mdgA-9q6XDh5YC4Kpw%3A1636900676109&ei=RB-RYbP-Bd6Ixc8PxbuRqAw&oq=International+Energy+Agency+%28IEA%29%2C+2020&gs_lcp=Cgdnd3Mtd2l6EAMyBAgjECcyBggAEBYQHjIGC(Accessed November 14, 2021).
INCCA (2010). The Indian Network for Climate Change Assessment. India: Ministry of Environment & Forests. doi:10.1002/joc.1920
International Renewable Energy Agency (2019). IRENA (2019), Global Energy Transformation: A Roadmap to 2050. Available at: https://www.irena.org/publications/2019/Apr/Global-energy-transformation-A-roadmap-to-2050-2019Edition (Accessed November 14, 2021).
IPCC Working Group Stocker, T. F., Qin, D., Plattner, G.-K., Tignor, M., Allen, S. K., et al. (2013). IPCC, 2013: Climate Change 2013: The Physical Science Basis. Contribution of Working Group I to the Fifth Assessment Report (AR5) of the Intergovernmental Panel on Climate Change (IPCC) Geneva, Switzerland: Meteorological Organization (WMO) and United Nations Environment Program (UNEP), 1535.
IPCC (2019). Climate Change and Land: An IPCC Special Report on Climate Change, Desertification, Land Degradation, Sustainable Land Management, Food Security, and Greenhouse Gas Fluxes in Terrestrial Ecosystems. Available at: https://www.ipcc.ch/srccl/ (Accessed November 14, 2021).
Javed, S. A., and Liu, S. (2018). Evaluation of Outpatient Satisfaction and Service Quality of Pakistani Healthcare Projects. GS 8 (4), 462–480. doi:10.1108/gs-04-2018-0018
Javed, S. A. (2019). A Novel Research on Grey Incidence Analysis Models and its Application in Project Management. Nanjing, PR China: Nanjing University of Aeronautics and Astronautics.
Kalyon, A., Günay, M., and Özyürek, D. (2018). Application of Grey Relational Analysis Based on Taguchi Method for Optimizing Machining Parameters in Hard Turning of High Chrome Cast Iron. Adv. Manuf. 6 (4), 419–429. doi:10.1007/s40436-018-0231-z
Karaeva, A., Magaril, E., and Rada, E. C. (2020). Improving the Approach to Efficiency Assessment of Investment Projects in the Energy Sector. WIT Trans. Ecol. Environ. 246, 113–123. doi:10.2495/epm200111
Khan, Z., Murshed, M., Dong, K., and Yang, S. (2021). The Roles of export Diversification and Composite Country Risks in Carbon Emissions Abatement: Evidence from the Signatories of the Regional Comprehensive Economic Partnership Agreement. Appl. Econ. 53, 4769–4787. doi:10.1080/00036846.2021.1907289
Khattak, S. I., Ahmad, M., Khan, Z. U., and Khan, A. (2020). Exploring the Impact of Innovation, Renewable Energy Consumption, and Income on CO2 Emissions: New Evidence from the BRICS Economies. Environ. Sci. Pollut. Res. 27 (12), 13866–13881. doi:10.1007/s11356-020-07876-4
Lei, W., Xie, Y., Hafeez, M., and Ullah, S. (2021). Assessing the Dynamic Linkage between Energy Efficiency, Renewable Energy Consumption, and CO2 Emissions in China. Environ. Sci. Pollut. Res., 1–13. doi:10.1007/s11356-021-17145-7
Li, M., Ahmad, M., Fareed, Z., Hassan, T., and Kirikkaleli, D. (2021). Role of Trade Openness, export Diversification, and Renewable Electricity Output in Realizing Carbon Neutrality Dream of China. J. Environ. Manage. 297, 113419. doi:10.1016/j.jenvman.2021.113419
Liu, S., Zhang, H., and Yang, Y. (2017). Explanation of Terms of Grey Incidence Analysis Models. Grey Syst. Theor. Appl. 7, 136. doi:10.1108/gs-11-2016-0045
Liu, D., Guo, X., and Xiao, B. (2019). What Causes Growth of Global Greenhouse Gas Emissions? Evidence from 40 Countries. Sci. Total Environ. 661, 750–766. doi:10.1016/j.scitotenv.2019.01.197
Mahmoodi, M. (2017). The Relationship between Economic Growth, Renewable Energy, and CO2emissions: Evidence from Panel Data Approach. Int. J. Energ. Econ. Pol. 7 (6), 96–102.
Mahmoudi, A., Javed, S. A., Zhang, Z., and Deng, X. (2019). “Grey Group QUALIFLEX Method: Application in Project Management,” in 2019 IEEE 14th International Conference on Intelligent Systems and Knowledge Engineering (ISKE) (IEEE), 189–195. doi:10.1109/iske47853.2019.9170357
Menyah, K., and Wolde-Rufael, Y. (2010). CO2 Emissions, Nuclear Energy, Renewable Energy and Economic Growth in the US. Energy Policy 38 (6), 2911–2915. doi:10.1016/j.enpol.2010.01.024
MoSPI (2013). Central Statistics Office. New Delhi: Ministry of Statistics and Programme Implementation Government of India.
Muniyoor, K. (2020). Is There a Trade-Off between Energy Consumption and Employment: Evidence from India. J. Clean. Prod. 255, 120262. doi:10.1016/j.jclepro.2020.120262
Murshed, M. (2021). Can Regional Trade Integration Facilitate Renewable Energy Transition to Ensure Energy Sustainability in South Asia? Energ. Rep. 7, 808–821. doi:10.1016/j.egyr.2021.01.038
Nathaniel, S. P., and Iheonu, C. O. (2019). Carbon Dioxide Abatement in Africa: The Role of Renewable and Non-renewable Energy Consumption. Sci. Total Environ. 679, 337–345. doi:10.1016/j.scitotenv.2019.05.011
Ng, D. K. W. (1994). Grey System and Grey Relational Model. SIGICE Bull. 20 (2), 2–9. doi:10.1145/190690.190691
Pfeiffer, B., and Mulder, P. (2013). Explaining the Diffusion of Renewable Energy Technology in Developing Countries. Energ. Econ. 40, 285–296. doi:10.1016/j.eneco.2013.07.005
Reddy, P., Gupta, M. V. N. S., Nundy, S., Karthick, A., and Ghosh, A. (2020). Status of BIPV and BAPV System for Less Energy-Hungry Building in India-A Review. Appl. Sci. 10 (7), 2337. doi:10.3390/app10072337
Rehman E, E., Ikram, M., Rehman, S., and Feng, M. T. (2021). Growing green? Sectoral-Based Prediction of GHG Emission in Pakistan: a Novel NDGM and Doubling Time Model Approach. Environ. Dev. Sustain. 23, 12169–12191. doi:10.1007/s10668-020-01163-5
Rehman, A., Rauf, A., Ahmad, M., Chandio, A. A., and Deyuan, Z. (2019). The Effect of Carbon Dioxide Emission and the Consumption of Electrical Energy, Fossil Fuel Energy, and Renewable Energy, on Economic Performance: Evidence from Pakistan. Environ. Sci. Pollut. Res. 26 (21), 21760–21773. doi:10.1007/s11356-019-05550-y
Rehman, E., Ikram, M., Feng, M. T., and Rehman, S. (2020). Sectoral-based CO2 Emissions of Pakistan: a Novel Grey Relation Analysis (GRA) Approach. Environ. Sci. Pollut. Res. 27 (23), 29118–29129. doi:10.1007/s11356-020-09237-7
Rehman, S., Rehman, E., Hussain, I., and Jianglin, Z. (2021a). Socioeconomic Influence on Cardiac Mortality in the South Asian Region: New Perspectives from Grey Modeling and G-TOPSIS. J. Healthc. Eng. 2021. doi:10.1155/2021/6866246
Rehman, S., Rehman, N., Naz, M., Mumtaz, A., and Jianglin, Z. (2021b). Application of Grey-Based SWARA and COPRAS Techniques in Disease Mortality Risk Assessment. J. Healthc. Eng. 2021 (1), 1–9. doi:10.1155/2021/7302157
Ren, L., Zhang, Y., Wang, Y., and Sun, Z. (2007). Comparative Analysis of a Novel M-TOPSIS Method and TOPSIS. Appl. Maths. Res. EXpress 2007. doi:10.1093/amrx/abm005
REN21 (2020). REN21 - Building the Sustainable Energy Future with Renewable Energy. Available at: https://www.ren21.net/%0Ahttps://www.ren21.net/?gclid=Cj0KCQjw28T8BRDbARIsAEOMBcyq3lnUBGwKHL0TQsPh6tWyE1JWCTtZssfg1tC7n0ue8-FHjC5CaNYaAoh_EALw_wcB%0Ahttps://www.ren21.net/ (Accessed November 14, 2021).
Sallehuddin, R., Shamsuddin, S. M. H., and Hashim, S. Z. M. (2008). “Application of Grey Relational Analysis for Multivariate Time Series,” in Proceedings-8th International Conference on Intelligent Systems Design and Applications, ISDA 2008, 432–437. doi:10.1109/ISDA.2008.181
Shahbaz, M., Raghutla, C., Song, M., Zameer, H., and Jiao, Z. (2020). Public-private Partnerships Investment in Energy as New Determinant of CO2 Emissions: the Role of Technological Innovations in China. Energ. Econ. 86, 104664. doi:10.1016/j.eneco.2020.104664
Shahzad, U., Fareed, Z., Shahzad, F., and Shahzad, K. (2021). Investigating the Nexus between Economic Complexity, Energy Consumption and Ecological Footprint for the United States: New Insights from Quantile Methods. J. Clean. Prod. 279, 123806. doi:10.1016/j.jclepro.2020.123806
Sinha, A., and Shahbaz, M. (2018). Estimation of Environmental Kuznets Curve for CO2 Emission: Role of Renewable Energy Generation in India. Renew. Energ. 119, 703–711. doi:10.1016/J.RENENE.2017.12.058
Sridhar, K. S. (2018). Urbanization and Carbon Emissions in India and China. Environ. Urbanization ASIA 9 (2), 113–126. doi:10.1177/0975425318783544
Sun, H., Yu, F., Xu, H., and Xia, H. (2020). A Case-Based Grey Relational Analysis Model for Multiple Criteria Classification of Thyroid Nodules. J. Grey Syst. 32 (4), 65–76.
Tabor, J. (2019). Using the Grey-TOPSIS Method to Assess the Functioning of the Occupational Risk Management. MATEC Web Conf. 290, 12027. doi:10.1051/matecconf/201929012027
Vidyarthi, H., and Mishra, R. K. (2020). Dynamics Among Banking Penetration, Transport Infrastructure, and Regional Growth: An Empirical Note from Indian States. IJEPEE 13 (1), 1–12. doi:10.1504/ijepee.2020.106682
Wang, M., and Feng, C. (2017). Understanding China′s Industrial CO2 Emissions: A Comprehensive Decomposition Framework. J. Clean. Prod. 166, 1335–1346. doi:10.1016/j.jclepro.2017.08.136
Wang, H., Wang, G., Qi, J., Schandl, H., Li, Y., Feng, C., et al. (2020). Scarcity-weighted Fossil Fuel Footprint of China at the Provincial Level. Appl. Energ. 258, 114081. doi:10.1016/j.apenergy.2019.114081
World Developement Indicator (2019). GDP (Current LCU) Washington DC, United States: World Bank and headquarters.
Wu, W., Ma, X., Zeng, B., Wang, Y., and Cai, W. (2019). Forecasting Short-Term Renewable Energy Consumption of China Using a Novel Fractional Nonlinear Grey Bernoulli Model. Renew. Energ. 140, 70–87. doi:10.1016/j.renene.2019.03.006
Xia, C., and Wang, Z. (2020). The Effect of Fossil Fuel and Hydropower on Carbon Dioxide Emissions: EKC Validation with Structural Breaks. J. Environ. Eng. Landscape Manage. 28 (1), 36–47. doi:10.3846/jeelm.2020.11832
Xin-gang, Z., and Wei, W. (2020). Driving Force for China′s Photovoltaic Industry Output Growth: Factor-Driven or Technological Innovation-Driven? J. Clean. Prod. 274, 122848. doi:10.1016/j.jclepro.2020.122848
Xu, B., and Lin, B. (2021). Investigating Spatial Variability of CO2 Emissions in Heavy Industry: Evidence from a Geographically Weighted Regression Model. Energy Policy 149, 112011. doi:10.1016/j.enpol.2020.112011
Xu, G., Schwarz, P., and Yang, H. (2020). Adjusting Energy Consumption Structure to Achieve China’s CO2 Emissions Peak. Renew. Sustain. Energ. Rev. 122, 109737. doi:10.1016/J.RSER.2020.109737
Yang, J., Cai, W., Ma, M., Li, L., Liu, C., Ma, X., et al. (2020). Driving Forces of China’s CO2 Emissions from Energy Consumption Based on Kaya-LMDI Methods. Sci. Total Environ. 711, 134569. doi:10.1016/J.SCITOTENV.2019.134569
Keywords: CO2 emissions, grey relational analysis, G-TOPSIS, fossil fuel consumption, GDP per capita, wind energy, solar energy
Citation: Rehman S, Rehman E, Mumtaz A and Jianglin Z (2022) A Multicriteria Decision-Making Approach in Exploring the Nexus Between Wind and Solar Energy Generation, Economic Development, Fossil Fuel Consumption, and CO2 Emissions. Front. Environ. Sci. 9:819384. doi: 10.3389/fenvs.2021.819384
Received: 21 November 2021; Accepted: 06 December 2021;
Published: 25 January 2022.
Edited by:
Gagan Deep Sharma, Guru Gobind Singh Indraprastha University, IndiaReviewed by:
Zeeshan Fareed, Huzhou University, ChinaDiogo Ferraz, Universidade Federal de Ouro Preto, Brazil
Copyright © 2022 Rehman, Rehman, Mumtaz and Jianglin. This is an open-access article distributed under the terms of the Creative Commons Attribution License (CC BY). The use, distribution or reproduction in other forums is permitted, provided the original author(s) and the copyright owner(s) are credited and that the original publication in this journal is cited, in accordance with accepted academic practice. No use, distribution or reproduction is permitted which does not comply with these terms.
*Correspondence: Zhang Jianglin, emhhbmcuamlhbmdsaW5Ac3pob3NwaXRhbC5jb20=