 Dan Zhu
 Xiefei Zhi1*
94% of researchers rate our articles as excellent or good
Learn more about the work of our research integrity team to safeguard the quality of each article we publish.
Find out more
ORIGINAL RESEARCH article
Front. Environ. Sci., 17 January 2022
Sec. Atmosphere and Climate
Volume 9 - 2021 | https://doi.org/10.3389/fenvs.2021.818402
This article is part of the Research TopicAir Pollution Remote Sensing and the Subsequent Interactions with Ecology on Regional ScalesView all 31 articles
Based on hourly gridded precipitation data (0.1°) calculated by the China Meteorological Administration (CMA), the European Centre Medium-Range Weather Forecasts (ECMWF) reanalysis data, and microwave measurements, this paper investigated the extreme precipitation induced by the Typhoon Maysak in Northeast China (September 2020), using the Advanced Research dynamic core of the Weather Research and Forecasting Model (WRF-ARW). The study focused on Changbai Mountain topography and the extreme precipitation in Jilin Province. The results show that two extreme precipitation centers corresponded well to the local terrain height in Jilin Province. The Changbai Mountain range, which mainly lies in southeastern Jilin Province, affected the typhoon in three aspects: blocking drag, forcing uplift, and promoting moisture convergence. Because of the blocking drag of the mountain topography, the duration of severe precipitation was prolonged. The overlap of the area affected by the peripheral cloud band of the typhoon and the direction of the typhoon was largely responsible for the extreme rainfall. The dynamic lifting by the mountainous terrain and the reinforced moisture convergence also considerably increased precipitation. Microwave measurements show that water vapor density profile increased rapidly at the peak (14 g/m3), and the high moisture density was retained for at least 15 h in the lower layer. The prolonged, continuous, and abundant moisture transport offered a sufficient water vapor supply for this severe precipitation event. According to the estimation of precipitation rate, the increment of torrential rainfall on Changbai Mountain during the severe precipitation period reached 6.8 mm/h, about 41% of the total rainfall in this period. Finally, the topographic sensitivity test indicated that when the terrain of Changbai Mountain was lower, the convergent ascending motion, precipitable water, and storm-relative helicity were weaker, and the rainfall distribution markedly changed. This finding further verifies the importance of the Changbai orography in the extreme precipitation event induced by Typhoon Maysak.
Typhoons are one of the most disastrous weather systems, causing extreme weather, including gales, rainstorms, and storm surge (Needham et al., 2015). Much research has been conducted on their structure and dynamics, e.g., through machine learning (Pan et al., 2013; Chen et al., 2020) and dynamic real-time predicting (Lin and Jhong, 2015). The region of Northeast China, located at mid-to-high latitudes, is affected by typhoons far less frequently than the southeast coastal areas, but we note that more than half (56%) of the tropical cyclones annually travel the mid-to-high latitudes (Sun et al., 2010), bringing widespread strong winds and heavy rain. The ability to prepare for and cope with typhoons in Northeast China is inferior to that of the southeast coast, and once a typhoon moves northward, it can readily cause meteorological disasters. There are fewer studies on typhoon rainstorms and torrential rains in Northeast China, and the understanding and prediction of typhoons need to be further improved (Wang et al., 2007). Continuing to develop high-resolution numerical models and improving the forecasting skills of tropical cyclone tracks are still the most important means to save human life and reduce economic losses (Roy and Kovordányi, 2012).
Several studies have shown that large-scale circulation background, mesoscale systems, water vapor conditions, local topography, stratification stability, boundary layer convergence, and high-level outflow are among the variables closely related to the intensity of typhoons (Chen and Meng, 2001). When studying the influence of circulation in detail, Hogsett and Zhang, 2010 found that the MJO (Madden-Julian Oscillation) may provide convergence and energy for the low-level disturbance of typhoons, together with an eastward-developing Kelvin wave. Other scientists have studied the formation mechanisms of typhoon rainstorms and the extreme characteristics of typhoon precipitation from the aspects of monsoon circulation, water vapor helicity, and wet potential vorticity, including simulation and evaluation studies with numerical prediction models (Hsiao et al., 2010; Van Nguyen and Chen, 2011; Wang and Wang, 2014; Rendfrey et al., 2021).
In addition to the impact of weather systems, topography effects on heavy precipitation are particularly important. The thermodynamic effect of topography can induce localized severe rainfall. Many scientists have promoted the necessity of analyzing the impact of terrain (Weissmann et al., 2011), especially the relationship between the orographic-forced uplifting areas and short-time heavy precipitation (Maussion et al., 2011; Zhao, 2012). The higher the terrain, the greater the increase in localized torrential rainfalls. Apart from the lifting effect of terrain, the vertical water vapor flux (Flesch and Reuter, 2012), turbulent flux, and the variations of surface variables (Kilpela¨ Inen et al., 2011) influence areas affected by torrential rains. Undulate mountainous terrain can also enhance the drag effect of the ground on the atmosphere, which makes the typhoon circulation remain in place, resulting in continuous heavy rain (Chen and Luo, 2004). In Northeast China, the topographic blocking function of Greater Khingan Mountain and Changbai Mountain facilitates the southerly airflow in summer to the windward slopes of the two mountain ranges, which creates an ascending motion and local moisture increases (HE et al., 2020). Agyakwaha and Lin (2021) have revised and tested the topographic precipitation index to better predict the typhoon precipitation caused by topography.
With the rapid development of computers, numerical models are widely used (Bai et al., 2021; Wang H. et al., 2021). Several researchers have pointed out that the simulation results of the mesoscale Weather Research and Forecast Model (WRF) are robust (Jianfeng et al., 2005; Raju et al., 2011; Islam et al., 2015; Kim et al., 2015; Zhu et al., 2021), but better simulations can be achieved by adjusting the microphysical parameterization scheme and the planetary boundary layer (Tao et al., 2011). Pillay and Fitchett (2021) proposed that terrain height is of great significance in the occurrence and intensification of tropical cyclones in the Southern Hemisphere. In a topographic sensitivity test of WRF, the characteristics of extreme precipitation changed and the amount of rainfall decreased significantly with lower terrain height (Wang K. et al., 2021). The uncertainty of the topographic effect on the initial field of numerical simulations of typhoon circulation has increased the challenges of quantitative precipitation prediction (Fang et al., 2011). Heavy precipitation frequencies generally decrease with topographic height whereas light precipitation frequency increases in a nonlinear manner (Song and Zhang, 2020). Another study pointed out there are small-scale topographic vortices generated after a typhoon encounters a mountain range, adding further complexities to modeling efforts (Tang and Chan, 2015).
From 26 August to September 8, 2020, Northeast China was hit by three typhoons, causing heavy rainfall that has rarely been seen before in history, to which Typhoon Maysak contributed the most. This paper conducted an in-depth analysis of the extreme precipitation using observational analysis and numerical simulations, and we focused on the key role of Changbai Mountain’s topography on the increase in heavy rainfall. The European Centre for Medium Range Weather Forecasts (ECMWF) ERA5 reanalysis data were used to revisit the features of physical parameters, the precipitation fusion data of automatic weather stations and CMORPH (Climate Prediction Centre Morphing Technique) were adopted to describe the characteristics of the precipitation, and the topographic role of Changbai Mountain during the typhoon was tested by numerical simulations. Three roles of topography on extreme precipitation are discussed. We believe that the results of this study will help elucidate the topographic effect during extreme precipitation events to improve the predictability of typhoon precipitation patterns.
Changbai Mountain is a dormant volcano located in the eastern part of Jilin Province, China. The topographic map of Jilin Province (Figure 1) shows that Baiyun Peak, the highest peak of Changbai Mountain, is 2,693 m above sea level (a.s.l.), and the lower sections of Changbai Mountain are all above 1,000 m a.s.l. Jilin Province elevation inclines from the northwest to southeast with Daheishan Mountain in the middle. The region can be divided into two major geomorphic regions: the eastern mountain region and the central-western plain. The eastern mountain region is made up of lower mountains and foothills. Jilin Province is the geographical and economic center of Northeast Asia with a population of 27 million and an area of 187,400 ha. It is one of the most important agriculture producing areas in China. To evaluate spatial and temporal variability in rainfall characteristics, all meteorological stations located in the Jinlin Province were used, and we exhibit the top seven stations with the most precipitation in Figure 1. The main features of the selected seven stations are given in Table 1.
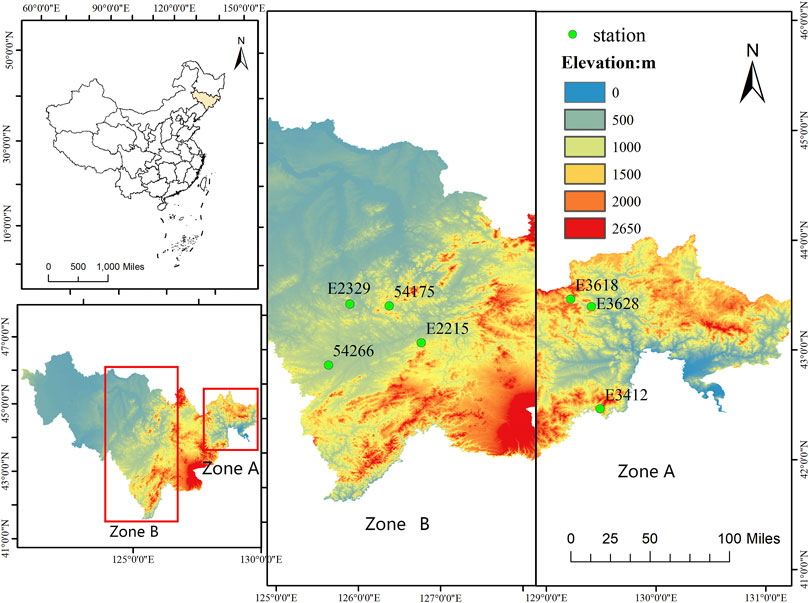
FIGURE 1. Location of seven selected meteorological stations on a topographic map of Jilin province (red: higher elevation; blue: lower elevation, 0–2,650 m a.s.l), and Zone A and Zone B indicate two alpine areas of the mountain region.
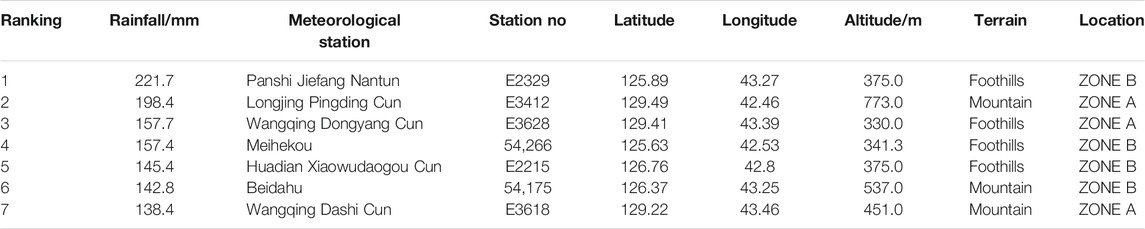
TABLE 1. Main features of the analyzed meteorological stations and rainfall ranking in Jilin Province.
The data adopted in this paper are as follows:
(1) The typhoon optimal path dataset was provided by the Tropical Cyclone Data Centre of the China Meteorological Administration (CMA)1 (Ying et al., 2014; Lu et al., 2021);
(2) The European Centre for Medium Range Weather Forecasts (ECMWF) ERA5 reanalysis dataset (Hersbach et al., 2020), which has a horizontal resolution of 0.25° × 0.25°;
(3) GTOPO30 topographical height data provided by the US Geological Survey (USGS)2 with a resolution of 30 s (about 1 km);
(4) Microwave measurements (MWP967KV) located in Jinlin City (in Jilin Province) and Changchun City (the capital of Jilin Province) were used for analyzing the characteristics of water vapor during the typhoon event. Ground-based microwave measurements are a detection approach, which can conduct the multi-channel continuous detection of the atmospheric microwave radiation moisture, and can automatically invert the atmospheric parameters, such as real-time water vapor (Chan and Hon, 2011);
(5) The hourly precipitation grid dataset (0.1°) over China was provided by the National Meteorological Information Centre of China Meteorological Administration (NMIC-CMA).3 The gridded data were produced by a two-step data fusion algorithm of the probability density function and optimal interpolation (PDF + OI) using the hourly precipitation observations at 30,000–40,000 automatic weather stations (AWSs) and the CMORPH (Climate Prediction Centre Morphing Technique) dataset (Joyce et al., 2004). These coupled datasets effectively utilize the respective advantages of ground-based observations and satellite inversion of rainfall, with high spatial correlation and high accuracy (Shen et al., 2010; Xie and Xiong, 2011; Shen et al., 2014). It is applied to improve our understanding of precipitation variation over Jilin Province.
To further study the topographic effect of Changbai Mountain on the extreme precipitation induced by Typhoon Maysak in 2020, this study used the WRF model version WRF3.3.1 with the Advanced Research WRF (ARW) dynamic core (Skamarock et al., 2008) to carry out the control simulation experiment and the topographic sensitivity experiment. The initial field data for the model was the global reanalysis data from the National Centres for Environmental Prediction/National Centre for Atmospheric Research (NCEP/NCAR) with a resolution of 1° × 1° at intervals of 6 h (Kalnay et al., 1996). The following parameterizations were used: the two-stream correlated-k distribution Rapid Radiative Transfer Model (Iacono et al., 2008) for the radiation schemes, the cloud microphysics of the WRF Single-Moment 5-class scheme (Hong et al., 2004), the Thermal Diffusion scheme boundary layer parameterization scheme (Hong et al., 2006), the revised Monin–Obukhov surface layer (Jiménez et al., 2012), the unified Noah land surface model (Chen and Dudhia, 2001), and the cumulus parameterization based on the Grell 3D scheme (Grell and Dévényi, 2002).
A double nested grid scheme was adopted in the simulation, with the grid spacing of the first layer 9 km and the second layer 3 km. The simulation domain is shown in Figure 2A. The vertical resolution is 34 non-uniform layers with 50 hPa at the top of the atmospheric columns. The simulation center was at the point (43°N, 127°E), the initial time was 08:00 BT 02 September 2020, and the integral was 48 h. Scheme I was the control simulation experiment, that is, the original terrain height was used for numerical simulation; Scheme II and Scheme III were topographic sensitivity experiments. In Scheme II the terrain altitude of the WRF model was replaced by 1/2 of the original terrain height within 126.5°E-131°E and 41°N-45°N (see Figure 2B), and in Scheme III the terrain altitude was set as 0 m in the same domain as in Scheme II (see Figure 2C).
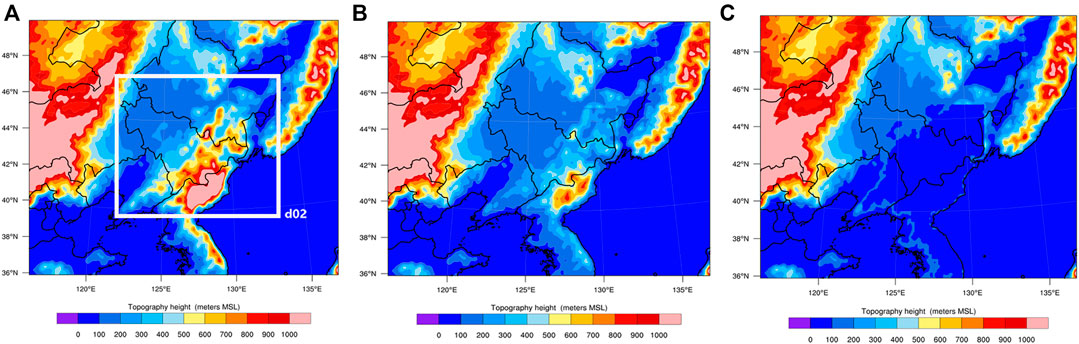
FIGURE 2. Model domain and Control experiment 1, original terrain height of model (A); Sensitivity experiment 2, half of the original terrain height (B), and Sensitivity experiment 3, with the terrain height 0 m (C) in the control area (126.5°E-131°E, 41°N-45°N).
When the wind blows along a mountain slope, it produces a vertical component, the so-called topographical vertical velocity. According to Eq. 1, the greater the slope of a mountain, the greater the wind speed on the ground surface, the more perpendicular the wind direction to the mountain direction, and the stronger the atmospheric vertical motion on the ground surface. To calculate the distribution of terrain ascending motion with height, the ω equation is introduced. Without considering the vorticity advection, temperature advection, and diabatic heating, the geostrophic approximation can be used to obtain Formula 2 and Formula 3 [see reference (Zhu et al., 2000) for details]:
where
where
Then considering Formulas (2, 3, 4), and neglecting negligible terms:
The No. 9 Typhoon Maysak in 2020 was generated in the northwest Pacific Ocean surface at 08:00 BT (Beijing Time, 8 h later than UTC), August 28, 2020, on the ocean surface of the Northwest Pacific Ocean. Then it traveled toward the northwest steadily with its force strengthening. It intensified into a super typhoon at 05:00 BT, 1 September, and landed on the coast of Busan, South Gyeongsang Province, South Korea around 1:30 BT on 3 September. At the time of landfall, its maximum wind force near the center was CAT-14 (42 m/s), and the lowest pressure was 950 hPa in the center. After landing, Maysak shifted to the northwest direction, and at 14:00 BT on 3 September the center moved into Helong of Yanbian Prefecture, Jilin Province, China. Maysak remained at a super typhoon level for 18 h, with a minimum atmospheric pressure of 940 hPa and a maximum wind speed of 52 m/s in its center. After landing, it stayed in Northeast China for 27 h, and direct effects lasted as long as 45 h. The typhoon path is shown in Figure 3A.
FIGURE 3. Track of super typhoon Maysak (A); accumulated rainfall (shaded, unit: mm) in Northeast China from 20:00 BT 2 to 20:00 BT 4 (B), and from 08:00 BT 3 to 08:00 BT 4 (C) September 2020.
Typhoon Maysak gave rise to intense precipitation, with some local rainfalls exceeding historical records. Generally, the typhoon precipitation could be divided into four stages: the first rainfall stage was affected by the typhoon from a long distance, the second stage was dominated by the spiral cloud belt in the typhoon periphery, the third stage was the extreme rainstorm near the typhoon center after it made landfall, and the last was the stage influenced by the extratropical cyclone which was developed from the weakening of this typhoon. The intense precipitation was mainly concentrated in the period from 08:00 BT, 3 September, to 08:00 BT, 4 September, peaking from 14:00 BT in the third typhoon stage to 02:00 BT in the 4th stage. In 48 h (20:00 BT in the 2nd stage to 20:00 BT in the 4th stage), the average rainfall in the whole region of Northeast China was ∼54 mm, and that in Jilin Province reached up to 72.5 mm. The daily rainfall at 49 national stations in Northeast China exceeded the historical extremes (since 1961) for every September, and two stations broke historical records since the establishment of the stations (since 1961).
A group of 201 meteorological stations received >100 mm of accumulated precipitation in Jilin Province. From 20:00 BT, 3 September, to 20:00 BT, 4 September, the two extreme rainfall centers were in Zone A, where Yanji city and Longjing city are located, and Zone B at the junction of the plains and mountains in the south-central parts of Jilin Province (Figures 3B,C). The peak amount of accumulated precipitation was 221.7 mm, found at the Jiefang Nantun Station of Panshi City, in Zone B with topographic lifting after Maysak’s landfall; it had the maximum rainfall intensity of 57 mm/h. Combined with the topography of Jilin Province, it can be seen that there was clear correspondence between the extreme rainfall center and the terrain height (Table 1). In addition, those stations with rainfall of more than 100 mm at a single station are all in the two zones with high rainfall values, and the terrain heights of these stations are all ∼300 m a.s.l. (Table 1). Table 1 compares the distribution of rainfall extremes with altitude, revealing that the two extreme rainfall regions corresponded to the windward slopes and inclining areas of the mountains. So, we can see the topography of Changbai Mountain played a significant role in the extreme precipitation process caused by the super typhoon.
Northeast China is an important grain-producing region in China, and the abnormal precipitation of typhoons directly affects the grain harvest. When a typhoon moves northward, in addition to the transition of the underlying surface from ocean to land, the interaction with weather systems at middle and high latitudes is important. Likewise, as one of the major landforms in Northeast China, the Changbai Mountain range has critical impacts on the summer rainfall in this region.
After a typhoon makes landfall, because of the frictional drag of the underlying surface, its strength will be weakened and speed slowed. Typhoon Maysak weakened soon after making landfall in Busan, South Gyeongsang Province, South Korea, and then continued to lose its strength as it made a second landing in Helong of Yanbian Prefecture, Jilin Province, China. Specifically, on the open sea surface, Maysak moved at a speed of 40–50 m/s. When Maysak landed for the second time, the friction and obstruction effects of the Changbai Mountain terrain slowed it down to 18 m/s. In Figure 1 and Table 1, it can be seen that the deceleration period of the typhoon corresponded to the period of heavy precipitation in Zone A. Thus, the blocking effect of the Changbai Mountain terrain lengthened the period of accumulating precipitation in the eastern part of Jilin Province. The combination of the typhoon peripheral cloud belt and the typhoon traveling direction maintained severe precipitation in certain areas.
Topography promotes the formation of precipitation and affects its distribution, both driven by the blocking terrain which forces air to rise. The Changbai Mountain range comprises a series of parallel and folded fault mountains, basins, and valleys oriented in a northeast-southwest direction, with three main ridges extending to the southwest, northeast, and southeast. The temporal and spatial evolutions of vorticity, divergence, and horizontal wind speed in the high rainfall areas (42°–45°N, 124°–131°E; Figures 4A,B) indicate that the positive vorticity circulation was maintained throughout the troposphere from 20:00 BT, 2 September, to 20 00 BT, 4 September. After Maysak’s landfall, the positive vorticity reached its maximum at 20:00 BT 3 September, with the maximum in the center emerging at 850 hPa and areas extended from the center were over 200 hPa. From the perspective of spatiotemporal variation of the divergence field, before 20:00 BT 3 September, all the areas below 400 hPa were dominated by mid-low level convergence zones, and the mid-high level between 400 hPa and 100 hPa were under the control of divergence zones. Near the typhoon center during 08:00–20:00 BT 3 September, there was a strong convergence center from 925 hPa to the ground, with the center value greater than 15 × 10−5 s−1. After the typhoon changed direction at 20:00 BT 3 September, the convergence intensity in the lower layer faded with increasing height and shifted to a divergence area near the ground.
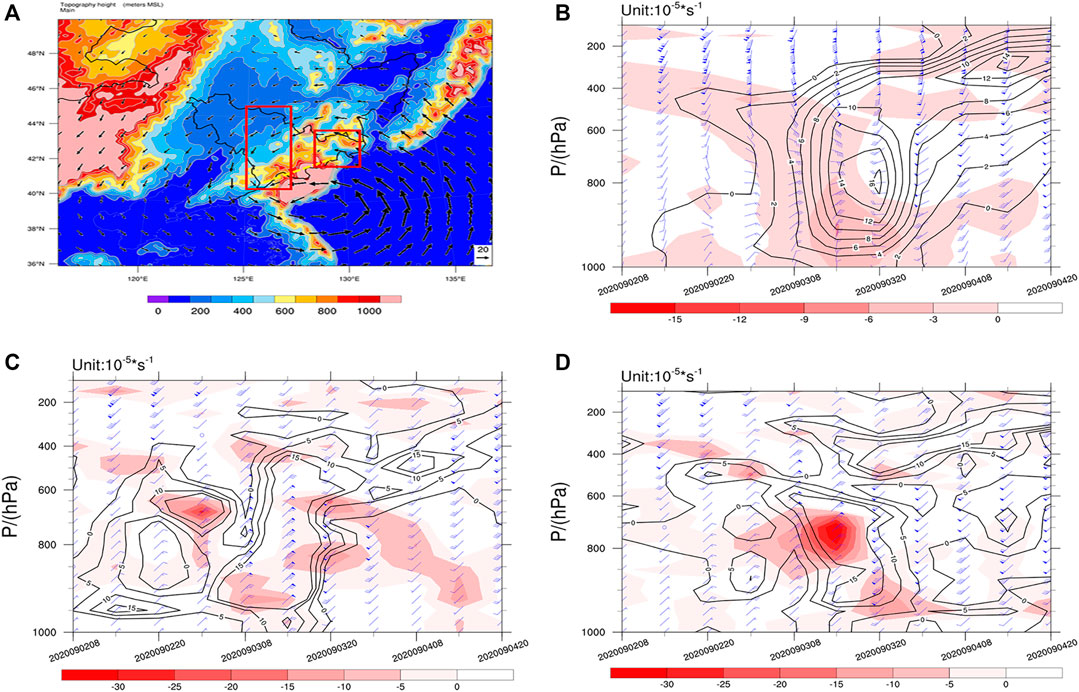
FIGURE 4. (A) Terrain height of Jilin Province (shaded, unit: m) and 850 hPa wind at 08:00 BT 3 September (black arrow, unit: m/s). The yellow solid line is the mountain ridge of Changbai Mountain. Red dotted boxes are the high rainfall areas in Jilin Province; (B) Time-vertical profile of the averaged vorticity (black solid line, unit: 10−5 s−1), divergence (red shaded area, unit: 10−5 s−1), and horizontal wind speed (blue wind barb, unit: m/s) in the red dotted area from 08:00 BT, 2 September, to 20:00 BT 4, September 2020. The time-vertical profile of vorticity, divergence, and horizontal wind speed on (C) the windward slope (42.8°N, 129.4°E; Zone A) and (D) leeward slope (42.9°N, 126.5°E; Zone B) are also shown.
To further study the influence of mountain topography on the distribution of vorticity and divergence, the lifting areas on the east and west sides of Changbai Mountain ridge (Zone A and Zone B in Figure 1) were selected for comparative analysis of temporal vertical profiles. As shown in Figures 4C,D, the two selected areas corresponding to the typhoon-affected phases are both lifting areas, and both are close to the typhoon center. During the influence phase of the peripheral spiral cloud belt of the typhoon, Zone A was the area on the windward slope. From 08:00 to 20:00 BT on 3 September, the intensity of the positive vorticity area was much larger than the regional average, in which the center intensity of vorticity in Zone A of the windward slope reached its maximum at 850 hPa, and the upward extending area developed to around 300 hPa. During the typhoon-weakening period from 08:00 to 20:00 BT on 4 September, Zone A on the windward slope had negative vorticity below 700 hPa in the lower layer and a positive vorticity center near 300 hPa in the upper layer. The vorticity variation before and after the typhoon center passed was more symmetrical.
As shown in the distribution of the divergence field, there was an obvious convergence center in the lower layer of Zone A on the windward slope from 08:00 BT, 3 September, to 08:00 BT, 4 September. Especially at 14:00 BT on 3 September, the convergence in the lower layer was significantly enhanced, whereas the divergence in the upper layer at this time was also the greatest. The strong convergence center at the lower level of the windward slope appeared in the northeast wind in front of the typhoon center, and after the typhoon center passed, it turned toward the south and the convergence decreased. When the typhoon center passed through Zone B, the terrain altitude increased, strengthening the convergent lifting, and the strong convergence center was in the southwest wind behind the typhoon center. At 20:00 BT on 3 September, the middle layer became a compact area of convergence, the upper layer was a divergent field, and the vertical wind shear gradient was large. At this time, the maximum hourly rainfall intensity was in Panshi of Jinlin Province. Hence, the dynamic conditions of precipitation in Jilin Province are largely strengthened by the cooperation of terrain lifting and convergence.
Ascending motion is one of the conditions related to torrential rain, and vertical velocity can well reflect the strength of ascending motion. Combined with the terrain height of Jilin Province, the vertical velocity profile was developed (Figure 5) along a 43°N latitude line, and it shows that at 02:00 BT on 3 September, the typhoon was still in the area to the east of 127.5°E, corresponding with a strong vertical up-rising area above it. At this time, a relatively small vertical rising center emerged on the east side of the Changbai Mountain range. As the typhoon gradually moved westward, the vertical velocity center above the typhoon center kept tilting forward, and merged with the center in front of the mountain, strengthening, and with the velocity center value reaching 15 m/s. This strong center before the mountain remained until the typhoon landed again in Jilin Province. After the typhoon landed, the southwest wind area in the fourth quadrant of the typhoon center was once again lifted by the terrain behind the mountain, and the velocity center value reached 33 m/s, thus forming favorable conditions for heavy precipitation in Panshi City. After the typhoon crossed the mountain, the vertical velocity area was weakened. We can see that topographic lifting has a dynamic strengthening effect on the two severe precipitation phases.
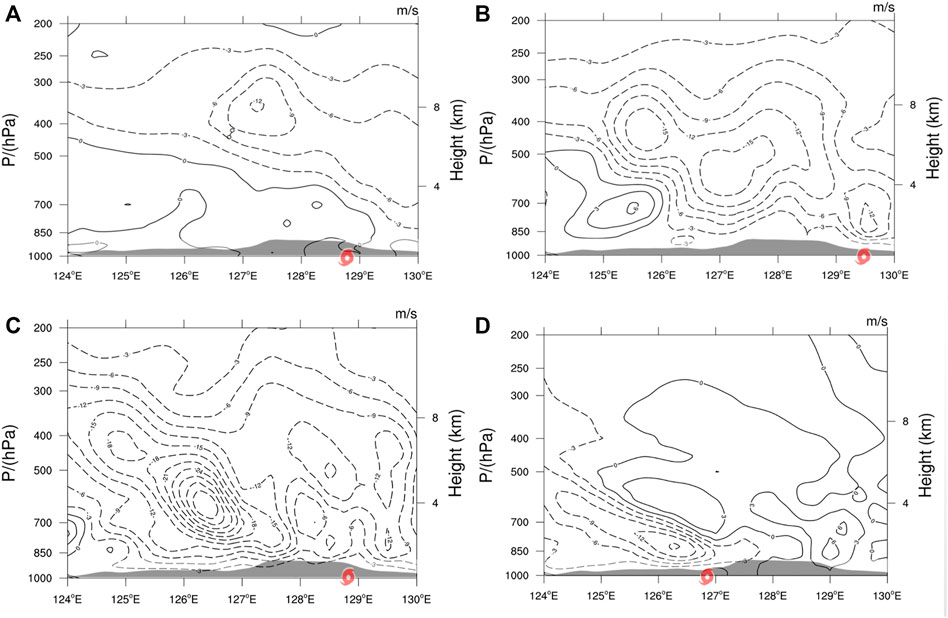
FIGURE 5. Longitudinal cross-section of vertical velocity (contour, unit: m/s) and terrain height (shaded, unit: m) along 43°N at (A) 02:00, (B) 08:00, (C) 14:00, (D) 20:00 BT 3 September 2020. The typhoon mark indicates the longitude location of typhoon Maysak.
In addition to the dynamic effect, moisture condensation due to the cooling of airflow passing over the mountain also increased significantly. At 02:00 BT 3 September, Maysak made landfall on the coast of Busan, South Gyeongsang Province, South Korea, and at this moment the moisture in the periphery of the typhoon began to affect eastern Jilin Province. Obstructed by the topography of Changbai Mountain, the convergence center of water vapor flux above −90 × 10−5 s−1 was observed on the eastern side of the mountain range (Figure 6). With the typhoon approaching, the convergence of piedmont water vapor flux was continuously strengthened, gradually expanding to the west of Jilin Province. At 10:00 BT on 3 September, the convergence center reached its maximum value of −120 × 10−5 s−1, far higher than the typhoon near-center circulation. Before and after the typhoon landed, Jilin Province was located in the strong convergence zone of water vapor flux, whose central extreme value was maintained at −120 × 10−5 s−1. There were two extreme centers in the strong convergence zone, one was the east side of Changbai Mountain before the typhoon landed, and the other was the terrain lifting area in the fourth quadrant on the southwest side of the typhoon center after the typhoon landed, which corresponded to the two precipitation extremum centers Zone A and Zone B. In addition, it was found from the two microwave measurements in Changchun City and Jilin City that the water vapor density profile and integrated water vapor at 0–3 km increase significantly with the precipitation process. In the stage of heavy precipitation, water vapor density profile increased rapidly, with a peak of 14 g/m3. The high value of the water vapor density profile lasted from 01:00 BT, 3 September to 16:00 BT, 3 September (Figure 7). With the weakening of precipitation, the water vapor density profile and integrated water vapor began to decrease at the same time. As a result, the sustained and abundant water vapor transport provided a sufficient moisture supply for this precipitation. The convergent lifting of the Changbai Mountain topography promoted the provision of very favorable water vapor conditions for the occurrence of a heavy rainstorm.
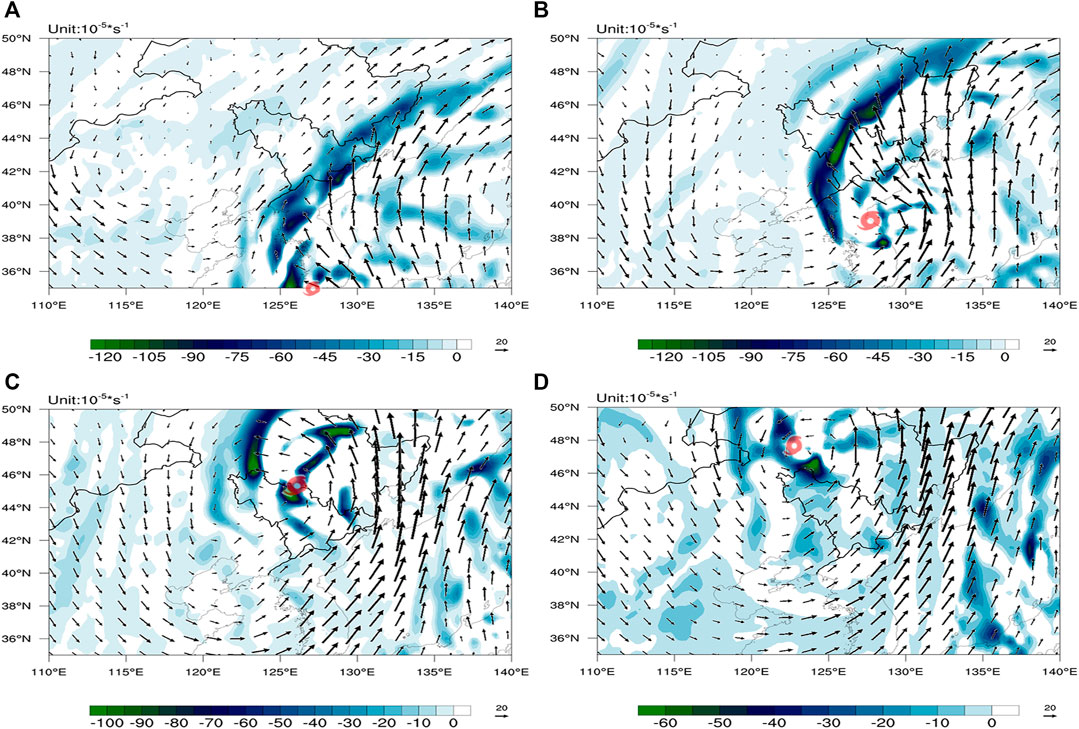
FIGURE 6. The 850 hPa water-vapor flux divergence (shaded, unit: 10−5 s−1) and horizontal wind speed (black arrow, unit: m/s) at (A) 20:00 BT 2, (B) 08:00 BT 3, (C) 20:00 BT 3, and (D) 08:00 BT 4 September 2020. The typhoon mark represents the position of Maysak.
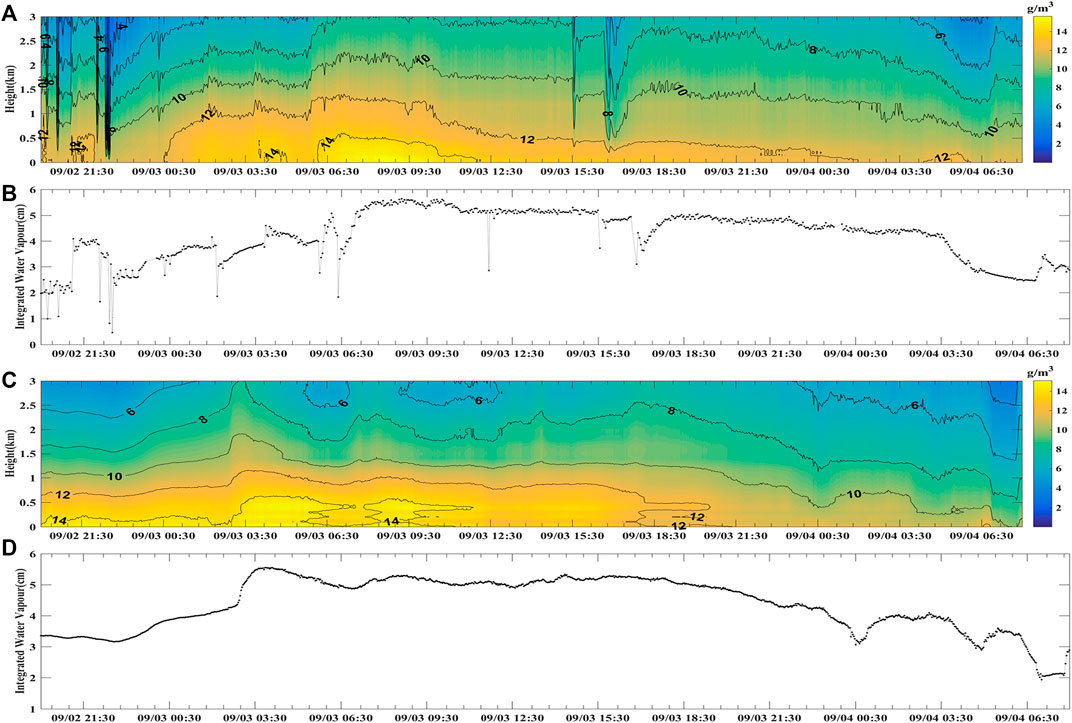
FIGURE 7. The water vapor density profile (unit: g/m3) and integrated water vapor (unit: kg/m2) of microwave measurements at Changchun city (A,B) and Jilin city (C,D) from 20:00 BT 2 to 08:00 BT 4 September 2020.
It can be seen from the analysis of the actual field of physical parameters that the topography of Changbai Mountain produced a critical convergent lifting effect on the extreme precipitation brought by the typhoon, which was mainly manifested as dynamic lifting and water vapor convergence. The effect of terrain on the increased precipitation can be estimated by parameters such as wind direction and wind force during a typhoon.
The direction of the strongest wind at the Longjing Pingdingshan station on the windward slope of Changbai Mountain was dramatically affected by topography, and precipitation was closely related to wind shear. Under the influence of the surrounding terrain, there were only two wind directions, northerly and southerly, at the Longjing Pingdingshan station during the lifecycle of the typhoon. When the northeast wind in the periphery of the typhoon encountered the Changbai Mountain, it was blocked and forced to turn to the south, and the precipitation at the Longjing Pingdingshan station occurred mainly when the southerly wind was blowing. With the increasing southerly wind, precipitation was intensified. This was because the southerly wind can behave actively on the southwest side of the mountain range only after it was over the mountain, thus most precipitation occurred before the wind passed over the mountain.
Take the latitude of the Longjing Pingdingshan station at 42.5°N, f = 9.8 × 10⁻⁵ s−1, P0 = 906 hPa, K = 5.2 × 10² hPa2 m−1, L is 100 km, and then
Set
where
The hourly average values of the Longjing Pingdingshan station during the heaviest precipitation (from 01:00 BT to 13:00 BT on 3 September) are taken for each parameter. At the Longjing Pingdingshan station, the average surface pressure was 906 hPa, the average surface temperature was 16.9°C, the average specific humidity was 10 g/kg, the terrain slope was about 11.1°, and the velocity perpendicular to the terrain was about 8 m/s. Then, the precipitation increment caused by terrain lifting can be estimated to be about 6.8 mm/h, and the 12-h accumulated rainfall increased by nearly 82 mm, accounting for 41% of the observed rainfall during the period. Therefore, we can see that much of the precipitation was caused by the uplift of the terrain.
Comparing the model simulation of Typhoon Maysak with the observed data (Figure 8D), the mesoscale numerical model WRF-ARW can well simulate the track of the typhoon before its landing, and especially the simulated and observed landfall locations in Jilin Province. But after its landing, it degenerates into an extratropical cyclone and the simulated track is slightly to the north until it leaves Jilin Province (Figures 8A–C). According to the precipitation distribution from 20:00 BT, 2 September, to 08:00 BT, September 4, 2020, the precipitation distribution pattern in Jilin Province simulated by the WRF numerical model is consistent with empirical observations and, in particular, the two extreme rainfall centers are consistent (as is shown in Figure 8B). There is an obvious asymmetric structure near the typhoon center, with extreme precipitation concentrated in the first quadrant and the third quadrant of its center.
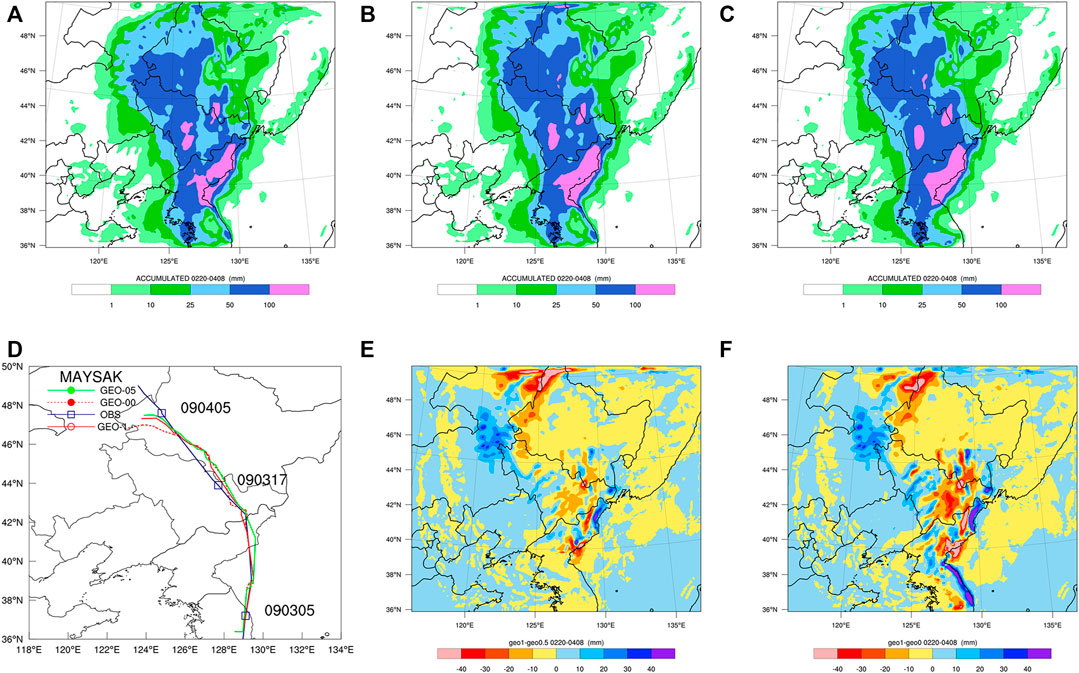
FIGURE 8. The simulated precipitation of Scheme I, Scheme II, and Scheme III (A–C), the simulated and observed tracks of Maysak (blue solid line is for the observed typhoon track, red solid line for the track simulated by Scheme I, green solid line for the track simulated by Scheme II and red dotted line for the track simulated by Scheme III) (D); The anomalies of precipitation difference of Scheme I minus Scheme II (E), and Scheme I minus Scheme III (F) from 20:00 BT 2 to 08:00 BT 4 September 2020 (shaded, unit: mm).
The comparison of the precipitation distributions in the control simulation experiment and topographic sensitivity experiment indicates that the path and intensity of the typhoon did not change significantly at lower terrains, with the overall precipitation trend in most parts of Jilin Province consistent with that in the control experiment (Figure 8C). To better analyze the impact of topography on this extreme rainfall, we conducted three sets of numerical modal experiments, which were Scheme I, Scheme II, and Scheme III (for details see the section Model Configuration and Design). The precipitation of the control experiment Scheme I is used to standardize that of Scheme II and Scheme III, and Figures 8E,F show the anomalies of precipitation difference of Scheme I minus Scheme II and Scheme I minus Scheme III during the three simulation experiments. After the terrain altitude was changed to half of the original terrain height (or 0 m), the anomalies of precipitation in rainfall amount between the two schemes gradually increases at the border of North Korea and the eastern part of Jilin Province, and the maximum difference exceeds 40 mm, which can further indicate the effect of mountain topography on the precipitation. It is worth mentioning that the negative anomalies’ precipitation difference reaches 20 mm over the eastern part of central Jilin Province in the fourth quadrant of the typhoon center. We will further analyze in the next section.
The storm-relative helicity was a parameter used to measure the strength of storm inflow and the magnitude of the vorticity component along the inflow direction. It can reveal the relative inflow strength of a storm and the rotation degree of the ambient wind field, thus reflecting the potential of rotation development (Lilly, 1986). The distribution comparison (Figures 9A–C) of storm-relative helicity at 06: 00 BT, 3 September, shows that when the terrain height is lower, the storm-relative helicity near the eastern border of Jilin Province declines distinctly. At 08:00 BT on 3 September, because of the lifting effect of terrain, the high-value center of storm-relative helicity in the control experiment Scheme I is located in the eastern part of Jilin Province (Figures 9B,C), matching the extreme area of precipitation. When the terrain height is lower, the storm-relative helicity in the east of Jilin Province decreases, and the potential for the development of storm rotation is weakened. After the terrain height drops to 0 m, the rainstorm gradually moves to the central part of Jilin Province, and the rainfall in Dunhua and Jiaohe of Jilin Province in the first quadrant of the typhoon center is enhanced.
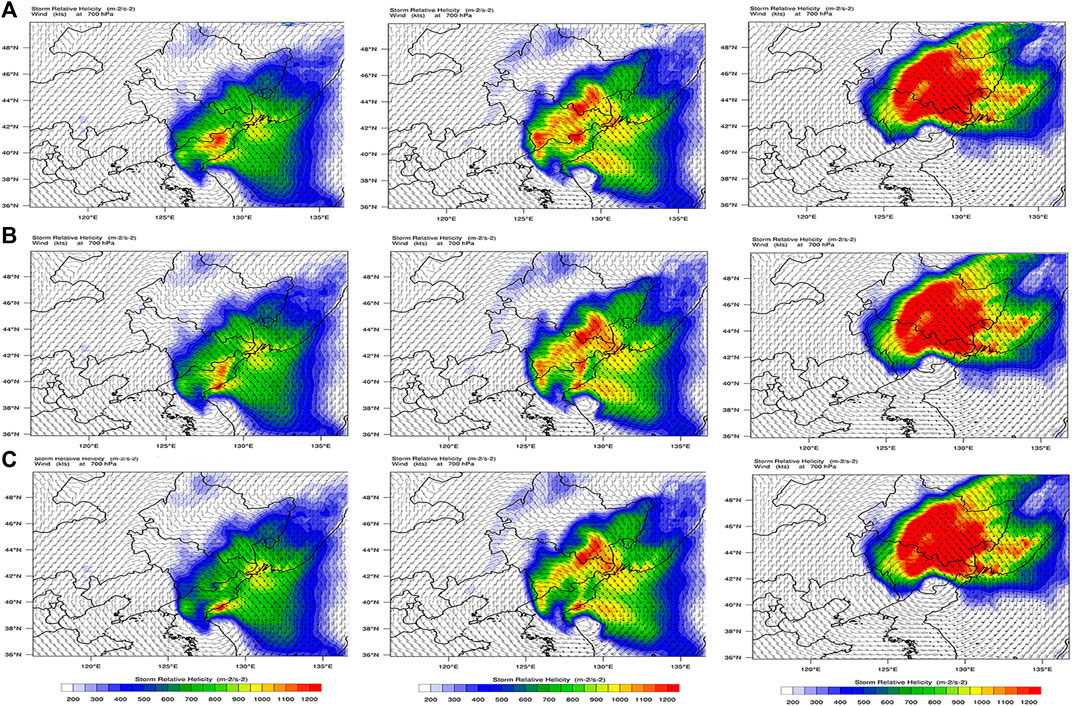
FIGURE 9. Storm relative helicity (shaded, unit: m−2 s−2) and 700 hPa horizontal wind speed (barb, unit: m/s) in the simulated precipitation of Scheme I (A), Scheme II (B), and Scheme III (C) at 06:00, 08:00, and 14:00 BT, September 3, 2020.
Comparing the whole layer of atmospheric precipitable water distributions (Figures 10A,C,E) of the topographic sensitivity experiment, we found that after removing the obstruction of mountains, the high-value area of atmospheric precipitable water in Jilin Province became even wider, and the moisture transport is even more apparent (Figures 10B,D,F), so the precipitation in the eastern part of central Jilin Province and the southern part of Heilongjiang Province was intensified instead. Even when Zone B (including Panshi city) lies in the third quadrant after typhoon landfall, the extreme precipitation center still fails to appear because there is no topographic lifting. This finding can further verify the critical significance of the Changbai Mountain topography for extreme precipitation.
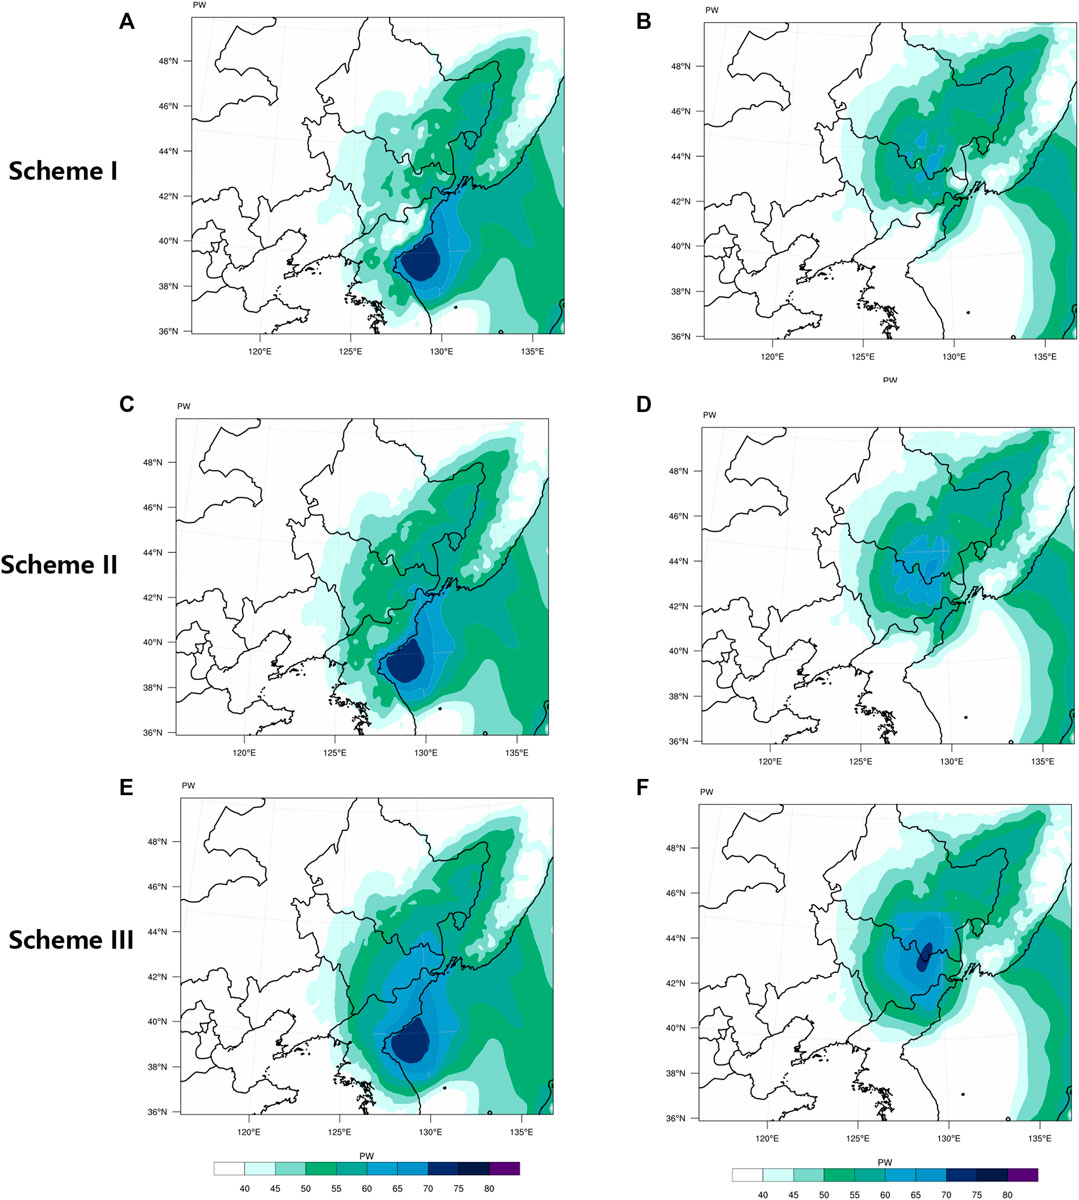
FIGURE 10. Atmospheric precipitable water (shaded, unit: mm) in Scheme I (A,B), Scheme II (C,D), and Scheme III (E,F) at 09:00 and 14:00 BT, September 3, 2020.
The September 2020 extreme precipitation resulting from Typhoon Maysak in Northeast China was analyzed based on the hourly gridded precipitation data, ECMWF ERA5 reanalysis data, and microwave measurements. The control simulation experiment and topographic sensitivity experiment were carried out in combination with the mesoscale numerical model WRF-ARW, and then the simulation results from the reduced and the altered terrain heights were compared. During the influencing period of Maysak, two extreme precipitation centers existed in Jilin Province, both of which were found in the upslope areas of the Changbai Mountain range, corresponding well to the terrain height. The overlap of the typhoon-affected region and the typhoon-moving direction also contributed significantly to the persistence of the extremely severe rainfall, during which the topography of Changbai Mountain had a critical promoting function.
In summation, the topographic impacts of the Changbai Mountain on the extreme typhoon rainfall are reflected in three aspects:
(1) Blocking and dragging. During the heavy precipitation period after the typhoon made landfall, the topography of the mountain slowed down the typhoon, helping prolong the rainfall duration, which facilitated the occurrence of severe precipitation;
(2) Forced lifting. The mountainous terrain made the high-value area of positive vorticity extend to 200 hPa through the remarkable dynamic lifting in front of the mountain, accelerating the vertical upward motion. The strong low-level convergence and high-level divergence strengthened the dynamic action;
(3) The corresponding moisture convergence intensified. The microwave measurements show the higher water vapor density profile was in lower layer. The high-water vapor density profile lasting for 15 h coupled with the strong convergence of water vapor flux supplied sufficient water vapor and transported it, supporting the extreme precipitation. The dense moisture area corresponded to the terrain height with increasing precipitation.
According to the estimated precipitation rate, the positive effect of Changbai Mountain on the torrential rains reached 6.8 mm/h, which nears 41% of the total rainfall of this period. After the terrain height is lowered in the topographic sensitivity experiment, the convergence and ascending motion in the eastern part of Jilin Province weakens, and the rainfall is significantly diminished. The calculated difference between the topographic sensitivity experiment and control experiment denotes that the terrain obstruction also affects the distribution of storm-relative helicity and atmospheric precipitable water, which further indicates that the topography of Changbai Mountain is one of the significant causes for this extreme precipitation event.
In short, the topography of Changbai Mountain played a very important role in the extreme precipitation caused by the super typhoon Maysak. In this paper, we have analyzed how Changbai Mountain influenced the extreme heavy rainfall in the respect of dynamics and moisture transport, but in terms of the thermodynamic effect, it is worthy of further research. The trace of typhoon will be influenced by the subtropical high pressure, westerly trough ridge, and typhoon internal force, among which the most decisive is the subtropical high pressure. In July 2020, the intensity of the subtropical high pressure was significantly stronger with its abnormal ridge line. The radial circulation composed of subtropical high pressure and northeastern cold vortex maintained a relatively stable state, guiding all three typhoons to move north along the “straight” similar path as the longitude line, and combined with the western belt system, bringing continuous strong wind and rain weather to Northeast China. With global warming, the warming ocean surface may drive and generate the necessary convections to sustain tropical cyclones (Sobel et al., 2016; Velden et al., 2017). Thus, whether the physical mechanism of typhoons affecting the middle and high latitudes follows the historical statistical laws or not needs to be further deeply studied and discussed in the light of high-resolution data, numerical simulation, and analysis techniques.
The raw data supporting the conclusions of this article will be made available by the authors, without undue reservation.
XZ and DZ conceived the study. DZ, YY, and NW performed the data analysis. DZ, CC, and XT. revised and edited the manuscript. All authors contributed to the article and approved the submitted version.
This research is funded by the National Key R&D Program of China (No. 2017YFC1502000) and Mesoscale Numerical Model Application Innovation Team of Changchun Meteorological Bureau (NO.202001).
The authors declare that the research was conducted in the absence of any commercial or financial relationships that could be construed as a potential conflict of interest.
All claims expressed in this article are solely those of the authors and do not necessarily represent those of their affiliated organizations, or those of the publisher, the editors and the reviewers. Any product that may be evaluated in this article, or claim that may be made by its manufacturer, is not guaranteed or endorsed by the publisher.
The critical and useful comments of the reviewers greatly improved this work. The authors would like to acknowledge Prof. Hua Liu for her advice and English language polishing.
1http://tcdata.typhoon.org.cn.
Agyakwah, W., and Lin, Y. L. (2021). Generation and Enhancement Mechanisms for Extreme Orographic Rainfall Associated with Typhoon Morakot (2009) Over the Central Mountain Range of Taiwan. Atmos. Res. 247, 105160. doi:10.1016/j.atmosres.2020.105160
Bai, Y.-Q., Wang, Y., Kong, S.-F., Zhao, T.-L., Zhi, X.-F., Zheng, H., et al. (2021). Modelling the Effect of Local and Regional Emissions on PM2.5 Concentrations in Wuhan, China during the COVID-19 Lockdown. Adv. Clim. Change Res 12, 871–880. doi:10.1016/j.accre.2021.09.013
Chan, P. W., and Hon, K. K. (2011). Application of Ground-Based, Multi-Channel Microwave Radiometer in the Nowcasting of Intense Convective Weather through Instability Indices of the Atmosphere. Metz 20 (4), 431–440. doi:10.1127/0941-2948/2011/0276
Chen, F., and Dudhia, J. (2001). Coupling an Advanced Land Surface-Hydrology Model with the Penn State-NCAR MM5 Modeling System. Part I: Model Implementation and Sensitivity. Mon. Wea. Rev. 129 (4), 569–585. doi:10.1175/1520-0493(2001)129<0569:caalsh>2.0.co;2
Chen, L., and Luo, Z. (2004). A Study of the Effect of Topography on the Merging of Vortices. Adv. Atmos. Sci. 21 (1), 13–22. doi:10.1007/BF02915676
Chen, L. S., and Meng, Z. Y. (2001). An Overview on Tropical Cyclone Research Progress in China during the Past Ten Years. Chin. J. Atmos. Sci. 25, 420–432. doi:10.3878/j.issn.1006-9895.2001.03.11
Chen, R., Zhang, W., and Wang, X. (2020). Machine Learning in Tropical Cyclone Forecast Modeling: A Review. Atmosphere 11 (7), 676. doi:10.3390/atmos11070676
Fang, X., Kuo, Y.-H., and Wang, A. (2011). The Impacts of Taiwan Topography on the Predictability of Typhoon Morakot's Record-Breaking Rainfall: A High-Resolution Ensemble Simulation. Wea. Forecast. 26 (5), 613–633. doi:10.1175/WAF-D-10-05020.1
Flesch, T. K., and Reuter, G. W. (2012). WRF Model Simulation of Two Alberta Flooding Events and the Impact of Topography. J. Hydromet. 13 (2), 695–708. doi:10.1175/JHM-D-11-035.1
Grell, G. A., and Dévényi, D. (2002). A Generalized Approach to Parameterizing Convection Combining Ensemble and Data Assimilation Techniques. Geophys. Res. Lett. 29 (14), 38-1–38-34. doi:10.1029/2002GL015311
He, B., Sun, J., Yu, E., Wang, H., Zhang, M., and Hua, W. (2020). Simulation Study on the Influence of the Great Khingan Strip and Changbai Mountain on Summer Rainfall in Northeast China. Clim. Environ. Res. 25 (3), 268–280. doi:10.3878/j.issn.1006-9585.2020.19189
Hersbach, H., Bell, B., Berrisford, P., Hirahara, S., Horányi, A., Muñoz‐Sabater, J., et al. (2020). The ERA5 Global Reanalysis. Q.J.R. Meteorol. Soc. 146 (730), 1999–2049. doi:10.1002/qj.3803
Hogsett, W., and Zhang, D.-L. (2010). Genesis of Typhoon Chanchu (2006) from a Westerly Wind Burst Associated with the MJO. Part I: Evolution of a Vertically Tilted Precursor Vortex. J. Atmos. 67 (12), 3774–3792. doi:10.1175/2010jas3446.1
Hong, S.-Y., Dudhia, J., and Chen, S.-H. (2004). A Revised Approach to Ice Microphysical Processes for the Bulk Parameterization of Clouds and Precipitation. Mon. Wea. Rev. 132 (1), 103–120. doi:10.1175/1520-0493(2004)132<0103:aratim>2.0.co;2
Hong, S.-Y., Noh, Y., and Dudhia, J. (2006). A New Vertical Diffusion Package with an Explicit Treatment of Entrainment Processes. Mon. Wea. Rev. 134 (9), 2318–2341. doi:10.1175/MWR3199.1
Hsiao, L.-F., Liou, C.-S., Yeh, T.-C., Guo, Y.-R., Chen, D.-S., Huang, K.-N., et al. (2010). A Vortex Relocation Scheme for Tropical Cyclone Initialization in Advanced Research WRF. Mon. Wea. Rev. 138 (8), 3298–3315. doi:10.1175/2010MWR3275.1
Iacono, M. J., Delamere, J. S., Mlawer, E. J., Shephard, M. W., Clough, S. A., and Collins, W. D. (2008). Radiative Forcing by Long-Lived Greenhouse Gases: Calculations with the AER Radiative Transfer Models. J. Geophys. Res. 113 (D13), 1–8. doi:10.1029/2008jd009944
Islam, T., Srivastava, P. K., Rico-Ramirez, M. A., Dai, Q., Gupta, M., and Singh, S. K. (2015). Tracking a Tropical Cyclone through WRF-ARW Simulation and Sensitivity of Model Physics. Nat. Hazards 76 (3), 1473–1495. doi:10.1007/s11069-014-1494-8
Jianfeng, G., Xiao, Q., Kuo, Y.-H., Barker, D. M., Jishan, X., and Xiaoxing, M. (2005). Assimilation and Simulation of Typhoon Rusa (2002) Using the WRF System. Adv. Atmos. Sci. 22 (3), 415–427. doi:10.1007/BF02918755
Jiménez, P. A., Dudhia, J., González-Rouco, J. F., Navarro, J., Montávez, J. P., and García-Bustamante, E. (2012). A Revised Scheme for the WRF Surface Layer Formulation. Mon. Wea. Rev. 140 (3), 898–918. doi:10.1175/MWR-D-11-00056.1
Joyce, R. J., Janowiak, J. E., Arkin, P. A., and Xie, P. (2004). CMORPH: A Method that Produces Global Precipitation Estimates from Passive Microwave and Infrared Data at High Spatial and Temporal Resolution. J. Hydrometeor. 5 (3), 487–503. doi:10.1175/1525-7541(2004)005<0487:camtpg>2.0.co;2
Kalnay, E., Kanamitsu, M., Kistler, R., Collins, W., Deaven, D., Gandin, L., et al. (1996). The NCEP/NCAR 40-year Reanalysis Project. Bull. Amer. Meteorol. Soc. 77 (3), 437–471. doi:10.1175/1520-0477(1996)077<0437:tnyrp>2.0.co;2
Kilpela¨Inen, T., Vihma, T., Lafsson, H. O., and Karlsson, P. E. (2011). Modelling of Spatial Variability and Topographic Effects over Arctic Fjords in Svalbard. Tellus A: Dynamic Meteorol. Oceanogr. 63 (2), 223–237. doi:10.1111/j.1600-0870.2010.00481.x
Kim, D., Jin, C.-S., Ho, C.-H., Kim, J., and Kim, J.-H. (2015). Climatological Features of WRF-Simulated Tropical Cyclones over the Western North Pacific. Clim. Dyn. 44 (11-12), 3223–3235. doi:10.1007/s00382-014-2410-3
Lilly, D. K. (1986). The Structure, Energetics and Propagation of Rotating Convective Storms. Part II: Helicity and Storm Stabilization. J. Atmos. Sci. 43 (2), 126–140. doi:10.1175/1520-0469(1986)043<0126:tseapo>2.0.co;2
Lin, G.-F., and Jhong, B.-C. (2015). A Real-Time Forecasting Model for the Spatial Distribution of Typhoon Rainfall. J. Hydrol. 521, 302–313. doi:10.1016/j.jhydrol.2014.12.009
Lu, X., Yu, H., Ying, M., Zhao, B., Zhang, S., Lin, L., et al. (2021). Western north pacific Tropical Cyclone Database Created by the china Meteorological Administration. Adv. Atmos. Sci. 38 (4), 690–699. doi:10.1007/s00376-020-0211-7
Maussion, F., Scherer, D., Finkelnburg, R., Richters, J., Yang, W., and Yao, T. (2011). WRF Simulation of a Precipitation Event over the Tibetan Plateau, China - an Assessment Using Remote Sensing and Ground Observations. Hydrol. Earth Syst. Sci. 15 (6), 1795–1817. doi:10.5194/hess-15-1795-2011
Needham, H. F., Keim, B. D., and Sathiaraj, D. (2015). A Review of Tropical Cyclone-Generated Storm Surges: Global Data Sources, Observations, and Impacts. Rev. Geophys. 53 (2), 545–591. doi:10.1002/2014RG000477
Pan, T.-Y., Yang, Y.-T., Kuo, H.-C., Tan, Y.-C., Lai, J.-S., Chang, T.-J., et al. (2013). Improvement of Watershed Flood Forecasting by Typhoon Rainfall Climate Model with an ANN-Based Southwest Monsoon Rainfall Enhancement. J. Hydrol. 506, 90–100. doi:10.1016/j.jhydrol.2013.08.018
Pillay, M. T., and Fitchett, J. M. (2021). On the Conditions of Formation of Southern Hemisphere Tropical Cyclones. Weather Clim. Extremes 34, 100376. doi:10.1016/j.wace.2021.100376
Raju, P. V. S., Potty, J., and Mohanty, U. C. (2011). Sensitivity of Physical Parameterizations on Prediction of Tropical Cyclone Nargis over the Bay of Bengal Using WRF Model. Meteorol. Atmos. Phys. 113 (3), 125–137. doi:10.1007/s00703-011-0151-y
Rendfrey, T. S., Bukovsky, M. S., McCrary, R. R., and Fuentes‐Franco, R. (2021). An Assessment of Tropical Cyclones in North American CORDEX WRF Simulations. Weather Clim. Extremes 34, 100382. doi:10.1016/j.wace.2021.100382
Roy, C., and Kovordányi, R. (2012). Tropical Cyclone Track Forecasting Techniques ― A Review. Atmos. Res. 104-105, 40–69. doi:10.1016/j.atmosres.2011.09.012
Shen, Y., Xiong, A., Wang, Y., and Xie, P. (2010). Performance of High-Resolution Satellite Precipitation Products over China. J. Geophys. Res. 115 (D2), 1–17. doi:10.1029/2009JD012097
Shen, Y., Zhao, P., Pan, Y., and Yu, J. (2014). A High Spatiotemporal Gauge-Satellite Merged Precipitation Analysis over China. J. Geophys. Res. Atmos. 119 (6), 3063–3075. doi:10.1002/2013jd020686
Skamarock, W. C., Klemp, J. B., Dudhia, J., Gill, D. O., Barker, D. M., Duda, M. G., et al. (2008). A Description of the Advanced Research WRF Version 3. NCAR Technical Note. Boulder, CO, USA: National Center for Atmospheric Research.
Sobel, A. H., Camargo, S. J., Hall, T. M., Lee, C.-Y., Tippett, M. K., and Wing, A. A. (2016). Human Influence on Tropical Cyclone Intensity. Science 353 (6296), 242–246. doi:10.1126/science.aaf6574
Song, Z., and Zhang, J. (2020). Diurnal Variations of Summer Precipitation Linking to the Topographical Conditions over the Beijing-Tianjin-Hebei Region. Sci. Rep. 10 (1), 1–9. doi:10.1038/s41598-020-65743-1
Sun, L., Sui, B., Wang, X., and Liu, S. (2010). Climatic Characteristics of the Summer Hard Rain in the Northeastern Part of China. Clim. Environ. Res. 15, 778–786. doi:10.3878/j.issn.1006-9585.2010.06.07
Tang, C. K., and Chan, J. C. L. (2015). Idealized Simulations of the Effect of Local and Remote Topographies on Tropical Cyclone Tracks. Q.J.R. Meteorol. Soc. 141 (691), 2045–2056. doi:10.1002/qj.2498
Tao, W. K., Shi, J., Lin, P. L., Chen, J. Y., Lang, S., and Chang, M. Y. (2011). High-resolution Numerical Simulation of the Extreme Rainfall Associated with Typhoon Morakot. Part I: Comparing the Impact of Microphysics and PBL Parameterizations with Observations. Terr. Atmos. Ocean. Sci. 22 (6), 6. doi:10.3319/tao.2011.08.26.01(tm)
Van Nguyen, H., and Chen, Y.-L. (2011). High-resolution Initialization and Simulations of Typhoon Morakot (2009). Mon. Wea. Rev. 139 (5), 1463–1491. doi:10.1175/2011MWR3505.1
Velden, C., Olander, T., Herndon, D., and Kossin, J. P. (2017). Reprocessing the Most Intense Historical Tropical Cyclones in the Satellite Era Using the Advanced Dvorak Technique. Mon. Wea. Rev. 145 (3), 971–983. doi:10.1175/MWR-D-16-0312.1
Wang, H., and Wang, Y. (2014). A Numerical Study of Typhoon Megi (2010). Part I: Rapid Intensification. Mon. Wea. Rev. 142 (1), 29–48. doi:10.1175/MWR-D-13-00070.1
Wang, D.-h., Zhong, S.-x., Liu, Y., Li, J., Hu, K.-x., and Yang, S. (2007). Advances in the Study of Rainstorm in Northeast China. Adv. Earth Sci. 22 (6), 549–560. doi:10.1002/jrs.1570
Wang, H., Miao, Q., Shen, L., Yang, Q., Wu, Y., and Wei, H. (2021). Air Pollutant Variations in Suzhou during the 2019 Novel Coronavirus (COVID-19) Lockdown of 2020: High Time-Resolution Measurements of Aerosol Chemical Compositions and Source Apportionment. Environ. Pollut. 271, 116298. doi:10.1016/j.envpol.2020.116298
Wang, K., Qi, D., Gao, L., and Weng, Z. M. (2021). Analysis of the Effects of the Topography of Eastern Zhejiang on the Extreme Precipitation of Typhoon Lekima. J. Meteorol. Sci. 41, 162–171. doi:10.12306/2019jms.0071
Weissmann, M., Harnisch, F., Wu, C.-C., Lin, P.-H., Ohta, Y., Yamashita, K., et al. (2011). The Influence of Assimilating Dropsonde Data on Typhoon Track and Midlatitude Forecasts. Mon. Wea. Rev. 139 (3), 908–920. doi:10.1175/2010MWR3377.1
Xie, P., and Xiong, A.-Y. (2011). A Conceptual Model for Constructing High-Resolution Gauge-Satellite Merged Precipitation Analyses. J. Geophys. Res. 116 (D21), 1–14. doi:10.1029/2011JD016118
Ying, M., Zhang, W., Yu, H., Lu, X., Feng, J., Fan, Y., et al. (2014). An Overview of the China Meteorological Administration Tropical Cyclone Database. J. Atmos. Oceanic Technol. 31 (2), 287–301. doi:10.1175/JTECH-D-12-00119.1
Zhao, Y. (2012). Numerical Investigation of a Localized Extremely Heavy Rainfall Event in Complex Topographic Area during Midsummer. Atmos. Res. 113, 22–39. doi:10.1016/j.atmosres.2012.04.018
Zhu, Q., Lin, J., Shou, S., and Tang, D. (2000). Principles and Methods of Weather. Beijing: China Meteorological Press.
Keywords: typhoon Maysak, extreme precipitation, Changbai mountain, topography, numerical simulation
Citation: Zhu D, Zhi X, Wang N, Chen C, Tian X and Yu Y (2022) Impacts of Changbai Mountain Topography on the Extreme Precipitation From Super Typhoon Maysak. Front. Environ. Sci. 9:818402. doi: 10.3389/fenvs.2021.818402
Received: 19 November 2021; Accepted: 08 December 2021;
Published: 17 January 2022.
Edited by:
Lijuan Shen, University of Toronto, CanadaReviewed by:
Jinqing Zuo, National Climate Center, ChinaCopyright © 2022 Zhu, Zhi, Wang, Chen, Tian and Yu. This is an open-access article distributed under the terms of the Creative Commons Attribution License (CC BY). The use, distribution or reproduction in other forums is permitted, provided the original author(s) and the copyright owner(s) are credited and that the original publication in this journal is cited, in accordance with accepted academic practice. No use, distribution or reproduction is permitted which does not comply with these terms.
*Correspondence: Xiefei Zhi, emhpQG51aXN0LmVkdS5jbg==
Disclaimer: All claims expressed in this article are solely those of the authors and do not necessarily represent those of their affiliated organizations, or those of the publisher, the editors and the reviewers. Any product that may be evaluated in this article or claim that may be made by its manufacturer is not guaranteed or endorsed by the publisher.
Research integrity at Frontiers
Learn more about the work of our research integrity team to safeguard the quality of each article we publish.