- School of Finance, Shandong University of Finance and Economics, Jinan, China
How to utilize financial instrument to deal with environmental issues has been a focal topic. Taking the introduction of green credit program as a “quasi-natural experiment,” the propensity score matching and difference-in-difference approach (PSM-DID) are used to investigate the impact of the green credit policy implemented by Chinese government on firm-level industrial pollutant emissions. The estimation results indicate that the green credit policy significantly reduces corporate sulfur dioxide emissions. Heterogeneity analysis shows this impact is more pronounced for large-scale enterprises and enterprises located in the eastern region. The estimated mediation models reveal that after the implementation of the green credit policy, reduction in sulfur dioxide emissions can be attribute to the increased environmental investment and improved energy consumption intensity. Moreover, the green credit policy is also significantly effective in mitigating the discharge of other common industrial pollutants. Our findings highlight the importance of green credit policies in achieving greener industrial production and more sustainable economic development.
1 Introduction
As the largest developing country, China’s booming economy development accounts for a large proportion of the world’s energy consumption and pollutant emissions (Yan and Toshihiko, 2009). It is well known that air pollutant emissions impose a negative impact on both human health and environmental quality (Hollingsworth et al., 2021) and a strong spatial spillover effect, which leads to a wider range of harm to the society (Liu et al., 2017). Therefore, air pollution has caused major concerns (Wang L. et al., 2021). Achieving environmental sustainability is urgent issue especially for emerging and developing economies (Nawaz et al., 2020). Level of air pollutant emissions depend on many factors, including energy consumption, financial development, transportation infrastructure, etc. (Nawaz et al., 2020; Umar et al., 2020). Shen et al. (2020) noted that China’s air pollution mainly comes from its large consumption of fossil energy, such as coal and fuel oil. Previous studies also find that both international export and interprovincial trade exacerbate the health burdens of air pollution in China’s less developed interior provinces (Wang et al., 2017). In addition, population density is also an important factor affecting air pollution in China (Chen et al., 2020). Therefore, it can be inferred that air pollution is caused by a combination of many factors.
It is the common responsibility of all countries in the world to promote the green and sustainable development of the global economy. Ma and He (2016) have found that a license plate-based traffic control measure implemented in Beijing in 2008 has effectively improved air quality, though the long-term impacts of this policy remain controversial. Davis and Lucas (2017) have evaluated the effects of traffic control in Mexico City, note that there is little evidence supports that the program has improved air quality. On the contrary, air pollution becomes more serious on weekends. Kumar and Foster (2015) have studied the impact of New Delhi’s air quality control on the distribution of air pollutants. They find that the air quality in New Delhi has been improved, while is deteriorated in the surrounding areas. The reason for this deterioration is that environmental regulations have caused the high-polluting industries in New Delhi to move to the surrounding areas. The air quality in those areas has thus become worse. These studies have explored the relationship between command-control environmental regulation and air quality, but ignored the discussion of market-oriented environmental regulation tools. Wu et al. (2017) also have found that the strict environmental policy accelerates the transfer of pollution, which may cause worse damage to the more fragile ecosystem in the western provinces. In initial studies, the focus was on using SO2 emissions and energy consumption to measure environmental impact (Kihombo et al., 2021), relevant research has been gradually enriched in recent years.
The green credit policy is an important part of China’s national environmental governance system. It supplements the traditional environmental regulation toolbox (Zhang et al., 2021). This policy was formally implemented in 2007. The literature has studied the impacts of this policy on economic development (Wang Y. et al., 2021) and corporate investment (Liu et al., 2015). And, several studies have found that the green credit policy imposes positive impact on environmental quality (Sun et al., 2019). Nevertheless, prior researches are insufficient in investigating the mechanisms that how the green credit policy works. In fact, the fossil fuel energy consumption and green investment have significant impact on air quality (Rafindadi et al., 2014). Our study attempts to fill this research gap and make an in-depth analysis on the mechanisms that how green credit policy affect pollutant emissions. Our findings are designated to provide reference for developing countries to reduce industrial pollutant emissions.
We chose sulfur dioxide (SO2) emissions as our explained variable for the following reasons: first, sulfur dioxide is a typical air pollutant, and regulation for SO2 emission has become a key policy agenda in China (Kim and Lee, 2015; Chen and Yan, 2020). Second, SO2 imposes a negative impact on human health and environmental quality (Yan and Wu, 2017). Third, compared with other air pollutants, the dataset of SO2 emission contains much less missing values. SO2 emission has been chosen as explained variable to ensure robust empirical results. In addition to our main empirical analysis, the effects of green credit policy on other industrial pollutants are also examined.
Our study is motivated by the implementation of green credit policy in China. We aim to explore whether the green credit policy imposes SO2 emission reduction effect on industrial firms. To identify the relationship between the implementation of green credit policy and level of SO2 emissions, we apply a PSM-DID approach to a dataset contains 121,163 Chinese industrial firms during the period of 1999–2013. We have found that the green credit policy can significantly reduce SO2 emissions in high-polluting industries, implying this policy is highly effective in improving air quality. The results also suggest that green credit policy affects SO2 by curbing energy consumption, such as reducing the use of fuel and coal. At the same time, it also enhances the motivation of enterprises to take environmental responsibility and promotes the upgrading of production technology.
The contribution of this research lies in the following three aspects: first, we construct a unique dataset by matching survey data of polluting firms with the annual survey of industrial firms. The dataset includes more than 120,000 industrial enterprises in China. Therefore, it is possible to excavate deeper into the relationship between the green credit policy and SO2 emissions. More rigorous conclusions can be drawn from our empirical analysis. Second, green credit policy is market-oriented, which is different from traditional environmental regulations. Our study enriches the literature on the evaluation of environmental protection policies. Finally, based on China’s institutional background, we thoroughly analyze the two channels through which the green credit policy takes effect. Our mechanism analysis provides better understanding of the channels through which green credit policy change the level of firm SO2 emissions.
The remainder of this paper is organized as follows. Section 2 introduces background and develops our hypotheses. Section 3 discusses our research design and provides the descriptive sample statistics. Section 4 reports the empirical results. Finally, Section 5 concludes our paper.
2 Literature Review and Hypotheses
2.1 Green Credit Policy and SO2 Emission
In 2007, the State Environmental Protection Administration and the China Banking Regulatory Commission adopted green credit to curb the expansion of high-pollution and energy-intensive industries and promulgated the “Opinions on Implementing Environmental Protection Policies and Regulations to Prevent Credit Risks.” Green credit policy integrates economic decisions with environmental decisions to arrive at optimally beneficial outcomes (Wang and Zhi, 2016). Wang Y. et al. (2021) note that the implementation of green credit policies can improve economic performance and reduce pollutant emission, which is an effective way to achieve sustainable economic development. The green credit policy incorporates environmental risks into the credit management framework, and more credit funds are invested in low-carbon green industries (Cao et al., 2021).
Green credit is an important supplement to the traditional administrative environmental regulations. It affects sulfur dioxide emissions in two ways. On one hand, the green credit policy has a punitive effect on enterprises sulfur dioxide emissions. Enterprises with high energy consumption intensity and level of pollution usually face tight financing constraints. The green credit policy curbs investment in industries that consume large amount of energy (Liu et al., 2015). These industries are also under strict environmental regulations. On the other hand, the green credit policy creates incentives for enterprises to realize energy conservation and emission reduction. Sun et al. (2019) note that to obtain credit, companies are motivated to adopt green and low-carbon production techonologies. Our main research hypothesis is as follows:
H1: Green credit policies can significantly reduce the SO2 emissions of enterprises.
2.2 The Mediation Effect of Energy Consumption Intensity
In recent years, with its rapid economic development, China’s energy consumption has been rising quickly. As a result, air pollution has become a serious problem (Shen et al., 2020). Jiang et al. (2019) note that coal use, population, area, and thermal power can significantly increase national air pollution. Among these, coal consumption has had the biggest impact on national SO2 concentration. It is possible that replacing traditional energy with renewable energy is an effective measure for controlling environmental pollution (Su et al., 2021a). Moreover, the transition to renewable energy is beneficial to the energy supply and reduce geopolitical risks (Su et al., 2021b). The green credit policy mainly adjusts the energy consumption structure of enterprises through resource credit rationing. If companies do not restrict the consumption of non-renewable energy, such as coal and fuel oil, they will face higher financing constraints. After the implementation of the green credit policy, companies are more inclined to reduce fossil energy consumption. Therefore, the green credit policy will impose strict credit constraints on high-polluting companies, forcing them to reduce energy consumption and investment and convert to energy-saving and environmentally friendly practices. Based on the discussion above, we hypothesize the following:
H2: Energy consumption intensity mediates the reduction effect of green credit policy on SO2 emissions.
2.3 The Mediation Effect of Corporate Environmental Investment
Studies have documented that environmental policies affect corporate behavior (Albrizio et al., 2017; Ji et al., 2017). Green credit policy influence corporate environmental investment through the channels of credit supply and financial constraint. Green credit policy puts enterprises under greater financial pressure regarding environmental governance. Polluting companies will face tight financing constraints, which can only be eased for the companies to increase green investment. The government subsidies and credit supply create incentives for companies’ environmental investment. As a result, technological innovation can be carried out, which will impose a positive impact on environment (Ran et al., 2021). A large number of literatures emphasize the important role of technological innovation in improving the environment (such as Samargandi, 2017; Yu and Du, 2019). However, it is ignored that the environmental investment is necessary condition for technological upgrades. Although corporate environmental protection investment has increased costs in the short-term, this environmental governance behavior can generate greater social and environmental benefits and has won the support of stakeholders including capital market investors. Managers anticipate investors’ reaction and thus overwhelmingly disclose their investment and tend to focus their disclosure on the societal benefits of the investment rather than on the cost to the company (Martin and Moser, 2016). Sun et al. (2019) note that the green credit policy is an important tool to drive companies to assume environmental responsibility. Therefore, we have developed the third hypothesis as follows:
H3: Corporate environmental investment mediates the reduction effect of green credit policy on SO2 emissions.Based on the above discussion, we hypothesize that green credit policy affects SO2 emission through energy consumption intensity and environmental investment. The specific impact paths are depicted in Figure 1.
3 Methodology and Data
3.1 Model Specification
3.1.1 Propensity Score Matching
We choose the one-to-one nearest neighbor approach to match the sample firms according to the propensity score value. Moreover, we selected the financial leverage, company age, return on assets, fixed assets, management expense as the matching characteristic variables. A logit regression has been constructed to perform the propensity score matching as follows:
In model (1),
3.1.2 Difference-in-Difference Estimation
To investigate the effects of the green credit policy on SO2 emission, we estimate the following Difference-in-Difference model:
The dependent variable is
3.2 Variable Definition
3.2.1 Dependent Variable
The dependent variable in this research is sulfur dioxide emissions, which are calculated by the natural logarithm of sulfur dioxide emissions from industrial enterprises. The data comes from the Annual Environmental Survey of Polluting Firms (AESPF) of China.
3.2.2 Independent Variable
The independent variable is the green credit policy, which is an indicator to reveal whether the firm’s industry has implemented the green credit policy. Policy = 1 if the firm’s industry has implemented the green credit policy, and Policy = 0 otherwise.
3.2.3 Control Variables
According to Xing et al. (2020), the control variables in this paper include corporate financial leverage, return on assets, corporate age, the proportion of fixed assets in sales revenue, the proportion of management expenses, and the company’s properties. These data are obtained from the National Bureau of Statistics. Table 1 reports the variable description and our data sources.
3.3 Data Sources
3.3.1 Firm Level Pollution Data
The data on firms’ pollution emissions comes from Annual Environmental Survey of Polluting Firms (AESPF).3 Established by the Ministry of Ecology and Environment (formerly known as the Ministry of Environmental Protection) in the 1980s in a bid to document the state of environmental pollution and abatement in China, AESPF provides information on firms’ environmental performance, including the emission of main pollutants, pollution treatment equipment and information of energy consumptions.
3.3.2 Other Firm-Level Data
We match AESPF dataset with the Annual Survey of Industrial Firms (ASIF), which is one of the most comprehensive and widely used Chinese firm-level dataset maintained by the National Bureau of Statistics of China (NBSC). ASIF dataset surveys industrial firms with annual sales above 5 million RMB. It contains detailed financial and characteristical information. After eliminating outliers and excluding records which violate the accounting standards, we obtain a panel of 455,902 observations for 121,163 unique firms.4
3.4 Descriptive Statistics
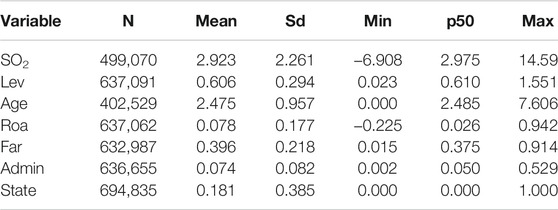
The descriptive statistics of variables are reported in Table 2. The mean value of the SO2 emissions is 2.923, and the standard deviation is 2.261, indicating that there are significant differences among firms.
4 Empirical Results
4.1 Main Results
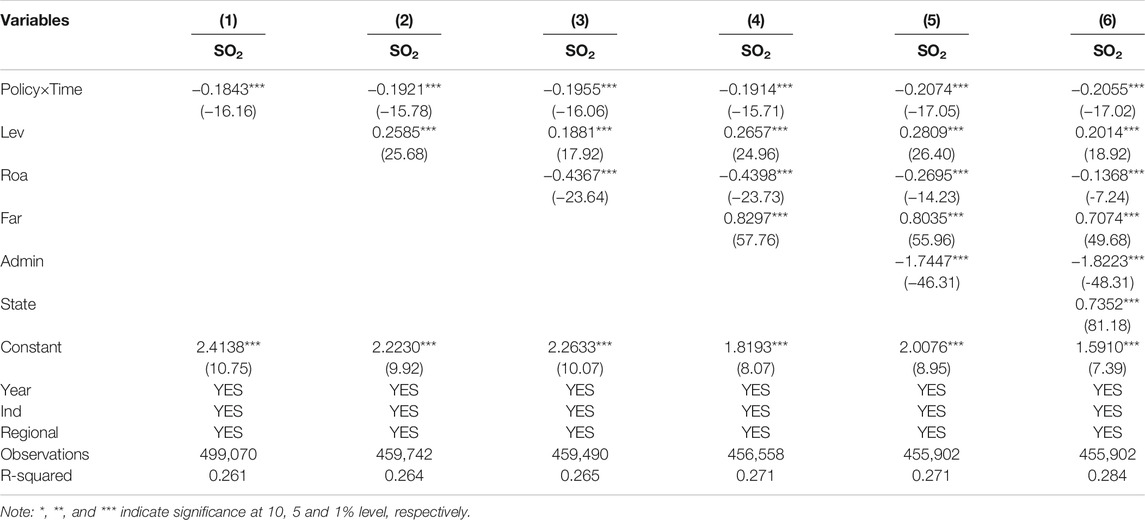
Table 3 reports the results of the PSM-DID regression of the main analysis. Column (1) shows that the coefficients on the interaction between Policy and Time (Policy*Time) are significantly negative at a 1% level without adding any control variables. After gradually adding variables that may affect SO2 emissions, and controlling time, industry, and regional effects, estimation results showthat the coefficients of Policy*Time are significantly negative in all settings. The implementation of the green credit policy reduced SO2 emissions from industrial firms in China. Firms in areas where the green credit policy has been implemented show better environmental performance. Our results consistent withUmar et al. (2020). They argue that financial development can reduce carbon dioxide emissions. It is noted that financial resources should be allocated to environmentally-friendly sectors of the economy. Green technologies are long-term projects that require financing, especially the support from green finance.
4.2 Test for Assumption of Parallel Trend
The necessary precondition for the validity of the PSM-DID model is that the treatment group and the control group are assumed to have a parallel trend before treatment effect takes place. Instead of one discrete policy dummy, we instantiate a series of pre- and post-treatment dummies. The model is set as follows:
where
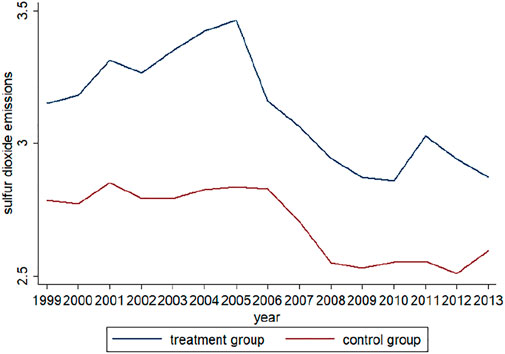
The trends of sulfur dioxide emissions for the treatment group and the control group are shown in Figure 2. Indeed, it is not feasible to identify a common trend before the implementation of the green credit policy from the visual representations of the data. We estimate model (3) to test against the hypothesis of existence of parallel trend. The estimation results are presented in Figure 3.
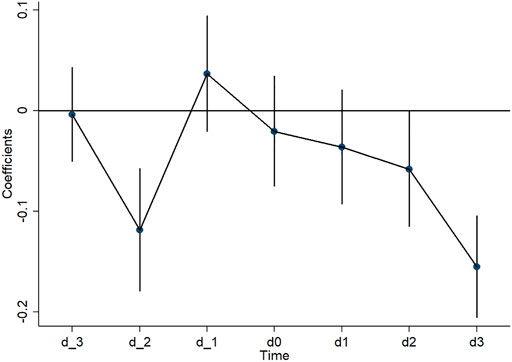
FIGURE 3. Test results for the assumption of parallel trend. Notes: d0 represents the year in which green credit policy implemented. d_3, d_2, d_1 represent three, two and 1 year before the policy is implemented, respectively. d3, d2, and d1 represent one, two and 3 year after the policy is implemented, respectively.
As shown in Figure 3, the dot represents the value of the estimated coefficient, while the vertical line represents the confidence interval. It is documented that the curves of the treatment group and the control group of the full sample were almost parallel before policy implementation. However, the SO2 emissions of the treatment group were lower than that of the control group, and the gap between the two trends increased noticeably. This result proves that the PSM-DID model is an appropriate method to test the impact of the green credit policy on SO2 emissions.
4.3 Heterogeneity
4.3.1 Regional Heterogeneity
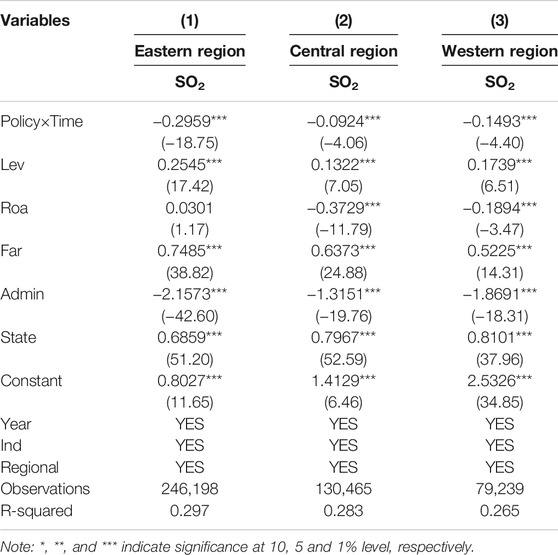
In China, there are obvious differences in the natural environment, social development, and economic level in different regions. Therefore, this research further analyzes and compares the regional differences in the impact of green credit policies on SO2 emissions. Table 4 reports the impact of green credit policies on SO2 emissions in these three regions. Columns (1) to (3) contain coefficients estimates for the three regions respectively. The coefficients of SO2 emissions in all columns imply that the green credit policy imposes significant inhibitory effects on SO2 emissions across the three regions. By comparing the absolute value of the coefficients, we find that the SO2 emission reduction effect the green credit policy is strongest in the eastern region and weakest in the central region. One possible reason for this difference is that the financial infrastructure in the eastern region is ideal, which has created a strong foundation for the implementation of the green credit policy. However, the economic growth pressure in the central region is high, so green credit has less effect in restraining the flow of funds to high-polluting enterprises. Thus, the effect of green credit on reducing industrial environmental pollution is small.
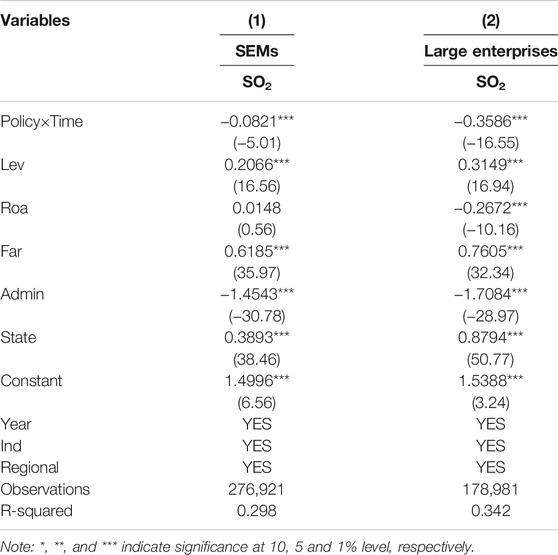
4.3.2 Corporate Size Heterogeneity
Companies of different sizes have large differences in operating efficiency, internal control, and financing capabilities, which in turn affects the impact of green credit policies on SO2 emissions. This study divides the full sample into two sub-sample groups of small and medium-sized enterprises and large enterprises. Table 5 reports the regression results. The results show that the green credit policy has a significant inhibitory effect on sulfur dioxide emissions in the two sub-sample groups, and the impact on large enterprises is more significant. This difference may be attributed to the fact that the business strategies and management of large enterprises are often more susceptible to the overall interests of the government, and they can actively cooperate with the implementation of government policies and better meet the environmental requirements than smaller enterprises. This corroborates with the work of Woo et al. (2014) who argued that large firms implement environmental activities more than small ones.
4.4 Mechanisms
The benchmark regression shows that the green credit policy leads to lower SO2 emissions. In this section, we further explore the possible mechanism behind this relationship. According to the above theoretical analysis, enterprises mainly achieve reductions in SO2 emissions by reducing energy consumption intensity and increasing environmental investment.
According to Fan et al. (2021), the first stage is to verify the impact of the green credit policy on the two major effects. A mediation model is constructed to test the effects of policy variables on mediating variables, see model (4).
The second stage is to verify the effect of two major effect of the green credit policy on SO2 emissions by setting up a comprehensive model (5) based on the mediating model (4). It takes a certain amount of time for environmental protection investment to turn into real capital, which contributes to firm emission reduction. So, the mediator Ginvest enters the regression with one period lag. If
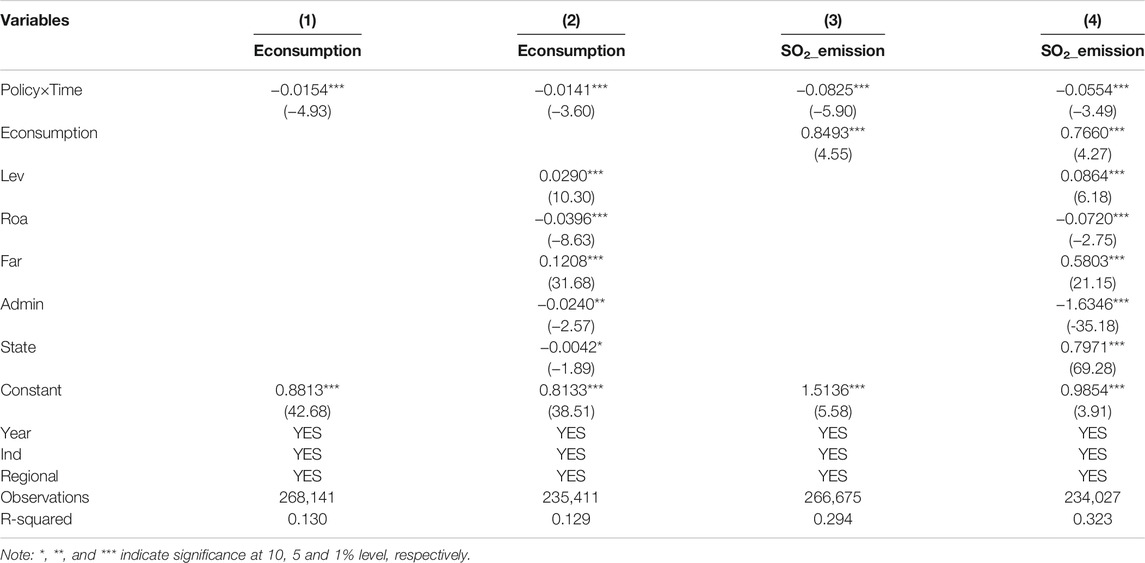
4.4.1 Energy Consumption Intensity
Using Korean data, Park and Lee (2011) find that energy consumption seems to be the most significant variable in explaining air pollution. Indeed, industrialized production and corresponding energy consumption in China are also the main sources of sulfur dioxide emission (Jiang et al., 2019). We use coal consumption intensity (total coal consumption/total industrial output value) as proxy indicators of energy consumption intensity to test the intermediary effect of energy consumption. Table 6 reports the regression results. Columns (1) and (2) show that the green credit policy can significantly decrease SO2 emissions whether control variables are added or not. In columns (3) and (4), The coefficient of Policy×Time is significantly negative while the coefficient of
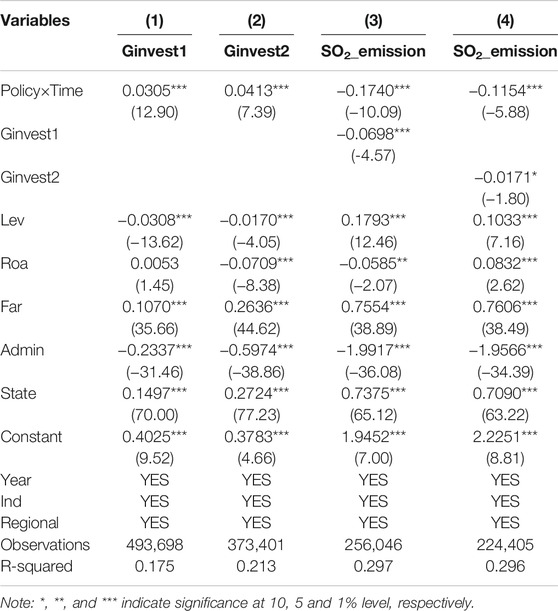
4.4.2 Corporate Environmental Investment
Research by Yu and Du (2019) showed that technical equipment upgrade is closely related to the reduction of carbon emissions. Similarly, Samargandi (2017) pointed technological innovations in production actives has made more significant contributions to the reduction of pollutant emissions. We use log difference of the number of wastewater treatment facilities and the number of waste gas facilities as proxy variables for corporate environmental investment. The regression results are reported in Table 7. The positively significant coefficients of treatment variable in columns (1) and (2) imply that the green credit policy raises the corporate environmental investment. Columns (3) and (4) test the effect of environment investment on SO2 emissions. The coefficients of
4.5 The Green Credit Policy and Other Pollutant Discharges
This research mainly focuses on the impact of green credit policy on sulfur dioxide emission. However, we are also interested in the question that whether green credit policy also imposes mitigating effect on other industrial pollutants. In line with Huang (2012), this paper further investigates the impact of green credit policies on other pollutant discharges, including industrial smoke, industrial dust, ammonia nitrogen compounds, and chemical oxygen demand (COD). COD is a measure for the amount of organic pollutants in wastewater, while other pollutant discharges are sources of air pollution. The empirical model is as follow:
Estimation results are presented in Table 8. The estimated coefficients for all pollutants mentioned above are negative with a significant level at the 1%. Results imply that the green credit policy also imposes a significant mitigating effect on other pollution discharges.
5 Conclusion and Implications
This paper investigates whether China’s green credit policy contributes to the reduction of firms’ SO2 emissions. We hypothesize that the implementation of green credit policies can negatively affect SO2 emissions. To establish causality, we employ aPSM-DID method to explore the impact of the green credit policy on SO2 emissions based on the data of Chinese industrial enterprises. Our estimation indicates the implementation of the green credit policy has successfully reduced firm level SO2 emissions. The effects of the green credit policy on SO2 emissions are more pronounced for large enterprises and enterprises in the eastern region. We also find that the green credit policy reduces SO2 emissions by reducing energy consumption and encouraging environmental investment.
Our results provide several policy implications. First, faced with the challenge of reducing polluting gas emissions in absolute terms, the Chinese government should formulate green financial policies based on local conditions and provide credit resources to favor environmentally-friendly companies. With the deepening of China’s market-oriented reforms, green credit policies will play a greater role in improving environmental quality. For financial credit institution, they should strictly implement green credit standards and modify financial products and services. Traditional environmental regulations may not achieve the expected environmental protection and emission reduction effects. Future environmental policies should focus on market-oriented emission reduction methods, and use market tools to restrict pollution emissions.
Secondly, it is very important to strengthen the coordinated economic development of different regions, the construction of financial infrastructure in the central and western regions needs to be improved, to maximize the energy saving and emission reduction of the green credit policy. At the same time, the local authorities should provide a fair competitive external environment for small and medium-sized enterprises. Specifically, policy makers should design differentiated green credit policies for companies of different sizes, which will help them actively assume environmental responsibility and eliminate outdated production capacity.
Finally, energy structure and energy consumption intensity directly affect sulfur dioxide emissions of industrial enterprises, so it should vigorously promote the development of clean energy industries and reduce the use of fossil fuels. An effective measure is to allocate more financial resources to the environmental-friendly industry through the green credit policy. When companies receive external financial support, they are more motivated to carry out green innovations and improve pollution treatment capabilities.
Although this paper has discovered and discussed the negative relationship between green credit policy and industrial pollutant emissions, further investigation is necessary. Future research may aim to answer the question that how financial institutions can help facilitating green credit and promoting the green development of economy.
Data Availability Statement
The original contributions presented in the study are included in the article/Supplementary Material, further inquiries can be directed to the corresponding author.
Author Contributions
ZX: conceptualization, validation, resources, data curation, funding acquisition and writing original draft. LY: methodology, software, writing—review and editing, and visualization. YL: formal analysis, data curation, and investigation. XB: writing—review and editing, supervision, project administration, and funding acquisition. ZY: software, visualization, investigation and resources. All authors: contributed to the article and approved the submitted version.
Conflict of Interest
The authors declare that the research was conducted in the absence of any commercial or financial relationships that could be construed as a potential conflict of interest.
Publisher’s Note
All claims expressed in this article are solely those of the authors and do not necessarily represent those of their affiliated organizations, or those of the publisher, the editors and the reviewers. Any product that may be evaluated in this article, or claim that may be made by its manufacturer, is not guaranteed or endorsed by the publisher.
Acknowledgments
We acknowledge the financial support from Shandong Provincial Natural Science Foundation (Grant Number: ZR2020QG032), Shandong Provincial Social Science Planning Office (Grant Numbers: 21DGLJ12; 21DJJJ02), Taishan Scholars Program of Shandong Province, China (Grant Numbers: ts201712059; tsqn201909135) and Youth Innovative Talent Technology Program of Shandong Province, China (Grant Number: 2019RWE004). All errors remain our own.
Footnotes
1Source: http://jjckb.xinhuanet.com/wzpd/2007-07/30/content_60171.htm.
2The six major industries include: petrochemical, chemical, building materials, steel, non-ferrous and power industries.
3Lacking of an official English name, this dataset was also called as China Environmental Statistics dataset (CESD) (Zhang et al., 2018) or Environmental Statistics Data (ESD) (Wu et al., 2017).
4We exclude firms with missing values in SO2 emissions.
References
Albrizio, S., Kozluk, T., and Zipperer, V. (2017). Environmental Policies and Productivity Growth: Evidence across Industries and Firms. J. Environ. Econ. Management 81, 209–226. doi:10.1016/j.jeem.2016.06.002
Cao, Y., Zhang, Y., Yang, L., Li, R. Y. M., and Crabbe, M. J. C. (2021). Green Credit Policy and Maturity Mismatch Risk in Polluting and Non-polluting Companies. Sustainability 13, 3615. doi:10.3390/su13073615
Chen, J., Wang, B., Huang, S., and Song, M. (2020). The Influence of Increased Population Density in China on Air Pollution. Sci. Total Environ. 735, 139456. doi:10.1016/j.scitotenv.2020.139456
Chen, W., and Yan, W. (2020). Impact of Internet Electronic Commerce on SO2 Pollution: Evidence from China. Environ. Sci. Pollut. Res. 27 (1), 25801–25812. doi:10.1007/s11356-020-09027-1
Davis, L. W., and Lucas, W. (2017). Saturday Driving Restrictions Fail to Improve Air Quality in Mexico City. Sci. Rep. 7, 41652. doi:10.1038/srep41652
Fan, H., Tao, S., and Hashmi, S. H. (2021). Does the Construction of a Water Ecological Civilization City Improve Green Total Factor Productivity? Evidence from a Quasi-Natural Experiment in China. Ijerph 18 (22), 11829. doi:10.3390/ijerph182211829
Hollingsworth, A., Konisky, D., and Zirogiannis, N. (2021). The Health Consequences of Excess Emissions: Evidence from Texas. OSF Preprints. doi:10.31219/osf.io/gc73x
Huang, C. (2012). The Impact of Local Environmental Quality on International Tourism Demand: The Case of China. Master's thesis. San Francisco: University of San Francisco. Available at: https://repository.usfca.edu/thes/21.
Ji, X., Li, G., and Wang, Z. (2017). Impact of Emission Regulation Policies on Chinese Power Firms' Reusable Environmental Investments and Sustainable Operations. Energy Policy 108, 163–177. doi:10.1016/j.enpol.2017.05.035
Jiang, J., Zha, Y., and Li, L. (2019). Simulation Analysis of Atmospheric SO2 Contributions from Different Regions in China. Atmos. Pollut. Res. 10, 913–920. doi:10.1016/j.apr.2018.12.019
Kihombo, S., Ahmed, Z., Chen, S., Adebayo, T. S., and Kirikkaleli, D. (2021). Linking Financial Development, Economic Growth, and Ecological Footprint: what Is the Role of Technological Innovation? Environ. Sci. Pollut. Res. 28, 61235–61245. doi:10.1007/s11356-021-14993-1
Kim, K. Y., and Lee, J. S. (2015). An Analysis of the Impact of China's Pollution Reduction Policy on Sulfur Dioxide Emissions. ksccr 6 (4), 367–377. doi:10.15531/KSCCR.2015.6.4.367
Kumar, N., and Foster, A. D. (2009). Air Quality Interventions and Spatial Dynamics of Air Pollution in Delhi and its Surroundings. Ijewm 4 (1-2), 85–111. doi:10.1504/IJEWM.2009.026886
Liu, H., Fang, C., Zhang, X., Wang, Z., Bao, C., and Li, F. (2017). The Effect of Natural and Anthropogenic Factors on Haze Pollution in Chinese Cities: A Spatial Econometrics Approach. J. Clean. Prod. 165, 323–333. doi:10.1016/j.jclepro.2017.07.127
Liu, J.-Y., Xia, Y., Fan, Y., Lin, S.-M., and Wu, J. (2017). Assessment of a green Credit Policy Aimed at Energy-Intensive Industries in China Based on a Financial CGE Model. J. Clean. Prod. 163, 293–302. doi:10.1016/j.jclepro.2015.10.111
Ma, H., and He, G. (2016). Effects of the Post-Olympics Driving Restrictions on Air Quality in Beijing. Sustainability 8 (9), 902. doi:10.3390/su8090902
Martin, P. R., and Moser, D. V. (2016). Managers' green Investment Disclosures and Investors' Reaction. J. Account. Econ. 61 (1), 239–254. doi:10.1016/j.jacceco.2015.08.004
Nawaz, M. A., Seshadri, U., Kumar, P., Aqdas, R., Patwary, A. K., and Riaz, M. (2020). Nexus between green Finance and Climate Change Mitigation in N-11 and BRICS Countries: Empirical Estimation through Difference in Differences (DID) Approach. Environ. Sci. Pollut. Res. 28, 6504–6519. doi:10.1007/s11356-020-10920-y
Park, S., and Lee, Y. (2011). Regional Model of EKC for Air Pollution: Evidence from the republic of Korea. Energy Policy 39 (10), 5840–5849. doi:10.1016/j.enpol.2011.06.028
Rafindadi, A. A., Yusof, Z., Zaman, K., Kyophilavong, P., and Akhmat, G. (2014). The Relationship between Air Pollution, Fossil Fuel Energy Consumption, and Water Resources in the Panel of Selected Asia-Pacific Countries. Environ. Sci. Pollut. Res. 21 (19), 11395–11400. doi:10.1007/s11356-014-3095-1
Samargandi, N. (2017). Sector Value Addition, Technology and CO2 Emissions in Saudi Arabia. Renew. Sustainable Energ. Rev. 78, 868–877. doi:10.1016/j.rser.2017.04.056
Shen, N., Wang, Y., Peng., H., and Hou, Z. (2020). Renewable Energy green Innovation, Fossil Energy Consumption, and Air Pollution-Spatial Empirical Analysis Based on China. Sustainability 12 (16), 6397. doi:10.3390/su12166397
Su, C.-W., Khan, K., Umar, M., and Zhang, W. (2021b). Does Renewable Energy Redefine Geopolitical Risks? Energy Policy 158 (6), 112566. doi:10.1016/j.enpol.2021.112566
Su, C.-W., Yuan, X., Tao, R., and Umar, M. (2021a). Can New Energy Vehicles Help to Achieve Carbon Neutrality Targets? J. Environ. Manage. 297, 113348. doi:10.1016/j.jenvman.2021.113348
Sun, J., Wang, F., Yin, H., and Zhang, B. (2019). Money Talks: the Environmental Impact of China's green Credit Policy. J. Pol. Anal. Manage. 38, 653–680. doi:10.1002/pam.22137
Tao, R., Umar, M., Naseer, A., and Razi, U. (2021). The Dynamic Effect of Eco-Innovation and Environmental Taxes on Carbon Neutrality Target in Emerging Seven (E7) Economies. J. Environ. Manage. 299, 113525. doi:10.1016/j.jenvman.2021.113525
Umar, M., Ji, X., Kirikkaleli, D., and Xu, Q. (2020). COP21 Roadmap: Do Innovation, Financial Development, and Transportation Infrastructure Matter for Environmental Sustainability in China? J. Environ. Manage. 271, 111026. doi:10.1016/j.jenvman.2020.111026
Wang, H., Zhang, Y., Zhao, H., Lu, X., Zhang, Y., Zhu, W., et al. (2017). Trade-driven Relocation of Air Pollution and Health Impacts in China. Nat. Commun. 8 (1), 738. doi:10.1038/s41467-017-00918-5
Wang, K.-H., Su, C.-W., Lobonţ, O.-R., and Umar, M. (2021). Whether Crude Oil Dependence and Co2 Emissions Influence Military Expenditure in Net Oil Importing Countries? Energy Policy 153, 112281. doi:10.1016/j.enpol.2021.112281
Wang, L., Wang, H., Dong, Z., Wang, S., and Cao, Z. (2021). The Air Pollution Effect of Government Economic Growth Expectations: Evidence from China's Cities Based on green Technology. Environ. Sci. Pollut. Res. 28, 27639–27654. doi:10.1007/s11356-021-12536-2
Wang, Y., Lei, X., Zhao, D., Long, R., and Wu, M. (2021). The Dual Impacts of green Credit on Economy and Environment: Evidence from China. Sustainability 13 (8), 4574. doi:10.3390/su13084574
Wang, Y., and Zhi, Q. (2016). The Role of green Finance in Environmental protection: Two Aspects of Market Mechanism and Policies. Energ. Proced. 104, 311–316. doi:10.1016/j.egypro.2016.12.053
Woo, C., Chung, Y., Chun, D., Han, S., and Lee, D. (2014). Impact of green Innovation on Labor Productivity and its Determinants: an Analysis of the Korean Manufacturing Industry. Bus. Strat. Env. 23 (8), 567–576. doi:10.1002/bse.1807
Wu, H., Guo, H., Zhang, B., and Bu, M. (2017). Westward Movement of New Polluting Firms in China: Pollution Reduction Mandates and Location Choice. J. Comp. Econ. 45 (1), 119–138. doi:10.1016/j.jce.2016.01.001
Xing, C., Zhang, Y., and Wang, Y. (2020). Do banks Value green Management in China? the Perspective of the green Credit Policy. Finance Res. Lett. 35, 101601. doi:10.1016/j.frl.2020.101601
Xu, Y., and Masui, T. (2009). Local Air Pollutant Emission Reduction and Ancillary Carbon Benefits of SO2 Control Policies: Application of AIM/CGE Model to China. Eur. J. Oper. Res. 198 (1), 315–325. doi:10.1016/j.ejor.2008.07.048
Yan, S., and Wu, G. (2017). SO2 Emissions in China - Their Network and Hierarchical Structures. Sci. Rep. 7, 46216. doi:10.1038/srep46216
Yu, Y., and Du, Y. (2019). Impact of Technological Innovation on CO2 Emissions and Emissions Trend Prediction on 'New Normal' Economy in China. Atmos. Pollut. Res. 10, 152–161. doi:10.1016/j.apr.2018.07.005
Zhang, B., Chen, X., and Guo, H. (2018). Does central Supervision Enhance Local Environmental Enforcement? Quasi-Experimental Evidence from China. J. Public Econ. 164, 70–90. doi:10.1016/j.jpubeco.2018.05.009
Keywords: green credit policy, SO2 emissions, environmental investment, energy consumption intensity, PSM-DID
Citation: Xiao Z, Yu L, Liu Y, Bu X and Yin Z (2022) Does Green Credit Policy Move the Industrial Firms Toward a Greener Future? Evidence From a Quasi-Natural Experiment in China. Front. Environ. Sci. 9:810305. doi: 10.3389/fenvs.2021.810305
Received: 06 November 2021; Accepted: 20 December 2021;
Published: 12 January 2022.
Edited by:
Tsun Se Cheong, Hang Seng University of Hong Kong, Hong Kong SAR, ChinaReviewed by:
Shujahat Haider Hashmi, Bahria University, PakistanDervis Kirikkaleli, European University of Lefka, Turkey
Copyright © 2022 Xiao, Yu, Liu, Bu and Yin. This is an open-access article distributed under the terms of the Creative Commons Attribution License (CC BY). The use, distribution or reproduction in other forums is permitted, provided the original author(s) and the copyright owner(s) are credited and that the original publication in this journal is cited, in accordance with accepted academic practice. No use, distribution or reproduction is permitted which does not comply with these terms.
*Correspondence: Xiaoning Bu, YnV4aWFvbmluZ0BzZHVmZS5lZHUuY24=
 Zumian Xiao
 Lu Yu
Lu Yu

