 Ke Wu
Ke Wu- 1Institute of Geophysics and Geomatics, China University of Geosciences, Wuhan, China
- 2Bureau of Geology and Mineral Exploration of Anhui Provincial, Hefei, China
- 3National Satellite Ocean Application Service, Ministry of Natural Resources, Beijing, China
- 4Key Laboratory of Space Ocean Remote Sensing and Application, Ministry of Natural Resources, Beijing, China
Net primary productivity (NPP) is a critical component in terrestrial ecosystem carbon cycles. Thus, quantitatively estimating and monitoring the dynamics of NPP have become key aspects for exploring the carbon cycle of terrestrial ecosystems. Anthropogenic activity, such as urbanization, has significant effects on NPP and increases pressure on the natural resources of a specific region. However, to date, although many studies have focused on the relationship between NPP variation and urbanization, they usually ignored any differences at a long-term spatiotemporal variation of urbanization factors, which led to the insufficient understanding of the urbanization-induced impacts on NPP. As a result, this study effectively explored the spatiotemporal variation of NPP from 2001 to 2012 and its corresponding relationship with urbanization, taking the Hubei Province in China as a case study area. To clarify the degree of urbanization, the spatial distribution and temporal variation of population and gross domestic product (GDP) were simulated based on the elevation-adjusted human settlement index and nighttime lights data. The major results showed that high NPP areas were located in those highlands with widespread woodland, in which the NPP value continued to grow during the period. The low NPP areas were mainly distributed in urban areas, and the NPP value had a continued and visible loss. The population and GDP both had a strong correlation with NPP. The significant negative correlation was concentrated in the center of Hubei, with a dense population and developed economy. In order to further realize their complex relationship, the correlation coefficients between the annual NPP and the two factors from 2001 to 2012 were calculated, and the changing trends were investigated. Overall, the findings of this study may provide a reference for studies on the interaction between ecological environment and socioeconomic processes under the background of global rapid urbanization.
Introduction
As one of the most important components of terrestrial ecosystems, vegetation can mitigate the trend of increasing atmospheric greenhouse gases, maintain the global climate, and adjust the global carbon balance (Piao and Fang, 2003; Peng et al., 2015). Net primary productivity (NPP), which refers to the net accumulation of organic matter by plants over a period of time, is an important evaluation indicator of vegetation growth (Buyantuyev and Wu, 2009; Shang et al., 2018; Yan et al., 2018). Moreover, as a critical component of the terrestrial ecosystem carbon cycle, NPP is a sensitive indicator of ecosystem’s health at both the local and global scale (Fang et al., 2000; Gao et al., 2003; Xu et al., 2011). Therefore, quantitative estimates of vegetation NPP are critical for monitoring regional carbon exchanges, thus understanding ecosystem functions and further developing regional carbon management plans (Yu et al., 2009; Zhang et al., 2016).
A series of models have been established to estimate the net primary productivity, which can be mainly grouped into three aspects: statistical models, process-based models, and light-use efficiency (LUE) models (Potter et al., 1993; Wang et al., 2009; Chu et al., 2021). The Carnegie–Ames–Stanford approach (CASA) model, which is a typical LUE model, has been widely used to perform carbon cycling parameter estimations because of its applicability at both local and continental scales (Wang et al., 2017; He et al., 2018). Based on the CASA model, lots of researchers have investigated the long-term variation of NPP in different regions, and many different conclusions have been reached. For example, Gao et al. estimated the grassland net primary productivity in northern Tibet using remote sensing and meteorological data for the period from 1981–2004 (Gao et al., 2009). Potter et al. estimated the carbon flux of the ecosystem of Yellowstone National Park using MODIS data based on the CASA model (Potter et al., 2011). Tan et al. calculated NPP of Xuzhou, China, and the results showed that the average NPP showed a decreasing trend from 2001 to 2010 (Tan et al., 2015). Zhu et al. estimated NPP based on the CASA model in the Greater Khingan Mountain region and analyzed the temporal-spatial variability characteristics of net primary productivity during the period from 1982 to 2013 (Xie et al., 2021).
As we knew, the distribution patterns of NPP and their changes are both driven by natural and anthropogenic factors (Luo et al., 2018). Natural factors, such as temperature and precipitation, have significant influences on vegetative photosynthesis. In addition, the high amount of anthropogenic activities has increased the demand for resources and energy, which can strongly affect the carbon cycle of terrestrial ecosystems. Urban expansion converts vegetation into impervious surfaces, which leads to a significant decrease in vegetation productivity and carbon sequestration capacity (Solecki et al., 2013). It means that the formation of NPP is a typical natural ecosystem function and can effectively indicate the ecological response of urbanization. In general, the urbanization level is very closely related to economic and demographic factors. There is a significant positive correlation between urbanization level and economic growth, and the higher the level of economic development, the higher the level of urbanization. The level of economic development can be quantified through the gross domestic product (GDP), which can be regarded as the typical characteristics of urbanization that can explain the emergence and development of cities (Jiang and Zeng, 2019; Li, 2019). Meanwhile, the increasing intensity of the population makes the impact of anthropogenic activities on the terrestrial ecosystem more and more complex (Shen et al., 2021). Urbanization is a process in which the population of a country or region shifts from rural to urban areas, the rural areas gradually evolve into urban areas, and the urban population keeps growing. Cities that are less populated tend to have a more compact land-scape structure and more vegetation in the city center. Therefore, the study of NPP changes during urbanization and their ecological impacts have become an important topic for clarifying the interactions between GDP and population. The previous studies have assessed the effect of anthropogenic activities on vegetation NPP dynamics by quantifying the population and GDP. For example, Li and Cheng found that there was a stable long-term equilibrium relationship between China’s urbanization development and economic growth from 1978 to 2004 (Li and Cheng, 2006). Lu et al. concluded that population and GDP had a significant negative correlation with NPP in Southeast China in a specific year (Lu et al., 2010). Zhao et al. chose NPP and GDP as proxy evaluators to explore the interaction between economic development and environmental change in China (Zhao et al., 2011). Li et al. analyzed the impact of urbanization on vegetation degradation in the Yangtze River Delta of China, and the results showed that the rise of population growth rate and GDP growth has significantly deepened vegetation degradation (Li, 2019). However, these studies only focused on either the spatial or temporal growth of population and GDP. They often ignore any differences at a long-term spatiotemporal variation of urbanization and lack a comprehensive measure associated with NPP relating to population urbanization and economic urbanization.
To overcome this issue, in this article, a long-term spatiotemporal variation of NPP and associated influence of urbanization in Hubei Province from 2001–2012 were monitored and analyzed. As a significant component of the Yangtze River economic zone development strategy, Hubei Province represents a typical region for studying the long-term impact of population and GDP on NPP and should receive considerable attention (Chai et al., 2019). According to the Hubei Statistical Yearbook, the proportion of the urban population increased from 40.8 to 53.5% during the period from 2001 to 2012, and the GDP value grew from 388,000 million CNY to 1,963,200 million CNY. With the rapid growth of the population and the acceleration of urbanization, the ecosystem of Hubei changed significantly, and it is facing severe challenges caused by the pursuit of development. Therefore, understanding the impact of urbanization on NPP in this region has important practical significance. The main objectives of this article are: 1) to analyze the spatiotemporal variations and change trend of NPP in Hubei Province; 2) to estimate the distribution of the population and GDP density and explain their variation trends; and 3) to discuss the correlation relationship between the population and GDP with NPP from both time and space. The results of this study are of great theoretical and practical significance for the effective coordination of nature, economy, and society as well as for sustainable development in Hubei Province.
The remainder of this article is organized as follows: In the Data Description section, the materials and methods are described, including the study area, dataset, data processing, and methods. In the Results and Discussion section, the results and analysis are presented. The discussion is provided, and it includes information on the spatiotemporal variations of NPP, effects of urbanization on NPP dynamics, limitations, and future research recommendations. In the Conclusion section, the conclusions are drawn.
Data Description
Study Area
Hubei Province is located in Central China (between 29°01′ and 33°06′ north latitude and between 108°21′ and 116°07′ east longitude), and it has an area of approximately 185,900 km2 (Figure 1) (Wang et al., 2014; Chen et al., 2018). The terrain of Hubei is higher in the west and lower in the middle and includes various and complicated geomorphic types, such as mountains, hills, and plains, among which mountains account for approximately 55%, hills account for 24.5%, and plains account only for 20% of the total area. The province has a humid subtropical climate, with average temperatures of 15–17°C and rainfall of 1100–1300 mm (Lin et al., 2016). The dominant land cover types in Hubei are forests, cropland, wetland, grassland, water bodies, and urban building. There are various vegetation types, including subtropical evergreen broad-leaved forest and subtropical mixed evergreen broad-leaved/deciduous broad-leaved forest (Tao et al., 2017). In 2001, Hubei Province’s population was 59.56 million, and its GDP was RMB 0.39 trillion, which rose to 61.65 million and RMB 2.25 trillion in 2012. With the rapid growth of population and urbanization, environmental protection in Hubei Province is facing severe challenges caused by the pursuit of development.
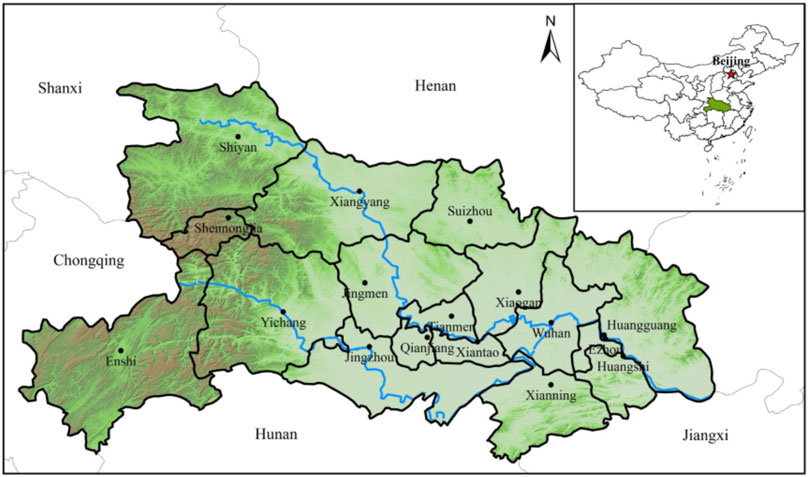
FIGURE 1. Study area location.
Data Preprocessing
MODIS13Q1 Data
The 16-day composition MODIS NDVI product (MOD13Q1) with a spatial resolution of 250 m between January 2001 and December 2012 was acquired from the National Aeronautics and Space Administration (NASA, http://edcimswww.cr.usgs.gov/pub/imswelcome/). The MOD13Q1 dataset is a MODIS Level-3 data product, which has been preprocessed with radiance calibration and atmospheric correction. The MODIS NDVI dataset was transformed to the Universal Transverse Mercator (UTM) with a World Geodetic System (WGS-84) datum using the MODIS Reprojection Tool (MRT), and monthly NDVI datasets were generated using the maximum value composite (MVC) method.
Nighttime Light Data
Global inter-calibrated nighttime lights (NTLs) (1992–2012), which were provided by Zhang et al. (2016), were downloaded from the website of Yale University (https://urban.yale.edu/data). NTLs were generated from the stable nighttime light annual composite product (version 4) acquired from the National Oceanic and Atmospheric Administration’s National Geophysical Data Center (NGDC) using a novel “ridgeline sampling and regression” method. The DMSP/OLS stable nighttime light annual composite product cannot be used directly due to the lack of continuity and comparability. The “ridgeline sampling and regression” method can create a consistent NTL time series that can be applied globally. The NTL data need to be re-scaled by multiplying pixel values with a scaling factor of 0.01 and reprojected to a value equivalent to NDVI data. The bilinear algorithm was used to resample the NTL data to a pixel size of 250 m × 250 m to match the spatial resolution of the MODIS NDVI dataset.
Meteorological Data
The meteorological data included the monthly mean temperature, monthly cumulated precipitation, and the monthly total solar radiation from 2001–2012, and these data were acquired from the monthly datasets of the terrestrial climate data and the monthly datasets of the radiation data published on the China Meteorological Data Sharing Service System (http://data.cma.cn/). There were 32 stations of temperature and precipitation and 11 stations of solar radiation. Meteorological data were interpolated to the same spatial resolution as NDVI data using the kriging spatial interpolation method.
Other Ancillary Data
Ancillary data used in this study include digital elevation model (DEM) data, land use/land cover data, the MODIS NPP products (MOD17A3), and the GDP and population data at the county level. DEM data with a spatial resolution of 90 m were obtained from the geospatial data cloud (http://www.gscloud.cn/), and land use/land cover data were acquired from the MODIS Level-3 land cover type product (MCD12Q1). Land cover types were divided into evergreen needleleaf forest (ENF), evergreen broadleaf forest (EBF), deciduous broadleaf forest (DBF), mixed forest (MF), grassland, wetland, cropland, urban, and water bodies. The MODIS NPP products (MOD17A3) covering the period from 2001 to 2012 were selected to validate the simulated NPP results. Datasets with a spatial resolution of 1 km and a temporal resolution of 1 year were acquired from the Land Processes Distributed Active Archive Center (https://lpdaac.usgs.gov). All the above data were resampled to match the 250 m spatial resolution of MODIS NDVI data using the Resample tool of ArcGIS. The GDP and population data from 2001–2012 at the county level for Hubei Province (81 counties in total) were obtained from the Hubei Provincial Bureau of Statistics (Hubei Statistical Yearbook and Hubei Rural Statistical Yearbook).
Methods
NPP Estimation
The CASA model is based on light-use efficiency (LUE) theory, and it simulates net primary productivity by estimating optimal metabolic rates of carbon fixation under the limiting effect of temperature and water stress scales (Potter et al., 2003). In the original CASA model, the maximum light energy utilization rate of all vegetation in the world was set to 0.389 g C MJ−1. However, different vegetation types should correspond to different maximum light energy utilization rates. The researchers simulated the maximum light energy utilization rate of all vegetation types according to the actual vegetation distribution in China (Guan et al., 2021). Therefore, the improved NPP estimation model developed was applied in this study to simulate NPP over Hubei Province from 2001 to 2012. NPP can be calculated based on the following equation:
where x represents the spatial location, t represents time, APAR represents absorbed photosynthetically active radiation, and ε represents light-use efficiency.
where SQL represents the total solar radiation per unit time, FPAR represents the fraction of photosynthetically active radiation, T1 and T2 represent the effect of temperature on light-use efficiency, and W represents the effect of soil moisture on light-use efficiency.
Population Density Mapping
It has been proved that the night light data are an effective tool for the spatialization of population and GDP density at national and province levels (Yue et al., 2014; Song et al., 2015; Wang et al., 2018). The global inter-calibrated nighttime light (NTL) data were introduced in our study to spatialize the population and GDP density. Moreover, the human settlement index (HSI) is an index for mapping spatial population distribution by incorporating vegetation information into the nighttime light data. This index was proposed by Lu et al. (2008) and based on the rationale that impervious surfaces are closely and inversely correlated with vegetation abundance. Many studies have shown that elevation has a profound impact on the human population distribution because most human settlements occur at lower elevations in China (Yue et al., 2003; Yang et al., 2013). If the influence of altitude is not taken into account, then large errors will be introduced into the population simulation results for high-altitude areas. In our study, the average population density and average altitude of 81 counties in Hubei Province were analyzed by exponential function regression. The coefficient of determination (R2) was greater than 0.7 (the coefficient of the exponential equation was -0.002), which indicated that there was a strong negative correlation between altitude and population density. Therefore, an elevation-adjusted human settlement index (EAHSI) was used to estimate the population density in Hubei Province. The data include DEM, standard MODIS NDVI products (23 images per year), and nighttime light data from 2001 to 2012. The EAHSI is defined as follows:
where NDVImax is the maximum image of 23 MODIS NDVI composite images, NTLnor is the normalized value (0–1) of the nighttime light image, and NTLmax and NTLmin are the maximum and minimum values of the image, respectively.
A total of 41 cities were randomly selected from Hubei Province as experimental areas and the remaining 40 counties as verification areas. A population density model was then built by inputting the cumulative DN of EAHSI at the county level and the corresponding population of the 41 experimental counties into the regression. The model creates a spatial population density map, and the performance of the modeled population density results is calculated by the relative error (RE) and mean relative error (MRE) (Yang et al., 2013; Yue et al., 2014; Sun et al., 2017). The RE and MRE are calculated as follows:
where POPm and POPa represent the simulated population and the actual statistical population, respectively, and n represents the number of counties.
GDP Density Mapping
Night light data have the strongest correlation with the sum of the GDP of secondary and tertiary industries; however, these data are not well suited for estimating GDP in rural areas. Therefore, the spatialization process of non-agricultural GDP (the GDP of secondary and tertiary industries) is similar to that of population, while that for agricultural GDP (the GDP of the primary industry) uses land cover data. In this study, MCD12Q1 land cover data were used to model the agricultural GDP, and the EAHSI images were used to model the non-agricultural GDP.
To conduct the spatial simulation of agricultural GDP, the land cover types related to agricultural activities in MCD12Q1 were combined into farmland, forestland, grassland, and water, which corresponded to the gross production values of agriculture, forest, animal husbandry, and fishery, respectively. The EAHSI image was used to model the non-agricultural GDP. When the non-agricultural GDP is spatialized, the minimum value of the NTL image (NTLmin) was determined. The agricultural and non-agricultural regions were divided by a threshold value. First, the mean NDVI value of artificial surfaces in land cover data was calculated for Hubei Province. Second, the regions with non-artificial surfaces larger than the average NDVI value and NTL DN values >0 were divided. The DN threshold value of the image was determined by the mean NTL DN value in this region.
Trend Analysis
Ordinary least square estimations were performed for each pixel to quantify the linear trends of NPP in Hubei Province from 2001 to 2012. The equation was calculated as follows:
where i represents the ordinal year, 1, 2, … , 12; n = 12 (the time series is from 2001 to 2012); θi is the annual NPP, in the year i; and Slope is the slope of the linear fitting equation. Slope >0 indicates an increasing trend, and the converse denotes a decreasing trend. The F-test is generally used to determine the significance of the change trends. The equation for this test is as follows:
where U is the error sum of squares, and Q is the regression sum of squares, n = 12. Based on the results of the F-test and the trend analysis, the trends were classified according to four ranks: significant decrease (Slope <0 and p ≤0.05), insignificant decrease (Slope <0 and p >0.05), significant increase (Slope ≥0 and p ≤0.05), and insignificant increase (Slope ≥0 and p >0.05).
Analysis of the Impacts of Urbanization on NPP
In this study, a correlation analysis, which is a common method of analyzing the relations between the net primary productivity and associated influencing factors, was performed to quantify the impact of population and GDP on NPP at the pixel scale, and Pearson’s correlation coefficient, which can show the strength of the relationship between urbanization indicators and NPP, was calculated. The T-test was used to determine the significance of the correlation analysis. A value of p <0.05 was considered significant. The equation of the correlation coefficient is expressed as follows:
where xi is the NPP of the ith year, yi is the corresponding population or GDP density of the ith year, ‾x and ‾y are the means of x and y, respectively, and r is the correlation coefficient of the two variables x and y.
Study Process
The study process includes the following steps.
1) The NPP values in Hubei Province from 2001 to 2012 were calculated based on the modified CASA model. After that, the spatial patterns, temporal variations, and the spatiotemporal variation trends of NPP were acquired.
2) The MODIS NDVI data, SRTM DEM data, land cover map, NTL data, and other ancillary data were all effectively coupled. Then, the population and GDP density were spatialized under the specified scale.
3) The correlation relationship between the population and GDP density with NPP was calculated. Finally, the variation trend of NPP with population and GDP density was analyzed. The flow chart of this study is shown in Figure 2.
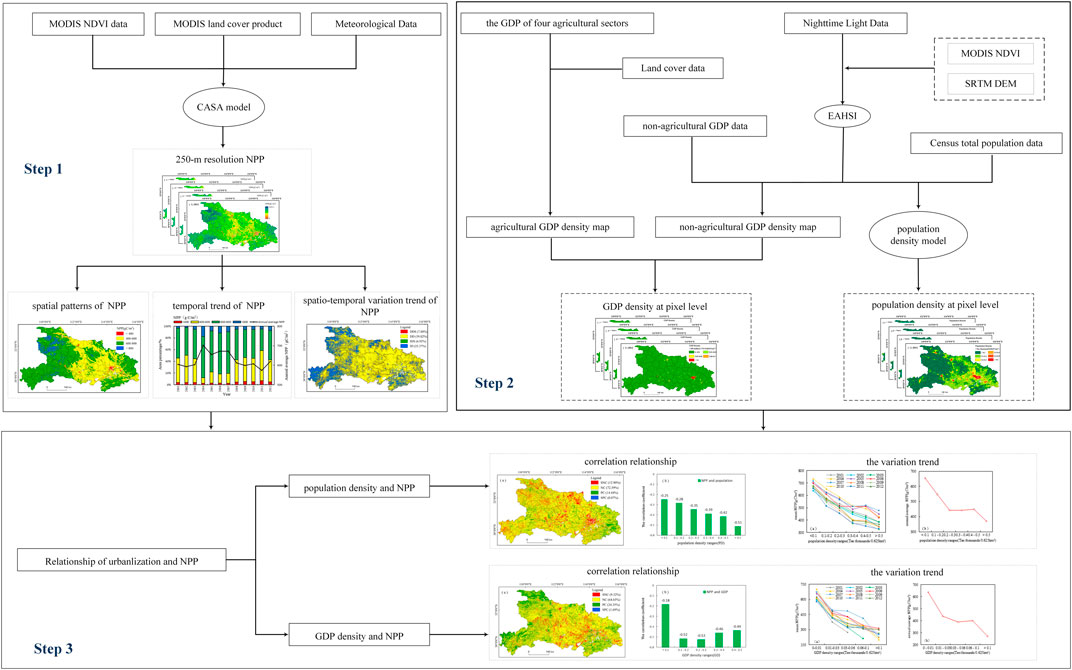
FIGURE 2. Methodological framework of this study.
Results and Discussion
Validation of the Estimated Results
Validation of the NPP Calculations
The MOD17A3 NPP products were used to assess the accuracy. First, the MOD17A3 NPP products were resampled to a 250-m spatial resolution. After that, the average NPP values estimated by the CASA model for different land cover types were calculated and compared with the MOD17A3 NPP. The linear regression analysis results between the NPP estimates based on the CASA model and MOD17A3 NPP products are shown in Figure 3. A strong correlation was observed between them; the average relative error was 19.52%, and the correlation coefficient was 0.85. The results calculated in this article are similar to those of the MOD17A3 NPP products. Additionally, the estimated results of specific cities in Hubei Province can also be compared with those observed in previous studies. For example, the average inter-annual NPP of the evergreen needleleaf forest in Wuhan in our study was 578.06 g C/m2, which is similar to the value of 582.4 g C/m2 based on historical data as estimated in Zhang et al, (2011). Therefore, the CASA model in our study is practical and applicable for calculating NPP in Hubei Province.
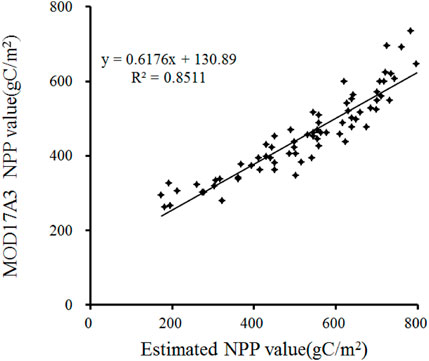
FIGURE 3. Correlation between the estimated NPP values and MOD17A3 NPP values.
Error Analysis of the Population Density Map
The NTL, NDVI, DEM, and census population data at the county level were used to generate the spatial population density maps of Hubei Province with a resolution of 250 m from 2001 to 2012 based on the population spatial model mentioned in the Population Density Mapping section. The cumulative DN values of the EAHSI at the county level were input into the regression with the corresponding population of 41 counties selected randomly in Hubei Province. Then, the overall accuracies of the regression model were evaluated by calculating the MRE in the remaining 40 counties. Table 1 presents the regression model among the cumulative EAHSI, population statistical data, and the results of accuracy assessment from 2001 to 2012. In the table, the R2 represents the fitting degree of the regression equation of the population spatial model, and the values were all relatively large over the 12 study years. Their values were all above 0.79, and the highest value occurred in 2012. The excellent fitting effect of the model indicates that the night light data can well reflect the spatial distribution of the population. For the accuracy of the model, all the MRE values were less than 30%, indicating that the overall simulation error is small during the period from 2001–2012. In addition, the error in 2006 was the smallest whereas the error in 2005 was the largest, with MRE values of 25.82 and 28.86%, respectively.
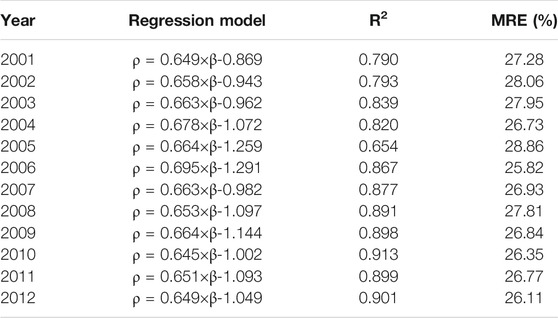
TABLE 1. Population spatial model from 2001 to 2012 (ρ and β are the population density and Ln values of EAHSI, respectively).
Error Analysis of the GDP Density Map
The spatialization process and error analysis of non-agricultural GDP density were similar to those of the population density. Table 2 presents the regression model between the cumulative EAHSI and GDP statistical data and the results of the accuracy assessment from 2001 to 2012. The table shows that the determination coefficients were all relatively large with values above 0.80 during the period from 2001 to 2012. The excellent fitting effect of the model indicates that the night light data can well reflect the spatial distribution of non-agricultural GDP. For the accuracy of the model, all the values of MRE were less than 30%, indicating that the overall simulation error was small from 2001 to 2012.

TABLE 2. Non-agricultural GDP spatial model from 2001 to 2012 (ρ and β are the GDP density and Ln values of EAHSI, respectively).
Spatiotemporal Variation of NPP
In this section, the long-term characteristics of NPP in Hubei Province were evaluated from three aspects: spatial patterns, temporal variations, and the variation trend of NPP.
Spatial Patterns of Mean Annual NPP
In order to conveniently describe the distribution of NPP, the degree of NPP can be divided into four different grades with red, yellow, blue, and green, which mean very lower (NPP <400 g C/m2), lower (400 < NPP < 600 g C/m2), middle (600 < NPP < 800 g C/m2), and higher (NPP >800 g C/m2), respectively. According to the land cover type product MCD12Q1 in Hubei Province, the main land cover types are ENF, EBF, DBF, MF, grassland, wetland, cropland, urban, and water, respectively. Except for water, all of the land cover types had the influence on NPP. The spatial pattern of the mean annual NPP from 2001–2012 in Hubei Province is shown in Figure 4A, and the land cover types and mean NPP are shown in Figure 4B. As shown, the western part of Hubei has a high altitude, and the main land cover types are woodland (ENF, EBF, DBF, and MF) and grassland, which can be seen as the higher NPP grade areas. Woodland and grassland accounted for 63.78% of the study area, and the mean annual NPP value was more than 500 g C/m2. Among them, the mean annual NPP values of EBF and DBF were both more than 800 g C/m2, which were mainly distributed in the northwest of Hubei. East Hubei was the middle NPP area. There are three main land cover types, including cropland, little woodland, and grassland. Due to the hilly region, the mean annual NPP value was general lower than that of west Hubei. Central Hubei, especially in the south central region, is the Middle-Lower Yangtze Plain. It presents a flat terrain and concentrated population. The main land cover types are cropland, wetland, and urban. The mean annual NPP values of wetland and urban land were both lower than 500 g C/m2. Therefore, the very lower and lower grade NPP values were both distributed in this region. In addition, the different land cover types had a different combination of four NPP grades. Figure 4C explains the percentage of four NPP grades according to each land cover type. In the higher grade, EBF and DBF showed higher NPP percentages with 83.9 and 63.8%, respectively. In the middle grade, MF and grassland were the mainly distributed land cover types with 83.9 and 81.7%. In the lower grade, the proportions of wetland, cropland, ENF, and urban were higher than those of others, which were both more than 50%. In the very lower grade, urban and wetland were accounted for 37.7 and 25.9%, respectively.
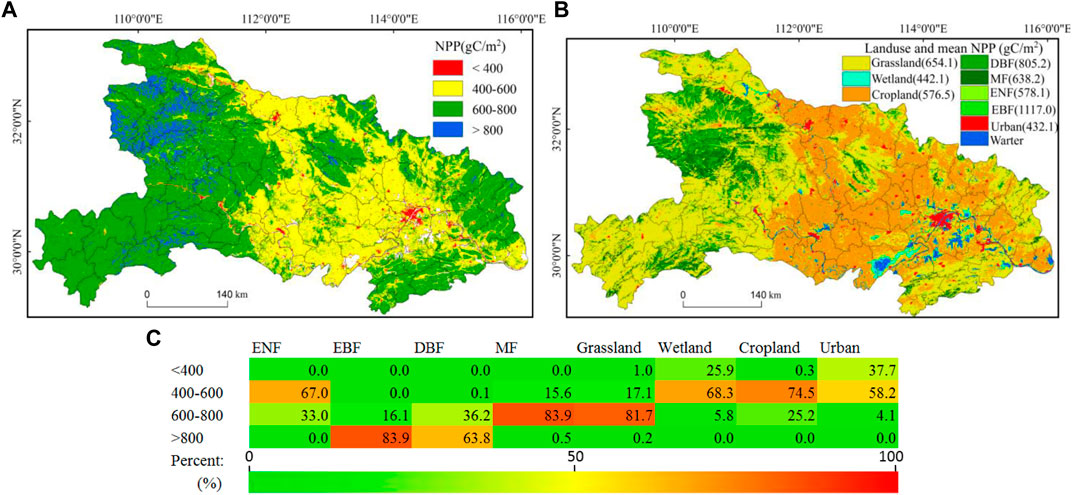
FIGURE 4. (A) Spatial distribution of the mean annual NPP; (B) land cover types of Hubei Province and mean NPP; and (C) percentage of four NPP grades for eight land cover types.
Temporal Variations of NPP
The temporal variations of the annual average NPP of Hubei Province from 2001 to 2012 are shown in Figure 5. Generally, the annual NPP varied from 573.51 g C/m2 to 701.85 g C/m2 over the past 12 years, with the highest in 2004 and the lowest in 2011. The change in NPP can be divided into two sub-periods throughout the period. NPP showed an increasing trend from 2001 to 2004 (32.34 g C/m2 yr), followed by a wavelike decrease from 2004 to 2012 (11.30 g C/m2 yr). Table 3 lists the different changes for the four grades. In the very lower NPP areas (NPP <400 g C/m2), there was a negative change with a value of −18.58 g C/m2 from 2001 to 2012. The main reason for the decline was that more and more cropland and grassland are converted into urban land with the development of the economy and the acceleration of urbanization. The percentage of urban area was increased by 5.25% during the period, and approximately 90.36% of the total urban area has negative change rates on NPP, which led to a significant NPP loss in time and space. In contrast, the different positive changes occurred when the NPP value exceeded 400 g C/m2. In the lower NPP areas (400 g C/m2 < NPP < 600 g C/m2), there was a positive change with 10.60 g C/m2. The main land cover type is the cropland, and the percentage area increased from 55.67 to 58.42% from 2001 to 2012. In the middle NPP areas (600 g C/m2 < NPP < 800 g C/m2), the NPP value has increased by 5.44 g C/m2. The grassland is the main land cover type. Although the area of grassland has been reduced little from 74.67 to 68.69%, the percentage of cropland area increased from 31.33 to 34.93%, which still kept the NPP in an increased state. In the higher NPP areas (NPP > 800 g C/m2), the NPP values have increased by 13.86 g C/m2. The main land cover type is DBF decreased from 91.72 to 82.70% from 2001 to 2012. But, the percentage of grassland area increased from 8.09 to 17.00% from 2001 to 2012. The high increase rate was maintained due to the significant NPP correlation of the DBF and grassland.
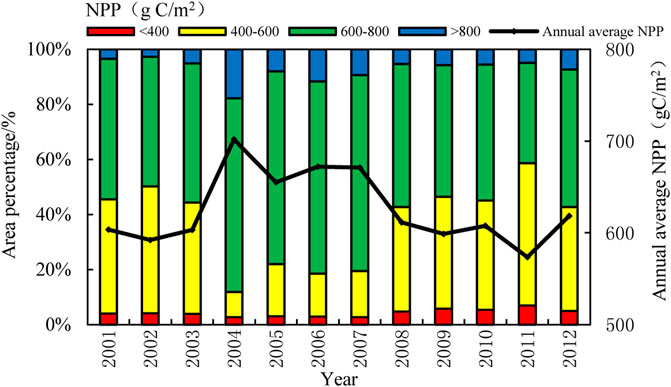
FIGURE 5. Temporal variations of the annual average NPP.
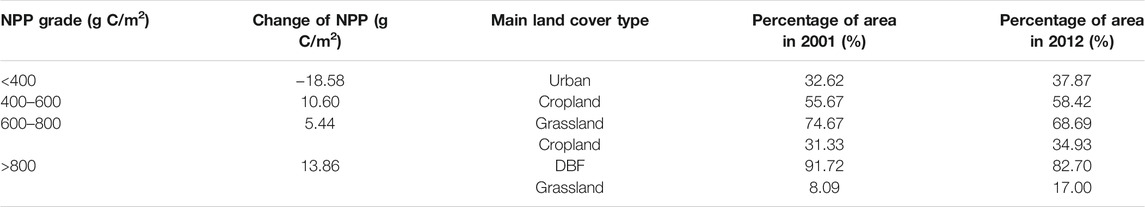
TABLE 3. Change of NPP for the four grades.
The Variation Trend of NPP
The slope of the equation obtained by linear least-square fitting of long-term NPP series can show the development trend of NPP over 12 years. As shown in Figure 6, there are four different colors (red, yellow, green, and blue) representing the variation trends, including the significant decreasing trend (SDT, p >0.05), decreasing trend (DT, p <0.05), significant increasing trend (SIT, p >0.05), and increasing trend (IT, p <0.05). The area with DT of annual NPP accounted for 59.82% of Hubei Province and was distributed roughly in the central area of the study region. The area with an IT of annual NPP was mainly distributed in west Hubei and accounted for 25.37%. Only 7.88 and 6.92% of the study area showed SDT and SIT, respectively. Therefore, the number of pixels of the two variation trends is too small to find in the figure.
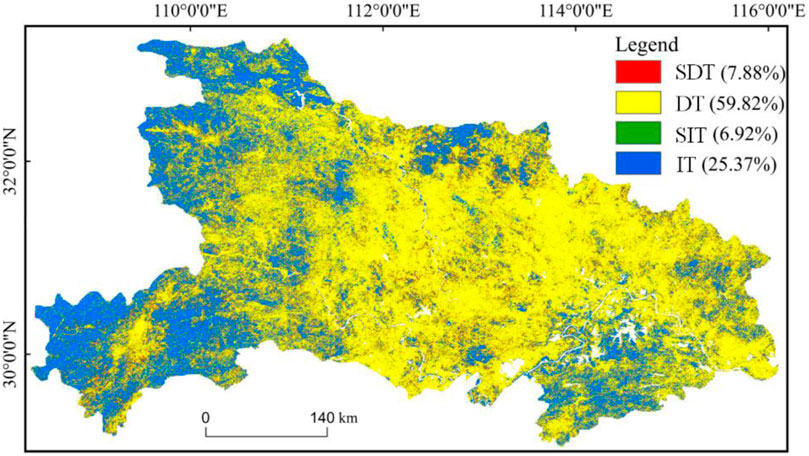
FIGURE 6. Change trends in annual NPP within Hubei Province between 2001 and 2012.
Different land cover types had different responses to NPP, which was the major reason for the variation trend. The rate of NPP change for each land cover type is listed in Table 4. It is found that there were only two land cover types with positive change rates, EBF (37.38 g C/m2 yr) and DBF (4.03 g C/m2 yr). The rest of land cover types all had negative change rates. The order of the decreasing rate from high to low was as follows: urban (-10.63 g C/m2 yr), wetland (−9.95 g C/m2 yr), ENF (−9.51 g C/m2 yr), cropland (−3.52 g C/m2 yr), MF (−2.64 g C/m2 yr), and grassland (−1.73 g C/m2 yr). Among all land cover types, grassland showed the most significant SIT with 7.91% and the most significant SDT with 8.55%. Moreover, the largest percentage of DT and IT occurred in urban areas with 87.28% and EBF with 90.19%. The main land cover types are cropland, grassland, and MF in the area with DT of annual NPP. They all had the negative change rates, and the percentages of DT were both more than 50% in these areas, which caused the decreasing trend. In the area with IT of annual NPP, the main land cover types are EBF, DBF, and grassland. There were higher positive change rates in EBF and DBF, which caused the increasing trend on the whole.

TABLE 4. Rate of NPP change for each land cover type.
Correlation Between Urbanization and NPP
The urbanization process has an important impact on NPP variation. Population growth and economic development, a representation of the agglomeration effects, are highly correlated with urbanization. In this section, the relationships between NPP and the two urbanization indicators were described.
Population Density Map
The spatial distributions of the population density for Hubei Province from 2001 to 2012 are presented in Figure 7. The unit of population density is defined as PD = 10,000/0.0625 km2 because the resolution of the population density map is 250 m (0.25 km). The sparsely populated areas (population density less than 0.1 PD) were mainly distributed in the western areas of Hubei Province, such as Shiyan, Enshi, and Shennongjia Forestry District, while densely populated areas (population density more than 0.4 PD) were mainly in the highly urbanized regions, such as Wuhan City, Xiangyang City, Yichang City, and Jingzhou City. The population of sparsely populated areas increased from 22.87 to 47.87% from 2001 to 2004 and continued to decline after 2004, accounting for only 28.37% in 2012. The population in the densely populated areas decreased from 2001 to 2004 and increased steadily after 2004, accounting for 10.97% in 2012. In general, from 2001 to 2012, the proportions of the population in sparsely populated areas were large but showed a decreasing trend, whereas the population in densely populated areas increased steadily.
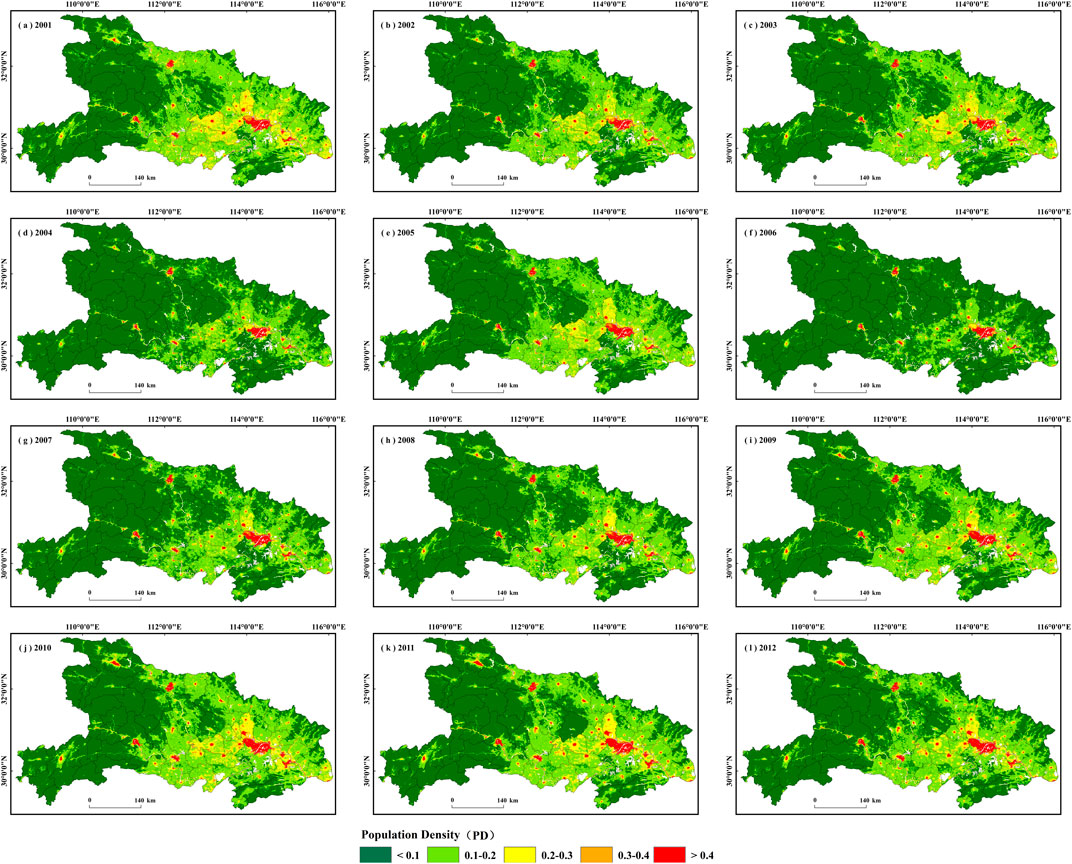
FIGURE 7. Population density maps with a 250 m × 250 m grid (A)–(L) the different maps from 2001 to 2012.
Correlation Between Population and NPP
With the change in population density, the NPP values would change. Figure 8A shows the change in NPP in different population density ranges from 2001 to 2012. Even though the population densities of 12 years were quite different, the trends in NPP were the same. With an increase in population density, the average NPP value decreased. Figure 8B shows the annual average NPP changes during the period. It is found that the average NPP value was the minimum when the population density was more than 0.4 PD.
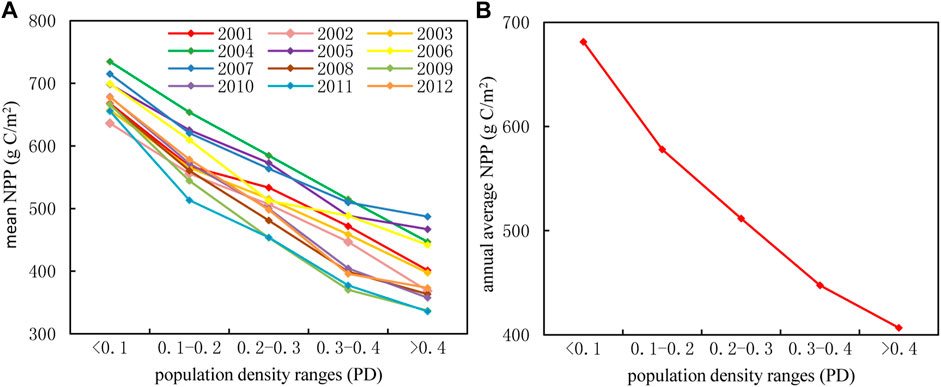
FIGURE 8. (A) NPP change in different population density ranges from 2001 to 2012 and (B) annual average NPP change in different population density ranges.
To further investigate the correlation between NPP and population density, the correlation coefficient is calculated and analyzed from two aspects. First, the spatial pattern of the correlation coefficient is shown in Figure 9A. The negative correlation (NC) is labeled as yellow, significant negative correlation (SNC; p <0.05) is labeled as red, positive correlation is labeled as green, and significant positive correlation (SPC; p <0.05) is labeled as blue. The area with NC between NPP and population accounted for almost 85.49% of Hubei Province, of which approximately 15.08% showed SNC. The significant negative relationship was concentrated in the center of Hubei, which was mainly covered by cropland and urban areas. With the increase of population density, the negative correlation coefficients become more significant. The tendency and process of the mass population gathering toward big cities that leads to land-use/cover change. It is found that more and more cropland and woodland (including EBF, DBF, and MF) are converted into urban land during the period. This is probably the main reason for the decrease in NPP caused by population growth. Moreover, areas with PC accounted for almost 14.51% of the study region, and approximately 0.48% showed SPC. These areas were mainly distributed in the western Hubei mountains and eastern Hubei Province. Second, the main considerations and affecting factors of the correlation coefficient were provided. Figure 9B describes that the correlation coefficient is different when the population density ranges. The coefficients were all negative that shows NC and SNC were dominant in the five population densities. The negative correlations become larger and larger with increased population density. When the population density was more than 0.4 PD, the negative correlation coefficient with the population was the maximum. Besides, correlation coefficients were different for different land cover types, which could be seen as indirect impacts. As shown in Figure 9C, the negative correlation coefficient between NPP and population was the largest in urban, with the mean value of −0.46. The negative correlation coefficients of other land-use types were smaller. The order from high to low was mainly as follows: wetland (−0.39), EBF (−0.31), DBF (−0.30), cropland (−0.29), grassland (−0.28), and MF (−0.19). Although there was a positive correlation in ENF with a mean value of 0.01, it had little influence on NPP. Therefore, urban had more importance in influencing NPP than other land cover types.
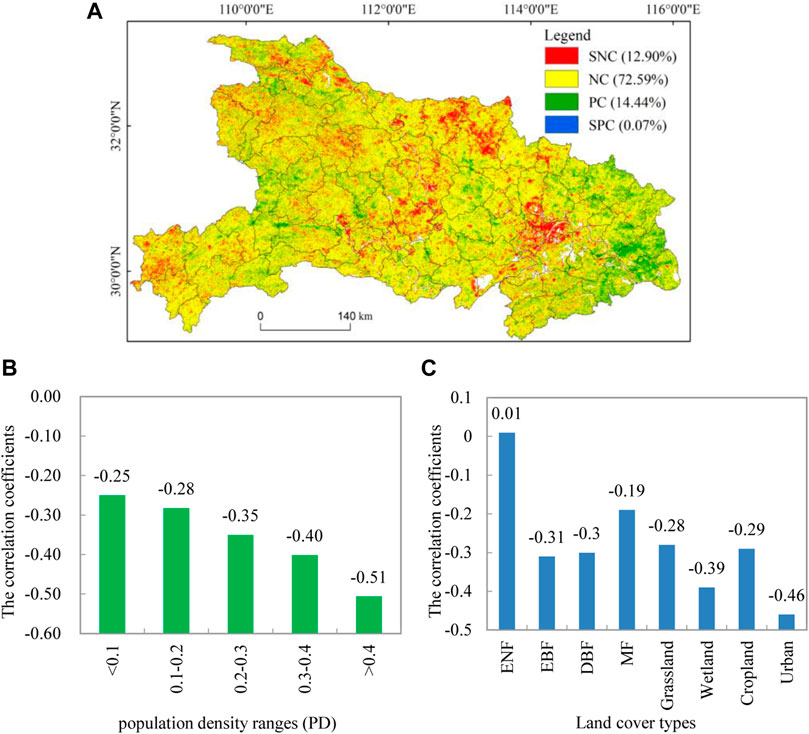
FIGURE 9. (A) Spatial distribution of the correlations between population and annual NPP; (B) correlation coefficients between population and annual NPP for the different population density ranges; and (C) correlation coefficients between NPP and population for different land cover types.
GDP Density Map
The spatial distributions of the GDP density for Hubei Province from 2001 to 2012 are presented in Figure 10. The unit of GDP density is defined as GD = 100 million CNY/0.0625 km2. As shown in the figure, most of the GDP contributions were from regions with a concentrated population and a high level of economic development, especially from Wuhan City, which had a high level of urbanization. Areas with a GDP density greater than 0.1 GD mainly occurred in Wuhan City. In addition, the GDP density in most areas of Hubei Province was in the range of 0–0.01 D. GDP density ranging from 0 to 0.01 GD accounted for 95.31% of the study region in 2001, while in 2012 it only accounted for 76.94%. Since 2004, the GDP density had exceeded 0.1 GD. The proportions of GDP density greater than 0.1 GD increased from 0.06% in 2001 to 2.70% in 2012.
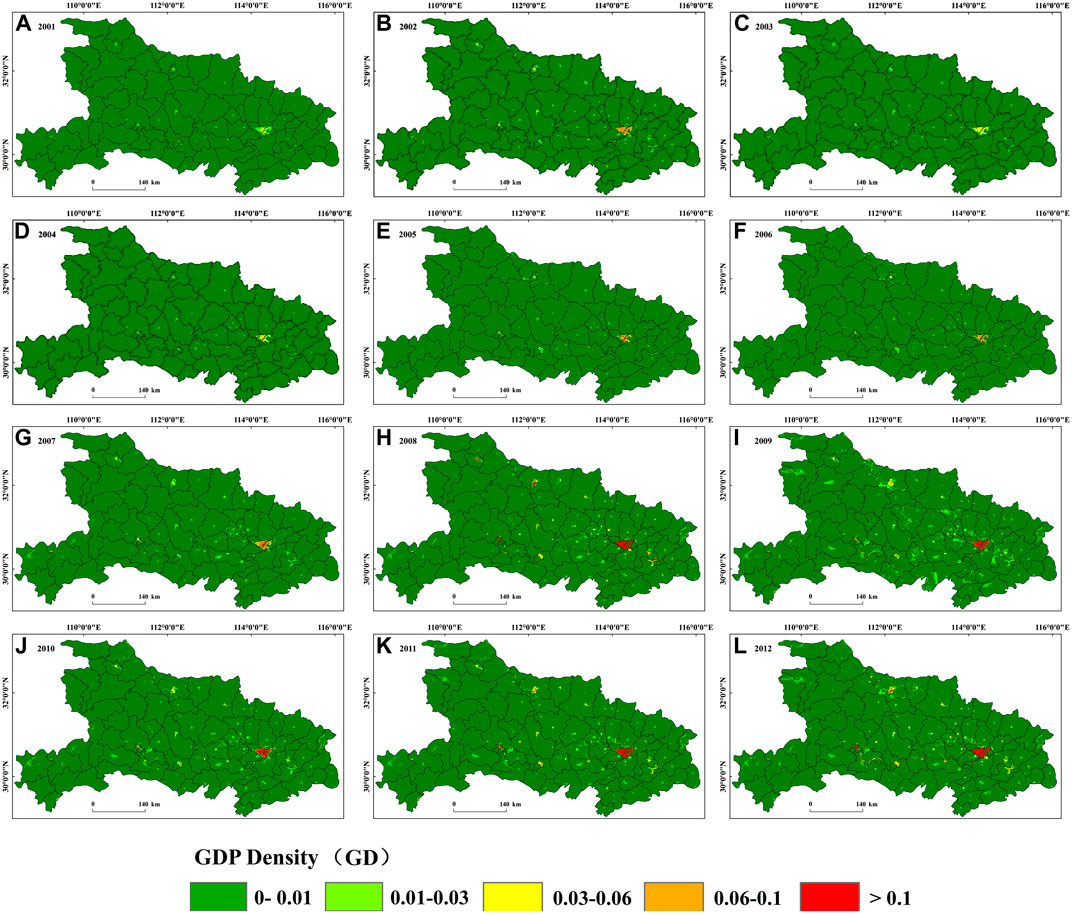
FIGURE 10. GDP density maps with a 250 m × 250 m grid. (A)–(L) the different maps from 2001 to 2012.
Correlation Between Population and GDP With NPP
Similarly, the correlation between NPP and GDP is described as follows: Figure 11A shows the variation trend of the annual average NPP with GDP density. With the increase of GDP density, the average NPP value decreased. Therefore, the higher the GDP density, the greater the reduction rate of NPP. Figure 11B shows the annual average NPP changes during the period. The average NPP value was the minimum when the population density was more than 0.1 GD.
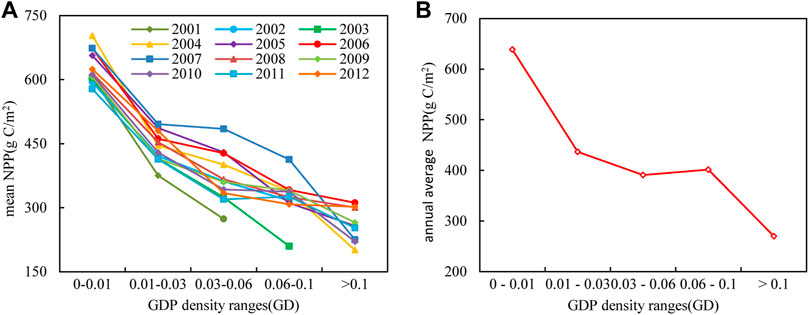
FIGURE 11. (A) NPP and GDP density from 2001 to 2012 and (B) annual average NPP and its regression slope with GDP density.
The correlation coefficient was calculated and analyzed from two aspects. First, the spatial pattern of the correlation coefficient between GDP and NPP is shown in Figure 12A. The areas with negative correlation (NC) between NPP and GDP accounted for almost 73.97% of Hubei Province, of which approximately 12.6% showed a significant negative correlation (SNC; p <0.05). The areas with a positive correlation (PC) between NPP and GDP accounted for almost 36.03% of the study region, and approximately 6.48% showed a significant positive correlation (SPC; p <0.05). Areas with a negative correlation between NPP and GDP were mainly located in central Hubei Province, while the areas with positive correlations were mainly distributed in northwest, southwest, and southeast Hubei Province. Second, the affecting factors of the correlation coefficient are analyzed, including the GDP density and land cover types. The correlation coefficients for the different GDP density ranges are described in Figure 12B. The trend of the negative correlation was not the same as the one between NPP and population. In the beginning, it increased with the continuous increase of GDP density. When the GDP density was 0.2–0.3 GD, the negative correlation coefficient reached the maximum. After that, the negative correlation between NPP and GDP was not significant, which means that the growth of GDP might lead to the increase of NPP in some regions under a certain threshold. For example, the economic growth can further improve management capacity with good policies. Artificial management, such as irrigation and planting, resulted in improved vegetation coverage and increased NPP. Similar to NPP and population, correlations between NPP and GDP were also different for different land cover types. Urban had more importance in influencing the relationship between NPP and GDP than other land cover types. In Figure 12C, the cropland, wetland, ENF, and MF were all greater than −0.3. There was a positive correlation in EBF with a mean value of 0.26. But, its area was so small that it was almost negligible.
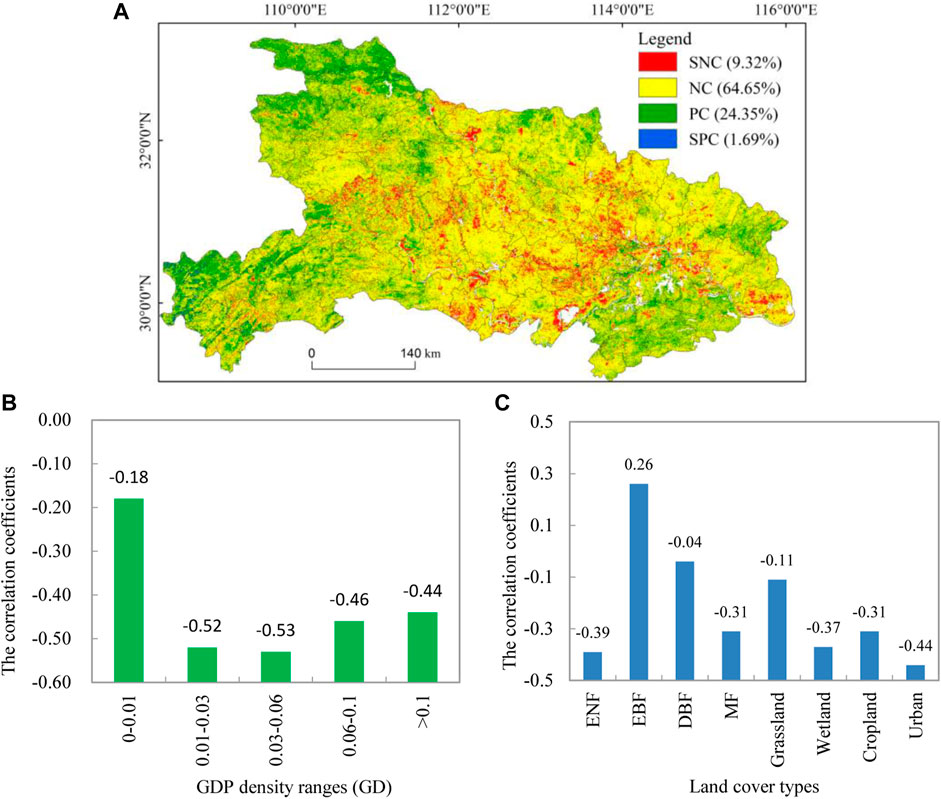
FIGURE 12. (A) Spatial distribution of the correlations between GDP and annual NPP; (B) correlation coefficients between GDP and annual NPP for the different GDP density range; and (C) correlation coefficients between NPP and GDP for different land cover types.
Limitations and Future Research
Due to urbanization being a complex process, the interaction between terrestrial ecosystems and socioeconomic processes is also relatively complicated. The process of population urbanization is different in different stages of urbanization, so is economic urbanization. The relationship of NPP and urbanization needs to be studied over a longer period of time. Some researchers have indicated that the negative impacts of urbanization on vegetation gradually weaken with the continuous improvement of urbanization levels, and the positive impacts of urbanization on vegetation will be increasingly obvious. It is because that some anthropogenic activities have led to an increase of vegetation cover in urban areas, such as irrigation and tree transplantation. This means that urbanization unavoidably leads to the degradation of vegetation and the decrease of vegetation productivity. However, cities may further strengthen ecological management capacity as the economy grows. These measures can make a great contribution to the vegetation in urban areas. In addition, the population is gathering toward the city with the expansion of the city size. Population migration can improve the vegetation conditions in rural areas with the increase of urbanization levels. Although 12 years were analyzed to determine the impacts of urbanization on vegetation, the different stages of urbanization cannot be fully described. Therefore, in future studies, vegetation NPP should be estimated and monitored over a longer study period to explore the effects of population and GDP on NPP in different stages of urbanization.
Moreover, climate change is also a major controlling factor in the response of NPP. Research shows that the temperature had a significant decreasing trend during the period from 2001–2012, which was similar to the trends of the annual NPP (Figure 13). Precipitation also tended to decrease but was not significant. The decreasing trend in temperature and precipitation changes the environmental conditions of vegetation growth, which further affects the vegetation distribution and vegetation net primary productivity. The two factors need to be further investigated.
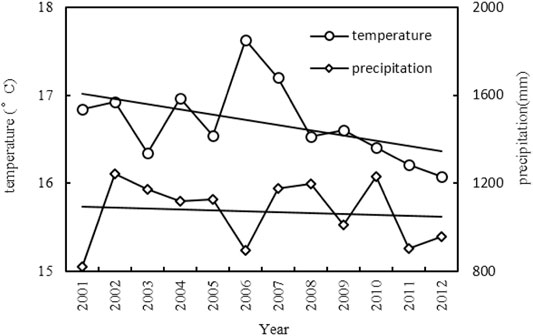
FIGURE 13. Inter-annual variations of temperature and precipitation of Hubei Province from 2001 to 2012.
Conclusion
In this study, the NPP in Hubei Province during the period from 2001 to 2012 was calculated, and the spatiotemporal dynamics of NPP and its relationships with the urbanization indicators (population and GDP) were investigated. The main conclusions can be summarized as follows: 1) The distribution pattern of NPP is as follows: northwest Hubei has a high altitude, and the main land cover type is woodland with high vegetation coverage and little human activities. Therefore, there were higher NPP values in northwest Hubei. The urban areas, which have an extensive distribution of urban and built areas, showed the lowest NPP values. In addition, the land cover type had significant influences on the spatial distribution of NPP. 2) During the study period, the average NPP value increased in high NPP areas. Because the inter-annual variation of NPP in DBF, the main land cover type in this region, was positive. On the contrary, the average NPP value decreased in low NPP areas. The urban areas continued to expand, but the inter-annual variation of NPP was negative in urban areas. From 2001 to 2012, NPP decreased by 18.58 g C/m2 in low NPP areas. The losses of NPP in urban areas are continuing and evident. 3) Population and GDP density are the typical indicators of anthropogenic activities, which can play an important role in the distribution and dynamics of NPP. During the study period, there was a negative correlation between NPP, population, and GDP. On the whole, the highest values of negative correlation coefficients were found in urban areas and the lowest in woodlands. The expansion of the built-up land in the middle and east can decrease the size of green areas and reduce the productivity of vegetation. Meanwhile, the remaining woodlands are mostly distributed in the west. The estimated NPP values were likely to remain unchanged with the urbanization developments. In addition, the impact of human activity on NPP was different depending on the intensity of human activity. With the increase of population density, the negative correlation coefficients between population and annual NPP become larger. But, the correlations between NPP and GDP were not the same as the correlation between NPP and population. The negative correlation coefficients between GDP and NPP increased first and then decreased with the continuous increase of GDP density. This indicates that the impact of urbanization on NPP is not completely negative when GDP reaches a certain threshold.
Data Availability Statement
The original contributions presented in the study are included in the article/supplementary material; further inquiries can be directed to the corresponding author.
Author Contributions
KW and CZ contributed to conceptualization; KW and CZ contributed to methodology; CZ contributed to writing—original draft preparation; and KW, CZ, YZ, and YX contributed to writing—review and editing. All authors have read and agreed to the published version of the manuscript.
Funding
The research was supported by the Global Change and Air-Sea Interaction II under Grant GASI-01-DLYG-WIND01 and in part by the National Defense Pre-Research Foundation of China during the 13th Five-Year Plan Period: the High Spectral Resolution Infrared Space-Based Camera and the Applied Technology under Grant D040104. this work was also supported in part by the National Natural Science Foundation of China under Grant 62071438.
Conflict of Interest
The authors declare that the research was conducted in the absence of any commercial or financial relationships that could be construed as a potential conflict of interest.
Publisher’s Note
All claims expressed in this article are solely those of the authors and do not necessarily represent those of their affiliated organizations, or those of the publisher, the editors, and the reviewers. Any product that may be evaluated in this article, or claim that may be made by its manufacturer, is not guaranteed or endorsed by the publisher.
References
Buyantuyev, A., and Wu, J. (2009). Urbanization Alters Spatiotemporal Patterns of Ecosystem Primary Production: A Case Study of the Phoenix Metropolitan Region, USA. J. Arid Environ. 73, 512–520. doi:10.1016/j.jaridenv.2008.12.015
Chai, J., Wang, Z., Yang, J., and Zhang, L. (2019). Analysis for Spatial-Temporal Changes of Grain Production and farmland Resource: Evidence from Hubei Province, central China. J. Clean. Prod. 207, 474–482. doi:10.1016/j.jclepro.2018.10.008
Chen, W., Huang, C., Wang, L., and Li, D. (2018). Climate Extremes and Their Impacts on Interannual Vegetation Variabilities: a Case Study in Hubei Province of Central China. Remote Sens. 10, 477. doi:10.3390/rs10030477
Chu, D., Shen, H., Guan, X., Chen, J. M., Li, X., Li, J., et al. (2021). Long Time-Series NDVI Reconstruction in Cloud-Prone Regions via Spatio-Temporal Tensor Completion. Remote Sens. Environ. 264, 112632. doi:10.1016/j.rse.2021.112632
Fang, Y., Tang, H., and Lin, D. (2000). Global Ecology: Climate Change and Ecological Responses, 18. Beijing and Heidelberg: China Higher Education Press and Springer-Verlag Press, 113–121.
Gao, Q., Li, X., and Yang, X. (2003). Responses of Vegetation and Primary Production in north-south Transect of Eastern China in Global Change under Land Use Constraint. Acta Botan. Sin. 45, 1274–1284.
Gao, Q., Li, Y., Wan, Y., Qin, X., Jiangcun, W., and Liu, Y. (2009). Dynamics of alpine Grassland NPP and its Response to Climate Change in Northern Tibet. Clim. Change 97, 515–528. doi:10.1007/s10584-009-9617-z
Guan, X., Chen, J., Shen, H., and Xie, X. (2021). A Modified Twoleaf Light Use Efficiency Model for Improving the Simulation of GPP Using a Radiation Scalar. Agric. Meteorol. 307, 108546. doi:10.1016/j.agrformet.2021.108546
He, J., Zhang, P., Jing, W., and Yan, Y. (2018). Spatial Responses of Net Ecosystem Productivity of the Yellow River Basin under Diurnal Asymmetric Warming. Sustainability 10, 3646. doi:10.3390/su10103646
Jiang, W., and Zeng, Y. (2019). Relationship between Urbanization and Economic Growth in Hubei Province. Econ. Res. Guide 7, 45–46+63.
Li, J.-c., and Cheng, K.-m. (2006). An Analysis of Dynamic Econometric Relationship between Urbanization and Economic Growth in China [J]. J. Finance Econ. 9, 19–30.
Li, H. (2019). Empirical Analysis on the Effect of Population Concentration and Urban Agglomeration on Economic Growth -- a Case Study of Chi- Na's Ten Largest Urban Agglomeration. J. Henan Univ. (Soc. Sci.) 59, 43–52.
Lin, A., Zhu, H., Wang, L., Gong, W., and Zou, L. (2016). Characteristics of Long-Term Climate Change and the Ecological Responses in central China. Earth Interact. 20, 1–24. doi:10.1175/ei-d-15-0004.1
Lu, D., Tian, H., Zhou, G., and Ge, H. (2008). Regional Mapping of Human Settlements in southeastern China with Multisensor Remotely Sensed Data. Remote Sens. Environ. 112, 3668–3679. doi:10.1016/j.rse.2008.05.009
Lu, D., Xu, X., Tian, H., Moran, E., Zhao, M., and Running, S. (2010). The Effects of Urbanization on Net Primary Productivity in southeastern China. Environ. Manage. 46, 404–410. doi:10.1007/s00267-010-9542-y
Luo, Z., Wu, W., Yu, X., Song, Q., Yang, J., Wu, J., et al. (2018). Variation of Net Primary Production and its Correlation with Climate Change and Anthropogenic Activities over the Tibetan Plateau. Remote Sens. 10, 1352. doi:10.3390/rs10091352
Peng, J., Li, Y., Tian, L., Liu, Y., and Wang, Y. (2015). Vegetation Dynamics and Associated Driving Forces in Eastern China during 1999-2008. Remote Sens. 7, 13641–13663. doi:10.3390/rs71013641
Piao, S., and Fang, J. (2003). Seasonal Changes in Vegetation Activity in Response to Climate Changes in China between 1982 and 1999. Acta Geogr. Sin. 1. doi:10.1007/BF02948883
Potter, C. S., Randerson, J. T., Field, C. B., Matson, P. A., Vitousek, P. M., Mooney, H. A., et al. (1993). Terrestrial Ecosystem Production: a Process Model Based on Global Satellite and Surface Data. Glob. Biogeochem. Cycles 7, 811–841. doi:10.1029/93gb02725
Potter, C., Klooster, S., Myneni, R., Genovese, V., Tan, P.-N., and Kumar, V. (2003). Continental-scale Comparisons of Terrestrial Carbon Sinks Estimated from Satellite Data and Ecosystem Modeling 1982-1998. Glob. Planet. Change 39, 201–213. doi:10.1016/j.gloplacha.2003.07.001
Potter, C., Klooster, S., Crabtree, R., Huang, S., Gross, P., and Genovese, V. (2011). Carbon Fluxes in Ecosystems of Yellowstone National Park Predicted from Remote Sensing Data and Simulation Modeling. Carbon Balance Manage 6, 3. doi:10.1186/1750-0680-6-3
Shang, E., Xu, E., Zhang, H., and Liu, F. (2018). Analysis of Spatiotemporal Dynamics of the Chinese Vegetation Net Primary Productivity from the 1960s to the 2000s. Remote Sens. 10, 860. doi:10.3390/rs10060860
Shen, L., Wang, H., Zhu, B., Zhao, T., Liu, A., Lu, W., et al. (2021). Impact of Urbanization on Air Quality in the Yangtze River Delta during the COVID-19 Lockdown in China. J. Clean. Prod. 296, 126561. doi:10.1016/j.jclepro.2021.126561
Solecki, W., Seto, K. C., and Marcotullio, P. J. (2013). It's Time for an Urbanization Science. Environ. Sci. Pol. Sustain. Dev. 55, 12–17. doi:10.1080/00139157.2013.748387
Song, G., Yu, M., Liu, S., and Zhang, S. (2015). A Dynamic Model for Population Mapping: a Methodology Integrating a Monte Carlo Simulation with Vegetation-Adjusted Night-Time Light Images. Int. J. Remote Sens. 36, 4054–4068. doi:10.1080/01431161.2015.1073862
Sun, W., Zhang, X., Wang, N., and Cen, Y. (2017). Estimating Population Density Using DMSP-OLS Night-Time Imagery and Land Cover Data. IEEE J. Sel. Top. Appl. Earth Observ. Remote Sens. 10, 2674–2684. doi:10.1109/jstars.2017.2703878
Tan, K., Zhou, S., Li, E., and Du, P. (2015). Assessing the Impact of Urbanization on Net Primary Productivity Using Multi-Scale Remote Sensing Data: a Case Study of Xuzhou, China. Front. Earth Sci. 9, 319–329. doi:10.1007/s11707-014-0454-7
Tao, J., Wu, W., and Liu, W. (2017). Spatial-Temporal Dynamics of Cropping Frequency in Hubei Province over 2001-2015. Sensors 17, 2622. doi:10.3390/s17112622
Wang, H., Li, X., Long, H., Gai, Y., and Wei, D. (2009). Monitoring the Effects of Land Use and Cover Changes on Net Primary Production: A Case Study in China's Yongding River basin. For. Ecol. Manag. 258, 2654–2665. doi:10.1016/j.foreco.2009.09.028
Wang, L., Gong, W., Ma, Y., Hu, B., and Zhang, M. (2014). Photosynthetically Active Radiation and its Relationship with Global Solar Radiation in Central China. Int. J. Biometeorol. 58, 1265–1277. doi:10.1007/s00484-013-0690-7
Wang, X., Tan, K., Chen, B., and Du, P. (2017). Assessing the Spatiotemporal Variation and Impact Factors of Net Primary Productivity in China. Sci. Rep. 7, 44415. doi:10.1038/srep44415
Wang, L., Wang, S., Zhou, Y., Liu, W., Hou, Y., Zhu, J., et al. (2018). Mapping Population Density in China between 1990 and 2010 Using Remote Sensing. Remote Sens. Environ. 210, 269–281. doi:10.1016/j.rse.2018.03.007
Xie, X., Li, A., Guan, X., Tan, J., Jin, H., and Bian, J. (2021). A Practical Topographic Correction Method for Improving Moderate Resolution Imaging Spectroradiometer Gross Primary Productivity Estimation over Mountainous Areas. Int. J. Appl. Earth Observ. Geoinform. 103, 102522. doi:10.1016/j.jag.2021.102522
Xu, X., Tan, Y., Yang, G., Li, H., and Su, W. (2011). Impacts of China's Three Gorges Dam Project on Net Primary Productivity in the Reservoir Area. Sci. Total Environ. 409, 4656–4662. doi:10.1016/j.scitotenv.2011.08.004
Yan, Y., Liu, X., Wang, F., Li, X., Ou, J., Wen, Y., et al. (2018). Assessing the Impacts of Urban Sprawl on Net Primary Productivity Using Fusion of Landsat and MODIS Data. Sci. Total Environ. 613-614, 1417–1429. doi:10.1016/j.scitotenv.2017.09.139
Yang, X., Yue, W., and Gao, D. (2013). Spatial Improvement of Human Population Distribution Based on Multi-Sensor Remote-Sensing Data: an Input for Exposure Assessment. Int. J. Remote Sens. 34, 5569–5583. doi:10.1080/01431161.2013.792970
Yu, D., Shi, P., Shao, H., Zhu, W., and Pan, Y. (2009). Modelling Net Primary Productivity of Terrestrial Ecosystems in East Asia Based on an Improved CASA Ecosystem Model. Int. J. Remote Sens. 30, 4851–4866. doi:10.1080/01431160802680552
Yue, T. X., Wang, Y. A., Chen, S. P., Liu, J. Y., Qiu, D. S., Deng, X. Z., et al. (2003). Numerical Simulation of Population Distribution in China. Popul. Environ. 25, 141–163. doi:10.1023/b:poen.0000015562.88915.01
Yue, W., Gao, J., and Yang, X. (2014). Estimation of Gross Domestic Product Using Multi-Sensor Remote Sensing Data: A Case Study in Zhejiang Province, East China. Remote Sensing 6, 7260–7275. doi:10.3390/rs6087260
Zhang, N., Mao, F., and Gong, W. (2011). Estimation of Net Primary Productivity of Wuhan in 2009[J]. Geomatics Inf. Sci. Wuhan Univ. 36, 1447–1450.
Zhang, Y., Zhang, C., Wang, Z., Chen, Y., Gang, C., An, R., et al. (2016). Vegetation Dynamics and its Driving Forces from Climate Change and Human Activities in the Three-River Source Region, China from 1982 to 2012. Sci. Total Environ. 563-564, 210–220. doi:10.1016/j.scitotenv.2016.03.223
Zhao, N., Currit, N., and Samson, E. (2011). Net Primary Production and Gross Domestic Product in China Derived from Satellite Imagery. Ecol. Econ. 70, 921–928. doi:10.1016/j.ecolecon.2010.12.023
Glossary
APAR Absorbed photosynthetically active radiation
CASA Carnegie–Ames–Stanford Approach
DEM Digital elevation model
DBF Deciduous broadleaf forest
DT Decreasing trend
EAHSI Elevation-adjusted human settlement index
ENF Evergreen needleleaf forest
EBF Evergreen broadleaf forest
FPAR Fraction of photosynthetically active radiation
GLO-PEM Global production efficiency model
GDP Gross domestic product
HIS Human settlement index
IT Increased trend
LUE Light-use efficiency
MRT MODIS Reprojection Tool
MVC Maximum value composite
MF Mixed forest
MRE Mean relative error
NGDC National Geophysical Data Center
NDVI Normalized difference vegetation index
NTLs Nighttime lights
NPP Net primary productivity
NC Negative correlation
PC Positive correlation
RE Relative error
R2 Determination coefficient
SDT Significant decreasing trend
SIT Significant increasing trend
SNC Significant negative correlation
SPC Significant positive correlation
UTM Universal Transverse Mercator
Keywords: NPP, CASA, spatiotemporal dynamics, urbanization, Hubei province
Citation: Wu K, Zhou C, Zhang Y and Xu Y (2022) Long-Term Spatiotemporal Variation of Net Primary Productivity and Its Correlation With the Urbanization: A Case Study in Hubei Province, China. Front. Environ. Sci. 9:808401. doi: 10.3389/fenvs.2021.808401
Received: 03 November 2021; Accepted: 02 December 2021;
Published: 10 January 2022.
Edited by:
Xinyao Xie, Institute of Mountain Hazards and Environment (CAS), ChinaReviewed by:
Jianbo Tan, Changsha University of Science and Technology, ChinaWeiwei Sun, Ningbo University, China
Copyright © 2022 Wu, Zhou, Zhang and Xu. This is an open-access article distributed under the terms of the Creative Commons Attribution License (CC BY). The use, distribution or reproduction in other forums is permitted, provided the original author(s) and the copyright owner(s) are credited and that the original publication in this journal is cited, in accordance with accepted academic practice. No use, distribution or reproduction is permitted which does not comply with these terms.
*Correspondence: Ke Wu, kewu@cug.edu.cn