- 1School of Economics, Capital University of Economics and Business, Beijing, China
- 2Business School, Shanghai Jianqiao University, Shanghai, China
- 3School of International Trade and Economics, University of International Business and Economics, Beijing, China
- 4Department of Economics, University of Sahiwal, Sahiwal, Pakistan
- 5School of Economics, Bahauddin Zakariya University, Multan, Pakistan
- 6Department of Economics, Ghazi University, DG. Khan, Punjab, Pakistan
The global community has set intensive targets in Sustainable Development Goals (SDGs) to better people’s lives after closing the Millennium Development Goals (MDGs). It corresponds to the 2030 aspirations of the United Nations to enhance and promote the sustainable development of human society. The current paper explores the impact of fiscal hedging and R&D in energy Using a green-energy system in SDGs. To do this, we used TOPSIS and QARDL methodologies on a 21-year dataset of South and Southeast Asian economies from 2000 to 2020. The study results show that fiscal hedging contributes favourably to the environmental degradation of the underlying economy. Research and development (R&D) in renewables has contributed negatively to ecological degradation and SDGs in the economies of South & Southeast Asia. This study suggests policy guidelines for advanced and developing economies based on fiscal stability and technical innovation through R&D to meet SDG.
Introduction
The changing climate is escalating and impacting people through the activation of unpleasant situations such as storms, forest fires and floods. It involves preparing to cope with the effects of climate change. According to the Paris agreement, it will emerge that we can halt global warming by two degrees Celsius. The global population is predicted to expand up to 85 thousand million by the end of 2030 (Desa, 2015). It is expected that 90% of humans are inhaling poisonous oxygen. If we do not minimize carbon emissions to lessen the rate of respiratory diseases, 7 million more humans will lose their lives per year. Contaminated water causes 5 million fatalities every year and adds to significant threats to health (World Health Organization, 2018). Extinction-threatened species have lost approximately 8 percent of their habitat during the last 2–3 decades (Schaffer-Smith et al., 2016). In addition, another 22 percent of the species are in danger of rapid depletion of breeding, endangered species introduction, and global warming.
The emerging world is faced with a dynamic economic development process, with environmental conservation to achieve sustainability. Fiscal imbalances became an immediate issue in almost every developing country in the economy’s growth as the emergence of fiscal deficits adapted the imbalance in the short term. Simultaneously, an environmental effect is also unsatisfactory. The rising budget deficit calls for fiscal stabilization. The intertemporal nexus between fiscal imbalance and ecological conditions has become an extensive debate and research subject.
Fiscal imbalances and have financial and social costs. According to the UN Development Program (UNDP), infant mortality rates, illness, analphabetic, and malnutrition are significantly higher in the heavily indebted and fiscal imbalance developing countries than other developing countries (Hager, 2016). It has been estimated that eighty-six percent (six out of seven) of African countries spend more resources on debt servicing (i.e., interest and principal repayments) than on projects like literacy, child mortality, malnutrition, and primary health care services. It is expected that spending such money (debt service) can help five million children survive for their fifth birthday, and millions of malnutrition cases would be stopped (Pettifor, 2002).
Emerging economies have already undergone instability cycles under the current wave of debt accumulation, while the COVID-19 pandemic struck extreme financial stress on these economies. Other vulnerabilities such as increasing fiscal and current account deficits and adopting riskier debt further complicate these economies’ capacity to sustain financial stress. In percentage, the government debt (in percentage) owned by non-resident investors increased to 43%, and corporate debt denominated in foreign currencies grew 26% of GDP in 2018. A decade of recurring growth disappointment has followed a rising stock of fiscal deficit and a riskier debt composition in these economies. The technological innovation promises to address modern nations’ environmental concerns by advancing towards a cleaner, lower carbon atmosphere. Thus, technologies without environmental damage are essential to preserving and improving living standards. Scientists would be convinced that environmental breakthroughs in technology are the only way to save our globe. Emerging innovations have traditionally been established in response to demographical concerns and requirements.
According to the United Nations, more than 60% of Carbon footprints are generated by oil. In comparison, 13% of the world’s people have no light, while over three billion people are dependent on coal and oil for their heating and cooking (Bennion et al., 2015). This circumstance requires energy transfer to a cleaner type that supports a more affluent, sustainable, and environmentally friendly, inclusive society, considering environmental issues. Experts have demonstrated to use of so-called renewable energies to prevent climate change. Researchers are attempting to produce improvements to mitigate global climate change. Experts claim that so-called green solutions be used to protect the environment. Scientists strive to develop ideas to mitigate greenhouse gases and environmental issues globally. There are numerous ways in the future to deal with energy shortages. The first of two ideas on ecological sustainability above political and cultural concerns distinguish green technology from environmental sustainability. Sustainable development supporters suggest that green energy is non-existent but can only be established and explored. With the support of sustainable technology, sustainable development will occur. Sustainability depends on technological advancement, which further minimizes carbon dioxide emissions.
The remaining components of the investigation are as follows. The next part is a brief description of the literature. Section 2 illustrates the analytical process. The results are detailed in section 3 and section 4 examines the conclusions and discusses the policy implications.
Literature Review
In recent years, environmental and energy economists have drawn attention to the relationship between fiscal Instruments and ecological efficiency. However, the experiments in the current literature are quite limited (Yuelan et al., 2019) noted that instruments of fiscal imbalance have substantially increased long-term environmental degradation in China. The United States’ government investments hurt the climate (Yoshino et al., 2021). There are temporary carbon dioxide emissions, public revenue, and government spending patterns. The (Ullah et al., 2020) study indicated that fiscal-instrument shock would worsen environmental quality in selected economies in Asia, except Japan, which tends to boost environmental quality with broad fiscal imbalances.
The environmental impacts of fiscal instruments can vary depending on their emission source, i.e., whether pollution is caused by production or consumption (Lederer et al., 2018; Taghizadeh-Hesary and Yoshino, 2020) identified the different means through which public spending can influence the environment’s quality for pollutants emitted by production. Because of pollution produced by consumption, fiscal expenditures in fields such as education and health enhance consumers’ present and future revenues and decrease environmental quality. On the other hand, the higher levels of government expenditure help create environmental legislation, compliance, and productivity, which can help build institutions that improve environmental quality (Rasoulinezhad et al., 2020; Ike et al., 2020; Shan et al., 2020). Proposed four channels by which fiscal expenditure could affect atmospheric pollution concentrations, namely “size, structure, method, and income effects.” Additionally, (Sun Y. et al., 2020) distinguish between public expenditure’s direct and indirect environmental impacts. Government expenditure is being used both explicitly and implicitly to mitigate environmental impact, although the impact of government expenditure on carbon emissions is not definitive.
The fiscal imbalance negatively affects environmental quality, spreading beyond a country’s borders. Therefore, rectifying a single country’s fiscal imbalance issue cannot address the region’s ecological concern. According to (Li et al., 2020), regions with a substantial improvement in fiscal imbalance have sufficient funds for environmental governance, manage environmental laws effectively, and reduce regional ecological contamination. Thus, the externalities of environmental contamination and the positive spillover effect of environmental governance usually give rise to a “free-riding” phenomenon between regions. This growth leads to competing rather than collaboration with the inter-regional environmental governance model (Chang, 2019). Contrarily, increasing fiscal imbalance in the regional governance arrangement would lessen environmental status, draw international investments’ attention, and improve revenue collection through tax. This phenomenon leads to a “race to the bottom” ecological governance and the source of environmental deterioration (Wang et al., 2019).
Moreover, (Abbas et al., 2020b) suggested that the fiscal imbalance has a notable impression on selecting regional administration spending behaviour at the institutional level. Thus, the biased structure becomes increasingly severe as the fiscal imbalance (Li, 2018). As a result, it is also expected that the higher the level of expansion of fiscal imbalance, the higher the misallocation of resources, and the result will be the loss of efficiency (Sun H. et al., 2020; Iqbal N. et al., 2020). Individual countries progressively impose huge taxes and financing on infrastructure and building programs because of fiscal income and spending imbalances. It raises taxes, threatens mass livelihood security, and enhances environmental consequences, not boosting environmental governance and productivity. (Zhou et al., 2019; Abbas et al., 2020a). Besides, the regional government assumes the environmental policymaker’s responsibility and undertakes the implementation (Anser et al., 2020a).
Across history, creativity has been an integral part of economic development. New technology, creative mechanisms to minimize the divide between developing and developed countries should be built (Pigliautile et al., 2020). In each case, some technologies–including those with substantial economic consequences–can involve unavoidable trade-offs which need to be identified, evaluated, and addressed (Jorge, 2018). The advancement of energy technologies will achieve sustainability (Iqbal W. et al., 2020; Iram et al., 2020). It is only feasible if worldwide fossil fuel consumption is reduced. Technical measures should enhance energy supply, efficiency, and a more environmentally sustainable transition to oil and coal technology. Renewable energy technologies go out quicker than ever and are readily accessible to the general public (Viteri et al., 2019). Environmental technologies are designed to promote energy efficiency in the economic sectors (Anser et al., 2020b). Businesses must use green technology to ensure environmentally-friendly (Marseglia et al., 2020). We need to build indigenous technological expertise that contains skilled professionals, academics (Hanif et al., 2019).
The recent research attempted to explore this relationship with different methods. For example, (Katircioğlu et al., 2018) have checked Turkey’s value of environmental quality fiscal instruments utilizing linear ARDL (Ullah et al., 2021). Consult with the asymmetrical or non-linear autoregressive distributed lag (NARDL) method for these two parameters’ asymmetric effect in Pakistan. (Hanif et al., 2019) applied ECM to investigate fiscal instruments’ short and long-term role with renewable energy at CO2 emission levels. Similarly, (Akhmat et al., 2014) implemented the FMOLS technique and validated it for SAARC nations (Jebli et al., 2016) has used panel FMOLS and DOLS frameworks to OECD countries and endorsed the correlation between fiscal instruments and environmental degradation.
Studies have recognized the correlation between environmental degradation and financial indicators, but fiscal factors in the outgoing literature remain lacking. The fiscal position of ecological quality can both enhance and mitigate Carbon emission. Fiscal policy tools are described as income impact, structure effect, and technical effect. Income impact: Higher income, typically linked to increased public spending, boosts demand for better environmental quality. Structure effect: Substantial fiscal expenditure encourages less disruptive environmental practices than practices that exacerbate physical wealth. Technical effect: This mechanism also aims to reduce environmental pollution, increasing labour productivity correlated with improved government health and educational expenditure costs. Therefore, this analysis contains and outlines the effect of fiscal policy instruments and government spending on environmental degradation. Over the period 2000–2020, the current study examines the complex relationships between fiscal policy tools and Carbon emission for Southeast Asian countries. This research’s scope is broader because the research concentrates on fiscal policy and the relatively limited economy. The existing studies concentrated on the fiscal policy’s public spending component; thus, few studies focus on government spending and income instruments. The issue of environmental degradation due to GHG emissions can only be addressed with the necessary fiscal retort. There is no need for positive and adverse shocks to have a linear impact on fiscal policy instruments’ environmental efficiency. It is, therefore, necessary to assess the asymmetric effect on ecological efficiency of the modifications to fiscal policy tools. Our research diverges from the empirical literature by suggesting that fiscal policy tools’ impacts on environmental efficiency may be asymmetrical. That is, why in this study, we used the QARDL methodology. This study also applied the TOPSIS method to view the underlined economies’ overall efficiency to understand better their economic, energy, fiscal, and environmental conditions.
Data and Methodology
This study analyzed the 21 years (2000–2020) of six developing economies (three from South and Southeast Asia each). The dataset was collected from the International Energy Agency’s (IEA 2020), IMF, and World Development Indicators (WDI) comprises 11 separate parameters of South & Southeast Asian nations (see Appendix 1). These parameters have been divided into four distinct categories. As an ecological index (ENV), the air and greenhouse gas emissions (Tonne cap) and air pollution (10 million HAB) were developed, with the energy index including renewable energy (KTOE) and renewable energy (GDP percent) (ENG). The General Government Deficit (percent GDP) and Real Interest Rate percent were developed in a fiscal index (FIL). Subsequently, a Financial Index (ECO) was built utilizing the USD, exports (GDP percentage), consumer price indices (CPI percentage), and GDP (current USD).
TOPSIS is a good choice for making multi-attribute decisions because of its simplicity and quickness. However, TOPSIS has two key limitations: rank reversal and invalidation of Euclidean distance. To overcome the shortcomings to evaluation, this study incorporates absolute optimized solutions (Che et al., 2021) and virtual negative ideal solutions.
(1) Creating a judgment matrix with a starting point. As a result, the performance of the measure j for nation i is denoted by
(2) In order to derive the usual decision matrix
(3) Designing weighted decision tables. The weights generated by a rough set and a large-scale survey are used since the value of variables to evaluation differs.
Let
(4) Choosing the best possible options. Rankings are reversed because of selecting optimal solutions at random. Absolute positive and negative ideal solutions determine indicators during our period studied. The number of subjects (countries) in this study will remain the same because of a lack of data. The maximum and the minimum will not grow or contract. To put it another way, the absolute optimistic ideal solutions are defined as
(5) Improve TOPSIS by incorporating a virtual negative optimal situation. Virtual negative ideal solutions
(6) The relative closeness is defined as
Rough set, a large-scale survey and enhanced TOPSIS are used to create an integrated strategy that involves three steps: data preprocessing, weighted decision matrix and modified TOPSIS evaluation.
At the outset, we create a decision matrix
Because it uses a single reference point, the fixed-base difference approach can capture spatial and temporal differences among indicators. We perform the following calculation: It’s the ratio of
Finally, the weights are computed by multiplying the subjective and objective values.
There is a total of m different weighing methods in the formula
Quantile Regression for Panel Data
Consider the following model
Where
Based on the premise that
In such case, the considerations limitation
Whenever ηi is not disturbed, a regression analysis like this one can be used to determine the value of
A penalization parameter,
Assuming
Results
In the first part of this section, we applied the TOPSIS to measure all variables’ overall efficiency in this dataset. Here, the indicators are divided into two different segments: positive indicators and negative type indicators. This work’s novelty is that we have added a fiscal predictor for the first time to view its impact on environmental conditions via R&D expenditures and green energy projects.
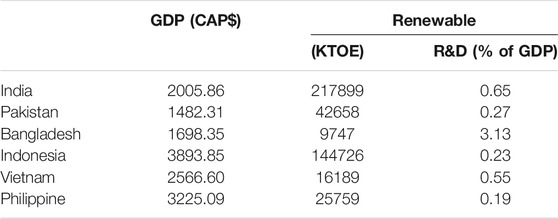
The positive indicators are mentioned and summed up in Table 1. Indonesia is the largest country with a per capita GDP, trailed by the Philippines and Vietnam, from countries in Southeast Asia. India leads the side in South Asian countries, followed by Bangladesh and Pakistan. Here is a considerable gap in GDP per capita between South and Southeast Asian economies. However, the condition of renewable energy sources is much different. South Asian economies lead the side as India generates 217899ktoe of renewable energy source followed by 144726 of Indonesia of Southeast Asian County. Again, the expenditure on R&D is the percentage of total GDP, Bangladesh spending 3.13 percent of total GDP followed by second South Asian country (India) with 0.65 percent. Here the overall expenditure in the field of R&D as a percentage of GDP in South and Southeast Asian economies is deficient, which could be the fundamental reason for their late conversion towards green energy projects.
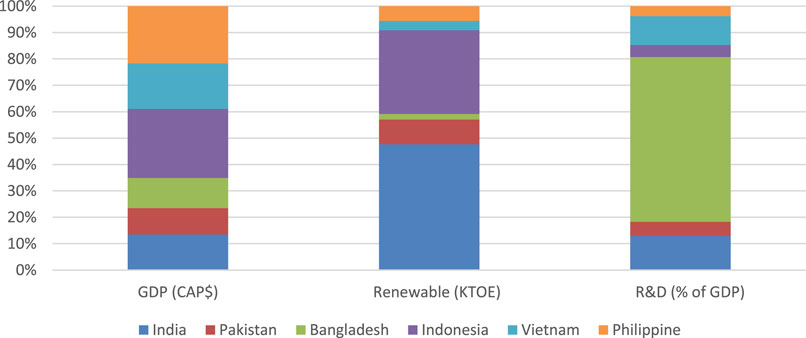
According to Figure 1, even though the GDP per capita performance is much better in the Southeast Asin region, their contribution in renewable energy production is minimal concerning South Asian economies whose renewable energy sources contribute better than Southeast Asian economies. The main difference between these two differences could be the expenditure in R&D. South Asians spend much more percentage of their GDP in R&D compared to Southeast Asian economies. Here, we can see that overall R&D expenditure in R&D as a percentage of GDP in renewable energy is deficient compared to developed economies. It is straightforward that these economies do have not sustainable economic conditions, and they must do debt financing for the developed world to meet their day-to-day expenditures. Therefore, they spend much less on R&D in renewable energy projects.
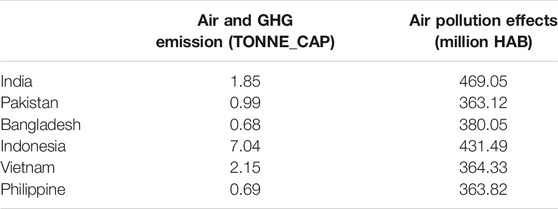
According to Table 2 of cost type indicators, Indonesia has the highest air and GHG emission per capita (7.04 tonnes), followed by another Southeast Asian country, Vietnam (2.15 tonnes). India holds the third position with 1.85 tonnes of Air and GHG emission in this line; however, it keeps the first air pollution effects with 469.05 (Million HAB). Here, Indonesia holds the second position in air pollution effects with 431.49 (Million HAB).
To overcome air and GHG and environmental degradation, it needs intensive money for economic, R&D, and technological innovations. However, these developing economies prefer to meet their necessary expenditures. Due to high fiscal imbalance, they must pay tremendous money to developed economies’ interest rates or principles.
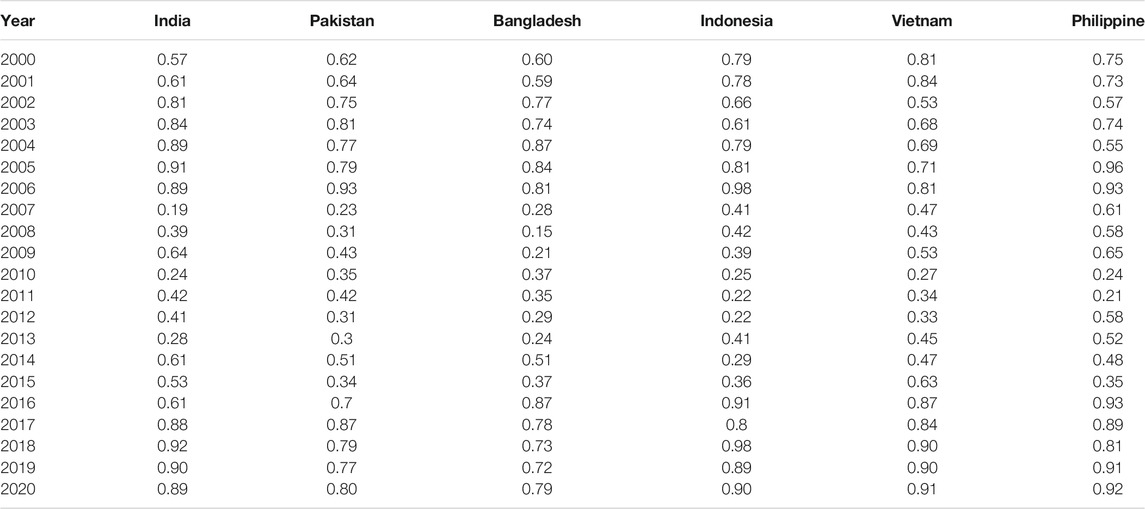
Table 3 shows considerable fluctuations in the underline indicators in both regions after including the fiscal indicators in the TOPSIS index. It may happen due to inconsistent economic and fiscal policies. Due to fiscal deficit and high dependency on international financial institutions, most countries perform averagely in renewable energy production, R&D in renewable energy projects, economic progress, and sustainable environmental conditions.
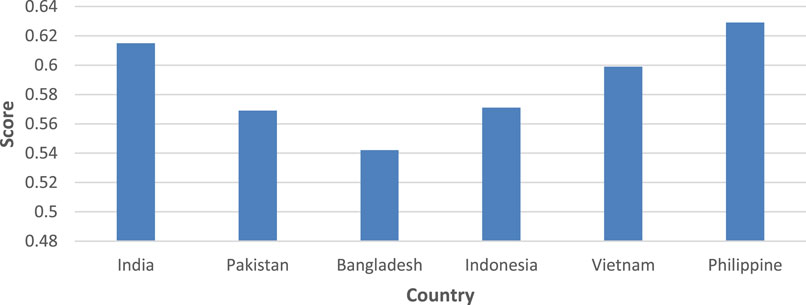
Figure 2 shows the overall performance of underline economies in the TOPSIS method. According to the outcomes, the Philippines attained the highest position in TOPSIS index performance with a 0.63 score, followed by India with 0.61. Vietnam is third in line with a 0.60 score. Indonesia and Pakistan secure the fourth position with 0.67, while Bangladesh is the low-performance country in this data set with a 0.54 score. Here, the overall TOPSIS index conditions are deplorable as not a single country could attain a high score between 0.90–1, which could be ideal in this regard. We can also see that all these South and Southeast Asian economies’ average score is 0.58, respectively.
This average TOPSIS index score shows that fiscal indicators have a multidimensional impact on R&D, green energy projects, and economic growth. The more stable an economy, the higher the expenditure on R&D, and the higher the output of R&D in the form of green energy project completion.
Considering the above outcomes, this study expends empirical analysis by applying the QARDL technique to verify the outcomes’ composite index results and robustness. The consequences of the QARDL research are presented as under:
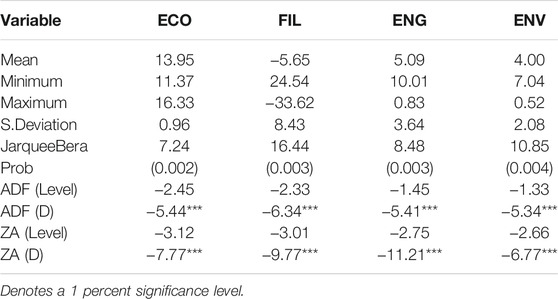
Table 4 presents the statistical summary of the underlined variables and their results of a unit root.
Table 5 shows the correlation matrix of the variable. According to the outcomes, there is no correlation among the variables.
The OLS and Quantile Estimates values appear in Table 6. This research demonstrated that the energy coefficient was statistically significant and adversely influenced the calculation. The coefficient signs for “ENG” are consistent; it shows a strong association statistically with the dependent component (i.e., environment or ENV). QARDL performances also support the results of long-term estimates based on the ARDL model. The findings have shown that research and development technical advancements in renewable energy play an essential role in environmental quality and control of its deterioration.
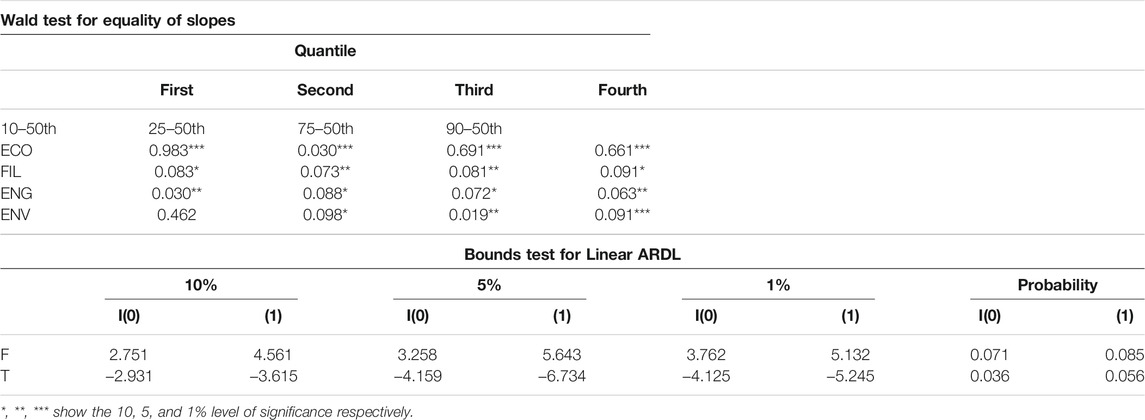
Diagnostic inspections have been carried out through Wald and Bound tests in the Table 7. According to these statistics, the measured F-statistic is quantitatively more significant than the upper and lower limits of the distribution. It implies that economic complexity and energy use clearly correlate to impacts on the environment. Statisticians in Wald reject the null hypothesis of term and cointegration for error correction substantially. It indicates that CO2 emissions are not linear with economic complexity and energy use in South and Southeast Asia. The tests of Wald test and Levene suggest that investigators have received sufficient evidence to reject the zero-constancy hypothesis. Based on the results obtained from the Wald test, the null hypothesis is rejected since it is significant in long and short periods for the co-integrated heteroskedasticity set factors.
Discussion
The TOPSIS results indicate that countries of both the regions (South and Southeast) are suffering to attain a high index score based on benefit and cost type analysis. The average score of South and Southeast Asian economies is around 50% which is considered very poor regarding sustainable development and the environment. It could be due to low R&D expenditures, low renewable energy projects, high fiscal imbalance, and inconsistent economic growth.
In these societies, fiscal hedging has a harmful impact on environmental degeneration, based on the empirical findings of QARDL. Results reveal that the higher the amount of fiscal shelter in these economies, the more significant the deterioration in the environment and the lower it is for SDG achievement. These results are also consistent with (Liao et al., 2019) on the empirical review of Guangdong’s province using panels of 21 cities from 2000 to 2016 and (Wen and Dai, 2020) for China’s environmental and fiscal imbalances during 1990–2016. Thus, global leaders devoted their resources, time, and money to emphasize the relevance of fiscal imbalance in SDGs.
The study evidence of technical innovations is also positively influencing a sustainable future. Hence, technological advances towards emission-free energy and production help develop the Asian economies towards the Sustainable Development Goals. Empirically, technical advances in renewable energy may contribute to sustainable environmental circumstances through sustainable growth. This research evidence matches the studies of (Ashin and Muhammed, 2020; Cerdeira Bento and Moutinho, 2016). It is a question of supporting and involving investment and policy, regulatory, R&D, and other partners. By assessing their accomplishments, utilizing their skills, and setting their constraints, economies can enhance their competitive advantages and benefit from recommended practice as modernization principals at all revenue stages by emerging nations. Technical improvements enable a longer-term planning process for a more permanent organization. One of the main economic difficulties lies in the exchange between sustainability and the economy. Globally, we confront the significant damage to the environment and technology to solve this issue.
The energy contribution index in the sustainable environment procedure is favourable. Here, as the more R&D (GDP percentage) funding for energy production, the more sustainable the South-Southeast Asian economies will be. The inclusive green economy is the path to sustainable development (Iram et al., 2019; Baloch et al., 2020). studies indicated that more excellent net value of research and development to foster renewable energy businesses or innovations would result in sustainable performance. At the same time, (Iqbal et al., 2019) experimentally demonstrated that only green and highly effective economic and environmental imbalances could be solved. It shows that the more liberalized the financial sector, the greater the capacity for developing Asian countries to safeguard the environment under the SDG standards. Thus, financial competence is quite essential in sustainable growth and environmental preservation.
A fundamental correlation existed here between sustainable use of energy, innovation, and economic growth. Our research suggests that the economic development of renewable energy through R&D through the financial and technical improvements has a significant and good effect on non-carbon and green energy production. It promotes energy supply strategies to encourage a cohesive energy supply and long-term economic development (Omri, 2014). In this respect, too, a durable balance is proven between the real GDP, the consumption of renewables, and the short-term bi-directions between renewable energy use and economic growth (Apergis and Payne, 2010). The practical usage of renewable energy sources is suggested to be of low expertise.
The inadequacy of funding for incorporating clean energy in the energy mix might also be related. Dual links between clean energy usage and economic progress may also exist. Monetary support is needed as clean energy can be used by the wealthiest nations (Ntanos et al., 2018). Moreover, the outcomes of the country-specified studies show that several of this research varied from energy usage to economic development (Ozturk, 2010). This research highlights the benefits of government measures, such as renewable energy growth tax credits and renewable energy.
Conclusion
This study evaluates fiscal imbalances, renewable energy R&D, and technologies in a carbon-free energy economy for sustainable development. To this goal, four independent indices were recognized: the financial index, the energy index, the fiscal index, and the environmental index, predicated on the South and South Asia economy data for 18 years. The findings are significant because of the worry of economic expansion changing economic issues and environmental changes in developing economies. The composite index results show that the performance level in South and South-East Asia is terrible in renewable energy, fiscal imbalances, R&D spending, and environmental conditions. All these nations have a composite index score of approximately 50 percent.
The outcomes of the QARDL technique demonstrate that human capital makes an enormous and beneficial contribution to the carbon-free economy of the South and Southeast nations. Due to fiscal hedging, the SDG goal has become very hard to achieve. The research suggests that the technological improvement of renewable energy through R&D helps decrease greenhouse gas and accelerates the development process. Renewable energies are the critical factors of sustainable climate in emerging Asian economies. Increased R&D spending in traditional and green energy technology, reduced greenhouse gas emissions through cleaner energy trends and energy quality gains. Reduced greenhouse gases are therefore crucial in terms of global warming.
Policy Implication
Fiscal hedging is an effective indicator of sustainable development for green energy production and consumption. Countries with a high fiscal imbalance hold low R&D in energy and renewable energy projects.
• The climate change issue is not related to a single country or region. So, there is a need for a collective effort in the form of money, time, and expertise. Countries already suffering from fiscal imbalance will never fulfil their sustainable environment commitments. Therefore, developed economies and financial institutions should help these economies work for a sustainable environment and development.
• A crucial part of a sustainable environment is green energy. Controlling climate change is a significant aspect of improving environmental quality. Therefore, the transformation of green technological innovation in these developing countries is critical. Thus, the role of developed economies in sustainable developing economies is significant.
• Enable and encourage beneficiaries of public and private sector breakthroughs to leverage environmentally friendly innovations.
Data Availability Statement
The raw data supporting the conclusion of this article will be made available by the authors, without undue reservation.
Author Contributions
Conceptualization, done by LC; methodology, form by SA; software and validation, performed by CT; formal analysis did by RK; investigation, resources, data curation, performed by WY; writing—original draft preparation done by FG; writing-review and editing by LC; visualization, and supervision by RK.
Conflict of Interest
The authors declare that the research was conducted in the absence of any commercial or financial relationships that could be construed as a potential conflict of interest.
Publisher’s Note
All claims expressed in this article are solely those of the authors and do not necessarily represent those of their affiliated organizations, or those of the publisher, the editors and the reviewers. Any product that may be evaluated in this article, or claim that may be made by its manufacturer, is not guaranteed or endorsed by the publisher.
References
Abbas, Q., Khan, A. R., Bashir, A., Alemzero, D. A., Sun, H., Iram, R., et al. (2020a). Scaling up Renewable Energy in Africa: Measuring Wind Energy through Econometric Approach. Environ. Sci. Pollut. Res. 27, 36282–36294. doi:10.1007/s11356-020-09596-1
Abbas, Q., Nurunnabi, M., Alfakhri, Y., Khan, W., Hussain, A., and Iqbal, W. (2020b). The Role of Fixed Capital Formation, Renewable and Non-Renewable Energy in Economic Growth and Carbon Emission: A Case Study of Belt and Road Initiative Project. Environ. Sci. Pollut. Res. 27, 45476–45486. doi:10.1007/s11356-020-10413-y
Abrevaya, J., and Dahl, C. M. (2008). The Effects of Birth Inputs on Birthweight. J. Business Econ. Stat. 26, 379–397. doi:10.1198/073500107000000269
Akhmat, G., Zaman, K., and Shukui, T. (2014). Impact of Financial Development on SAARC′S Human Development. Qual. Quant. 48, 2801–2816. doi:10.1007/s11135-013-9926-1
Anser, M. K., Abbas, Q., Chaudhry, I. S., and Khan, A. (2020a). Optimal Oil Stockpiling, Peak Oil, and General Equilibrium: Case Study of South Asia (Oil Importers) and Middle East (Oil Supplier). Environ. Sci. Pollut. Res. 27, 19304–19313. doi:10.1007/s11356-020-08419-7
Anser, M. K., Mohsin, M., Abbas, Q., and Chaudhry, I. S. (2020b). Assessing the Integration of Solar Power Projects: SWOT-Based AHP-F-TOPSIS Case Study of Turkey. Environ. Sci. Pollut. Res. 27, 31737–31749. doi:10.1007/s11356-020-09092-6
Apergis, N., and Payne, J. E. (2010). Renewable Energy Consumption and Economic Growth: Evidence from a Panel of OECD Countries. Energy Policy 38, 656–660. doi:10.1016/j.enpol.2009.09.002
Ashin, N. M. K., and Muhammed, A. V. (2020). Role of Energy Use in the Prediction of CO2 Emissions and Economic Growth in India: Evidence from Artificial Neural Networks (ANN). Environ. Sci. Pollut. Res. 27, 23631–23642. doi:10.1007/s11356-020-08675-7
Baloch, Z. A., Tan, Q., Iqbal, N., Mohsin, M., Abbas, Q., Iqbal, W., et al. (2020). Trilemma Assessment of Energy Intensity, Efficiency, and Environmental index: Evidence from BRICS Countries. Environ. Sci. Pollut. Res. 27, 34337–34347. doi:10.1007/s11356-020-09578-3
Bennion, E. P., Ginosar, D. M., Moses, J., Agblevor, F., and Quinn, J. C. (2015). Lifecycle Assessment of Microalgae to Biofuel: Comparison of Thermochemical Processing Pathways. Appl. Energ. 124, 1062–1071. doi:10.1016/j.apenergy.2014.12.009
Cerdeira Bento, J. P., and Moutinho, V. (2016). CO2 Emissions, Non-renewable and Renewable Electricity Production, Economic Growth, and International Trade in Italy. Renew. Sustain. Energ. Rev. 55, 142–155. doi:10.1016/j.rser.2015.10.151
Chamberlain, G. (1982). Multivariate Regression Models for Panel Data. J. Econom. 18, 5–46. doi:10.1016/0304-4076(82)90094-X
Chang, C.-w. (2019). Industrial Structure and Economic Performance: The Role of Productive Public Expenditure. Rev. Dev. Econ. 23, 745–759. doi:10.1111/rode.12562
Che, X., Zhu, B., and Wang, P. (2021). Assessing Global Energy Poverty: An Integrated Approach. Energy Policy 149, 112099. doi:10.1016/j.enpol.2020.112099
Chernozhukov, V., and Hansen, C. (2008). Instrumental Variable Quantile Regression: A Robust Inference Approach. J. Econom. 142, 379–398. doi:10.1016/j.jeconom.2007.06.005
Desa, U. (2015). World Population Projected to Reach 9.7 Billion by 2050 | UN DESA | United Nations Department of Economic and Social Affairs. New York, NY: UN Dep. Econ. Soc. Aff.
Graham, B. S., and Powell, J. L. (2008). Identification and Estimation of “Irregular” Correlated Random Coefficient Models. Natl. Bur. Econ. Res. Work. Pap. Ser. 80 (5), 2105–2152. doi:10.3386/w14469
Hager, S. B. (2016). Public Debt, Inequality, and Power: The Making of a Modern Debt State. Oakland, CA: UC Press. doi:10.1525/luminos.14
Hanif, I., Faraz Raza, S. M., Gago-de-Santos, P., and Abbas, Q. (2019). Fossil Fuels, Foreign Direct Investment, and Economic Growth Have Triggered CO2 Emissions in Emerging Asian Economies: Some Empirical Evidence. Energy 171, 493–501. doi:10.1016/j.energy.2019.01.011
Ike, G. N., Usman, O., and Sarkodie, S. A. (2020). Fiscal Policy and CO2 Emissions from Heterogeneous Fuel Sources in Thailand: Evidence from Multiple Structural Breaks Cointegration Test. Sci. Total Environ. 702, 134711. doi:10.1016/j.scitotenv.2019.134711
Iqbal, N., Khan, A., Gill, A. S., and Abbas, Q. (2020). Nexus between Sustainable Entrepreneurship and Environmental Pollution: Evidence from Developing Economy. Environ. Sci. Pollut. Res. 27 (29), 36242–36253. doi:10.1007/s11356-020-09642-y
Iqbal, W., Fatima, A., Yumei, H., Abbas, Q., and Iram, R. (2020). Oil Supply Risk and Affecting Parameters Associated with Oil Supplementation and Disruption. J. Clean. Prod. 255, 120187. doi:10.1016/j.jclepro.2020.120187
Iqbal, W., Yumei, H., Abbas, Q., Hafeez, M., Mohsin, M., Fatima, A., et al. (2019). Assessment of Wind Energy Potential for the Production of Renewable Hydrogen in Sindh Province of Pakistan. Processes 7, 196. doi:10.3390/pr7040196
Iram, R., Anser, M. K., Awan, R. U., Ali, A., Abbas, Q., and Chaudhry, I. S. (2020). Prioritization of Renewable Solar Energy to Prevent Energy Insecurity: An Integrated Role. Singapore Econ. Rev. 66 (2), 391–412. doi:10.1142/s021759082043002x
Iram, R., Zhang, J., Erdogan, S., Abbas, Q., and Mohsin, M. (2019). Economics of Energy and Environmental Efficiency: Evidence from OECD Countries. Environ. Sci. Pollut. Res. 27 (4), 3858–3870. doi:10.1007/s11356-019-07020-x
Jebli, M. B., Youssef, S. B., and Ozturk, I. (2016). Testing Environmental Kuznets Curve Hypothesis: The Role of Renewable and Non-Renewable Energy Consumption and Trade in OECD Countries. Ecol. Indic. 60, 824–831. doi:10.1016/j.ecolind.2015.08.031
Katircioğlu, S., Alkhazaleh, M. M. H., and Katircioglu, S. (2018). Interactions between Oil Prices and Financial Sectors’ Performances: Empirical Evidence from Amman Stock Exchange. Environ. Sci. Pollut. Res. 25 (33), 33702–33708. doi:10.1007/s11356-018-3311-5
Koenker, R. (2004). Quantile Regression for Longitudinal Data. J. Multivar. Anal. 91, 74–89. doi:10.1016/j.jmva.2004.05.006
Lederer, M., Wallbott, L., and Bauer, S. (2018). Tracing Sustainability Transformations and Drivers of Green Economy Approaches in the Global South. J. Environ. Dev. 27 (1), 3–25. doi:10.1177/1070496517747661
Li, H. A. O., Bhatti, Z., Abbas, Q., Ahmad, I., Iqbal, N., and Aziz, B. (2020). Measuring Low Carbon Energy, Economic and Environmental Sustainability Performance of Brics. Singapore Econ. Rev, 1–20. doi:10.1142/S0217590820500617
Li, S. (2018). Study on the Impact of Local Public Expenditure on Housing Price—An Empirical Analysis Based on Provincial Panel Data. Mod. Econ. 09, 247–262. doi:10.4236/me.2018.92016
Liao, L., Du, M., Wang, B., and Yu, Y. (2019). The Impact of Educational Investment on Sustainable Economic Growth in Guangdong, China: A Cointegration and Causality Analysis. Sustain 11 (3), 766. doi:10.3390/su11030766
Marseglia, G., Vasquez-Pena, B. F., Medaglia, C. M., and Chacartegui, R. (2020). Alternative Fuels for Combined Cycle Power Plants: An Analysis of Options for a Location in India. Sustain 12 (8), 3330. doi:10.3390/SU12083330
N. Jorge (Editor) (2018). Innovation Systems, Policy and Management (Cambridge University Press). doi:10.1017/9781108529525
Ntanos, S., Skordoulis, M., Kyriakopoulos, G., Arabatzis, G., Chalikias, M., Galatsidas, S., et al. (2018). Renewable Energy and Economic Growth: Evidence from European Countries. Sustain 10 (8), 2626. doi:10.3390/su10082626
Omri, A. (2014). An International Literature Survey on Energy-Economic Growth Nexus: Evidence from Country-Specific Studies. Renew. Sustain. Energ. Rev. 38, 951–959. doi:10.1016/j.rser.2014.07.084
Ozturk, I. (2010). A Literature Survey on Energy-Growth Nexus. Energy Policy 38, 340–349. doi:10.1016/j.enpol.2009.09.024
Pettifor, A. R. G. (2002). Debt Relief and the Millennium Development Goals. New York, NY: United Nations Dev. Program.
Pigliautile, I., Marseglia, G., and Pisello, A. L. (2020). Investigation of CO2 Variation and Mapping through Wearable Sensing Techniques for Measuring Pedestrians’ Exposure in Urban Areas. Sustain 12 (9), 3936. doi:10.3390/su12093936
Rasoulinezhad, E., Taghizadeh-Hesary, F., and Taghizadeh-Hesary, F. (2020). How Is Mortality Affected by Fossil Fuel Consumption, CO2 Emissions and Economic Factors in CIS Region? Energies 13 (9), 2255. doi:10.3390/en13092255
Rosen, A. M. (2012). Set Identification via Quantile Restrictions in Short Panels. J. Econom. 166 (1), 127–137. doi:10.1016/j.jeconom.2011.06.011
Schaffer-Smith, D., Swenson, J. J., and Bóveda-Penalba, A. J. (2016). Rapid Conservation Assessment for Endangered Species Using Habitat Connectivity Models. Environ. Conserv. 43 (3), 221–230. doi:10.1017/S0376892915000405
Shan, Y., Ou, J., Wang, D., Zeng, Z., Zhang, S., Guan, D., et al. (2020). Impacts of COVID-19 and Fiscal Stimuli on Global Emissions and the Paris Agreement. Nat. Clim. Chang. 11 (3), 1–7. doi:10.1038/s41558-020-00977-5
Sun, H., Khan, A. R., Bashir, A., Alemzero, D. A., Abbas, Q., and Abudu, H. (2020). Energy Insecurity, Pollution Mitigation, and Renewable Energy Integration: Prospective of Wind Energy in Ghana. Environ. Sci. Pollut. Res. 27, 38259–38275. doi:10.1007/s11356-020-09709-w
Sun, Y., Chen, L., Sun, H., and Taghizadeh-Hesary, F. (2020). Low-carbon Financial Risk Factor Correlation in the belt and Road PPP Project. Financ. Res. Lett. 35, 101491. doi:10.1016/j.frl.2020.101491
Taghizadeh-Hesary, F., and Yoshino, N. (2020). Sustainable Solutions for green Financing and Investment in Renewable Energy Projects. Energies 13 (4), 788. doi:10.3390/en13040788
Ullah, S., Majeed, M. T., and Chishti, M. Z. (2020). Examining the Asymmetric Effects of Fiscal Policy Instruments on Environmental Quality in Asian Economies. Environ. Sci. Pollut. Res. 27 (30), 38287–38299. doi:10.1007/s11356-020-09859-x
Ullah, S., Ozturk, I., and Sohail, S. (2021). The Asymmetric Effects of Fiscal and Monetary Policy Instruments on Pakistan’s Environmental Pollution. Environ. Sci. Pollut. Res. 28 (6), 7450–7461. doi:10.1007/s11356-020-11093-4
Viteri, J. P., Henao, F., Cherni, J., and Dyner, I. (2019). Optimizing the Insertion of Renewable Energy in the Off-Grid Regions of Colombia. J. Clean. Prod. 235, 535–548. doi:10.1016/j.jclepro.2019.06.327
Wang, Y., Liu, L., Guo, S., Yue, Q., and Guo, P. (2019). A Bi-Level Multi-Objective Linear Fractional Programming for Water Consumption Structure Optimization Based on Water Shortage Risk. J. Clean. Prod. 237, 117829.doi:10.1016/j.jclepro.2019.117829
Wen, H., and Dai, J. (2020). Trade Openness, Environmental Regulation, and Human Capital in China: Based on ARDL Cointegration and Granger Causality Analysis. Environ. Sci. Pollut. Res. 27 (2), 1789–1799. doi:10.1007/s11356-019-06808-1
World Health Organization (2018). How Air Pollution Is Destroying Our Health. Geneva, Switzerland: World Heal. Organ.
Yoshino, N., Taghizadeh-Hesary, F., and Otsuka, M. (2021). Covid-19 and Optimal Portfolio Selection for Investment in Sustainable Development Goals. Financ. Res. Lett. 38, 101695. doi:10.1016/j.frl.2020.101695
Yuelan, P., Akbar, M. W., Hafeez, M., Ahmad, M., Zia, Z., and Ullah, S. (2019). The Nexus of Fiscal Policy Instruments and Environmental Degradation in China. Environ. Sci. Pollut. Res. 26 (28), 28919–28932. doi:10.1007/s11356-019-06071-4
Zhou, N., Price, L., Yande, D., Creyts, J., Khanna, N., Fridley, D., et al. (2019). A Roadmap for China to Peak Carbon Dioxide Emissions and Achieve a 20% Share of Non-Fossil Fuels in Primary Energy by 2030. Appl. Energ. 239, 793–819. doi:10.1016/j.apenergy.2019.01.154
Appendix 1
Keywords: green finance, fiscal hedging, QARDL model, TOPSIS, sustainability
Citation: Chunyu L, Ali SA, Tan C, Yin W, Kouser R and Gulzar F (2022) The Fiscal Hedging and Green Financing: Sustainability Challenges for Developing World. Front. Environ. Sci. 9:807220. doi: 10.3389/fenvs.2021.807220
Received: 01 November 2021; Accepted: 13 December 2021;
Published: 06 January 2022.
Edited by:
Farhad Taghizadeh-Hesary, Tokai University, JapanReviewed by:
Mohamed Elheddad, University of Huddersfield, United KingdomMajed Alharthi, King Abdulaziz University, Saudi Arabia
Copyright © 2022 Chunyu, Ali, Tan, Yin, Kouser and Gulzar. This is an open-access article distributed under the terms of the Creative Commons Attribution License (CC BY). The use, distribution or reproduction in other forums is permitted, provided the original author(s) and the copyright owner(s) are credited and that the original publication in this journal is cited, in accordance with accepted academic practice. No use, distribution or reproduction is permitted which does not comply with these terms.
*Correspondence: Syed Ahtsham Ali, YnJpbGxwYWtAeWFob28uY29t
 Leng Chunyu1
 Syed Ahtsham Ali
 Ci Tan