- 1College of Environmental Science and Engineering, Dalian Maritime University, Dalian, China
- 2State Key Laboratory of Hydraulic Engineering Simulation and Safety, Tianjin University, Tianjin, China
- 3State Key Laboratory of Coastal and Offshore Engineering, Dalian University of Technology, Dalian, China
- 4Department of Civil and Environmental Engineering, National University of Singapore, Singapore, Singapore
- 5College of Transport Engineering, Dalian Maritime University, Dalian, China
- 6State Key Laboratory of Hydroscience and Engineering, Tsinghua University, Beijing, China
- 7Hebei Changli Gold Coast National Nature Reserve Management Centre, Changli, China
- 8Department of Civil and Structural Engineering, The University of Sheffield, Sheffield, United Kingdom
Solitary wave propagating over a bottom-mounted barrier is simulated using the Incompressible Smoothed Particle Hydrodynamics (ISPH) method in order to study the generation and transport of turbulence associated with flow separation around submerged structures. For an accurate capture of turbulence characteristics during the wave propagation, rather than employing the standard sub-particle scale (SPS) model, the k-ε turbulence model is coupled with the numerical scheme. The results of the numerical model are compared with experimental data, and good agreement is observed in terms of mean velocity, free surface elevation, vorticity fields and turbulent kinetic energy. The numerical model is then employed to investigate the effects of wave non-linearity and geometrical size of the submerged barrier on the flow separation; and calculate the reflection, dissipation and transmission coefficients to evaluate the importance of energy dissipation due to the generation of vortices. The results of this study show that the developed ISPH method with the k-ε turbulence closure model is capable of reproducing the velocity fields and the turbulence characteristics accurately, and thus can be used to perform predictions of comprehensive hydrodynamics of flow-structure interactions in the urban hydro-environment systems.
1 Introduction
The impacts of hazards such as tsunami or flash floods on the coastal communities are critical for the economic and social activities of coastal cities. Tsunami or flash floods can result in serious destruction of coastal structures. The interaction of fluid flow with structures involves many complex processes, such as displacement of the free surface, flow separation, vortex shedding, and turbulence generation. In recent years, several laboratory experiments have been conducted to study these processes. Wu et al. (2012) used the particle image velocimetry (PIV) technique to observe the vortex and turbulence generated by flow separation and wave breaking of a solitary wave propagating over a bottom-mounted barrier. In order to investigate the effects of flow depth and velocity on cities, Soares-Frazão and Zech (2008) conducted experimental studies on the transient flow of the dam-break wave in a square city layout of 5 × 5 buildings in both horizontal and oblique directions. Zhang (2009) carried out a three-dimensional (3D) experiment to study a tsunami interacting with single and multiple cylinders, and measured water surface elevation, water particle velocity, horizontal force, and overturning moment on the cylindrical structure.
In recent years, the particle methods, such as Smoothed Particle Hydrodynamics (SPH), have shown promising capacities in simulating the impacts of waves and currents on solid (impermeable) structures (e.g., Wu et al., 2013; Albano et al., 2016; Farmani et al., 2019; Ren et al., 2019) as well as porous structures (e.g., Kazemi et al., 2020a). Although significant improvements have been achieved with regards to the accuracy of the numerical schemes in the estimation of large deformation of the free surface boundaries and the pressures acting on the structures, the applicability of the method for simulating turbulence and vortices still needs careful attention.
The commonly used turbulence model in ISPH is the sub-particle scale turbulence model (e.g., in Gotoh et al., 2001; Issa et al., 2005; Wang et al., 2016; Shi et al., 2017; Wang et al., 2018), in which the eddy viscosity is determined by the Smagorinsky subgrid model (Smagorinsky, 1963), or the mixing length theory (Kazemi et al., 2020b). The poorly designed Large Eddy Simulations (LES) in the early ISPH models using the SPS closure model for turbulence was still sufficient for the problems studied by them; however, for problems such as the one simulated in this study, i.e., when flow is characterised by significant flow separations, it is hard to capture the correct turbulent characteristics by the SPS model, especially when the numerical resolution is insufficient. Kazemi et al. (2020b) showed that the SPS model cannot correctly estimate the effect of turbulence when the flow is highly sheared and computational resolution is coarse. For situations like this, coupling the ISPH method with the k-ε turbulence model could be a useful alternative, an issue which is investigated in this study.
Only a few researchers have attempted coupling the particle methods with the k-ε model for modelling turbulence. For example, Shao (2006) introduced the two-equation k–ε model into the ISPH method and showed that this combination provides a useful tool to investigate the surf zone dynamics. However, only simple numerical results of modelled turbulence were shown, mainly on the kinetic energy distributions during wave breaking on a plane beach. Other examples of the application of the k–ε model with particle methods are Kolahdoozan et al. (2014), Napoli et al. (2015), and Leroy et al. (2016). A benchmark review of particle turbulence models in coastal and ocean field was documented by Luo et al. (2021). However, only limited results of turbulence intensity were compared with experiment data. Wang and Liu (2020) presented the first comprehensively validated two dimensional (2D) ISPH model with the k–ε turbulence closure. They simulated two laboratory experiments, a non-breaking solitary wave propagating over a bottom-mounted barrier and a solitary wave breaking on a 1 on 50 slope and presented a detailed discussion on the effects of initial seeding of turbulent kinetic energy. In the present study, the model developed in Wang and Liu (2020) is employed to estimate free surface elevation, velocity field, and turbulence intensity; and then applied to investigate the effects of wave non-linearity and geometrical size of submerged impermeable structure on the flow separation. To fully evaluate the benefits of the proposed k–ε modelling technique, two comparative computations based on the SPS and non-turbulence models are also carried out for a comparison. Furthermore, the reflection, dissipation and transmission coefficients are calculated, and their variations are analysed to assess the importance of the energy dissipation due to the generation of vortices.
The present paper is organised as follows. Section 2 introduces the ISPH model equations and relevant Lagrangian transport equations of turbulent kinetic energy k and dissipation rate ε; Section 3 presents the ISPH model validation by experimental results of solitary wave propagating over a bottom mounted barrier; Section 4 discusses the effects of wave non-linearity and the various geometrical sizes of submerged structure on the vortices around the structure and the coefficients of wave reflection, transmission, dissipation; and finally, Section 5 summarizes the findings of the study.
2 Governing Equations and Numerical Methodology
The governing equations include the ensemble averaged mass and momentum conservation equations, which can be expressed as
where t is the time; D/Dt denotes the total derivative;
where
where
The standard k-ε model is used to account for the turbulence scale smaller than the particle size. The equations of kinetic energy and dissipation rate take the following advection–diffusion forms
The production of kinetic energy P acts as a source term, while the dissipation ε is a sink term. The source and sink terms have the relation
with
referring to the scalar mean rate-of-strain. The set of constant values recommended by Launder and Spalding (1974) were used in the present simulations (
The adopted ISPH model is based on the numerical scheme proposed by Khayyer and Gotoh (2011). The most important feature of this version is the use of a higher-order error compensating term for the pressure Poisson equation (PPE). The two-step projection approach, i.e., prediction and correction, is used for the time implementation. The model has been demonstrated to maintain the particle/pressure stability through the validation of several benchmark tests. 2D and 3D versions of the model were employed by Wang et al. (2016, 2018) for the simulation of scouring around coastal structures. The ISPH model is modified by substituting the original SPS turbulence model with the standard k-ε turbulence model for the present simulations. The numerical discretization of the above equations, boundary and initial conditions, and solution procedure can be found in Wang and Liu (2020).
3 Numerical Simulation of Solitary Wave Propagating Over a Bottom Mounted Barrier
In this section, the turbulence and energy dissipation associated with flow separation around the submerged structures caused by solitary waves are simulated and the results of the model are compared with benchmark experiments as follows.
3.1 Experiment Setup
The experiments were conducted in a glass-walled wave flume (22 m long, 0.5 m wide and 0.76 m deep) in Tainan Hydraulics Laboratory, National Cheng Kung University (Wu et al., 2012). A vertical rectangular barrier with height of d = 10 cm and thickness of w = 2 cm was mounted on the bottom and located in the middle of the wave flume. A solitary wave with a wave height H = 7.0 cm in a constant water depth of h = 14.0 cm was generated by a piston-type wavemaker at one end of the wave flume using Goring (1978) method. The surface wave elevations were measured by six capacitance-type wave gauges and the velocity fields in the vicinity of the barrier were measured using a dual-cameras PIV system. The origin of the coordinate system (x, z) = (0, 0) was defined at the intersection of the left side of the vertical barrier and the flume bottom. The details of the experimental set-up and apparatus layouts can be found in Figure 1 of Wu et al. (2012).
3.2 Numerical Model Setup
The ISPH model setup (see Figure 1) followed that of the experiments, except that the length of the flume was reduced to 3.5 m to accommodate the computing expenses. As a result, the barrier was located 2.5 m far from the numerical wave paddle.
The SPH particle spacing is set to D = 2 mm, and a total of 135,419 particles are employed in this simulation. Adaptive scheme is used, and the time step range is between ∆tmin = 10−5 s and ∆tmax = 10−2 s with a Courant number (Cr) of 0.1. The number of time intervals is 16,737 for a physical test duration of 3 s. The computation for this test took about 1 h using 96-cores on the National Supercomputing Centre Singapore (NSCC).
3.3 Model Validation on Generated Solitary Wave
To verify the wave generation of solitary waves, time series of the free surface elevations of the numerical and experimental models are compared and shown in Figure 2. Three measured wave gauge data at x = −0.657 m, 0.010 and 0.357 m (respectively, at upstream, middle, and downstream of the barrier) are chosen to compare with the numerical results. The time at which the crest of the solitary wave arrives at x = −0.657 m is defined as t = 0 s. The numerical results fit quite well with the experiment data for the main wave form and the small undulating tails of the incident waves (Figure 2A), reflected waves (Figure 2A) and transmitted waves (Figures 2B,C).
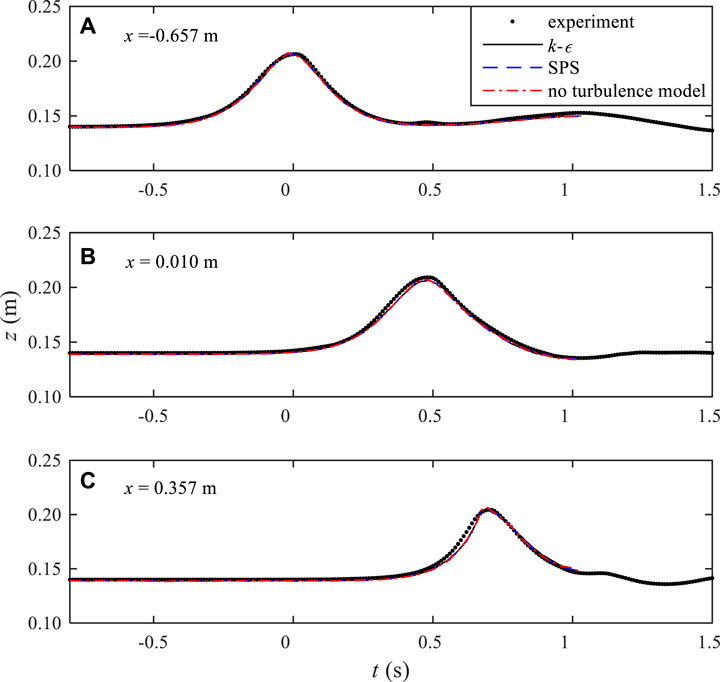
FIGURE 2. Comparisons of time series of the free surface elevations between experimental and numerical results at three locations of (A) x = −0.657 m; (B) 0.010 m; and (C) 0.357 m.
To demonstrate the benefit of the proposed k–ε model, two comparative tests including one without any turbulence model, and another with k–ε being replaced by the SPS turbulence model, have been carried out. The results are shown together in Figure 2A–C for a comparison. It shows very little differences in the time-dependent free surface profiles. It is shown that the lack of sufficient turbulence dissipation narrowed the wave profile as shown in Figure 2C. On the other hand, from the viewpoint of both k–ε and SPS turbulence modelling results, almost no tangible differences were found in the wave propagation profiles.
3.4 Model Validation on Spatial Surface Displacements and Velocity Fields
Comparative snapshots of the spatial free surface displacements, velocity fields, and profiles of the horizontal and vertical velocities obtained from the laboratory measurements and the numerical simulations at three instants (t = 0.60 s, 0.88 s, 1.02 s) are shown, respectively, in Figures 3A–C, Figures 4A–C, Figures 5A–C, respectively.
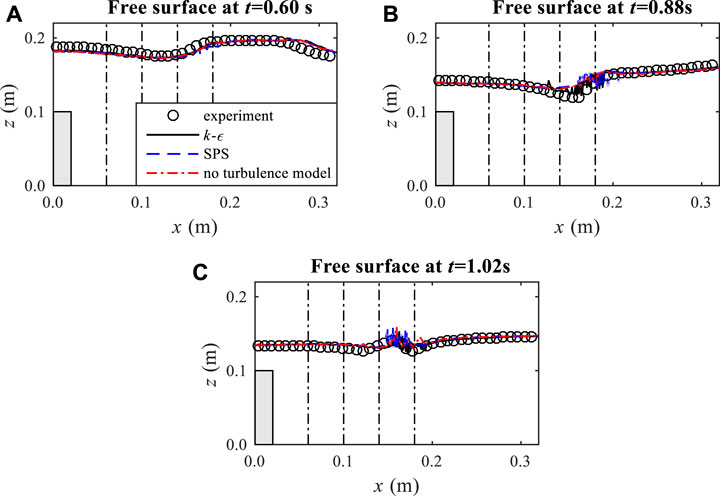
FIGURE 3. Comparisons between experimental data and numerical results for the free surface elevations at three times t = (A) 0.60 s; (B) 0.88 s; and (C) 1.02 s.
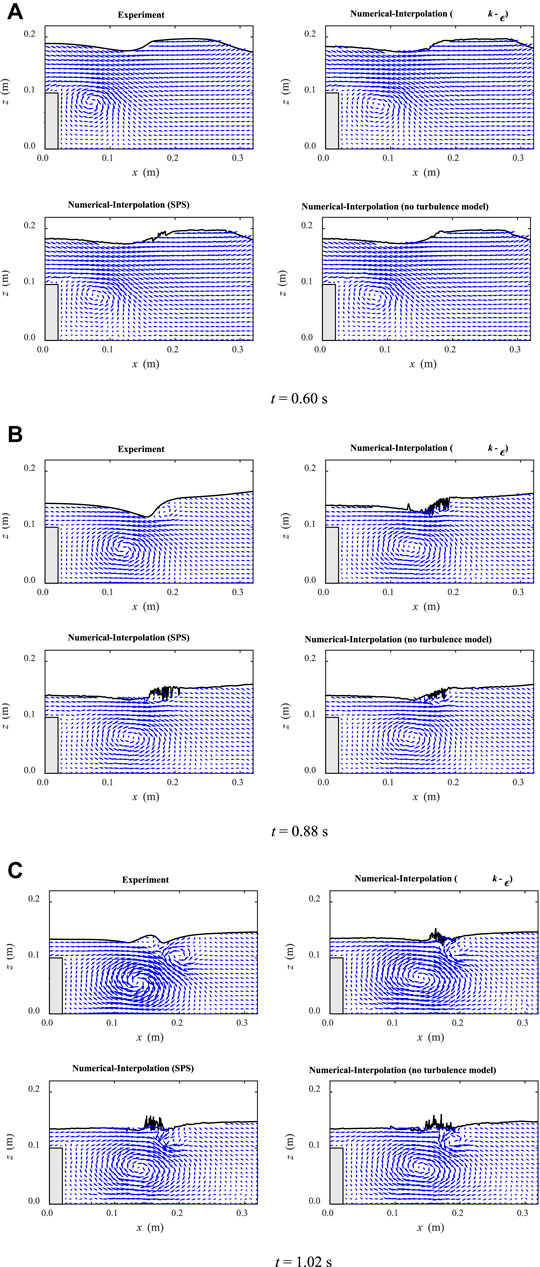
FIGURE 4. Comparisons between experimental data and numerical results for the velocity fields at three times t = (A) 0.60 s; (B) 0.88 s; and (C) 1.02 s.
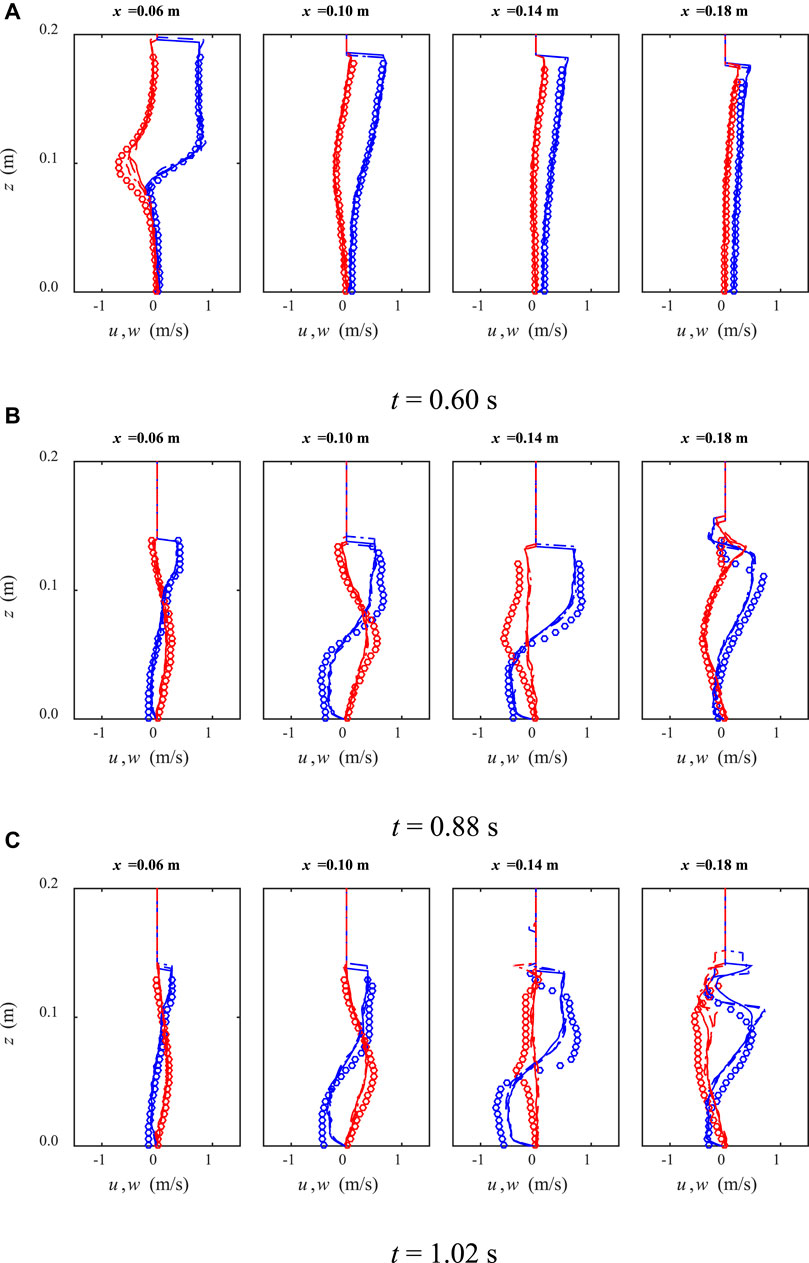
FIGURE 5. Comparisons between experimental data (circles) and numerical results for the horizontal u (blue) and vertical w (red) velocity profiles, calculated by k-ε model (solid lines), SPS model (dashed lines) and non-turbulence model (dash-dotted lines) at three times t = (A) 0.60 s; (B) 0.88 s; and (C) 1.02 s.
Figures 3A–C show the spatial variations of free surface when the wave is passing over the vertical barrier. The fluctuations behind the barrier suggest that there are significant deformations due to the non-linear interactions with the barrier. Three different numerical results matched the experimental profiles quite well; but at the sharp wave dips in Figure 3B and wave tips in Figure 3C, both SPS and non-turbulence results showed some inaccuracies and numerical noise due to the inappropriate treatment of the turbulence effects. These places are where the local wave breaking occurs when the effect of turbulence must be well addressed. The benefit of the k–ε modelling indicated clear superiority in these areas.
Figure 4A–C provided the experimental and numerical velocity fields, computed with the k–ε model, LES-based SPS turbulence model and non-turbulence model, at the same time instants as the ones in Figure 3. All the numerical results well reproduced the existence of flow circulations immediately after the barrier and the whole flow structure. The three snapshots show that the numerical results realistically disclosed the characteristic events when the solitary wave propagates over the submerged barrier, which are the crest-crest exchange event (at t = 0.60 s), the backward breaker event (at t = 0.80 s), and the splash-up event (at t = 1.02 s).
No significant differences have been found for all the numerical results from different turbulence modelling approaches, except for the regions near the broken wave surface. This indicates that a turbulence model may not always be necessary for reproducing the macro flow field, and that a non-turbulence SPH can also achieve a satisfactory level of accuracy. The reason is related to the particle nature of the SPH method which makes it capable of reproducing a part of flow turbulence effect at the particle scale. This resolved effect is thus probably sufficient in the present case to replicate the average flow field of the experiment.
Figure 5A–C showed the comparisons for the profiles of horizontal and vertical velocities at four sections from x = 0.06 m to x = 0.20 m (with an identical interval of 0.04 m, shown by the dash-dotted lines in Figure 3). The velocity profiles were plotted by interpolating SPH particle velocities to the imaginary grid lines in the computational domain.
At times t = 0.60 and 0.88 s, almost no differences were observed for the numerical results of the three turbulence treatments as compared with the experimental data. However, at time t = 1.02 s as shown in Figure 5C, especially at section x = 0.18 m, the k–ε model results show better match with the experimental velocity profiles, not only in the velocity amplitude but also in the two turning points. This is the section where complex flow circulations and vortices are generated behind the barrier. From this, we can understand that an adequate turbulence model in SPH may not always improve the macro flow behaviours significantly, such as the flow surface and the average velocity structure in the present tests. However, for the micro flow details, such as the velocity or pressure profiles, the proposed k–ε model should demonstrate better advantages. This is due to the fact that a non-turbulence model cannot resolve the smaller flow structures below particle scale, mainly as a result of using coarse particle resolutions in the most SPH applications. On the other hand, also, the traditional SPS turbulence treatment (with the Smagorinsky model) cannot accurately capture these turbulence structures.
3.5 Model Validation on Turbulence Intensity
Figure 6A–C show the snapshots of the calculated turbulence intensity contours at three time instants corresponding to those of Section 3.4 (i.e., at t = 0.60 s, 0.88 s, and 1.02 s). The experimental turbulent kinetic energy k was estimated as k = 0.5<u’u'+w’w'>N, in which the symbol < > represents the ensemble average, N is the number of repeated experiments (N = 35 in Wu et al. (2012)), and u' and w' denote the horizontal and vertical turbulent velocities, respectively. The numerical k was calculated from the k-ε equations and the SPS turbulence models (Gotoh et al., 2001).
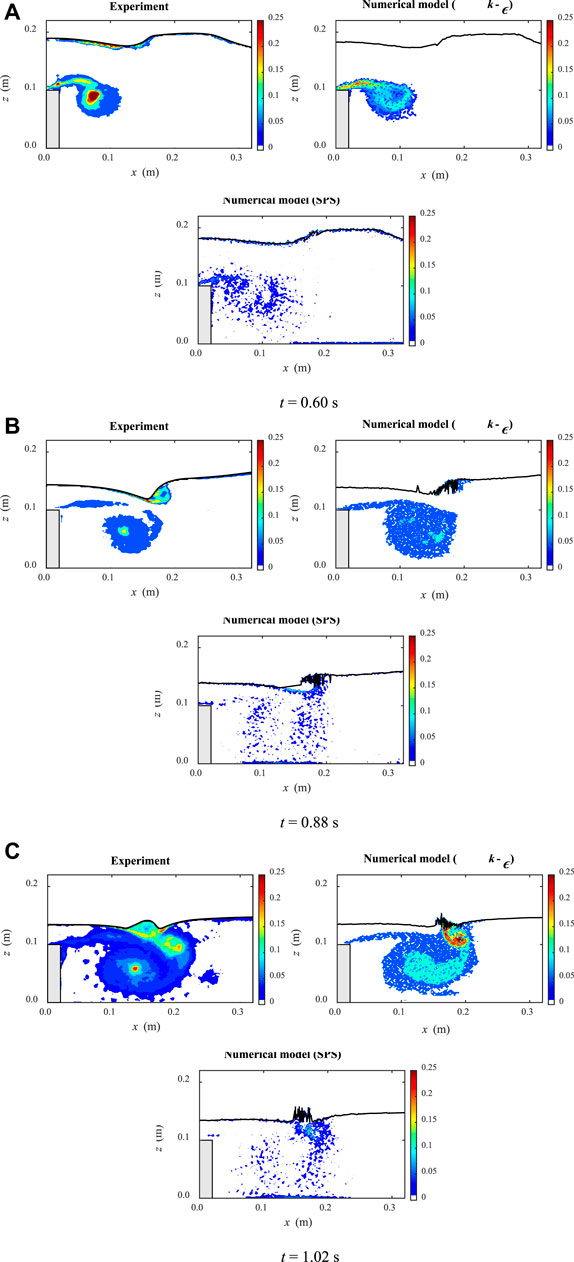
FIGURE 6. Comparisons between experimental data and numerical results for the contours of turbulent intensity (m/s) at three times t = (A) 0.60 s; (B) 0.88 s; and (C) 1.02 s
The results show that the present ISPH model coupled with the k-ε turbulence closure satisfactorily reproduced the turbulence intensity, too, generated by the flow separations. Relatively large discrepancies appear in the core of the vortex, which might be related to the uncertainties of the repeated experiments during the ensemble averaged operation (Wu et al., 2012). On the other hand, the SPS turbulence model predicted somewhat unrealistic turbulence at very low levels, although the range of turbulence generations had been generally captured.
For a quantitative validation purpose, Figure 7A–C present the comparisons for the profiles of turbulence intensities at four sections from x = 0.06 m to x = 0.20 m (with an identical interval of 0.04 m, shown by the dash-dotted lines in Figure 3), at three instants of t = 0.60 s, 0.88 and 1.02 s, respectively. The turbulent intensity profiles were calculated by interpolating SPH particle quantities to the imaginary grid lines in the computational domain. It shows that the k-ε turbulence results agree with the experimental measurements in a very satisfactory manner, while the SPS model predicted very low turbulence levels at the scale of 10 times smaller. Therefore, we need to caution that the Smagorinsky-based SPS model may not be an appropriate tool for the prediction of turbulence quantities. Until the spatial resolution can become very refined, the k-ε turbulence model should still constitute an effective turbulence modelling technique in the SPH particle modelling applications. However, we should also note that the k-ε model tends to overpredict the experimental turbulence, especially at the later stage of wave separation such as at time t = 1.02 s, while SPS model is quite good at capturing small-scale turbulence.
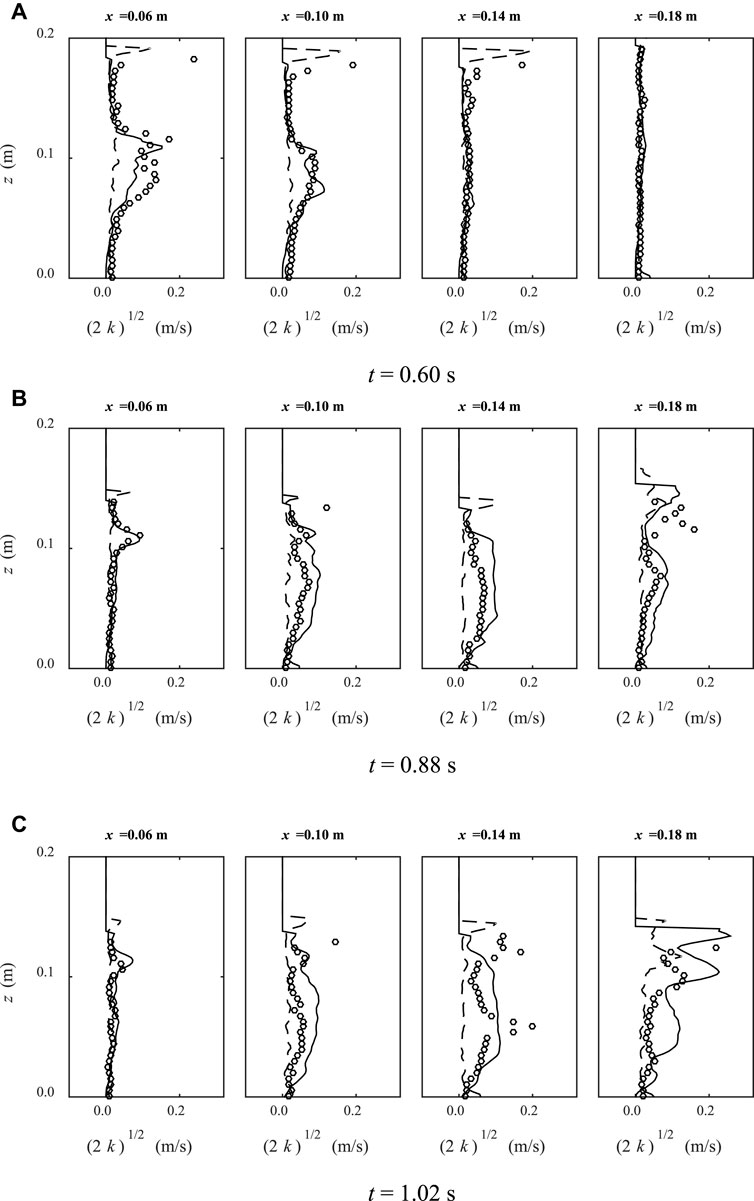
FIGURE 7. Comparisons between experimental data (circles) and numerical results for the turbulence intensity (m/s) profiles, calculated by k-ε model (solid lines) and SPS model (dashed lines) at three times t = (A) 0.60 s; (B) 0.88 s; and (C) 1.02 s.
4 Effect of Different Geometrical Sizes and Wave Heights
The validations in the previous section showed that the present ISPH method coupled with the k-ε turbulence model has a great capacity to simulate the fluid-structure interactions between the solitary wave and submerged structure. In this section, the effects of wave non-linearity and geometrical size of the submerged barrier on the flow separation are shown and discussed; and the reflection, dissipation, and transmission coefficients are also calculated to assess the importance of energy dissipation which is due to the generation of vortices.
4.1 Effects on Flow Separation
To investigate the effect of various geometrical sizes of the submerged barrier on the flow separation, detailed numerical experiments are performed using the validated model. In these simulations, the horizontal width and vertical height of the submerged structure are selected uniformly with an interval of 0.02 m. The range of the horizontal width (W) of the barrier was chosen to be 0.02–0.06 m (W/h = 0.14–0.42), and the range of the vertical height (L) was set to be 0.08–0.12 m (L/h = 0.57–0.85). A schematic view of the setup of the structure sizes is presented in Figure 8A,B (in total, five geometrical sizes were considered with three widths and three heights). The wave conditions corresponding to the previous section, that is, the water depth of h = 0.14 m and wave height of H/h = 0.5 were adopted.
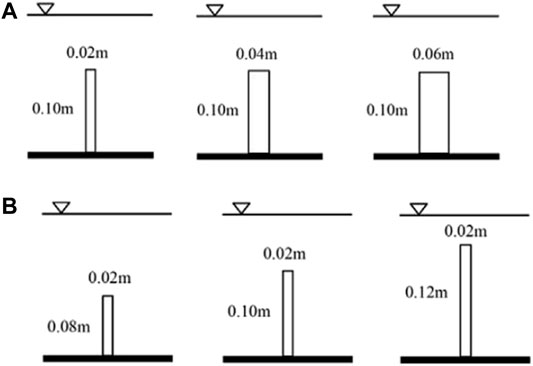
FIGURE 8. Schematic view of the submerged barrier of different geometrical sizes: (A) setup for different widths (W = 0.02 m, 0.04 m, 0.06 m) with a fixed height (L = 0.1 m); and (B) setup for different heights (L = 0.08 m, 0.10 m, 0.12 m) with a fixed width (W = 0.02 m).
Figure 9 shows the calculated velocity fields for different horizontal widths of the barrier at different times. It is shown that for the wider barriers, the distance between the vortex and the barrier becomes smaller. Figure 10 shows the calculated velocity fields for different barrier heights. For the highest barrier (0.12 m), the main vortex transports further from it, and a larger secondary anticlockwise vortex in the downstream direction is generated. Due to the stronger breaking of free surface for the highest barrier, the secondary vortex transports into the deeper water. For the lowest barrier (0.08 m), the secondary vortex is not generated at all because the breaking near the free surface is very small in this case. The behaviour of the vortex behind the barrier with moderate height (0.10 m) has a situation between the other two.
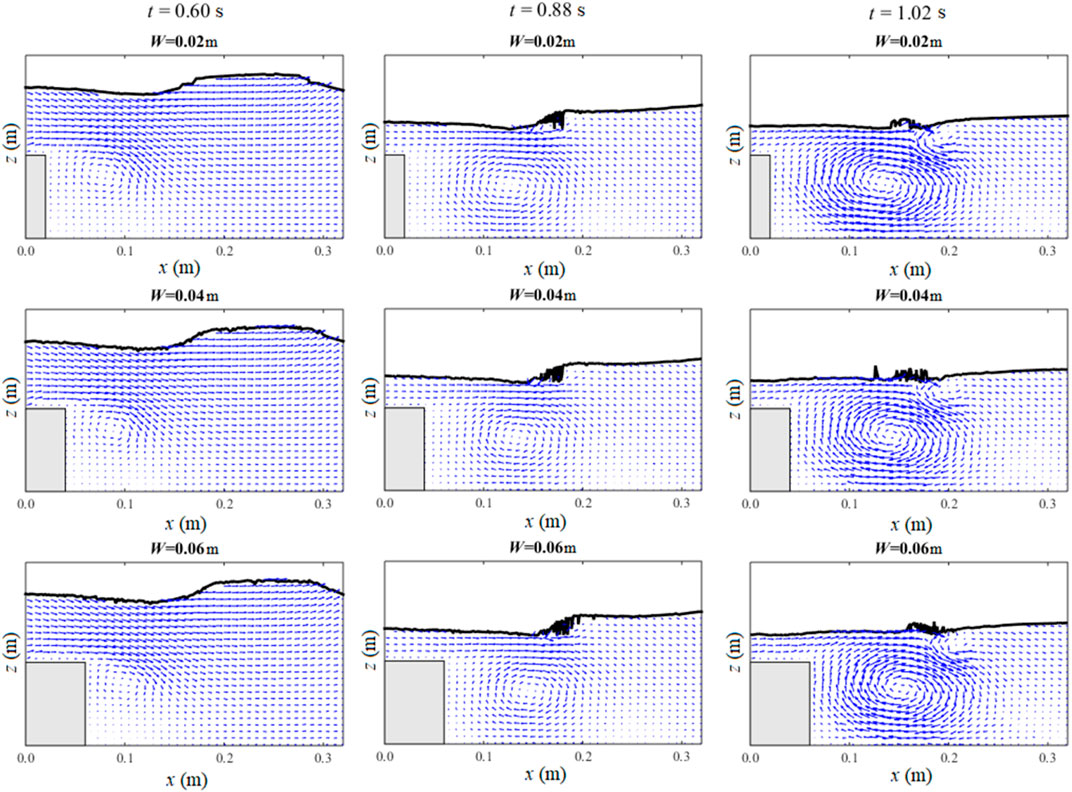
FIGURE 9. Comparisons of calculated velocity vector fields for different horizontal widths of the barrier.
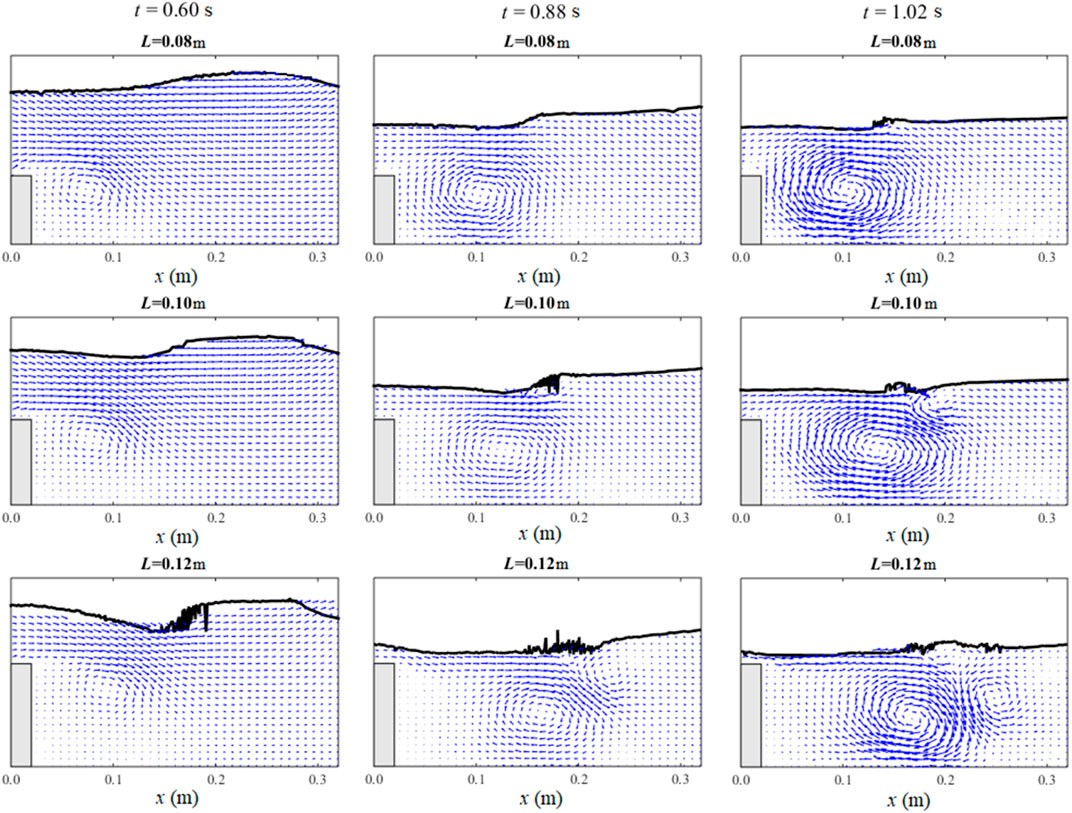
FIGURE 10. Comparisons of calculated velocity vector fields for different vertical lengths of the barrier.
4.2 Effects on Energy Transmission, Reflection and Dissipation Coefficients
Due to the wave-structure interaction under the processes of vortex shedding and wave separation, the energy coefficients will be influenced by the wave non-linearity and the geometrical sizes of structure. The effects of different values of wave non-linearity (H/h = 0.1, 0.25, 0.35, 0.5, 0.6, h = 0.14 m) and various geometrical sizes (the same as in Figures 9, 10) of the submerged barrier on the reflection, dissipation and transmission coefficients are calculated in this section to evaluate the importance of energy dissipation due to the generation of vortices.
Figure 11A–F presents the time series of the free surface elevation at x = −1.5 m (upstream of the barrier) and x = 0.5 m (downstream of the barrier), simulated by the model, for different barrier geometrical sizes. The wave non-linearity is fixed at H/h = 0.5 (h = 0.14 m). The reference time (t = 0 s) is defined when the crest of the solitary wave arrives at x = −0.657 m (similar to Wu et al., 2012). Figure 12A–E shows the time series of the free surface elevation at x = −1.5 and 0.5 m for different incident wave heights, while the vertical height and the horizontal width of the barrier are fixed at 0.1 and 0.02 m, respectively. The results present the profiles of the incident and reflected waves recorded at x = −1.5 m, and the transmissive waves recorded at x = 0.5 m.
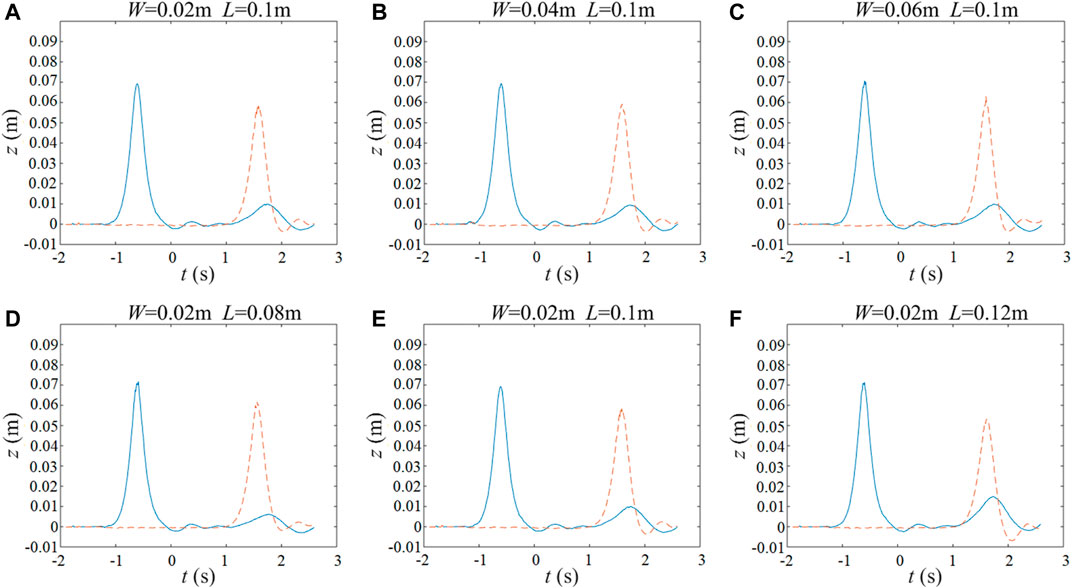
FIGURE 11. (A–E) Time series of free surface elevation at x = −1.5 m (blue solid Q19 lines) and x = 0.5 m (orange dashed lines) for different barrier geometrical sizes.
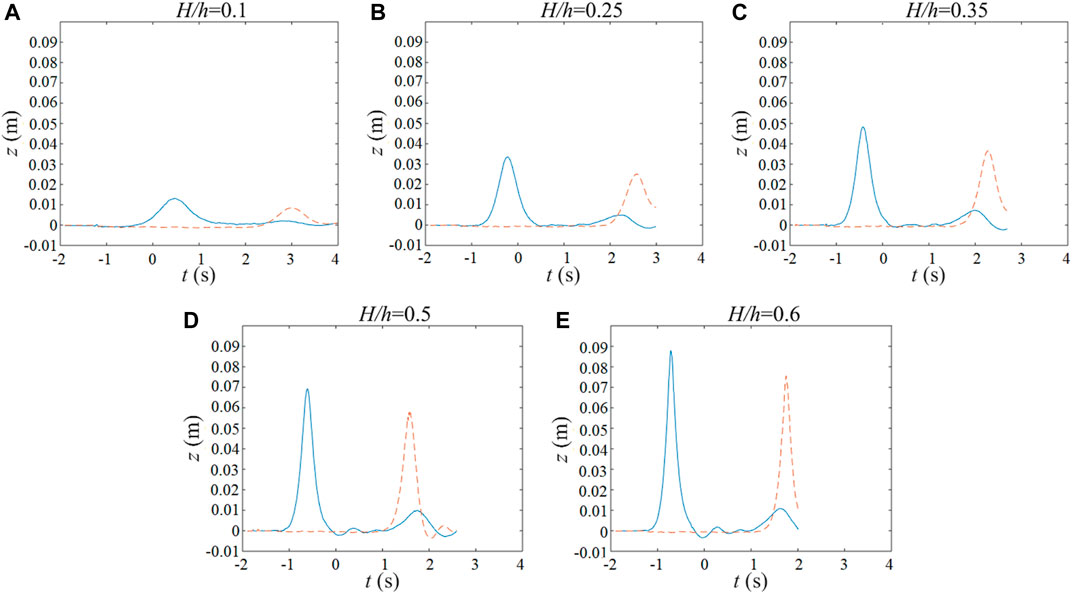
FIGURE 12. (A–E) Time series of free surface elevation at x = −1.5 m (blue solid Q19 lines) and x = 0.5 m (orange dashed lines) for different incident wave heights.
In order to provide a clear description of the characteristics of the solitary wave transformation over the barrier, the calculated values of the energy coefficients in terms of energy reflection (CR), transmission (CT), and dissipation (CD) against different barrier width W, height L and incident wave height H, are illustrated in Figure 13A–C, respectively. Note all these indicators are normalized by the water depth h. The method proposed by Lin (2004) is adopted to calculate these coefficients for the sake of engineering applications.
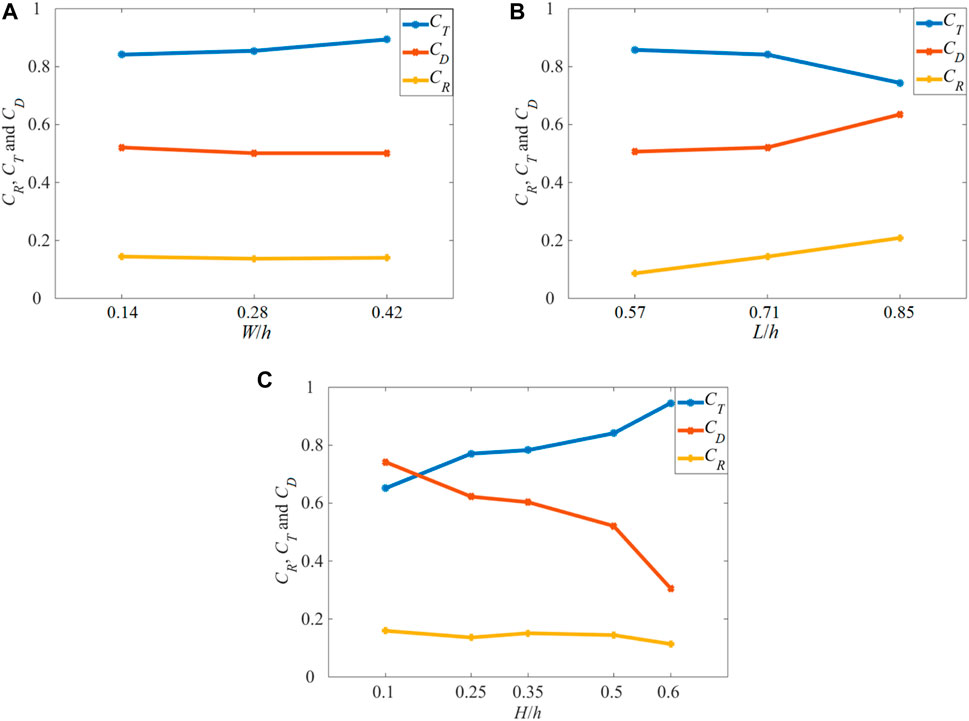
FIGURE 13. Coefficients of wave reflection CR, transmission CT, and dissipation CD vs different barrier (A) width W; (B) height L; and (C) incident wave height H.
According to the model results, the energy reflection coefficients increase rapidly as the barrier heights increase from 0.08 to 0.12 m (L/h = 0.57–0.85), but it keeps nearly constant for the different values of the barrier width (0.02–0.06 m, corresponding to W/h = 0.14–0.42). The energy transmission coefficient decreases with an increase in the barrier height, while it slightly goes up when a larger barrier width is used. On the other hand, the energy dissipation coefficient shows an opposite trend. It goes up with the increase of the barrier height and reduces slightly when the barrier width increases. Variations of these coefficients with the increase of wave non-linearity (H/h, from 0.1 to 0.6) show an increase in the transmission coefficient, an opposite behaviour in the dissipation coefficient (i.e., a decline), and small fluctuations (with a small decreasing trend) in the energy reflection coefficient.
5 Conclusion
In this paper, a validated ISPH method coupled with k-ε turbulence model was presented and applied to simulate the propagation of a solitary wave over the submerged bottom-mounted barrier. Through detailed comparisons with the experimental data, it was shown that the coupled model is capable of simulating the main features of the flow (i.e., free surface profile and velocity field) as well as the dynamics of the induced turbulent intensity with a good degree of accuracy. The model was then employed to study the effects of wave non-linearity and geometrical sizes of submerged barrier on the flow separations (which is often a difficult and expensive task to do in the laboratory or field). The variations of the coefficients of wave reflection, dissipation, and transmission with these factors were comprehensively investigated.
With regards to the two different turbulence modelling techniques applied in this study, i.e., the k-ε turbulence model and the Smagorisnky-based SPS model, the following understandings can be obtained. The k-ε model is usually employed with the time-averaged (Reynolds–averaged) Navier–Stokes (NS) equations to model the effects from the unresolved temporal fluctuations. However, its application with the SPH method in the present study indicates a LES type of turbulence modelling. This is because the equations are defined based on spatial average of flow quantities due to the use of SPH formulation. Therefore, in the present simulations, a part of turbulence effect is already resolved by the SPH discretisation itself, and a part of it is modelled by either the k-ε or the SPS models. Total turbulence in a LES context is composed of the resolved and the modelled parts. The resolved component can be calculated from the spatial deviations of the numerically estimated velocity with respect to its average over an averaging volume, and the modelled one is obtained from the relevant turbulence models, i.e., k-ε or SPS. In both cases, the resolved part of turbulence should be nearly the same. Also, because the resolved parts are expected to be quite small (see e.g., Kazemi et al., 2017; Kazemi et al., 2020b), it would be quite appropriate that the modelled parts be compared directly. Thus, a comparison was made between the modelled turbulence effects in this study, and it was shown that the k-ε model provides higher accuracy than the SPS model, when coupled with the ISPH method. In order to improve the applicability of the model, extension of it to 3D flow simulations is recommended.
Data Availability Statement
The raw data supporting the conclusion of this article will be made available by the authors, without undue reservation.
Author Contributions
DW and SY contributed to conception and design of the study. DW and SY organized the database. DW performed the statistical analysis and wrote the first draft of the manuscript. SY, CC, JL, XW and EK wrote sections of the manuscript. All authors contributed to manuscript revision, read, and approved the submitted version.
Funding
This work was supported by the National Natural Science Foundation of China (Grant No. 52101299 and 52001042), Fundamental Research Funds for the Central Universities of China (Grant No. 3132021163 and 3132019304), Open Funds of State Key Laboratory of Hydraulic Engineering Simulation and Safety (Tianjin University, Grant No. HESS-2113) and State Key Laboratory of Coastal and Offshore Engineering (Dalian University of Technology, Grant No. LP 2007) and Dalian Supports High-Level Talent Innovation and Entrepreneurship Project (Grant No. 2020RQ005).
Conflict of Interest
The authors declare that the research was conducted in the absence of any commercial or financial relationships that could be construed as a potential conflict of interest.
Publisher’s Note
All claims expressed in this article are solely those of the authors and do not necessarily represent those of their affiliated organizations, or those of the publisher, the editors, and the reviewers. Any product that may be evaluated in this article, or claim that may be made by its manufacturer, is not guaranteed or endorsed by the publisher.
Acknowledgments
We are very grateful to Professor Philip Li-Fan Liu for his constructive comments during the establishment of the ISPH and the k–ε closure model, and Dr. Yun-Ta Wu of Tamkang University for providing the experimental data.
References
Albano, R., Sole, A., Mirauda, D., and Adamowski, J. (2016). Modelling Large Floating Bodies in Urban Area Flash-Floods via a Smoothed Particle Hydrodynamics Model. J. Hydrol. 541, 344–358. doi:10.1016/j.jhydrol.2016.02.009
Farmani, S., Barani, G., Ghaeini-Hessaroeyeh, M., and Memarzadeh, R. (2019). Numerical Modeling of Flood Waves in a Bumpy Channel with Different Boundary Conditions. Sci. Iran. 26, 667–677. doi:10.24200/sci.2017.4582
Goring, D. G. (1978). Tsunamis - the Propagation of Long Waves onto a Shelf,. KH-R-38. Berkley: University of California, Keck Lab Rep. PhD thesis.
Gotoh, H., Shibahara, T., and Sakai, T. (2001). Sub-particle-scale Turbulence Model for the MPS Method-Lagrangian Flow Model for Hydraulic Engineering. Comput. Fluid Dyn. Jour. 9, 339–347.
Issa, R., Violeau, D., and Laurence, D. (2005). “A First Attempt to Adapt 3D Large Eddy Simulation to the Smoothed Particle Hydrodynamics Gridless Method,” in Proc. Int. Conf. Comput. and Experimental Engng. and Sc., 1st Symposium on Meshless Methods, Stara-Lesna, Slovakia, June 2005.
Kazemi, E., Tait, S., and Shao, S. (2020a). SPH‐based Numerical Treatment of the Interfacial Interaction of Flow with Porous media. Int. J. Numer. Meth Fluids 92, 219–245. doi:10.1002/fld.4781
Kazemi, E., Koll, K., Tait, S., and Shao, S. (2020b). SPH Modelling of Turbulent Open Channel Flow over and within Natural Gravel Beds with Rough Interfacial Boundaries. Adv. Water Resour. 140, 103557. doi:10.1016/j.advwatres.2020.103557
Kazemi, E., Nichols, A., Tait, S., and Shao, S. (2017). SPH Modelling of Depth-Limited Turbulent Open Channel Flows Over Rough Boundaries. Int. J. Numer. Methods Fluids 83, 3–27. doi:10.1002/fld.4248
Khayyer, A., and Gotoh, H. (2011). Enhancement of Stability and Accuracy of the Moving Particle Semi-implicit Method. J. Comput. Phys. 230, 3093–3118. doi:10.1016/j.jcp.2011.01.009
Kolahdoozan, M., Ahadi, M., and Shirazpoor, S. (2014). Effect of Turbulence Closure Models on the Accuracy of Moving Particle Semi-implicit Method for the Viscous Free Surface Flow. Sci. Iran. 21, 1217–1230.
Launder, B. E., and Spalding, D. B. (1974). The Numerical Computation of Turbulent Flows. Comput. Methods Appl. Mech. Eng. 3, 269–289. doi:10.1016/0045-7825(74)90029-2
Leroy, A., Violeau, D., Ferrand, M., Fratter, L., and Joly, A. (2016). A New Open Boundary Formulation for Incompressible SPH. Comput. Math. Appl. 72, 2417–2432. doi:10.1016/j.camwa.2016.09.008
Lin, P. (2004). A Numerical Study of Solitary Wave Interaction with Rectangular Obstacles. Coastal Eng. 51, 35–51. doi:10.1016/j.coastaleng.2003.11.005
Luo, M., Khayyer, A., and Lin, P. (2021). Particle Methods in Ocean and Coastal Engineering. Appl. Ocean Res. 114, 102734. doi:10.1016/j.apor.2021.102734
Napoli, E., De Marchis, M., and Vitanza, E. (2015). PANORMUS-SPH. A New Smoothed Particle Hydrodynamics Solver for Incompressible Flows. Comput. Fluids 106, 185–195. doi:10.1016/j.compfluid.2014.09.045
Ren, Y., Luo, M., and Lin, P. (2019). Consistent Particle Method Simulation of Solitary Wave Interaction with a Submerged Breakwater. Water 11, 261. doi:10.3390/w11020261
Shao, S. (2006). Simulation of Breaking Wave by SPH Method Coupled with K-∊ Model. J. Hydraulic Res. 44, 338–349. doi:10.1080/00221686.2006.9521686
Shi, H., Yu, X., and Dalrymple, R. A. (2017). Development of a Two-phase SPH Model for Sediment Laden Flows. Comput. Phys. Commun. 221, 259–272. doi:10.1016/j.cpc.2017.08.024
Smagorinsky, J. (1963). General Circulation Experiments with the Primitive Equations. Mon. Wea. Rev. 91, 99–164. doi:10.1175/1520-0493(1963)091<0099:gcewtp>2.3.co;2
Soares-Frazão, S., and Zech, Y. (2008). Dam-break Flow through an Idealised City. J. Hydraul. Res. 46, 648–658. doi:10.3826/jhr.2008.3164
Wang, D., and Liu, P. L.-F. (2020). An ISPH with K–ε Closure for Simulating Turbulence under Solitary Waves. Coast. Eng. 157, 1–28. doi:10.1016/j.coastaleng.2020.103657
Wang, D., Li, S., Arikawa, T., and Gen, H. (2016). ISPH Simulation of Scour behind Seawall Due to Continuous Tsunami Overflow. Coast. Eng. J. 58, 1–23. doi:10.1142/s0578563416500145
Wang, D., Shao, S., Li, S., Shi, Y., Arikawa, T., and Zhang, H. (2018). 3D ISPH Erosion Model for Flow Passing a Vertical cylinder. J. Fluids Struct. 78, 374–399. doi:10.1016/j.jfluidstructs.2018.01.003
Wu, Y.-T., Hsiao, S.-C., Huang, Z.-C., and Hwang, K.-S. (2012). Propagation of Solitary Waves over a Bottom-Mounted Barrier. Coastal Eng. 62, 31–47. doi:10.1016/j.coastaleng.2012.01.002
Wu, J., Zhang, H., and Dalrymple, R. A. (2013). “Simulating Dam-Break Flooding with Floating Objects through Intricate City Layouts Using GPU-Based SPH Method,” in Lecture Notes in Engineering Computer Science. 3 LNECS, 1755–1760.
Keywords: solitary wave, barrier, reflection, dissipation, transmission, flow separation
Citation: Wang D, Yan S, Chen C, Lin J, Wang X and Kazemi E (2021) ISPH Simulation of Solitary Waves Propagating Over a Bottom-Mounted Barrier With k–ε Turbulence Model. Front. Environ. Sci. 9:802091. doi: 10.3389/fenvs.2021.802091
Received: 26 October 2021; Accepted: 16 November 2021;
Published: 08 December 2021.
Edited by:
Jaan H. Pu, University of Bradford, United KingdomReviewed by:
Hongjie Wen, South China University of Technology, ChinaSongdong Shao, Dongguan University of Technology, China
Copyright © 2021 Wang, Yan, Chen, Lin, Wang and Kazemi. This is an open-access article distributed under the terms of the Creative Commons Attribution License (CC BY). The use, distribution or reproduction in other forums is permitted, provided the original author(s) and the copyright owner(s) are credited and that the original publication in this journal is cited, in accordance with accepted academic practice. No use, distribution or reproduction is permitted which does not comply with these terms.
*Correspondence: Sheng Yan, eWFuc2hlbmcyMDIxMDAzOUBkbG11LmVkdS5jbg==
 Dong Wang1,2,3,4
 Sheng Yan