 Le Wang
 Dayu Wang
 Alan Cuthbertson
 Deyu Zhong
 Gareth Pender6
94% of researchers rate our articles as excellent or good
Learn more about the work of our research integrity team to safeguard the quality of each article we publish.
Find out more
ORIGINAL RESEARCH article
Front. Environ. Sci., 24 December 2021
Sec. Freshwater Science
Volume 9 - 2021 | https://doi.org/10.3389/fenvs.2021.800832
This article is part of the Research TopicThe Urban Fluvial and Hydro-Environment SystemView all 21 articles
Differential parametric values associated with bed load sediment transport, that result at the same discharge levels on the rising and falling limbs of a flood hydrograph, are usually defined as bed load hysteresis. This hysteresis in bed load sediment transport rates is of considerable interest in the field of fluvial hydraulics. Within this study, a series of well-defined, symmetrical hydrograph flows are generated over a graded, mobile sediment bed to fully examine the hysteresis of the resulting bed load sediment transport in terms of the threshold of motion, and differential bed load transport rates and bed load yields during the hydrographs. The experiments are conducted in a titling flume without sediment supply specified at the upstream inlet, thereby representing typical river reach conditions immediately downstream of a dam that are exclusively subject to net in-channel bed degradation from sediment transport initiated during flood events. Our results show that the fractional bed load transport of defined fine, medium and coarse size classes within the graded sediment bed generally display clockwise, no/mixed and counter-clockwise hysteresis patterns, respectively, with clockwise hysteresis most commonly found for the coarse size class mobilised by hydrographs with long durations. By contrast, counter-clockwise hysteresis is usually observed for fine size class transported by hydrographs with short durations. Accordingly, the corresponding reference stresses for each size class vary between different hydrographs and are primarily controlled by the hydrograph flashiness (i.e. unsteadiness) and magnitude (i.e. total water work). Moreover, it is shown that the hysteresis effect, particularly for those size classes and hydrograph combinations that result in clockwise and counter-clockwise behaviour, should be fully accounted for when reproducing bed load transport rates using separate-limb based method. Finally, we investigate the relative fractions of the overall bed load yields generated during the rising and falling limbs of all symmetrical hydrographs (i.e. the bed load yield ratio), which are found to be primarily dependent on bed load transport hysteresis. Finally, the relationship between the bed load yield ratio and the ratio of reference stresses for the fractional sediment motion of each size class on both limbs is found to follow a power law.
Hysteresis is a non-linear loop-like behaviour associated with sediment transport during flood events (e.g., Mao et al., 2014; Zuecco et al., 2016) that is generally shown as a time lag between the peak values of flow and sediment transport rates (American Society of Civil Engineers, 2008). This is described quantitatively by two different values of sediment transport (i.e., dependent variable) being associated with a single value of discharge (i.e., independent variable) on the ascending and descending limbs of a flood hydrograph (Phillips, 2003). For this reason, it was widely acknowledged that sediment transport during flood flows is extremely difficult to predict accurately using one-to-one (i.e., flow-to-sediment rate) relationships typically developed under steady flow conditions, as a result of hysteresis effects (e.g., Gaeuman et al., 2009; Ahanger et al., 2018; Guusolus and Binns, 2018; Redolfi et al., 2018). This hysteresis effect therefore constitutes a distinct physical basis that distinguishes sediment transport in unsteady flood hydrographs from equivalent transport behaviour under steady uniform flow conditions, and therefore consititutes an important topic when studying and predicting sediment transport during flood flows.
According to previous studies, observed hysteresis could typically be classified as either 1) clockwise (i.e., higher sediment transport rates on the rising limb than the falling limb of a flood hydrograph), 2) counter-clockwise (i.e., higher sediment transport rates on the falling limb than the rising limb), 3) single-valued (i.e., the same sediment transport rates on both limbs), 4) single-valued plus a loop (i.e., a combination of 1) and either 2) or 3)), and 5) figure-8 (i.e., combining clockwise and anticlockwise hysteresis) (e.g., Gunsolus and Binns, 2018; Ahanger et al., 2008; Williams, 1989; Aich et al., 2014). However, these defined classifications were originally developed for suspended sediment transport (Williams, 1989). By contrast, no systematical exploration of hysteresis has been performed for bed-load transport (e.g., Gaeuman, 2010; Mao et al., 2014; Plumb et al., 2020), as direct measurements of bed-load transport rates during flood events in mountainous streams are relatively difficult, expensive, and often dangerous to undertake (Vericat and Batalla, 2006).
Recently, increased effort has been undertaken to investigate the hysteresis behaviour associated with bed-load sediment transport, mobilised under unsteady flows, as well as their underlying mechanisms (e.g., Gunsolus and Binns, 2018) in both field and laboratory studies (Plumb et al., 2020). Basic factors that have been suggested to influence the category of observed hysteresis with respect to bed load sediment transport in unsteady flows include: 1) boundary conditions such as the tempo-spatial availability of sediment in the river channel (e.g., Hassan et al., 2006; Humphries et al., 2012; Guney et al., 2013; Curran et al., 2015) and their distance to the sediment transport measurement station (e.g., Reid et al., 1985; Moog and Whiting, 1998; Mano et al., 2009; Mao et al., 2014); 2) fluvial bed conditions in terms of surface texture or structure (e.g., surface armouring, e.g., Kuhnle, 1992; Mao, 2018), bed sediment composition (e.g., quasi-uniform or heterogeneous sediment, e.g., Wang, 2016; Gunsolus and Binns, 2018), fractional hiding and exposure effects (e.g., Gaeuman, 2010), and bed morphological features or channel irregularities (e.g., William, 1989; Lee et al., 2004; Martin and Jerolmack, 2013; Reesink et al., 2013); and 3) unsteady flood flow conditions represented by flood hydrograph shape (Bombar et al., 2011), flood duration or unsteadiness (Graf and Qu, 2004; Lee et al., 2004; Hassan et al., 2006; Plumb et al., 2020), flood magnitude (e.g., Lee et al., 2004; Wang et al., 2015), antecedent flow conditions (e.g., Reid et al., 1985; Piedra et al., 2012; Guney et al., 2013; Mao et al., 2014), as well as the origin of runoff dynamics from snowmelt/glacier melting (e.g., Mao et al., 2014).
On the basis of a fuller understanding of above physical connections between various hysteresis and their origins, hysteresis in bed load sediment transport could potentially be used in the literature to infer the degree of sediment availability (Mao et al., 2014), bed-surface composition (e.g., Kuhnle, 1992), bed morphological adjustments (Gunsolus and Binns, 2018), flood history (e.g., Camporese et al., 2014; Mao et al., 2014), runoff generation at various scales (Spence, 2010) or sediment transport dynamics (Mao et al., 2014). Also, it is important to note that accounting for the hysteresis effects could lead to an overall improvement in the estimation of the bed load-flow regression, consequently defined as the bimodal rating curve or separate-limb method (Moog and Whiting, 1998; Waters and Curran, 2015). However, strictly speaking, within these studies, the bed load sediment transport rates generated during the rising and falling limbs of the hydrograph are only treated separately on a limb-dependent basis, implying the difference in sediment transport rates on both limbs has been recognised regardless of different hysteresis behaviour. This approach is appropriate in studies where a particular kind of hysteresis is encountered exclusively over a range of unsteady flow conditions [e.g. bed load transport followed counter-clockwise hysteresis exclusively in Lee et al. (2004)]. In fact, the correspondence between bed load transport rates at a given discharge on both hydrograph limbs will clearly be completely different when sediment transport exhibits clockwise and counterclockwise hysteresis. As such, the implications of different hysteretic loops on the estimation of sediment transport during unsteady hydrograph flows are still not fully understood or examined to date, especially for complex, graded bed load transport that features strong intergranular interactions (e.g., Ahanger et al., 2008; Wang, 2016; Mrokowska et al., 2018; Redolfi et al., 2018). Moreover, it can be anticipated that the critical flow conditions for the initial and final sediment motion on the rising and falling limbs of a hydrograph, respectively, are probably different (e.g., Gaeuman, 2010), rather than a constant discharge as usually assumed in previous research (e.g., Phillips et al., 2018). This also leads to an open question as how these hysteresis cycles are linked to variability in the incidence of sediment transport on the ascending and descending limbs throughout a hydrograph flow process. In order to better understand the importance of different hysteretic behaviour associated with graded bed load sediment transport induced within a wide range of unsteady flows, the current study investigates a series of single-peaked, symmetrical hydrographs that are generated in a tilting sediment bed flume system to facilitate quantitative determination of the bed load sediment transport hysteresis. Within these experiments, no additional sediment is supplied from upstream (or recirculated during the experiments) to ensure consistent boundary conditions are achieved at upstream inlet for the different unsteady hydrograph flows tested.
A series of unsteady hydrograph flows were generated with the primary aim of producing different hysteresis loops associated with bed load sediment transport. Previous studies have been shown that the magnitude, duration and shape of unsteady flow hydrographs have significant impact on the hysteresis modes observed in resulting bed load sediment transport (e.g., Poff et al., 1997; Guusolus and Binns, 2018; Mao, 2018). Therefore, the typical smoothed triangular hydrographs employed in the present study were quantified by using three basic parameters, namely: total water work Wk, unsteadiness ΓHG, and shape η (Graf and Suszka, 1985; Suszka, 1987; Yen and Lee, 1995; Lee et al., 2004; Bombar et al., 2011; Waters and Curran, 2015; Wang et al., 2015; 2019) that are expressed in the following forms,
where ub* is the bed shear velocity for the base flow conditions (prior to the hydrograph), Vol is the total water volume under the unsteady flow hydrograph (i.e., excluding the base flow condition), Hb is the initial base flow depth, B is the channel width, g is the gravitational acceleration, ΔH is the difference of water surface elevation for peak and base flows (i.e., ΔH = Hp−Hb), ΔT is the total hydrograph duration (i.e., ΔT = ΔTR + ΔTF), and ΔTR and ΔTF represent the duration of the rising and falling limbs, respectively. According to Wang et al. (2015), η = 1 (i.e., ΔTR = ΔTF) typically represent symmetrical hydrograph, while ratios η > 1 and η < 1 clearly represent asymmetrical hydrographs with relatively long rising (ΔTR > ΔTF) and falling (ΔTF > ΔTR) limb durations, respectively. It is noted here that the current study considers only symmetrical hydrographs, i.e., η = 1.0, with flow rates Q and flow gradients (dQ/dt) on the two limbs facilitating the quantitative determination of sediment transport hysteresis throughout the unsteady hydrograph flows.
In our study, the initiation of bed load motion and the general bed load sediment transport rates throughout the unsteady hydrograph flows could be determined by using the widely employed dimensionless reference shear stress approach, developed by Parker et al. (1982), which is written for fractional sediment transport in the following form:
Here, m and n are modified transport coefficients derived using nonlinear regression (Waters and Curran, 2015), τri* corresponds to a dimensionless reference transport rate for different size class (denoted by subscript i) that corresponds to
where qbi are fractional bed-load transport rates (kg·m−1·s−1), ρs and ρ are the sediment and fluid densities, respectively, and di denotes the average grain size within a particular size class in non-uniform sediment mixture.
Similarly, fractional sediment mass flux transported over the duration of the unsteady hydrograph can be represented by normalized total and fractional bed load yield parameters Wt* and Wti*, respectively (e.g. Bombar et al., 2011), such that
where Wti is fractional bed load mass transport (kg) collected in a sediment trap over the hydrograph duration, and b is the sediment trap width (<channel width B).
Hysteretic relations are commonly observed for well-known variables in natural system. Generally, quantitative indices are valuable tools to develop a classification of hysteretic patterns in the past decade (Zuecco et al., 2016). For example, Mao (2018) used the hysteresis index of Langlois et al. (2005) to analyze the temporal dynamics of liquid discharge and bed load sediment transport, this index is defined as the ratio of the area below the regression lines fitted with the rising and falling limb hydrograph data, which is particularly suited for sediment transport in symmetrical the hydrographs and could be formulated as
in which, Qmin, Qmax represent the minimum and maximum discharges that correspond to measurable sediment transport rates in each limb within a hydrograph, qbi,r, qbi,f are the bed load transport rates for a particular size class measured on rising and falling limb, respectively. Since the hysteresis index H is calculated as a ratio, a value of H ≈ 1.0 means a lack of hysteresis, H > 1.0 indicates clockwise hysteresis, and H < 1.0 indicates counterclockwise hysteresis (Mao, 2018). In nature, integrating the fractional bed load sediment rates along minimum and maximum flow is a representative of an overall sediment yield produced by either rising or falling limb. Here, the transport yield parameter
where W∗ti,r and W∗ti,f represent fractional, non-dimensional bed-load yields measured during the rising and falling hydrograph limbs, respectively. Comparatively, Eq. 8 is more convenient than Eq. 7 in practical application.
Our experiments are conducted in a 22 m-long, 0.75 m-wide and 0.5 m-deep flow-recirculating, tilting flume channel (see Figure 1) in the Environmental Hydraulics Laboratory at Heriot-Watt University. The flume set-up and experimental operation are the same as described in Wang et al. (2019). The changing flow conditions in the channel were controlled by a pump frequency inverter capable of adjusting pump speed and producing repeatable, smooth hydrographs (where flow rates vary continually with time, see Figure 2) of any desired shape, and with a peak discharge up to 100 L s−1. The unsteady hydrograph flows were monitored with a non-intrusive ultrasonic flow meter installed in the pipe delivering water to the channel inlet. A good match between prescribed design flows and the actual measured flows can be guaranteed by the sufficient measurement accuracy (±0.01 L s−1 typically), as well as minor statistical difference (i.e. 0.002 ± 0.28 L s−1).
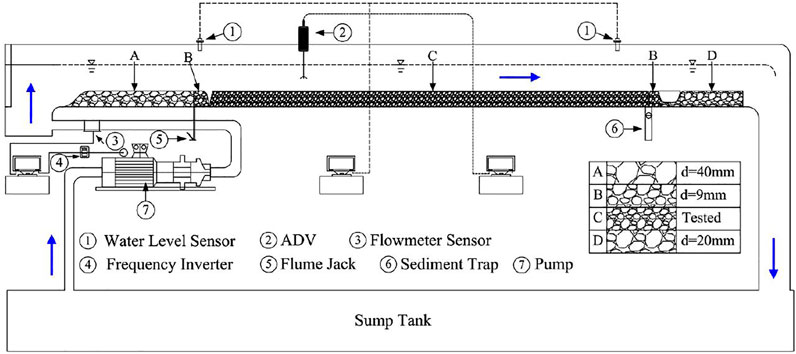
FIGURE 1. Schematic representation of flume channel and experimental set-up.
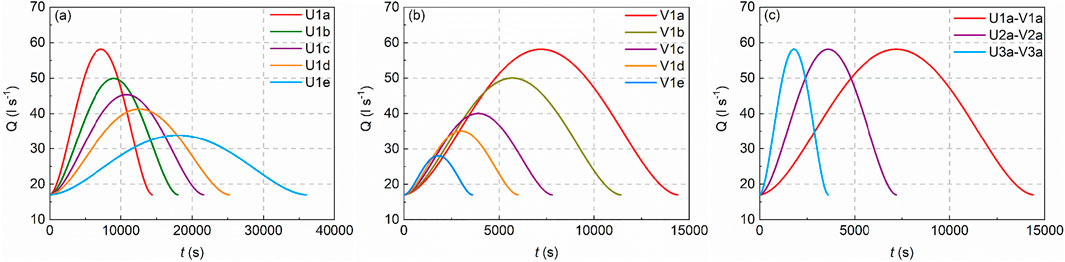
FIGURE 2. Design flow hydrographs with varying (A) unsteadiness ΓHG (group U1), (B) total water work Wk (group V1), and (C) unsteadiness ΓHG and total water work Wk (group UV).
The graded sediment mixture employed in our experiments exhibits a fine-grained particle size distribution (31% sand−69% gravel, see Figure 3). Owing to the stochastic nature of sediment transport, especially for different grain sizes in a graded sediment mixture mobilized by unsteady flows, the interpretation of individual fractional sediment transport can sometimes be misleading. Thus, in order to reduce the uncertainties associated with the stochastic nature of size-dependent bed load transport, and obtain reliable knowledge of the dynamic response of graded sediment to varying flow conditions, a size classification approach proposed by Kuhnle and Southard (1988) and Frey et al. (2003) is employed here, whereby the experimental graded sediment mixture is subdivided into three distinct size classes or groupings, termed fine, medium and coarse (i.e., denoted as F, M, C). Specifically in terms of grain sizes D, the fine sediment class was defined as D = 1.0–2.8 mm, the medium grain size class as D = 2.8–6.3 mm, and the coarse size class as D > 6.3 mm. Within the undisturbed design sediment mixture, the relative proportion (by sieved weight) of these fine F, medium M and coarse C size classes is approximately 44, 38, 18%, respectively.
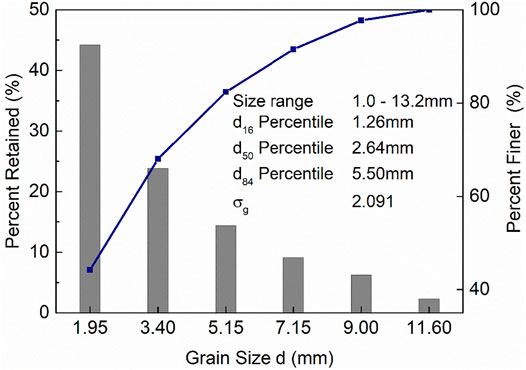
FIGURE 3. Grain size distribution and percentiles for graded sediment mixture tested in the current study (Wang et al., 2021).
It should be noted that no additional sediment was supplied at the flume inlet or recirculated in the channel system over the duration of each experimental run. As such, the current experiments represent the typical low or limited sediment feed conditions usually encountered in regulated river reaches (e.g., downstream of a dam or reservoir). This upstream boundary setup helps simplify the experimental procedure between different runs, as well as our interpretation of bed load sediment transport hysteresis that is generally known to vary with many external factors (e.g., sediment feed mode, flow conditions, sediment type and grading, and bed conditions), as mentioned earlier.
Flume experiments were performed with an initial longitudinal bed slope S0 of 0.002. At this slope, the base (antecedent) flow for Qb = 17.0 L s−1 and Hb = 0.059 m was found to satisfy sub- and near-threshold conditions, as critical Shields stress parameter τb,cr* for the fine F size class in the sediment mixture estimated to be τb* = ub*2/(γs−γ)gd50 = 0.037 with ub* = (gHb·S0)1/2 = 0.034 m s−1. By considering the sediment bed to be static and immobile during the base flow phase, the water surface slope Sf is approximately equivalent to bed slope S0 and, as such, the base flow is deemed to be a steady, uniform flow condition.
The experimental configurations and protocols are exactly the same as described in Wang et al. (2021). The flume was segmented into three sections, including an effective working length covered with a uniform bed layer of the fine-grained sediment mixture, whereas the remaining part in the upstream and downstream flume channel were artificially roughened to prevent local scour and ensure the turbulent boundary layer is fully developed in the erodible test bed section. Our experiments are initiated by introducing a very low flow (Q = 3.0 L s−1) into the channel to avoid any initial sediment bed disturbance and submerge the manually-placed sediment bed. The pump flow rate is then gradually increased to base flow condition Qb. The sediment bed was then worked by the unsteady hydrograph flow after being subject to a base (antecedent) flow over a short period of 15 min. During the hydrograph flow conditions, the transported bed load sediments are collected at regular intervals (e.g., 5–30 min depending on hydrograph duration and magnitude) within a sediment trap located towards the downstream end of the erodible bed section. In all runs, the number of sampling time intervals were set to be identical on both limbs of the symmetrical hydrographs.
Three groups of design flow hydrographs were simulated in the current study, with full details of these hydrographs reported in the earlier work of Wang et al. (2021). In this study, we focus specifically on the bed load transport hysteresis under symmetrical hydrograph flows, for which hydrograph U1/V1/U1a-V1a (highlighted in Table 1) serves as a benchmark for the design of other hydrograph flow conditions tested. Hence, flow hydrographs in groups V1 and U1 are generated either by varying total water work Wk or unsteadiness ΓHG (whilst holding the other parameter constant). In experimental group UV, both Wk and ΓHG are varied whilst retaining a constant peak flow Qp condition. The reduction in total hydrograph duration ΔT thus leads to the increase of ΓHG and decrease of Wk from hydrograph U1a-V1a to U3a-V3a (see Figure 2).
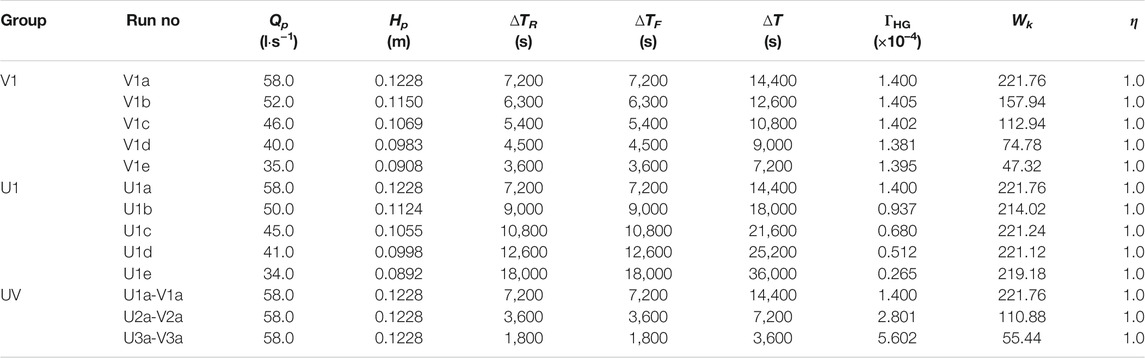
TABLE 1. Unsteady hydrograph flow conditions employed in the present study (Wang et al., 2021).
As previously stated, hysteresis behaviour is observed between flow parameters such as flow depth, velocity, and flow rate in unsteady flows (e.g., Graf and Qu, 2004). Moreover, the water surface slope Sf can vary with respect to the bed slope S0, Ghimire and Deng (2012) suggested that the following expression orignitated from the St Venant equations could be used to estimate the shear stress in unsteady flows,
where ρf is the fluid density, Rb is the hydraulic radius of the bed, β [ = 1/(BgH)] is a parameter related to the flood hydrograph slope with shear stress τb during the unsteady flow [in which B is the channel width and H is the flow depth], Q is the flow rate and t is the time. It is noted for the range of hydrographs considered in the present study, β = 1.11–2.31 m−3 s2 and dQ/dt = O (10–5−10–6) m3 s−2, indicating the additional shear stress exerted from flow gradient and hydrograph slope is relatively small, as such, Eq. 9 could be reduced to τb = ρfgRbSf for predicting shear stress.
In our experiments, we observed bed load sediment transport to have clockwise, no/mixed and counterclockwise hysteresis, with these different sediment hysteresis patterns particularly noticeable in experimental hydrograph group UV. More details on the temporal variations in fractional transport rates qb,i in groups V1 and U1 can be found in Wang et al. (2021). Here, the size-class-dependent bed load transport rates qb in this group UV are presented in Figures 4A–C for illustrative purposes. As expected, the temporal variations in measured bed load transport rates qb for three defined size classes are largely shown to increase and decrease during the rising and falling hydrograph limb, respectively. However, closer examination indicates that the three size classes C, M and F tend to attain their peak bed load transport rates qb,max at different time instants around the peak flow phase Qmax. Specifically, the coarse size class C attains its peak qb,max value at earlier elapsed times than the fine size class F, while the timing of peak qb,max for the medium size class coincides with either the coarse size class C (U3a-V3a, Figure 4C) or the fine size class F (U1a-V1a, Figure 4A), or is significantly earlier for hydrograph flow U2a-V2a (Figure 4B). It is also noted that the temporal lag between qb,max values appears to be consistent for the coarse C and fine F size classes, but varies for the medium M size class between hydrographs. This temporal lag effect was also found for fractional peak qb,max in a previous smaller scale study investigating the response of uni-modal and bimodal sediments to unsteady hydrograph flows under different experimental configurations (Wang et al., 2015).
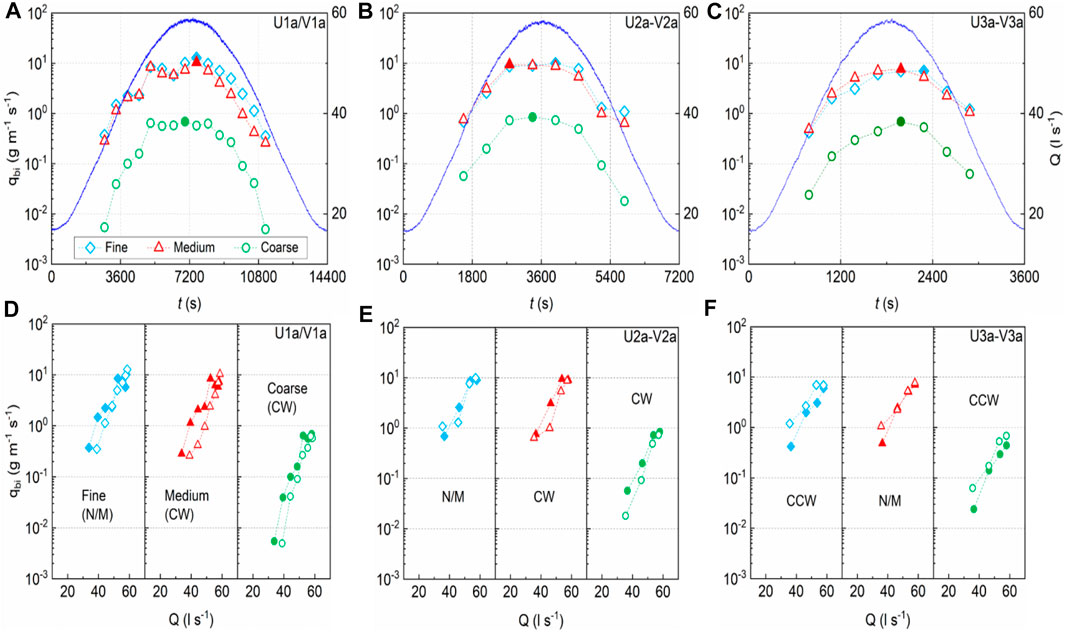
FIGURE 4. (A–C) Illustrative plots showing temporal variation in flow rate Q and fractional bed load transport rates qbi (for fine F, medium M and coarse C size classes), and (D–F) qbi:Q phase plots showing representative hysteresis patterns for hydrograph runs (A,D) U1a (V1a); (B,E) U2a-V2a and (C,F) U3a-V3a (see Table 1).
In addition to differential response of varying size classes to changing flows in terms of temporal lag effect between their peak bed load transport rates qb,max and peak flow Qmax, direct phase plot of fractional qbi rates versus flow Q provides a more holistic approach to identify and categorise particular hysteretic behaviour in bed load transport for each hydrograph flow condition tested. These plots, for the same experimental group UV runs, are presented in Figures 4D–F. In the majority of cases, the qb:Q phase plots reveal noticeable differences in the bed load sediment transport rates monitored during both hydrograph limbs, either in the form of clockwise (CW) or counterclockwise (CCW) loops. For runs where clear hysteresis is less evident, a no/mixed (N/M) hysteresis category is introduced to encompass all other hysteresis types [i.e., the single-valued, single-valued plus a loop and figure-8 shaped loop, see Wang et al. (2019)]. Moreover, it is apparent that coarse C and fine F size classes display contrasting hysteretic behaviour, with the coarse C size class presenting CW hysteresis in long-duration hydrographs U1a-V1a, U2a-V2a (Figures 4D,E) and CCW hysteresis in short-duration hydrograph U3a-V3a (Figure 4F). By contrast, the fine size F class varies from N/M to CCW hysteresis in hydrographs U1a-V1a → U3a-V3a (Figures 4D–F). This is, in essence, consistent with previously observed temporal lag effect of peak bed load transport rate qb,max for the coarse C and fine F size classes. By contrast, the hysteretic patterns of medium M size class is largely similar to coarse C size class in longer duration hydrographs, but unexpectedly demonstrates distinct N/M hysteresis for the shortest duration hydrograph (i.e., U3a-V3a, Figure 4F) in this study. Overall, it is noted that this size-dependent hysteretic behaviour agrees well with the fractional hysteretic response of bimodal bed load sediment to the symmetrical triangular and smooth hydrographs of Guney et al. (2013) and Wang et al. (2015), respectively.
As stated before, it has commonly been assumed that the critical flows for sediment motion are of equivalence on the rising and falling limbs of a hydrograph flow (e.g., Plumb et al., 2020). In fact, this assumption inherently violates the principle of hysteretic behaviour, particularly when considering clockwise and counterclockwise loops that have been reported extensively for bed load sediment transport in a wide range of single-peaked hydrograph flows including in the current study. In addition, it has been found from our earlier studies (e.g., Wang et al., 2019; 2021) that the difference between bed load transport rates on both limbs decreased with increasing flows, implying that the difference tends to be more pronounced during more rapidly-changing (low) flow conditions (i.e., where dQ/dt > 0 on the rising limb and dQ/dt < 0 on the falling limb) than either side of the peak flow condition (i.e. where dQ/dt ≈ 0). On this basis, it is informative to analyze the potential changes in threshold flow conditions that define the initiation and cessation of sediment motion during the rising and falling limbs, respectively.
Following the method of Parker et al. (1982), the reference shear stress τri* for the bed load incipient motion was defined as the shear stress that corresponds to a reference dimensionless bed load transport rate Wi* = 0.002. This is obtained by plotting Wi* for each size class (i.e., C, M and F) against their normalized shear stresses τi* and obtaining τri* from the best-fit regression at Wi* = 0.002. As such, the size-dependent reference shear stresses τri* on the rising and falling limbs of hydrographs in experimental group UV are graphically determined in Figure 5 and listed in Table 2. It is immediately apparent that the rising limb τri* values are smaller than their falling limb counterparts for the M and C size classes that display CW hysteresis (Figures 5A,B). However, this trend is reversed for the coarse C and fine F size classes displaying CCW hysteresis (Figure 5C). Even accounting for the sediment transport rates with N/M hysteresis, the values of τri* are shown to still vary significantly on both hydrograph limbs. This corroborates the hypothesis that this difference manifests itself in the different levels of stream power required at the thresholds for the initiation and cessation of sediment motion during the rising and falling hydrograph limbs, resepectively (Reid et al., 1985), as opposed to the common assumption of a fixed, critical shear stress condition on both limbs. Furthermore, the representative hysterestic patterns (and particularly the CW and CCW loops) appear to have strong association with the threshold flows associated with sediment mobilisation on the two hydrograph limbs. As bed load transport rates are generally higher on the rising limb than on the falling limb for CW hysteresis, this suggests that a lower shear stress condition is required to trigger sediment motion on the rising limb than the equivalent shear stress condition required for the cessation of sediment motion during the falling limb. The opposite is corrent for sediment transport with a CCW hysteresis, as a series of higher sediment transport rates are observed on the falling hydrograph limb compared to the rising limb (e.g., Figure 4C). By comparision, sediment transport with N/M hysteresis behaviour tends to result in greater variability in threshold shear stresses for sediment motion on both limbs. However, in nature, the generation of high (or low) critical flow conditions, whether during the rising or falling hydrograph limbs, also depends on the relative overall magnitude of bed load transport rates monitored on corresponding limbs, as indicated by CW and CCW hysteretic conditions.
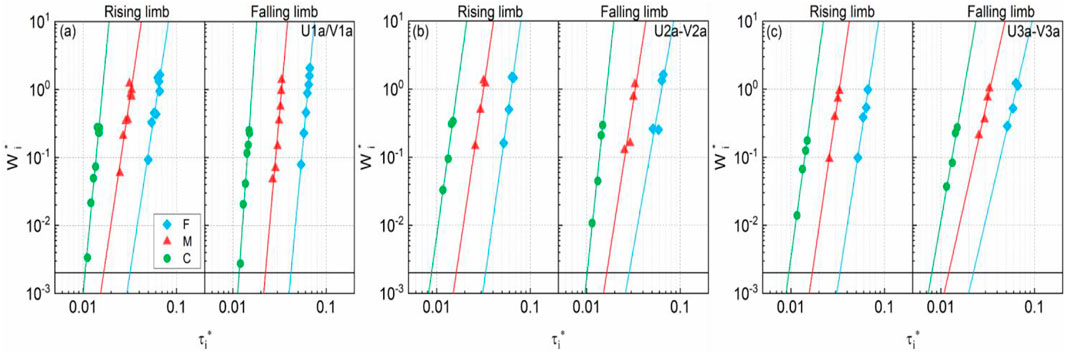
FIGURE 5. Illustrative examples showing the reference shear stress τri* for fine F, medium M and coarse C size classes on rising and falling limbs for representative hydrograph runs (A) U1a (V1a), (B) U2a-V2a, and (C) U3a-V3a (see Table 1) using threshold transport criterion Wi* = 0.002.
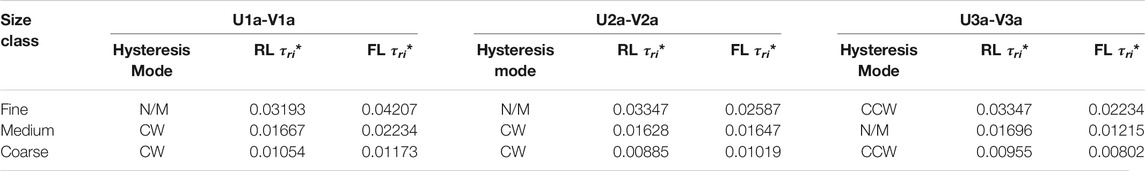
TABLE 2. Reference shear stress τri* obtained for fine F, medium M and coarse C size classes on rising limb (RL) and falling limb (FL) for the same experimental runs as shown in Figure 5.
It can also be detected by comparision of the τri* values from hydrograph run U1a-V1a to the equivalent values for hydrograph U3a-V3a (see details in Figure 5 and Table 2) that the fractional τri* values appear to reduce as both total water work Wk reduces and unsteadiness ΓHG increases, particularly on the falling hydrograph limbs. To obtain a comprehensive view of these dependencies, all fractional τri* values are plotted against the total water work to unsteadiness ratio Wk/ΓHG for each hydrograph condition in Figure 6, illustrated separately for both limbs. (Note: a high and low Wk/ΓHG value in experimental group UV corresponds to hydrograph runs U1a-V1a and U3a-V3a, respectively). It is important to note that the fractional reference shear stresses τri* are computed for size class dependent sediment transport measured separately in each run, instead of being derived from the overall, rising and falling limb bed load transport datasets, combined from all runs as previously presented in Wang et al. (2021). This separate treatment of run-dependent transport data should provide greater detail and facilitate improved interpretation of the impact of hysteresis on limb-depedent sediment threshold motion within unsteady hydrograph flows.
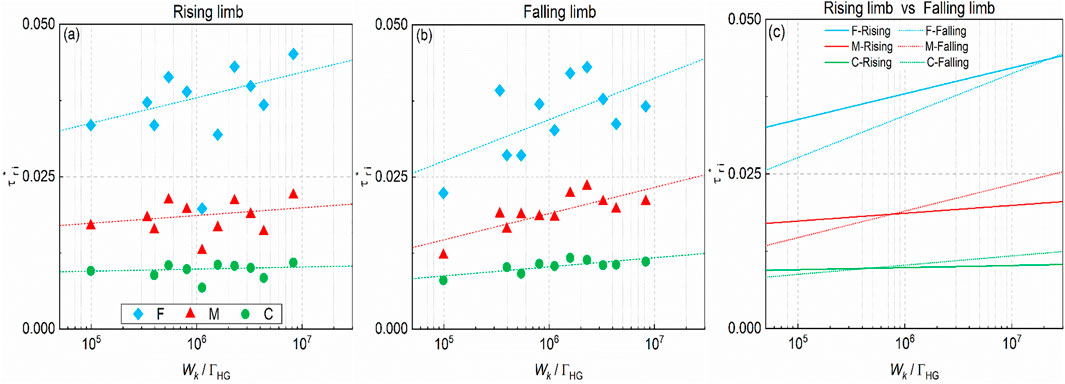
FIGURE 6. Dimensionless reference shear stresses for fine F, medium M and coarse C size classes, grouped by rising (A) and falling limbs (B) and their fitted trend curves taken together (C) in all symmetrical hydrograph flows with varying Wk/ΓHG values. Note: bed load transport rates measured over rising limb in run V1b is an outlier and excluded for best-fit regression (This outlier is attributable to an exceptional, unstable bed surface that leads to substantial sediment mobilisation at the beginning of this run).
It is evident that the fractional reference shear stress τri* values tend to increase by a varying extent when a combined hydrograph descriptor Wk/ΓHG was increased (see Figure 6). This may arise due to a gradual reduction in the sediment response to slower changing flows with reducing unsteadiness ΓHG (i.e. ΓHG = 5.6 × 10⁻⁴ → 0.265 × 10⁻⁴ for runs U3a-V3a → U1e, see Table 1). This effect is invoked by the limited sediment supply condition and becomes more evident for the initial and final sediment grain motion during longer duration hydrographs with higher Wk/ΓHG values (i.e. ΔT = 3600 → 36000 s for runs U3a-V3a → U1e, see Table 1). It is also shown that the initial motion of grains from the coarse C size class are less sensitive to the different accelerating hydrograph flows (see Figure 6A). This is due to the general exposure of coarse C particles at bed surface, making them more responsive to flow changes at the beginning of each run (as indicated by the lower τri* values in Figure 6A). By contrast, the reference shear stress τri* for fine F size class are generally much higher and tend to change significantly on both limbs when the ratio Wk/ΓHG is varied (see Figures 6A,B). This higher magnitude and variability in τri* values for the fine F size class is obtained mainly due to sheltering or hiding effects (i.e. the transport of fine sediment is suppressed significantly by the presence of coarse grains, especially when these coarse particles readily come to rest on the bed in a long-lasting receding flow limb and form static structural matrix as an impediment for fine sediment motion). Note: the small proportion of coarse C grains in the design sediment mixture, along with the no upstream sediment feed condition, results in a rapid depletion in the coarse sediment transport during the flow-sediment interactions. This consequently increases the τri* value of the final motion of coarse sediment transport during the long falling flow limb, compared to the equivalent τri* value for the initiation of motion on the rising limb. For the medium M sized grains, the variability in τri* with Wk/ΓHG appears to lie between fine F and coarse C sediment size classes on both limbs, as shown in Figures 6A,B.
We can synthesize the effects of sediment transport hysteresis on the size-dependent reference shear stress τri* through plotting all fractional, limb-dependent best fit lines in Figure 6C. Over the range of Wk/ΓHG values tested in the study, we observe a greater increase of fractional τri* values on the falling limbs with increasing Wk/ΓHG, compared to on the rising limbs. More importantly, it has been found that the CW and N/M hysteresis modes characterise predominantly the transport of the coarse C size class in the current hydrograph flows (Wang et al., 2021), as indicative of higher bed load transport rates of coarse sediment taking place during the rising limb compared to the falling limb. Thus, the critical flow condition required to initiate coarse sediment motion on rising limb is relatively small, while higher reference stresses τri* were obtained primarily on falling limb when the hydrograph Wk/ΓHG ratio increases (i.e., Wk/ΓHG > 5.0 × 10⁵ for coarse sediment motion, Figure 5C). By contrast, the transport of fine F particles, that primarily featured displayed CCW and N/M hysteresis (Wang et al., 2021), means that higher bed load transport rates were obtained during the falling limb compared to on the rising limb. As such, this typically resulted in higher τri* values being obtained on the rising hydrograph limb over the range of Wk/ΓHG values studied. Clearly, the relative magnitudes of the τri* values identified for the three size classes C, M and F on both limbs are largely consistent with their respective temporal lag effects and hysteresis modes discussed earlier. In addition, the hydrograph Wk/ΓHG values that correspond to equivalence in the τri* values on both limbs appear to increase with decreasing grain size (i.e. C → M → F sediment size classes, see Figure 6C). The marginal difference in τri* values for the coarse C sediment transport on both limbs over the full range of Wk/ΓHG values considered in the study is shown to correspond to a similar variation in τri* values for the medium M size class, but over a much narrower Wk/ΓHG range (Wk/ΓHG = 3 × 10⁵–2 × 10⁶, Figure 6C).
The hysteretic implication of bed load transport on the initial and final sediment motion represented by reference shear stress derived on both limbs is graphically demonstrated in Figure 7. Here, a corresponding ratio ψri is given to measure the magnitude of reference shear stress obtained on both limbs (i.e., ψri = τri,r*/τri,f*, see Figure 7A). As previously stated, it is generally shown that fine F size class ratio ψri > 1 for most hydrograph runs, meaning that τri,r* > τri,f* in most cases. By contrast, the opposite situation, i.e. ψri < 1, is again found for coarse C size class transport, with τri,r* < τri,f* in most cases. More interestingly, a significant implication of the size-dependent sediment transport hysteresis is shown on the relative magnitude of corresponding reference shear stress used to define the thresholds of sediment motion of each size class on two limbs. It is apparent from Figure 7B that the cases with ψri > 1.0 and ψri < 1.0 correlate well with CCW and CW hysteresis, respectively, and are primarily attributed to sediment transport of the fine F and coarse C size class in the present study. By contrast, the cases in which ψri ≈ 1.0 correspond well with fractional sediment transport with N/M hysteresis patterns that typically resulted from fine F and medium M size classes.
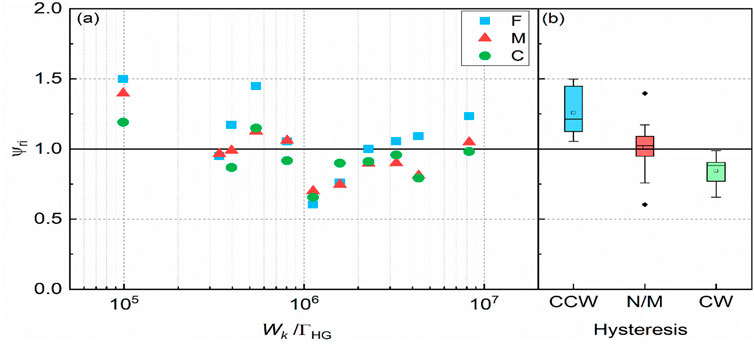
FIGURE 7. Summary of (A) fractional stress threshold-motion ratio ψri values for all symmetrical hydrographs for fine F, medium M and coarse C size classes, and (B) corresponding hysteretic modes compiled separately on the basis of bed load rates qbi under CW, N/M and CCW hysteresis behaviour.
As stated previously, there is often a time lag between the arrival of peak bed load rates qb,max for the different grain size classes during the passage of a hydrograph. Again, bed load transport hysteresis reveals an overall, differential response of a particular size class in a graded sediment bed to the increasing and decreasing flow phases in a hydrograph. As such, Eq. 8 is proposed to quantitively describe the hysteresis of bed load sediment transport within a symmetrical hydrograph. According to Eq. 8, the variability in bed load yield ratio ψti for the coarse C, medium M and fine F size classes under experimental flow groupings V1 and U1 are presented in Figure 8. This figure indicates that there is little or no clear correlation between ψti and either hydrograph unsteadiness ΓHG (Figure 8A) or total water work Wk (Figure 8B). However, further comparison between size class dependent ψti values shows that, in the majority of hydrograph runs, the hierarchy of the magnitude of ψti values is coarse C size class ψti > medium M size class ψti > fine F size class ψti. This, again, substantiates a more preferential response of the coarse C grains to changing flow over the rising limb of the simulated flood event, as partially reflected by an earlier appearance of peak transport rate qbi for coarse C size class, compared to the fine F size class. Moreover, total water work Wk appears to display some degree of control on the difference of ψti values among the three size classes, with differences shown to be comparatively subtle [i.e., Δψti = max (ψti)−min (ψti) = 0.191] when Wk is very low (i.e., Wk = 47.32 for hydrograph V1e, Table 1). It also results in a far more complex variation in the individual ψti values for three size classes in experimental group UV, as evidenced by the total water work in hydrograph U3a-V3a (i.e., Wk = 55.44) which is only a quarter of the Wk value (i.e., Wk = 221.76) in hydrograph U1a-V1a, while the variation in ψti values only reduce by a quarter (i.e., Δψti = 0.40 → 0.310) over this range.
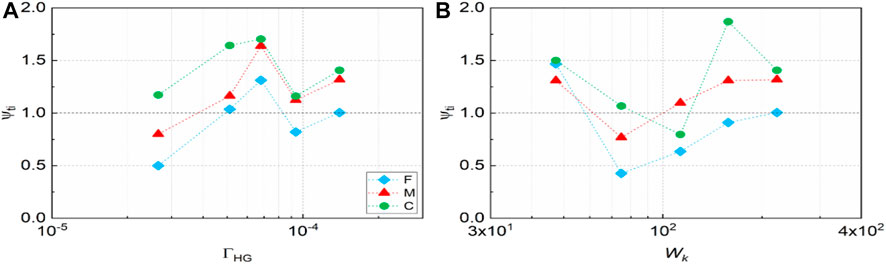
FIGURE 8. Bed load yield ratios ψti for fine F, medium M and coarse C size classes obtained plotted in (A) ΓHG-varying (i.e., group U1, Table 1) and (B) Wk-varying (i.e., group V1, Table 1) hydrograph flows.
Our earlier tests using quasi-uniform sediments (Wang et al., 2019), indicated that the variation of the bed load yield ratio ψt with the combined hydrograph parameter Wk/ΓHG follows a Boltzmann-type function. Therefore, all fractional ψti values with corresponding Wk/ΓHG ratios are compiled along with sediment transport hysteresis patterns and presented in Figure 9. Again, while there is no explicit dependence of the fractional bed load yield ratio ψti on the hydrograph parameter Wk/ΓHG, a consistent hierarchy is found between fine F, medium M, and coarse C size class for symmetrical hydrographs with Wk/ΓHG > 106 (i.e., for hydrographs with relatively large Wk and/or relatively small ΓHG values). Within these hydrographs, with relatively low peak flows and long durations, it is suggested that the slowly-evolving flow conditions allow sufficient time for the varying grain sizes to adapt their transport rates under the bed limited sediment supply condition. As such, the temporal differences in the response of varying grain sizes to these slowly-changing hydrograph flows become more apparent and their hysteresis modes are more readily identified.
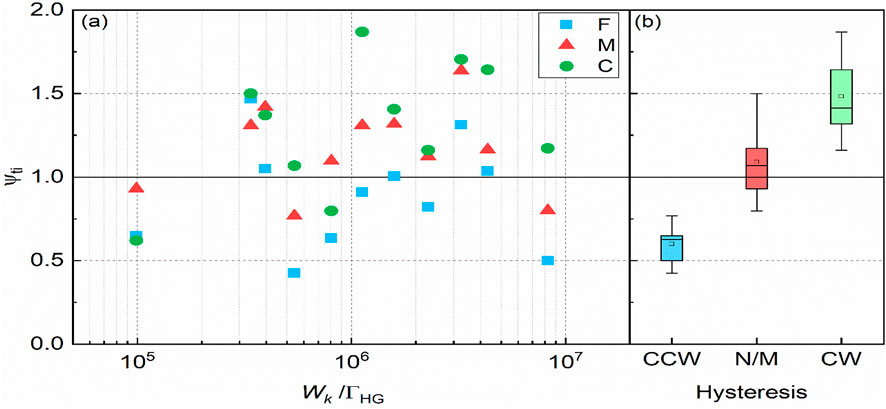
FIGURE 9. Summary of (A) fractional bed load yield ratios ψti in all symmetrical hydrographs for fine F, medium M and coarse C size classes, and (B) corresponding hysteretic mode compiled on the basis of their bed-load rates qbi under CW, N/M and CCW hysteresis behavior.
Furthermore, it is informative to apply the size-class dependent bed load yield ratios ψti to characterise the basic hysteresis modes, as defined for the transport of the three size classes C, M and F in this study. In this regard, Figure 9B is plotted to illustrate the fractional bed load transport datasets with CW, N/M, and CCW hysteresis, along with their corresponding ψti values. It is immediately apparent that the ψti values are largely hysteresis interlinked, as expected. Specifically, the overall magnitude of ψti values in the data showing CW and CCW hysteresis are much larger and smaller than unity, respectively, while the ψti values in the data showing N/M hysteresis are closer to unity whilst exhibiting some overlap with those in CW hysteresis data. This indicates, by definition, good correspondence is expected between CW and CCW hysteresis patterns and bed load yield ratio ψti values for symmetrical hydrograph flows, while our interpretation of the inter-relationship between N/M hysteresis data and their corresponding ψti values is more complicated by the fluctuations of ψti values that overlap with other hysteretic modes of bed load transport.
Our studies have demonstrated the linkage of size-dependent sediment transport hysteresis with their threshold motion deduced from limb-grouped transport data and corresponding ratio ψri values. On the other hand, bed load yield ratios ψti, comparing the bed load transport masses accumulated during both hydrograph limbs, can also be used as a good indicator to quantify the hysteresis of bed load sediment transport in symmetrical hydrographs, as described above. Considering the fact that bed load sediment transport hysteresis patterns are closely interconnected with both ratios of threshold stresses ψri and bed load yields ψti during the rising and falling hydrograph limbs (see Figures 7, 9), it is reasonable to expect some form of functional relationship to exist between ψri and ψti that is determined by the relative fractional sediment transport characteristics arising within the individual hydrograph limbs. In this regard, the plot of threshold stress ratio ψri against bed load yield ratio ψti is shown in Figure 10, as expected, a power relationship can be established between these transport properties through regression analysis, such that
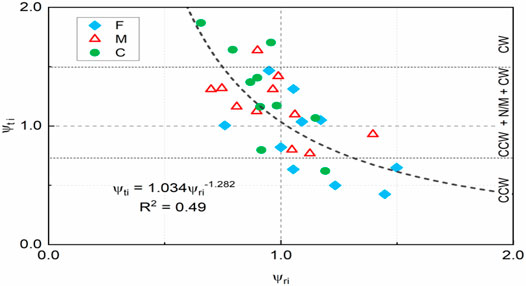
FIGURE 10. Ratio of dimensionless reference shear stress for fine F, medium M and coarse C size classes in the rising limb over its counterpart in the falling limb (ψri) plotted as a function of the corresponding ratios defined for size-specific bed load yields (ψti).
It is shown from size class dependent datasets presented in Figure 10 (and from Eq. 10 above) that the ratios ψti and ψri are inversely correlated (R2 = 0.49). This again corroborates our earlier finding that a smaller reference shear stress for the threshold motion of bed load sediment transport, either on the rising or falling limb, usually corresponds to cases characterised by larger sediment yields transported on that same limb during the passage of symmetrical hydrographs. Specifically, as in the case of sediment transport in significant CW hysteresis, the bed-load yields generated during rising limbs are much larger than those collected during falling limbs, with the reference shear stress for sediment initial motion on the rising limb obviously smaller than its corresponding value for sediment final motion on falling limb. This type of behaviour is mainly reflected in the transport of coarse C and medium M sediment size classes. By contrast, for the case of sediment transport with strong CCW hysteresis, bed load yields produced on the rising limb is much lower, while the reference shear stress for sediment motion on this limb is relatively large. This bed load transport scenario is primarily evidenced in the transport of the fine F sediment size class. Further, the bed load yields ratio ψti generally decreases with an increase in the threshold stress ratio ψri in CW → CCW hysteretic transitions in bed load transport, also shown in Figure 10. As such, it could be useful to employ Eq. 10 in the prediction of limb-dependent sediment transport properties in unsteady hydrograph flows.
For graded sediment transport in symmetrical hydrographs, Eq. 10 can potentially be used to estimate bed load yields and sediment threshold motion during both hydrograph limbs. It is also important to consider the prediction of sediment transport rates during hydrograph flows using existing transport models. As introduced previously, Waters and Curran (2015) employed Eq. 4 to assess the non-dimensional sediment transport rates for entire datasets over the whole hydrograph, as well as limb-separated datasets. Here, we employed this method to quantify and analyse the graded sediment transport rates measured during our experiments. For the entire datasets, the best fit curve for graded sediment transport data is plotted in Figure 11A, along with similar curve given by Waters and Curran (2015) according to their measured bulk sediment transport rates under stepped hydrograph flows. It is shown that, for a given high W*i value in our datasets, the Waters and Curran (2015) curve tends to underestimate the specific Shields stress ratio τi*/τri*. This appears somewhat associated with the higher reference stresses τri* for bed load transport under incremental steady flows within the stepped hydrograph case [e.g., τri* = 0.055–0.080 for sand fraction within the 70–30% sand-gravel mixture of Waters and Curran (2015)] than those obtained in the present study of continuously varying flows (e.g., τri* = 0.020–0.045 for the sand-gravel mixture in Figure 3). This implies that graded sediments are more likely to be entrained under smooth hydrograph flows than under stepped flow conditions. Figure 11B also plots the twin power curves using the separate-limb based method, outlined by Waters and Curran (2015), which provides a fairly good fit to the limb-specific transport rates, compared to considering the overall bulk transport data (e.g., Figure 11A), as indicated by the correlation coefficients listed in Table 3. From a process-based perspective, the separate-limb method is shown to have the merit of accounting for differences in the sediment transport rates during rising and falling limb of unsteady hydrograph flows, when compared to the bulk method (see Figures 11A,B).
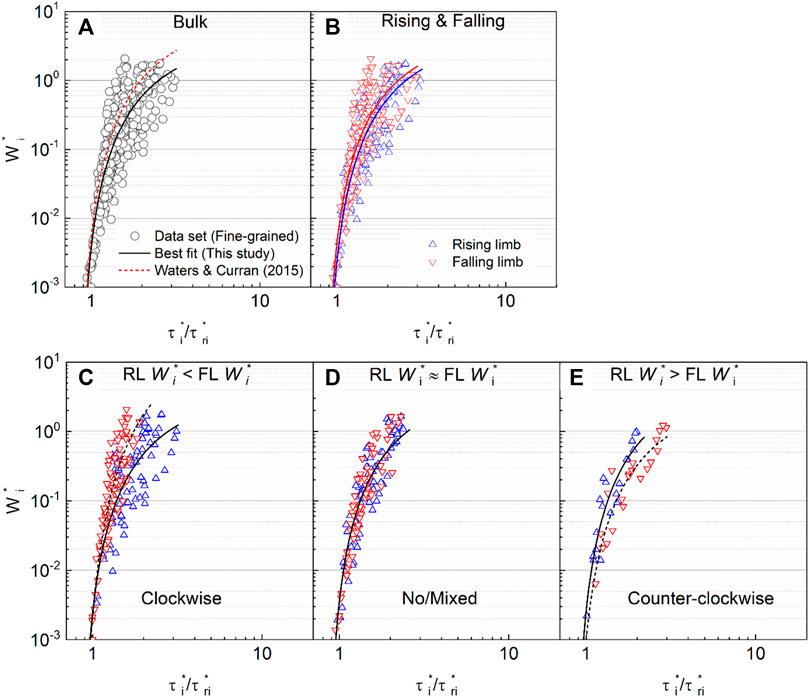
FIGURE 11. Functional relationship between dimensionless bed load transport Wi* and Shields stress ratio τi*/τri* developed for (A) bulk transport dataset (i.e., represented by black solid and dashed line), (B) separate-limb dataset (i.e., all transport data on separate rising and falling limbs), (C) datasets where rising-limb (RL) W*i values < falling-limb (FL) W*i values (i.e., all transport data for CW hysteresis), (D) datasets where rising-limb (RL) W*i values ≈ falling-limb (FL) W*i values (i.e. all transport data with N/M hysteresis), and (E) rising-limb (RL) W*i values > falling-limb (FL) W*i values (i.e. all transport data with CCW hysteresis).
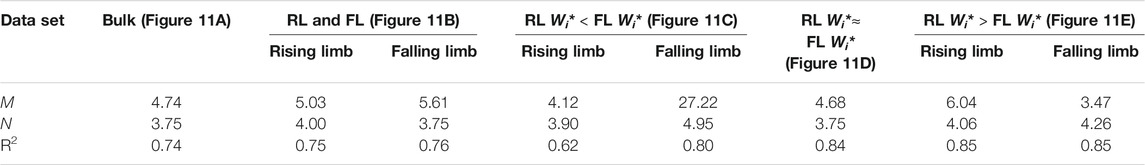
TABLE 3. Values of parameters m, n and the correlation coefficient R2 for the best-fit curve when applying Eq. 4 to standard bulk and limb-separated datasets (i.e., Figures 11A,B) and our hysteretic mode-separated datasets (Figures 11C–E), in which sediment transport hysteresis modes are also taken into account (Note: RL for rising limb; FL for falling limb).
However, these best-fit curves for bed load transport in the separate limbs are shown to have only marginal difference, caused by 1) relatively low bed load transport intensities for the graded sediment mixture tested under the range of hydrograph flow conditions (i.e., with most W*i < 1.0), when compared with quasi-uniform sediment transport experiments by Wang (2016) and by Waters and Curran (2015), and 2) bed load transport with CW, N/M and CCW hysteresis for fine F, medium M and coarse C size classes in the graded sediment bed, when taken together, mask the differential response of size-class dependent sediment transport to accelerating and decelerating flows on both hydrograph limbs. The hysteresis patterns, particularly in CW and CCW modes, are primarily responsible for the overall difference between all bed load transport rates on the rising and falling limbs. This suggests that prediction of bed load transport during unsteady, symmetrical hydrograph flows could be improved by considering fully the flow characteristics (i.e. rising and falling limbs specified in separated method), as well as the bed load transport hysteretic properties (i.e. CW, N/M and CCW hysteresis). On this basis, bed load sediment transport rates displaying either CW, N/M and CCW hysteresis during the rising-to-falling hydrograph limbs are fitted separately with power curves and plotted in Figures 11C–E. It is generally shown that the correlation coefficients (R2 values, Table 3) for the fitted curves are reasonably increased if they also account for bed load transport hysteresis when applying the separate-limb method, under the following criteria: 1) case I - Rising-limb W*i < falling-limb W*i for CW bed load transport hysteresis employing separate-limb method (Figure 11C); and 2) case II - Rising-limb W*i > falling-limb W*i for CCW bed load transport hysteresis employing separate-limb method (Figure 11E). However, for case III where Rising-limb W*i ≈ falling-limb W*i in N/M bed load transport hysteresis, it is still recommended to use the bulk method (Figure 11D).
The hydrograph flows simulated in the present flume experiments are all symmetrical (i.e., η = 1.0) with smooth triangular shaped profile (Figure 2). Under these unsteady flow boundary conditions, the bed load yield ratio ψti is shown to be successful in describing bed-load sediment transport hysteresis modes (i.e., ψti > 1.0 for CW hysteresis; ψti ≈ 1.0 for N/M hysteresis; and ψti < 1.0 for CCW hysteresis). However, natural hydrographs are commonly non-symmetrical with shorter duration rising limbs, meaning that bed load yield ratios ψti should be adjusted accordingly to quantify the hysteresis based on the hydrograph shape alone, such as considering cases where ψti > η, ψti ≈ η, and ψti < η, as indicative of CW, N/M and CCW hysteresis, respectively, for sediment transport under non-symmetrical hydrographs. Alternatively, those indexes already developed to characterise hysteresis for suspended sediment transport in flood hydrographs could also be considered when studying hysteretic behaviour in bed load sediment transport, such as Eq. 7 proposed by Langlois et al. (2005) for suspended sediment and more recently employed by Mao (2018) to study bed load transport.
It has been specified in our study that no sediment is supplied from the upstream flume inlet over the duration of the experiment. This prescribed sediment boundary condition is typically representative of managed river channels, usually encountered in river reaches immediately downstream of dams or reservoirs, where longitudinal flow and sediment connectivity were disrupted (Cao et al., 2016; Li et al., 2018). As the magnitude of sediment transport in our experiment is relatively low, and the bed scour/erosion occurs primarily at the upstream end of the channel test section, the in-channel bed sediment supply from upstream compensates for the loss of bed sediments from more downstream sections, adjacent to the sediment trap. Nevertheless, it is shown that CW hysteresis is predominant characterizing feature of the observed bed load transport in our study (see Figure 11C) due to the lack of an upstream sediment supply. This effect has also been verified by previous related studies with zero upstream sediment feed (e.g., Hassan et al., 2006), while the impact of varying the sediment supply boundary condition (from limited to unlimited supply) on the resulting bed load transport hysteresis, more details can be found in other similar studies (e.g., Guney et al., 2013; Mao et al., 2014).
Our experimental study is undertaken to fully reveal the significant implications of hysteretic patterns on bed load sediment transport in terms of limb-dependent stress thresholds, size-dependent sediment transport rates and bed load yields that are generated by symmetrical hydrograph flows under a zero upstream sediment feed condition. Based on this study, the following conclusions can be drawn:
Typical clockwise (CW), no/mixed (N/M) and counter-clockwise (CCW) hysteresis modes are found to characterise graded (sand-gravel) bed load sediment transport in a series of symmetrical smooth triangular shaped hydrograph flows within the present study. The bed load transport hysteresis mode is found to be strongly dependent on the grain size class and hydrograph flow duration. Coarse C (gravel) sized sediment generally exhibits CW and N/M hysteresis, while fine F (sand) sized sediments usually displays N/M or CCW hysteresis, with medium M sized sediments varying in between. It is also shown that the dominant hysteresis mode generally changes from CW to CCW hysteresis as the hydrograph flow duration is decreased.
These hysteretic modes also have important implications for sediment threshold motion, as quantified by the reference bed shear stress. Due to the existence of hysteresis modes, especially CW and CCW modes, it is found that the reference shear stress (or critical flow rate) for the initiation and termination of sediment motion on both limbs is not likely to be identical in most experimental runs. This difference in limb-dependent reference shear stresses becomes significant for the fine F size class, while appearing to reduce for the coarse C size class. Moreover, the reference shear stress for coarse C sediment grains is generally smaller on the rising limb due to their relative exposure at the bed surface, responding preferentially to the changing (increasing) flow conditions (CW hysteresis), whereas fine sediment grains tend to obtain lower reference shear stress on the falling limb due to their delayed active response during receding flow conditions on the falling limb (CCW hysteresis).
These hysteretic modes also imply the existence of difference in size-dependent sediment transport rates on both limbs, especially those with CW and CCW hysteresis, as manifested through low bed load transport on both limbs. For this reason, a separate (or bimodal) limb method appears to perform well in predicting sediment transport rates generated during each limb in symmetric hydrograph flows compared to using a bulk method with the entire transport data. However, we believe that the hysteresis modes should be incorporated into the separate-limb method through which the relative magnitude of bed load transport rates measured during both limbs could be well identified, particularly for CW and CCW transport hysteresis modes (meaning the separate-limb or bimodal method should be considered individually for CW and CCW transport hysteresis modes), whereas the bulk method seems to perform reasonably well for the N/M bed load transport hysteresis.
Both bed load yield and stress threshold ratios (i.e. ψti and ψri) are developed to quantify the relative magnitude of bed load yields and reference shear stresses on both limbs of symmetrical hydrographs. As coarse C and fine F sediment transport in these hydrographs is generally characterised by CW (and N/M) and CCW hysteretic behaviour, respectively, the bed load yield ratio ψti values for coarse C sediments are generally larger than for the fine F sediments. By contrast, the threshold stress ratio ψri values for coarse C sediments are usually lower than for the fine F sediments. As such, bed load yield ψti and threshold stress ψri ratios are shown to be inversely correlated and follow a general power law (as expressed by Eq. 10), demonstrating a reasonable level of correlation.
The original contributions presented in the study are included in the article/Supplementary Materials, further inquiries can be directed to the corresponding authors.
LW: Conceptualisation, Methodology, Formal Analysis, Investigation, Writing – Original Draft; DW: Conceptualisation, Writing, Revision; AC: Conceptualisation, Writing – Original Draft, Project Administration, Supervision; DZ: Suggestions, Writing – Original Draft; GP: Conceptualisation, Supervision.
This work was supported financially by National Natural Science Foundation of China (Grants No. 52009041), the Project of International Cooperation and Exchanges NSFC (Grant No. 52061135104), the Fundamental Research Funds for the Central Universities (Grant No. 2020MS024), and the Scientific Program of China Institute of Water Resources and Hydropower Research (Grant No. SE 110145B0022021).
The authors declare that the research was conducted in the absence of any commercial or financial relationships that could be construed as a potential conflict of interest.
All claims expressed in this article are solely those of the authors and do not necessarily represent those of their affiliated organizations, or those of the publisher, the editors, and the reviewers. Any product that may be evaluated in this article, or claim that may be made by its manufacturer, is not guaranteed or endorsed by the publisher.
Ahanger, M. A., Asawa, G. L., and Lone, M. A. (2008). Experimental Study of Sediment Transport Hysteresis. J. Hydraulic Res. 46 (5), 628–635. doi:10.3826/jhr.2008.3185
Aich, V., Zimmermann, A., and Elsenbeer, H. (2014). Quantification and Interpretation of Suspended-Sediment Discharge Hysteresis Patterns: How Much Data Do We Need? Catena 122, 120–129. doi:10.1016/j.catena.2014.06.020
American Society of Civil Engineers (2008). Sedimentation Engineering Manuals and Reports on Engineering Practice 110.
Bombar, G., Elçi, Ş., Tayfur, G., Güney, M. Ş., and Bor, A. (2011). Experimental and Numerical Investigation of Bed-Load Transport under Unsteady Flows. J. Hydraul. Eng. 137 (10), 1276–1282. doi:10.1061/(ASCE)HY.1943-7900.0000412
Camporese, M., Penna, D., Borga, M., and Paniconi, C. (2014). A Field and Modeling Study of Nonlinear Storage-Discharge Dynamics for an Alpine Headwater Catchment. Water Resour. Res. 50 (2), 806–822. doi:10.1002/2013WR013604
Cao, Z.-x., Hu, P., Pender, G., and Liu, H.-h. (2016). Non-capacity Transport of Non-uniform Bed Load Sediment in Alluvial Rivers. J. Mt. Sci. 13 (3), 377–396. doi:10.1007/s11629-015-3710-8
Curran, J. C., Waters, K. A., and Cannatelli, K. M. (2015). Real Time Measurements of Sediment Transport and Bed Morphology during Channel Altering Flow and Sediment Transport Events. Geomorphology 244, 169–179. doi:10.1016/j.geomorph.2015.03.009
Einstein, H. A. (1942). Formulas for the Transportation of Bed Load. T. Am. Soc. Civ. Eng. 107 (1), 561–577. doi:10.1061/taceat.0005468
Frey, P., Ducottet, C., and Jay, J. (2003). Fluctuations of Bed Load Solid Discharge and Grain Size Distribution on Steep Slopes with Image Analysis. Experiments in Fluids 35 (6), 589–597. doi:10.1007/s00348-003-0707-9
Gaeuman, D., Andrews, E. D., Krause, A., and Smith, W. (2009). Predicting Fractional Bed Load Transport Rates: Application of the Wilcock-Crowe Equations to a Regulated Gravel Bed River. Water Resour. Res. 45 (6). doi:10.1029/2008WR007320
Gaeuman, D. (2010). “Mechanics of Bedload Rating Curve Shifts and Bedload Hysteresis in the Trinity River, California,” in Proceedings of the 9th Federal Interagency Sedimentation Conference (Nev: Las Vegas).
Ghimire, B., and Deng, Z. Q. (2012). Event Flow Hydrograph–Based Method for Modeling Sediment Transport. J. Hydrol. Eng. 18 (8), 919–928. doi:10.1061/(ASCE)HE.1943-5584.0000710
Graf, W. H., and Qu, Z. (2004). Flood Hydrographs in Open Channels. Proc. Inst. Civil Eng. - Water Manag. 157 (1), 45–52. doi:10.1680/wama.2004.157.1.45
Graf, W. H., and Suszka, L. (1985). “Unsteady Flow and its Effect on Sediment Transport,” in Proc. 21st IAHR Congress (Mel-bourne, Australia, 1–5.
Guney, M. S., Bombar, G., and Aksoy, A. O. (2013). Experimental Study of the Coarse Surface Development Effect on the Bimodal Bed-Load Transport under Unsteady Flow Conditions. J. Hydraul. Eng. 139 (1), 12–21. doi:10.1061/(asce)hy.1943-7900.0000640
Gunsolus, E. H., and Binns, A. D. (2018). Effect of Morphologic and Hydraulic Factors on Hysteresis of Sediment Transport Rates in Alluvial Streams. River Res. Applic 34 (2), 183–192. doi:10.1002/rra.3184
Hassan, M. A., Egozi, R., and Parker, G. (2006). Experiments on the Effect of Hydrograph Characteristics on Vertical Grain Sorting in Gravel Bed Rivers. Water Resour. Res. 42 (9), 1–15. doi:10.1029/2005WR004707
Humphries, R., Venditti, J. G., Sklar, L. S., and Wooster, J. K. (2012). Experimental Evidence for the Effect of Hydrographs on Sediment Pulse Dynamics in Gravel-Bedded Rivers. Water Resour. Res. 48, W01533. doi:10.1029/2011WR010419
Kuhnle, R. A. (1992). Bed Load Transport during Rising and Falling Stages on Two Small Streams. Earth Surf. Process. Landforms 17 (2), 191–197. doi:10.1002/esp.3290170206
Kuhnle, R. A., and Southard, J. B. (1988). Bed Load Transport Fluctuations in a Gravel Bed Laboratory Channel. Water Resour. Res. 24 (2), 247–260. doi:10.1029/WR024i002p00247
Langlois, J. L., Johnson, D. W., and Mehuys, G. R. (2005). Suspended Sediment Dynamics Associated with Snowmelt Runoff in a Small Mountain Stream of Lake Tahoe (Nevada). Hydrol. Process. 19 (18), 3569–3580. doi:10.1002/hyp.5844
Lee, K. T., Liu, Y.-L., and Cheng, K.-H. (2004). Experimental Investigation of Bedload Transport Processes under Unsteady Flow Conditions. Hydrol. Process. 18 (13), 2439–2454. doi:10.1002/hyp.1473
Li, Z., Qian, H., Cao, Z., Liu, H., Pender, G., and Hu, P. (2018). Enhanced Bed Load Sediment Transport by Unsteady Flows in a Degrading Channel. Int. J. Sediment Res. 33 (3), 327–339. doi:10.1016/j.ijsrc.2018.03.002
Mano, V., Nemery, J., Belleudy, P., and Poirel, A. (2009). Assessment of Suspended Sediment Transport in Four alpine Watersheds (France): Influence of the Climatic Regime. Hydrol. Process. 23 (5), 777–792. doi:10.1002/hyp.7178
Mao, L., Dell'Agnese, A., Huincache, C., Penna, D., Engel, M., Niedrist, G., et al. (2014). Bedload Hysteresis in a Glacier-Fed Mountain River. Earth Surf. Process. Landforms 39 (7), 964–976. doi:10.1002/esp.3563
Mao, L. (2018). The Effects of Flood History on Sediment Transport in Gravel-Bed Rivers. Geomorphology 322, 196–205. doi:10.1016/j.geomorph.2018.08.046
Martin, R. L., and Jerolmack, D. J. (2013). Origin of Hysteresis in Bed Form Response to Unsteady Flows. Water Resour. Res. 49 (3), 1314–1333. doi:10.1002/wrcr.20093
Moog, D. B., and Whiting, P. J. (1998). Annual Hysteresis in Bed Load Rating Curves. Water Resour. Res. 34 (9), 2393–2399. doi:10.1029/98wr01658
Mrokowska, M. M., Rowiński, P. M., Książek, L., Strużyński, A., Wyrębek, M., and Radecki-Pawlik, A. (2018). Laboratory Studies on Bedload Transport under Unsteady Flow Conditions. J. Hydrol. Hydromech. 66 (1), 23–31. doi:10.1515/johh-2017-0032
Parker, G., Klingeman, P. C., and McLean, D. G. (198219837). Bedload and Size Distribution in Paved Gravel-Bed Streams. J. Hydr. Div. 108109 (4), 5445–5571. doi:10.1061/(ASCE)0733-942910.1061/jyceaj.0005854
Phillips, C. B., Hill, K. M., Paola, C., Singer, M. B., and Jerolmack, D. J. (2018). Effect of Flood Hydrograph Duration, Magnitude, and Shape on Bed Load Transport Dynamics. Geophys. Res. Lett. 45 (16), 8264–8271. doi:10.1029/2018GL078976
Phillips, J. D. (2003). Sources of Nonlinearity and Complexity in Geomorphic Systems. Prog. Phys. Geogr. Earth Environ. 27 (1), 1–23. doi:10.1191/0309133303pp340ra
Piedra, M. M., Haynes, H., and Hoey, T. B. (2012). The Spatial Distribution of Coarse Surface Grains and the Stability of Gravel River Beds. Sedimentology 59 (3), 1014–1029. doi:10.1111/j.1365-3091.2011.01290.x
Plumb, B. D., Juez, C., Annable, W. K., McKie, C. W., and Franca, M. J. (2020). The Impact of Hydrograph Variability and Frequency on Sediment Transport Dynamics in a Gravel‐bed Flume. Earth Surf. Process. Landforms 45 (4), 816–830. doi:10.1002/esp.4770
Poff, N. L., Allan, J. D., Bain, M. B., Karr, J. R., Prestegaard, K. L., Richter, B. D., et al. (1997). The Natural Flow Regime. BioScience 47 (11), 769–784. doi:10.2307/1313099
Redolfi, M., Bertoldi, W., Tubino, M., and Welber, M. (2018). Bed Load Variability and Morphology of Gravel Bed Rivers Subject to Unsteady Flow: A Laboratory Investigation. Water Resour. Res. 54 (2), 842–862. doi:10.1002/2017WR021143
Reesink, A., Parsons, D., Ashworth, P., Hardy, R., Best, J., Unsworth, C., et al. (2013). The Response and Hysteresis of Alluvial Dunes under Transient Flow Conditions. Mar. River Dunes 2013, Conf. Proc. 220, 215.
Reid, I., Frostick, L. E., and Layman, J. T. (1985). The Incidence and Nature of Bedload Transport during Flood Flows in Coarse-Grained Alluvial Channels. Earth Surf. Process. Landforms 10 (1), 33–44. doi:10.1002/esp.3290100107
Spence, C. (2010). A Paradigm Shift in Hydrology: Storage Thresholds across Scales Influence Catchment Runoff Generation. Geogr. Compass 4 (7), 819–833. doi:10.1111/j.1749-8198.2010.00341.x
Vericat, D., Batalla, R. J., and Garcia, C. (2006). Breakup and Reestablishment of the armour Layer in a Large Gravel-Bed River below Dams: The Lower Ebro. Geomorphology 76, 122–136. doi:10.1016/j.geomorph.2005.10.005
Wang, L. (2016). Bedlaod Sediment Transport and Bed Evolution in Steady and Unsteady Flows. Edinburgh: Heriot-Watt University.
Wang, L., Cuthbertson, A. J. S., Pender, G., and Cao, Z. (2015). Experimental Investigations of Graded Sediment Transport under Unsteady Flow Hydrographs. Int. J. Sediment Res. 30 (4), 306–320. doi:10.1016/j.ijsrc.2015.03.010
Wang, L., Cuthbertson, A. J. S., Zhang, S. H., Pender, G., Shu, A. P., and Wang, Y. Q. (2021). Graded Bed Load Transport in Sediment Supply Limited Channels under Unsteady Flow Hydrographs. J. Hydrol. 595, 126015. doi:10.1016/j.jhydrol.2021.126015
Wang, L., Cuthbertson, A., Pender, G., and Zhong, D. (2019). Bed Load Sediment Transport and Morphological Evolution in a Degrading Uniform Sediment Channel under Unsteady Flow Hydrographs. Water Resour. Res. 55, 5431–5452. doi:10.1029/2018WR024413
Waters, K. A., and Curran, J. C. (2015). Linking Bed Morphology Changes of Two Sediment Mixtures to Sediment Transport Predictions in Unsteady Flows. Water Resour. Res. 51 (4), 2724–2741. doi:10.1002/2014WR016083
Williams, G. P. (1989). Sediment Concentration versus Water Discharge during Single Hydrologic Events in Rivers. J. Hydrol. 111 (1-4), 89–106. doi:10.1016/0022-1694(89)90254-0
Yen, C.-I., and Lee, K. T. (1995). Bed Topography and Sediment Sorting in Channel bend with Unsteady Flow. J. Hydraulic Eng. 121 (8), 591–599. doi:10.1061/(ASCE)0733-9429(1995)121:8(591)
Keywords: hysteresis, bed load sediment, incipient motion, bed-load yield, symmetrical hydrograph
Citation: Wang L, Wang D, Cuthbertson A, Zhong D and Pender G (2021) Hysteretic Implications for Graded Bed Load Sediment Transport in Symmetrical Hydrograph Flows. Front. Environ. Sci. 9:800832. doi: 10.3389/fenvs.2021.800832
Received: 24 October 2021; Accepted: 12 November 2021;
Published: 24 December 2021.
Edited by:
Jaan H. Pu, University of Bradford, United KingdomReviewed by:
Songdong Shao, Dongguan University of Technology, ChinaCopyright © 2021 Wang, Wang, Cuthbertson, Zhong and Pender. This is an open-access article distributed under the terms of the Creative Commons Attribution License (CC BY). The use, distribution or reproduction in other forums is permitted, provided the original author(s) and the copyright owner(s) are credited and that the original publication in this journal is cited, in accordance with accepted academic practice. No use, distribution or reproduction is permitted which does not comply with these terms.
*Correspondence: Alan Cuthbertson, YS5qLnMuY3V0aGJlcnRzb25AZHVuZGVlLmFjLnVr; Deyu Zhong, emhvbmdkeUB0c2luZ2h1YS5lZHUuY24=
Disclaimer: All claims expressed in this article are solely those of the authors and do not necessarily represent those of their affiliated organizations, or those of the publisher, the editors and the reviewers. Any product that may be evaluated in this article or claim that may be made by its manufacturer is not guaranteed or endorsed by the publisher.
Research integrity at Frontiers
Learn more about the work of our research integrity team to safeguard the quality of each article we publish.